Hidden Debt

Page 153

SOUT H A SI A ’ S ST A TE - OWNED ENTER P RISES

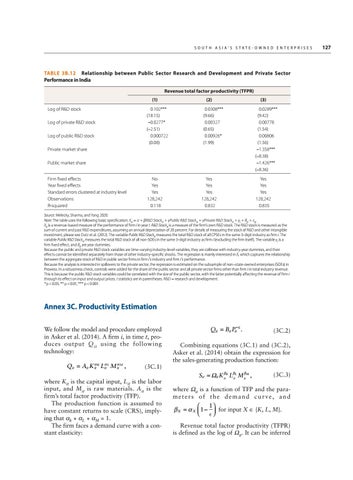
TABLE 3B.12  Relationship between Public Sector Research and Development and Private Sector Performance in India Revenue total factor productivity (TFPR) (1) Log of R&D stock Log of private R&D stock Log of public R&D stock

(2)

0.102*** (18.15) –0.0277* (–2.51) 0.000722 (0.08)

0.0308*** (9.66) 0.00327 (0.65) 0.00926* (1.99)

Private market share Public market share Firm fixed effects Year fixed effects Standard errors clustered at industry level Observations R-squared

No Yes Yes 128,242 0.118

Yes Yes Yes 128,242 0.832

(3) 0.0289*** (9.42) 0.00778 (1.54) 0.00806 (1.56) –1.358*** (–8.38) –1.426*** (–8.36) Yes Yes Yes 128,242 0.835

Source: Melecky, Sharma, and Yang 2020. Note: The table uses the following basic specification: Xit = α + βR&D Stock it + γPublic R&D Stock it + γPrivate R&D Stock it + γi + θ it + εit. Xit is a revenue-based measure of the performance of firm i in year t. R&D Stockit is a measure of the firm’s own R&D stock. The R&D stock is measured as the sum of current and past R&D expenditures, assuming an annual depreciation of 20 percent. For details of measuring the stock of R&D and other intangible investment, please see Dutz et al. (2012). The variable Public R&D Stockit measures the total R&D stock of all CPSEs in the same 3-digit industry as firm i. The variable Public R&D Stockit measures the total R&D stock of all non-SOEs in the same 3-digit industry as firm i (excluding the firm itself). The variable γi is a firm fixed effect, and θit are year dummies. Because the public and private R&D stock variables are time-varying industry-level variables, they are collinear with industry-year dummies, and their effects cannot be identified separately from those of other industry-specific shocks. The regression is mainly interested in δ, which captures the relationship between the aggregate stock of R&D in public sector firms in firm i’s industry and firm i’s performance. Because the analysis is interested in spillovers to the private sector, the regression is estimated on the subsample of non–state-owned enterprises (SOEs) in Prowess. In a robustness check, controls were added for the share of the public sector and all private sector firms other than firm i in total industry revenue. This is because the public R&D stock variables could be correlated with the size of the public sector, with the latter potentially affecting the revenue of firm i through its effect on input and output prices. t statistics are in parentheses. R&D = research and development. * p < 0.05, ** p < 0.01, *** p < 0.001.

Annex 3C. Productivity Estimation We follow the model and procedure employed in Asker et al. (2014). A firm i, in time t, produces output Q it using the following technology:

Qit = Ait K itα K Litα L M itα M , (3C.1)

where Kit is the capital input, Lit is the labor input, and Mit is raw materials. Ait is the firm’s total factor productivity (TFP). The production function is assumed to have constant returns to scale (CRS), implying that αk + αL + αM = 1. The firm faces a demand curve with a constant elasticity:

Qit = Bit Pit−∈. (3C.2)

Combining equations (3C.1) and (3C.2), Asker et al. (2014) obtain the expression for the sales-generating production function:

Sit = Ωit K itβK LβitL M itβM ,

(3C.3)

where Ωit is a function of TFP and the para­ meters of the demand curve, and 1  β X = α X  1 −  for input X ∈ {K, L, M}.   Revenue total factor productivity (TFPR) is defined as the log of Ωit. It can be inferred

127


Turn static files into dynamic content formats.

Create a flipbook

Articles inside

Notes

3min
page 192

Annex 4B. The Kalman Filter

3min
page 189

4.1 Recommendations for Improving Fiscal Reporting and Transparency in Pakistan

6min
pages 186-187

following Contingent Liability Shocks

3min
page 179

Debt, India

2min
page 175

Estimating Contingent Liability Shocks, Adjustment Costs, and Mitigating Factors Using Data for India

6min
pages 171-172

Assembly Elections

2min
page 180

Outcomes in South Asia

5min
pages 184-185

The Promise and Risks of Fiscal Decentralization in South Asia

1min
page 159

Notes

2min
page 154

Annex 3C. Productivity Estimation

3min
page 153

Only a Combination of Internal and External Policy Reforms Can Help Better Manage Contingent Liabilities from SOEs in South Asia

9min
pages 143-145

3.8 Share of Persistently Distressed Firms in India, 1991–2017

2min
page 135

Describing the Opaque and Complex SOE Sector in South Asia Using Data

6min
pages 129-130

Pakistan, and Sri Lanka, 2005–17

12min
pages 138-141

The Importance of Paying More Attention to the Hidden Liabilities of SOEs in South Asia

11min
pages 125-128

Annex 2A. Methodology for Determining Bank Distress

6min
pages 107-108

2.1 Main Findings of the Overall Analysis

3min
page 102

Analyzing the Effect of Firms’ Banking with SOCBs Compared with Private Banks

3min
page 101

Private Banks Adjust in Times of Distress

8min
pages 98-100

Commercial Banks, 2009–18

2min
page 93

Understanding Bank Distress and Its Main Factors

3min
page 92

2.3 India: Branch Networks and Total Credit, 2018

5min
pages 87-88

The Upsides and Downsides of State-Owned Commercial Banks

4min
pages 83-84

Annex 1D. Imputing the Missing Values for Predictions

2min
page 75

Improving Government Capacity, Due Diligence, and Contract Design to Better Manage the Fiscal Risks of the Growing PPP Programs in South Asia

2min
page 70

in India, 2001–17

2min
page 57

South Asia, by Country, 1990–2018

2min
page 63

1.5 Distribution of the Percentage of Contract Period Elapsed, 1990–2018

5min
pages 58-59

Features of Contract Design That Matter: Exploring the Link between PPP Contract Design and Early Terminations of Highway PPPs in India

3min
page 68

Government from Contingent Liabilities of Public-Private Partnerships

3min
page 64

Portfolio in South Asia, as a Percentage of GDP, 2020–24

2min
page 65

ES.1 Applying the Purpose, Incentives, Transparency, and Accountability (PITA) Recommendations in Fragile and Conflict-Affected Contexts ...................xvi 1.1 The Hidden Debt of National Highways in India

3min
page 53

O.2 Analytical Framework: Links from Distress to Adjustments to Impacts

9min
pages 32-34

The Need to Carefully Manage the Fiscal and Economic Risks of PPPs

5min
pages 49-50

Balancing the Efficiency Gains from PPPs against Their Risks and Liabilities Booming Infrastructure PPPs, Their Country and Sector Distribution, and Signs

6min
pages 51-52

Policy Recommendations

8min
pages 43-45

O.1 Implementing the High-Level Policy Recommendations for Public-Private Partnerships, State-Owned Commercial Banks, State-Owned Enterprises, and Subnational Governments

4min
page 46

O.9 Checks and Balances on Government Executives Help Prevent Distress of Public-Private Partnerships

2min
page 42

Notes

3min
page 47

Analytical Framework

2min
page 31
Issuu converts static files into: digital portfolios, online yearbooks, online catalogs, digital photo albums and more. Sign up and create your flipbook.