T H E C H A N G I N G W E A LTH O F N ATIO N S 2021
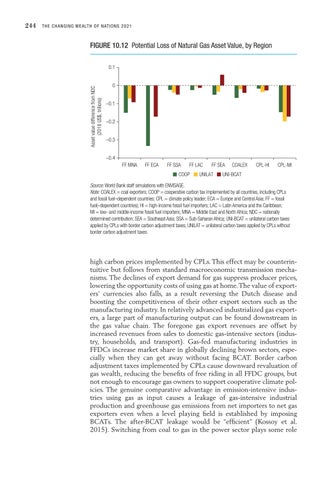
FIGURE 10.12 Potential Loss of Natural Gas Asset Value, by Region 0.1
Asset value difference from NDC (2018 US$, trillions)
244
0 –0.1 –0.2 –0.3 –0.4 FF MNA
FF ECA
FF SSA
FF LAC
COOP
FF SEA
UNILAT
COALEX
CPL-HI
CPL-MI
UNI-BCAT
Source: World Bank staff simulations with ENVISAGE. Note: COALEX = coal exporters; COOP = cooperative carbon tax implemented by all countries, including CPLs and fossil fuel–dependent countries; CPL = climate policy leader; ECA = Europe and Central Asia; FF = fossil fuel(–dependent countries); HI = high-income fossil fuel importers; LAC = Latin America and the Caribbean; MI = low- and middle-income fossil fuel importers; MNA = Middle East and North Africa; NDC = nationally determined contribution; SEA = Southeast Asia; SSA = Sub-Saharan Africa; UNI-BCAT = unilateral carbon taxes applied by CPLs with border carbon adjustment taxes; UNILAT = unilateral carbon taxes applied by CPLs without border carbon adjustment taxes.
high carbon prices implemented by CPLs. This effect may be counterintuitive but follows from standard macroeconomic transmission mechanisms. The declines of export demand for gas suppress producer prices, lowering the opportunity costs of using gas at home. The value of exporters’ currencies also falls, as a result reversing the Dutch disease and boosting the c ompetitiveness of their other export sectors such as the manufacturing industry. In relatively advanced industrialized gas exporters, a large part of manufacturing output can be found downstream in the gas value chain. The foregone gas export revenues are offset by increased revenues from sales to domestic gas-intensive sectors (industry, households, and transport). Gas-fed manufacturing industries in FFDCs increase market share in globally declining brown sectors, especially when they can get away without facing BCAT. Border carbon adjustment taxes implemented by CPLs cause downward revaluation of gas wealth, reducing the benefits of free riding in all FFDC groups, but not enough to encourage gas owners to support cooperative climate policies. The genuine comparative advantage in emission-intensive industries using gas as input causes a leakage of gas-intensive industrial production and greenhouse gas emissions from net importers to net gas exporters even when a level playing field is established by imposing BCATs. The after-BCAT leakage would be “efficient” (Kossoy et al. 2015). Switching from coal to gas in the power sector plays some role

