CH AP TER 10: LO W-C AR B ON TR ANSITION AND INTER NATIONAL C OOPER ATION
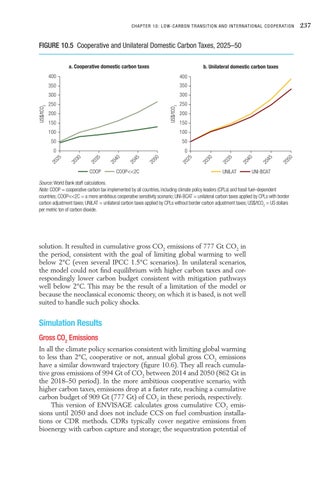
FIGURE 10.5 Cooperative and Unilateral Domestic Carbon Taxes, 2025–50 b. Unilateral domestic carbon taxes 400
350
350
300
300
250
250 200
COOP<<2C
UNILAT
20 50
20 25
20
20
20
20
20
20
COOP
50
0
45
0
40
50
35
100
50
30
100
20 45
150
20 40
150
20 35
200
20 30
US$/tCO2
400
25
US$/tCO2
a. Cooperative domestic carbon taxes
UNI-BCAT
Source: World Bank staff calculations. Note: COOP = cooperative carbon tax implemented by all countries, including climate policy leaders (CPLs) and fossil fuel–dependent countries; COOP<<2C = a more ambitious cooperative sensitivity scenario; UNI-BCAT = unilateral carbon taxes applied by CPLs with border carbon adjustment taxes; UNILAT = unilateral carbon taxes applied by CPLs without border carbon adjustment taxes; US$/tCO2 = US dollars per metric ton of carbon dioxide.
solution. It resulted in cumulative gross CO2 emissions of 777 Gt CO2 in the period, consistent with the goal of limiting global warming to well below 2°C (even several IPCC 1.5°C scenarios). In unilateral scenarios, the model could not find equilibrium with higher carbon taxes and correspondingly lower carbon budget consistent with mitigation pathways well below 2°C. This may be the result of a limitation of the model or because the neoclassical economic theory, on which it is based, is not well suited to handle such policy shocks.
Simulation Results Gross CO2 Emissions In all the climate policy scenarios consistent with limiting global warming to less than 2°C, cooperative or not, annual global gross CO2 emissions have a similar downward trajectory (figure 10.6). They all reach cumulative gross emissions of 994 Gt of CO2 between 2014 and 2050 (862 Gt in the 2018–50 period). In the more ambitious cooperative scenario, with higher carbon taxes, emissions drop at a faster rate, reaching a cumulative carbon budget of 909 Gt (777 Gt) of CO2 in these periods, respectively. This version of ENVISAGE calculates gross cumulative CO2 emissions until 2050 and does not include CCS on fuel combustion installations or CDR methods. CDRs typically cover negative emissions from bioenergy with carbon capture and storage; the sequestration potential of
237

