T H E C H A N G I N G W E A LTH O F N ATIO N S 2021
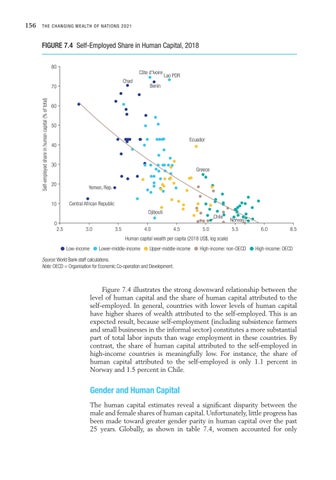
FIGURE 7.4 Self-Employed Share in Human Capital, 2018 80
Côte d'Ivoire Chad
70 Self-employed share in human capital (% of total)
156
Lao PDR
Benin
60
50 Ecuador
40
30
20
10
Greece Yemen, Rep. Central African Republic Djibouti
0 2.5
3.0
3.5
4.0
Chile 4.5
5.0
Norway 5.5
6.0
6.5
Human capital wealth per capita (2018 US$, log scale) Low-income
Lower-middle-income
Upper-middle-income
High-income: non-OECD
High-income: OECD
Source: World Bank staff calculations. Note: OECD = Organisation for Economic Co-operation and Development.
Figure 7.4 illustrates the strong downward relationship between the level of human capital and the share of human capital attributed to the self-employed. In general, countries with lower levels of human capital have higher shares of wealth attributed to the self-employed. This is an expected result, because self-employment (including subsistence farmers and small businesses in the informal sector) constitutes a more substantial part of total labor inputs than wage employment in these countries. By contrast, the share of human capital attributed to the self-employed in high-income countries is meaningfully low. For instance, the share of human capital attributed to the self-employed is only 1.1 percent in Norway and 1.5 percent in Chile.
Gender and Human Capital The human capital estimates reveal a significant disparity between the male and female shares of human capital. Unfortunately, little progress has been made toward greater gender parity in human capital over the past 25 years. Globally, as shown in table 7.4, women accounted for only

