Data Description and Empirical Results l 233
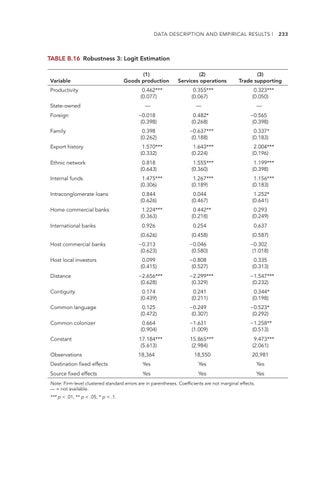
TABLE B.16 Robustness 3: Logit Estimation
Variable Productivity State-owned
(1) Goods production 0.462*** (0.077)
(2) Services operations 0.355*** (0.067)
(3) Trade supporting 0.323*** (0.050)
—
—
—
Foreign
−0.018 (0.398)
0.482* (0.268)
−0.565 (0.398)
Family
0.398 (0.262)
−0.637*** (0.188)
0.337* (0.183)
Export history
1.570*** (0.332)
1.643*** (0.224)
2.004*** (0.196)
Ethnic network
0.818 (0.643)
1.555*** (0.360)
1.199*** (0.398)
Internal funds
1.475*** (0.306)
1.267*** (0.189)
1.156*** (0.183)
Intraconglomerate loans
0.844 (0.626)
0.044 (0.467)
1.252* (0.641)
Home commercial banks
1.224*** (0.363)
0.442** (0.218)
0.293 (0.249)
International banks Host commercial banks Host local investors Distance
0.926
0.254
0.637
(0.626)
(0.458)
(0.587)
−0.313 (0.623)
−0.046 (0.580)
−0.302 (1.018)
0.099 (0.415)
−0.808 (0.527)
0.335 (0.313)
−2.656*** (0.628)
−2.299*** (0.329)
−1.547*** (0.232)
Contiguity
0.174 (0.439)
0.241 (0.211)
0.344* (0.198)
Common language
0.125 (0.472)
−0.249 (0.307)
−0.523* (0.292)
Common colonizer
0.664 (0.904)
−1.631 (1.009)
−1.258** (0.513)
Constant
17.184*** (5.613)
15.865*** (2.984)
Observations
18,364
18,550
9.473*** (2.061) 20,981
Destination fixed effects
Yes
Yes
Yes
Source fixed effects
Yes
Yes
Yes
Note: Firm-level clustered standard errors are in parentheses. Coefficients are not marginal effects. — = not available. *** p < .01, ** p < .05, * p < .1.
