160 l REGIONAL INVESTMENT PIONEERS IN SOUTH ASIA
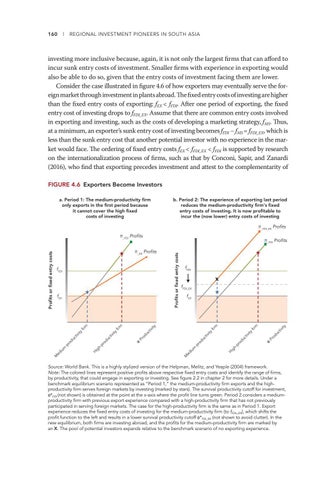
investing more inclusive because, again, it is not only the largest firms that can afford to incur sunk entry costs of investment. Smaller firms with experience in exporting would also be able to do so, given that the entry costs of investment facing them are lower. Consider the case illustrated in figure 4.6 of how exporters may eventually serve the foreign market through investment in plants abroad. The fixed entry costs of investing are higher than the fixed entry costs of exporting: fEX < fFDI. After one period of exporting, the fixed entry cost of investing drops to fFDI_EX. Assume that there are common entry costs involved in exporting and investing, such as the costs of developing a marketing strategy, fMS. Thus, at a minimum, an exporter’s sunk entry cost of investing becomes fFDI − fMS = fFDI_EX, which is less than the sunk entry cost that another potential investor with no experience in the market would face. The ordering of fixed entry costs fEX < fFDI_EX < fFDI is supported by research on the internationalization process of firms, such as that by Conconi, Sapir, and Zanardi (2016), who find that exporting precedes investment and attest to the complementarity of FIGURE 4.6 Exporters Become Investors a. Period 1: The medium-productivity firm only exports in the first period because it cannot cover the high fixed costs of investing
b. Period 2: The experience of exporting last period reduces the medium-productivity firm’s fixed entry costs of investing. It is now profitable to incur the (now lower) entry costs of investing π_FDI_EX Profits
ity tiv Pr od Ф
uc od pr ig h-
um M
ed i
uc
ity tiv
tiv du c ro -p
pr ig hH
fir m
fir ity
ct iv Pr od u Ф
ity tiv uc od
fEX
ity
fir m
fir ity tiv du c ro -p um ed i M
fFDI_EX
H
fEX
fFDI
m
fFDI
Profits or fixed entry costs
π_FDI Profits
π_EX Profits
m
Profits or fixed entry costs
π_FDI Profits
Source: World Bank. This is a highly stylized version of the Helpman, Melitz, and Yeaple (2004) framework. Note: The colored lines represent positive profits above respective fixed entry costs and identify the range of firms, by productivity, that could engage in exporting or investing. See figure 2.2 in chapter 2 for more details. Under a benchmark equilibrium scenario represented as “Period 1,” the medium-productivity firm exports and the highproductivity firm serves foreign markets by investing (marked by stars). The survival productivity cutoff for investment, ϕ*FDI (not shown) is obtained at the point at the x-axis where the profit line turns green. Period 2 considers a mediumproductivity firm with previous export experience compared with a high-productivity firm that has not previously participated in serving foreign markets. The case for the high-productivity firm is the same as in Period 1. Export experience reduces the fixed entry costs of investing for the medium-productivity firm (to fFDI_EX), which shifts the profit function to the left and results in a lower survival productivity cutoff ϕ*FDI_EX (not shown to avoid clutter). In the new equilibrium, both firms are investing abroad, and the profits for the medium-productivity firm are marked by an X. The pool of potential investors expands relative to the benchmark scenario of no exporting experience.
