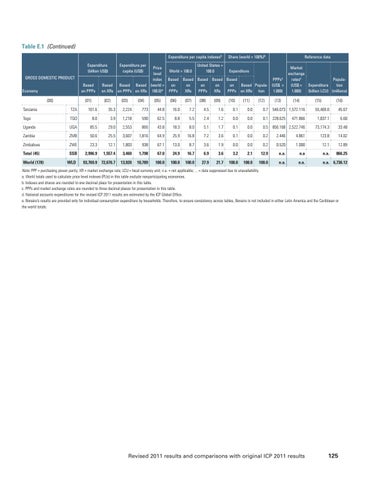
Table E.1 (Continued) Expenditure per capita indexesb Expenditure (billion US$)
Expenditure per capita (US$)
GROSS DOMESTIC PRODUCT Economy
(00)
Based on PPPs
Based on XRs
(01)
(02)
Share (world = 100%)b
Reference data
United States = 100.0
Price Market World = 100.0 Expenditure level exchange index Based Based Based Based Based PPPsc ratesc PopulaBased Based (world = on on on on on Based Popula- (US$ = (US$ = Expenditure tion on PPPs on XRs 100.0)a PPPs XRs PPPs XRs PPPs on XRs tion 1.000) 1.000) (billion LCU) (millions)
(03)
(04)
(05)
(06)
(07)
(08)
(09)
(10)
(11)
(12)
(13)
(14)
(15)
Tanzania
TZA
101.6
35.3
2,224
773
44.8
16.0
7.2
4.5
1.6
0.1
0.0
0.7 546.073 1,572.116
Togo
TGO
8.0
3.9
1,218
590
62.5
8.8
5.5
2.4
1.2
0.0
0.0
0.1 228.625
Uganda
UGA
85.5
29.0
2,553
866
43.8
18.3
8.0
5.1
1.7
0.1
Zambia
ZMB
50.6
25.5
3,607
1,816
64.9
25.9
16.8
7.2
3.6
0.1
(16)
55,469.0
45.67
471.866
1,837.1
6.60
0.0
0.5 856.168 2,522.746
73,174.3
33.48
0.0
0.2
2.446
4.861
123.8
14.02
Zimbabwe
ZWE
23.3
12.1
1,803
938
67.1
13.0
8.7
3.6
1.9
0.0
0.0
0.2
0.520
1.000
12.1
12.89
Total (45)
SSB
2,996.9
1,557.4
3,460
1,798
67.0
24.9
16.7
6.9
3.6
3.2
2.1
12.9
n.a.
n.a
n.a.
866.25
93,769.9 72,676.7
13,920
10,789
100.0
100.0
100.0
27.9
21.7
100.0
100.0
100.0
n.a.
n.a.
n.a. 6,736.12
World (178)
WLD
Note: PPP = purchasing power parity; XR = market exchange rate; LCU = local currency unit; n.a. = not applicable; ... = data suppressed due to unavailability. a. World totals used to calculate price level indexes (PLIs) in this table exclude nonparticipating economies. b. Indexes and shares are rounded to one decimal place for presentation in this table. c. PPPs and market exchange rates are rounded to three decimal places for presentation in this table. d. National accounts expenditures for the revised ICP 2011 results are estimated by the ICP Global Office. e. Bonaire’s results are provided only for individual consumption expenditure by households. Therefore, to ensure consistency across tables, Bonaire is not included in either Latin America and the Caribbean or the world totals.
Revised 2011 results and comparisons with original ICP 2011 results
125