Exe c u tiv e S u mm ary
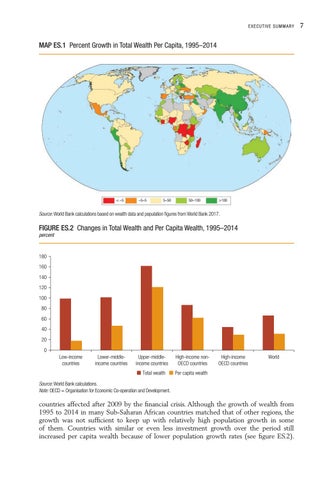
MAP ES.1 Percent Growth in Total Wealth Per Capita, 1995–2014
< –5
–5–5
5–50
50–100
>100
Source: World Bank calculations based on wealth data and population figures from World Bank 2017.
FIGURE ES.2 Changes in Total Wealth and Per Capita Wealth, 1995–2014 percent
180 160 140 120 100 80 60 40 20 0 Low-income countries
Lower-middleincome countries
Upper-middleincome countries Total wealth
High-income nonOECD countries
High-income OECD countries
World
Per capita wealth
Source: World Bank calculations. Note: OECD = Organisation for Economic Co-operation and Development.
countries affected after 2009 by the financial crisis. Although the growth of wealth from 1995 to 2014 in many Sub-Saharan African countries matched that of other regions, the growth was not sufficient to keep up with relatively high population growth in some of them. Countries with similar or even less investment growth over the period still increased per capita wealth because of lower population growth rates (see figure ES.2).
7