31
Current and Future Uruguayan Demographics
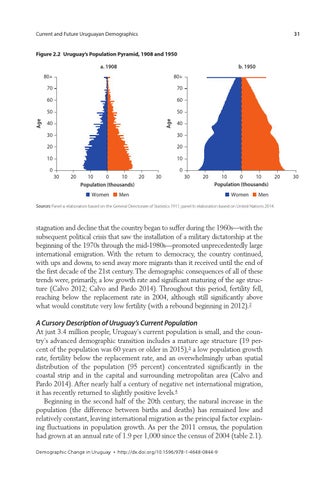
Figure 2.2 Uruguay’s Population Pyramid, 1908 and 1950 b. 1950
80+
80+
70
70
60
60
50
50 Age
Age
a. 1908
40
40
30
30
20
20
10
10
0
0 30
20
10 0 10 20 Population (thousands) Women
30
30
20
10 0 10 Population (thousands)
Men
Women
Men
Sources: Panel a: elaboration based on the General Directorate of Statistics 1911; panel b: elaboration based on United Nations 2014.
stagnation and decline that the country began to suffer during the 1960s—with the subsequent political crisis that saw the installation of a military dictatorship at the beginning of the 1970s through the mid-1980s—promoted unprecedentedly large international emigration. With the return to democracy, the country continued, with ups and downs, to send away more migrants than it received until the end of the first decade of the 21st century. The demographic consequences of all of these trends were, primarily, a low growth rate and significant maturing of the age structure (Calvo 2012; Calvo and Pardo 2014). Throughout this period, fertility fell, reaching below the replacement rate in 2004, although still significantly above what would constitute very low fertility (with a rebound beginning in 2012).2
A Cursory Description of Uruguay’s Current Population At just 3.4 million people, Uruguay’s current population is small, and the country’s advanced demographic transition includes a mature age structure (19 percent of the population was 60 years or older in 2015),3 a low population growth rate, fertility below the replacement rate, and an overwhelmingly urban spatial distribution of the population (95 percent) concentrated significantly in the coastal strip and in the capital and surrounding metropolitan area (Calvo and Pardo 2014). After nearly half a century of negative net international migration, it has recently returned to slightly positive levels.4 Beginning in the second half of the 20th century, the natural increase in the population (the difference between births and deaths) has remained low and relatively constant, leaving international migration as the principal factor explaining fluctuations in population growth. As per the 2011 census, the population had grown at an annual rate of 1.9 per 1,000 since the census of 2004 (table 2.1). Demographic Change in Uruguay • http://dx.doi.org/10.1596/978-1-4648-0844-9
20
30