Downscaling Climate l 109
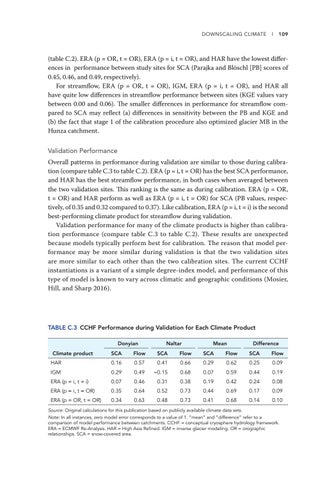
(table C.2). ERA (p = OR, t = OR), ERA (p = i, t = OR), and HAR have the lowest differences in performance between study sites for SCA (Parajka and Blöschl [PB] scores of 0.45, 0.46, and 0.49, respectively). For streamflow, ERA (p = OR, t = OR), IGM, ERA (p = i, t = OR), and HAR all have quite low differences in streamflow performance between sites (KGE values vary between 0.00 and 0.06). The smaller differences in performance for streamflow compared to SCA may reflect (a) differences in sensitivity between the PB and KGE and (b) the fact that stage 1 of the calibration procedure also optimized glacier MB in the Hunza catchment. Validation Performance Overall patterns in performance during validation are similar to those during calibration (compare table C.3 to table C.2). ERA (p = i, t = OR) has the best SCA performance, and HAR has the best streamflow performance, in both cases when averaged between the two validation sites. This ranking is the same as during calibration. ERA (p = OR, t = OR) and HAR perform as well as ERA (p = i, t = OR) for SCA (PB values, respectively, of 0.35 and 0.32 compared to 0.37). Like calibration, ERA (p = i, t = i) is the second best-performing climate product for streamflow during validation. Validation performance for many of the climate products is higher than calibration performance (compare table C.3 to table C.2). These results are unexpected because models typically perform best for calibration. The reason that model performance may be more similar during validation is that the two validation sites are more similar to each other than the two calibration sites. The current CCHF instantiations is a variant of a simple degree-index model, and performance of this type of model is known to vary across climatic and geographic conditions (Mosier, Hill, and Sharp 2016).
TABLE C.3 CCHF Performance during Validation for Each Climate Product Donyian Climate product HAR
Naltar
Mean
Difference
SCA
Flow
SCA
Flow
SCA
Flow
SCA
Flow
0.16
0.57
0.41
0.66
0.29
0.62
0.25
0.09
IGM
0.29
0.49
−0.15
0.68
0.07
0.59
0.44
0.19
ERA (p = i, t = i)
0.07
0.46
0.31
0.38
0.19
0.42
0.24
0.08
ERA (p = i, t = OR)
0.35
0.64
0.52
0.73
0.44
0.69
0.17
0.09
ERA (p = OR, t = OR)
0.34
0.63
0.48
0.73
0.41
0.68
0.14
0.10
Source: Original calculations for this publication based on publicly available climate data sets. Note: In all instances, zero model error corresponds to a value of 1. “mean” and “difference” refer to a comparison of model performance between catchments. CCHF = conceptual cryosphere hydrology framework. ERA = ECMWF Re-Analysis. HAR = High Asia Refined. IGM = inverse glacier modeling. OR = orographic relationships. SCA = snow-covered area.


