108 l Glaciers of the Himalayas
and SCA observations are used for calibration in stage 1, and streamflow is used for calibration in stage 2. Performance of modeled glacier MB is assessed using “mass balance efficiency” (MBE), defined here as follows:
( r − 1) + (( m − o ) / σ ) (C.1) 2
MBE =
2
0
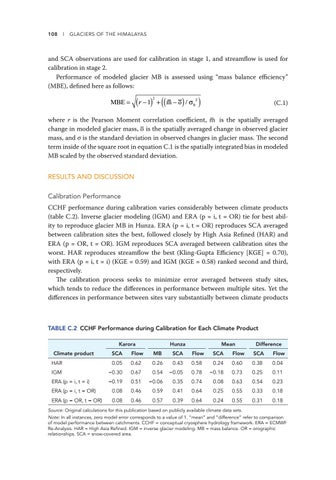
– is the spatially averaged where r is the Pearson Moment correlation coefficient, m change in modeled glacier mass, – o is the spatially averaged change in observed glacier mass, and σ is the standard deviation in observed changes in glacier mass. The second term inside of the square root in equation C.1 is the spatially integrated bias in modeled MB scaled by the observed standard deviation. RESULTS AND DISCUSSION Calibration Performance CCHF performance during calibration varies considerably between climate products (table C.2). Inverse glacier modeling (IGM) and ERA (p = i, t = OR) tie for best ability to reproduce glacier MB in Hunza. ERA (p = i, t = OR) reproduces SCA averaged between calibration sites the best, followed closely by High Asia Refined (HAR) and ERA (p = OR, t = OR). IGM reproduces SCA averaged between calibration sites the worst. HAR reproduces streamflow the best (Kling-Gupta Efficiency [KGE] = 0.70), with ERA (p = i, t = i) (KGE = 0.59) and IGM (KGE = 0.58) ranked second and third, respectively. The calibration process seeks to minimize error averaged between study sites, which tends to reduce the differences in performance between multiple sites. Yet the differences in performance between sites vary substantially between climate products
TABLE C.2 CCHF Performance during Calibration for Each Climate Product Karora Climate product
Hunza
Mean
Difference
SCA
Flow
MB
SCA
Flow
SCA
Flow
SCA
Flow
HAR
0.05
0.62
0.26
0.43
0.58
0.24
0.60
0.38
0.04
IGM
−0.30
0.67
0.54
−0.05
0.78
−0.18
0.73
0.25
0.11
ERA (p = i, t = i)
−0.19
0.51
−0.06
0.35
0.74
0.08
0.63
0.54
0.23
ERA (p = i, t = OR)
0.08
0.46
0.59
0.41
0.64
0.25
0.55
0.33
0.18
ERA (p = OR, t = OR)
0.08
0.46
0.57
0.39
0.64
0.24
0.55
0.31
0.18
Source: Original calculations for this publication based on publicly available climate data sets. Note: In all instances, zero model error corresponds to a value of 1. “mean” and “difference” refer to comparison of model performance between catchments. CCHF = conceptual cryosphere hydrology framework. ERA = ECMWF Re-Analysis. HAR = High Asia Refined. IGM = inverse glacier modeling. MB = mass balance. OR = orographic relationships. SCA = snow-covered area.


