92
The Power Sector
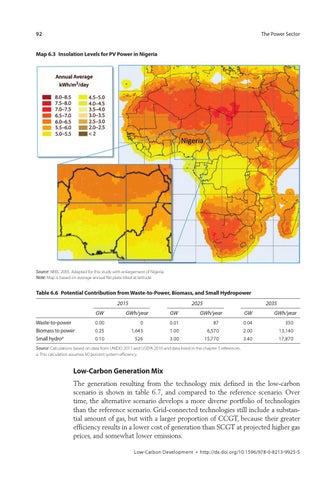
Map 6.3 Insolation Levels for PV Power in Nigeria
Source: NREL 2005. Adapted for this study with enlargement of Nigeria. Note: Map is based on average annual flat plate tilted at latitude.
Table 6.6 Potential Contribution from Waste-to-Power, Biomass, and Small Hydropower 2015 Waste-to-power Biomass to power Small hydroa
2025
2035
GW
GWh/year
GW
GWh/year
GW
GWh/year
0.00 0.25 0.10
0 1,643 526
0.01 1.00 3.00
87 6,570 15,770
0.04 2.00 3.40
350 13,140 17,870
Source: Calculations based on data from UNIDO 2011 and USEPA 2010 and data listed in the chapter 3 references. a. This calculation assumes 60 percent system efficiency.
Low-Carbon Generation Mix The generation resulting from the technology mix defined in the low-carbon scenario is shown in table 6.7, and compared to the reference scenario. Over time, the alternative scenario develops a more diverse portfolio of technologies than the reference scenario. Grid-connected technologies still include a substantial amount of gas, but with a larger proportion of CCGT, because their greater efficiency results in a lower cost of generation than SCGT at projected higher gas prices, and somewhat lower emissions. Low-Carbon Development • http://dx.doi.org/10.1596/978-0-8213-9925-5