36
Infrastructure and Employment Creation in the Middle East and North Africa
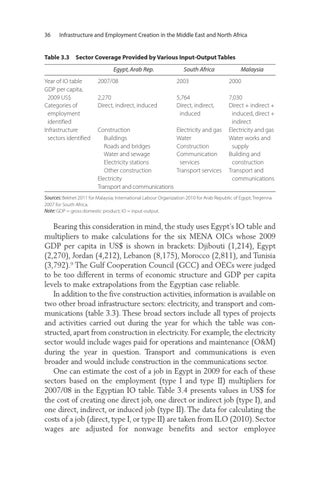
Table 3.3 Sector Coverage Provided by Various Input-Output Tables Egypt, Arab Rep. Year of IO table GDP per capita, 2009 US$ Categories of employment identified Infrastructure sectors identified
South Africa
Malaysia
2007/08
2003
2000
2,270 Direct, indirect, induced
5,764 Direct, indirect, induced
Construction Buildings Roads and bridges Water and sewage Electricity stations Other construction Electricity Transport and communications
Electricity and gas Water Construction Communication services Transport services
7,030 Direct + indirect + induced, direct + indirect Electricity and gas Water works and supply Building and construction Transport and communications
Sources: Bekhet 2011 for Malaysia; International Labour Organization 2010 for Arab Republic of Egypt; Tregenna 2007 for South Africa. Note: GDP = gross domestic product; IO = input-output.
Bearing this consideration in mind, the study uses Egypt’s IO table and multipliers to make calculations for the six MENA OICs whose 2009 GDP per capita in US$ is shown in brackets: Djibouti (1,214), Egypt (2,270), Jordan (4,212), Lebanon (8,175), Morocco (2,811), and Tunisia (3,792).9 The Gulf Cooperation Council (GCC) and OECs were judged to be too different in terms of economic structure and GDP per capita levels to make extrapolations from the Egyptian case reliable. In addition to the five construction activities, information is available on two other broad infrastructure sectors: electricity, and transport and communications (table 3.3). These broad sectors include all types of projects and activities carried out during the year for which the table was constructed, apart from construction in electricity. For example, the electricity sector would include wages paid for operations and maintenance (O&M) during the year in question. Transport and communications is even broader and would include construction in the communications sector. One can estimate the cost of a job in Egypt in 2009 for each of these sectors based on the employment (type I and type II) multipliers for 2007/08 in the Egyptian IO table. Table 3.4 presents values in US$ for the cost of creating one direct job, one direct or indirect job (type I), and one direct, indirect, or induced job (type II). The data for calculating the costs of a job (direct, type I, or type II) are taken from ILO (2010). Sector wages are adjusted for nonwage benefits and sector employee