216 structural transformation and rural change revisiteded
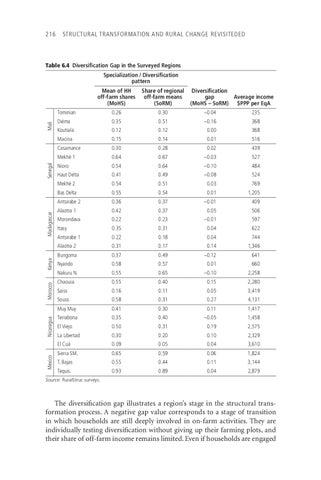
Table 6.4 Diversification Gap in the Surveyed Regions
Mexico
Nicaragua
Morocco
Kenya
Madagascar
Senegal
Mali
Specialization / Diversification pattern Mean of HH off-farm shares (MoHS)
Share of regional off-farm means (SoRM)
Tominian
0.26
0.30
–0.04
235
Diéma
0.35
0.51
–0.16
368
Koutiala
0.12
0.12
0.00
368
Macina
0.15
0.14
0.01
516
Casamance
0.30
0.28
0.02
439
Mekhé 1
0.64
0.67
–0.03
527
Nioro
0.54
0.64
–0.10
484
Haut Delta
0.41
0.49
–0.08
524
Mekhé 2
0.54
0.51
0.03
769
Bas Delta
0.55
0.54
0.01
1,205
Antsirabe 2
0.36
0.37
–0.01
409
Alaotra 1
0.42
0.37
0.05
506
Morondava
0.22
0.23
–0.01
597
Itasy
0.35
0.31
0.04
622
Antsirabe 1
0.22
0.18
0.04
744
Alaotra 2
0.31
0.17
0.14
1,346
Bungoma
0.37
0.49
–0.12
641
Nyando
0.58
0.57
0.01
660
Nakuru N.
0.55
0.65
–0.10
2,258
Chaouia
0.55
0.40
0.15
2,280
Saiss
0.16
0.11
0.05
3,419
Souss
0.58
0.31
0.27
4,131
Muy Muy
0.41
0.30
0.11
1,417
Terrabona
0.35
0.40
–0.05
1,458
El Viejo
0.50
0.31
0.19
2,575
La Libertad
0.30
0.20
0.10
2,329
El Cuá
0.09
0.05
0.04
3,610
Sierra SM.
0.65
0.59
0.06
1,824
T. Bajas
0.55
0.44
0.11
3,144
Tequis.
0.93
0.89
0.04
2,879
Diversification gap Average income (MoHS – SoRM) $PPP per EqA
Source: RuralStruc surveys.
The diversification gap illustrates a region’s stage in the structural transformation process. A negative gap value corresponds to a stage of transition in which households are still deeply involved in on-farm activities. They are individually testing diversification without giving up their farming plots, and their share of off-farm income remains limited. Even if households are engaged
Africa.indb 216
6/1/12 8:37 AM