32
Module 1: Trade Outcomes Analysis
Module 1
Table 1.2. Annual Growth Rates and Share of Services Exports, 1998–2008 Average growth rate in services exports, 1998–08
Average growth rate in goods exports, 1998–08
Share of services in total exports, 2008
Share of services in total exports, 1998
17.31 9.58 7.88 17.29 8.92
17.73 19.92 12.08 15.66 16.58
11.44 13.84 11.86 27.61 11.26
11.80 28.37 16.47 24.91 20.02
East Asia and Pacific Europe and Central Asia Latin America and Caribbean South Asia Sub-Saharan Africa
Source: Computed from data in WDI (World Bank 2011c).
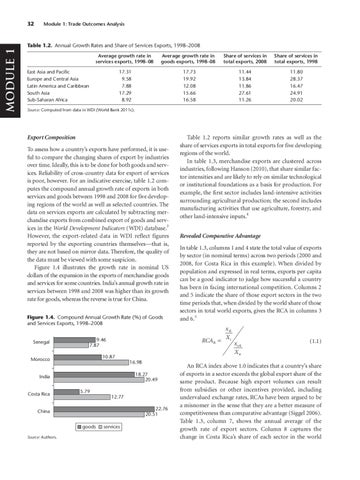
Export Composition To assess how a country’s exports have performed, it is useful to compare the changing shares of export by industries over time. Ideally, this is to be done for both goods and services. Reliability of cross-country data for export of services is poor, however. For an indicative exercise, table 1.2 computes the compound annual growth rate of exports in both services and goods between 1998 and 2008 for five developing regions of the world as well as selected countries. The data on services exports are calculated by subtracting merchandise exports from combined export of goods and services in the World Development Indicators (WDI) database.3 However, the export-related data in WDI reflect figures reported by the exporting countries themselves—that is, they are not based on mirror data. Therefore, the quality of the data must be viewed with some suspicion. Figure 1.4 illustrates the growth rate in nominal US dollars of the expansion in the exports of merchandise goods and services for some countries. India’s annual growth rate in services between 1998 and 2008 was higher than its growth rate for goods, whereas the reverse is true for China. Figure 1.4. Compound Annual Growth Rate (%) of Goods and Services Exports, 1998–2008
Senegal
10.87 16.98 18.27 20.49
India
Costa Rica
5.79 12.77 22.76 20.51
China goods Source: Authors.
Revealed Comparative Advantage In table 1.3, columns 1 and 4 state the total value of exports by sector (in nominal terms) across two periods (2000 and 2008, for Costa Rica in this example). When divided by population and expressed in real terms, exports per capita can be a good indicator to judge how successful a country has been in facing international competition. Columns 2 and 5 indicate the share of those export sectors in the two time periods that, when divided by the world share of those sectors in total world exports, gives the RCA in columns 3 and 6.5 RCAik =
9.46 7.87
Morocco
Table 1.2 reports similar growth rates as well as the share of services exports in total exports for five developing regions of the world. In table 1.3, merchandise exports are clustered across industries, following Hanson (2010), that share similar factor intensities and are likely to rely on similar technological or institutional foundations as a basis for production. For example, the first sector includes land-intensive activities surrounding agricultural production; the second includes manufacturing activities that use agriculture, forestry, and other land-intensive inputs.4
services
x ik Xi
x wk Xw
(1.1)
An RCA index above 1.0 indicates that a country’s share of exports in a sector exceeds the global export share of the same product. Because high export volumes can result from subsidies or other incentives provided, including undervalued exchange rates, RCAs have been argued to be a misnomer in the sense that they are a better measure of competitiveness than comparative advantage (Siggel 2006). Table 1.3, column 7, shows the annual average of the growth rate of export sectors. Column 8 captures the change in Costa Rica’s share of each sector in the world