Yemen, Rep. Middle East & North Africa
Lower middle income
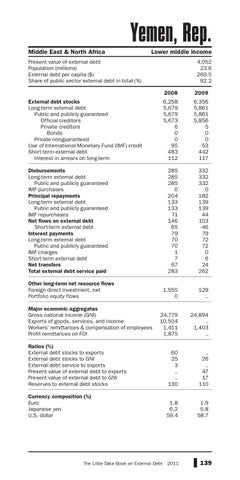
Present value of external debt Population (millions) External debt per capita ($) Share of public sector external debt in total (%)
4,052 23.6 269.5 92.2 2008
2009
6,258 5,679 5,679 5,673 6 0 0 95 483 112
6,356 5,861 5,861 5,856 5 0 0 53 442 117
285 285 285 0 204 133 133 71 146 65 79 70 70 1 7 67 283
332 332 332 0 182 139 139 44 103 -46 79 72 72 0 6 24 262
1,555 0
129 ..
24,779 10,504 1,411 1,875
24,894 .. 1,403 ..
Ratios (%) External debt stocks to exports External debt stocks to GNI External debt service to exports Present value of external debt to exports Present value of external debt to GNI Reserves to external debt stocks
60 25 3 .. .. 130
.. 26 .. 47 17 110
Currency composition (%) Euro Japanese yen U.S. dollar
1.8 6.2 59.4
1.9 5.8 58.7
External debt stocks Long-term external debt Public and publicly guaranteed Official creditors Private creditors Bonds Private nonguaranteed Use of International Monetary Fund (IMF) credit Short-term external debt Interest in arrears on long-term Disbursements Long-term external debt Public and publicly guaranteed IMF purchases Principal repayments Long-term external debt Public and publicly guaranteed IMF repurchases Net flows on external debt Short-term external debt Interest payments Long-term external debt Public and publicly guaranteed IMF charges Short-term external debt Net transfers Total external debt service paid Other long-term net resource flows Foreign direct investment, net Portfolio equity flows Major economic aggregates Gross national income (GNI) Exports of goods, services, and income Workers' remittances & compensation of employees Profit remittances on FDI
The Little Data Book on External Debt
2011
139