PERU (US$ million, unless otherwise indicated)
1990
1995
2000
2005
2006
2007
2008
2009
13,959 13,629 6,594 2,199 1,188 0 4,395 7,035 1 3,159 330 0
20,219 18,931 15,229 3,716 1,729 0 11,513 3,702 0 3,040 1,288 60
24,137 19,199 14,368 5,511 2,590 0 8,857 4,830 3,727 110 4,938 150
25,670 22,500 13,794 7,885 2,816 0 5,910 8,706 8,390 86 3,170 218
25,468 22,150 13,469 7,810 2,633 0 5,658 8,682 8,390 77 3,318 192
23,089 19,820 11,282 7,922 2,649 0 3,360 8,538 8,270 68 3,269 1,419
22,461 19,384 12,328 7,989 2,712 0 4,340 7,056 6,879 170 3,078 1,269
24,863 20,791 11,730 8,378 2,846 0 3,352 9,060 8,911 145 4,073 2,097
Disbursements Public and publicly guaranteed Official creditors Multilateral of which: IBRD IDA Bilateral Private creditors of which: Bonds Commercial banks Private nonguaranteed of which: Bonds
289 289 187 38 0 0 149 103 0 69 0 0
880 725 720 631 202 0 89 5 0 0 155 0
2,064 1,487 1,452 811 266 0 641 35 0 34 577 0
2,769 2,635 985 799 192 0 187 1,650 1,650 0 133 127
1,690 638 638 509 36 0 129 0 0 0 1,052 0
6,174 3,299 1,180 1,038 256 0 142 2,119 2,119 0 2,875 1,227
1,549 1,165 1,165 991 294 0 174 0 0 0 384 0
5,723 4,527 2,527 2,336 379 0 191 2,000 2,000 0 1,196 878
Principal repayments Public and publicly guaranteed Official creditors Multilateral of which: IBRD IDA Bilateral Private creditors of which: Bonds Commercial banks Private nonguaranteed of which: Bonds
166 112 81 24 0 0 57 31 0 9 54 0
521 481 404 201 86 0 203 77 0 28 40 0
997 979 834 497 93 0 337 146 0 130 17 0
3,993 3,031 2,916 556 210 0 2,360 114 90 11 962 0
2,021 1,143 1,030 603 219 0 426 113 90 9 878 0
6,481 5,862 3,496 950 241 0 2,546 2,366 2,343 9 619 0
3,209 2,616 1,253 958 230 0 296 1,363 1,338 23 593 150
2,431 1,831 1,806 653 245 0 1,153 25 0 23 600 50
Interest payments Public and publicly guaranteed Official creditors Multilateral of which: IBRD IDA Bilateral Private creditors of which: Bonds Commercial banks Private nonguaranteed of which: Bonds
91 66 51 27 0 0 24 15 0 8 25 0
485 413 395 245 118 0 150 19 0 10 71 6
1,172 1,103 915 382 189 0 533 188 179 5 69 11
1,601 1,403 806 354 105 0 453 596 568 7 198 10
1,555 1,389 724 434 137 0 290 665 637 8 166 10
1,975 1,512 818 483 150 0 334 694 669 7 464 42
1,538 1,184 571 409 136 0 163 613 603 10 354 230
1,186 1,084 451 314 107 0 137 632 623 9 103 49
1,479 126
4,323 3,148
-517 288
-2,612 -802
-439 -583
-77 1,994
-541 -1,579
1,713 2,624
0 0 0
919 0 0
1 0 0
21 66 0
0 27 0
0 61 2,343
0 56 838
30 32 0
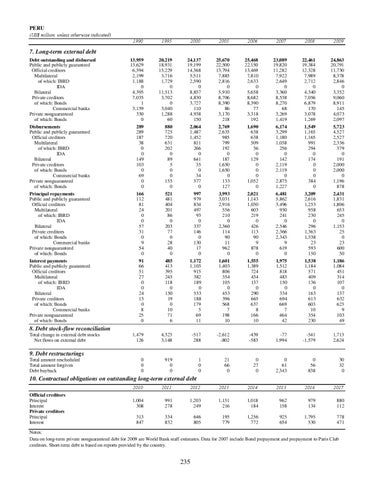
7. Long-term external debt Debt outstanding and disbursed Public and publicly guaranteed Official creditors Multilateral of which: IBRD IDA Bilateral Private creditors of which: Bonds Commercial banks Private nonguaranteed of which: Bonds
8. Debt stock-flow reconciliation Total change in external debt stocks Net flows on external debt
9. Debt restructurings Total amount rescheduled Total amount forgiven Debt buyback
10. Contractual obligations on outstanding long-term external debt Official creditors Principal Interest Private creditors Principal Interest
2010
2011
2012
2013
2014
2015
2016
2017
1,004 308
991 278
1,203 249
1,131 216
1,018 184
962 158
979 134
880 112
313 847
334 832
646 805
195 779
1,256 772
925 654
1,795 530
778 471
Notes: Data on long-term private nonguaranteed debt for 2009 are World Bank staff estimates. Data for 2007 include Bond prepayment and prepayment to Paris Club creditors. Short-term debt is based on reports provided by the country.
235