66
Special Economic Zones in Africa
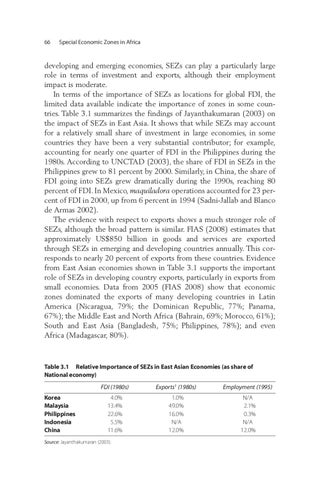
developing and emerging economies, SEZs can play a particularly large role in terms of investment and exports, although their employment impact is moderate. In terms of the importance of SEZs as locations for global FDI, the limited data available indicate the importance of zones in some countries. Table 3.1 summarizes the findings of Jayanthakumaran (2003) on the impact of SEZs in East Asia. It shows that while SEZs may account for a relatively small share of investment in large economies, in some countries they have been a very substantial contributor; for example, accounting for nearly one quarter of FDI in the Philippines during the 1980s. According to UNCTAD (2003), the share of FDI in SEZs in the Philippines grew to 81 percent by 2000. Similarly, in China, the share of FDI going into SEZs grew dramatically during the 1990s, reaching 80 percent of FDI. In Mexico, maquiladora operations accounted for 23 percent of FDI in 2000, up from 6 percent in 1994 (Sadni-Jallab and Blanco de Armas 2002). The evidence with respect to exports shows a much stronger role of SEZs, although the broad pattern is similar. FIAS (2008) estimates that approximately US$850 billion in goods and services are exported through SEZs in emerging and developing countries annually. This corresponds to nearly 20 percent of exports from these countries. Evidence from East Asian economies shown in Table 3.1 supports the important role of SEZs in developing country exports, particularly in exports from small economies. Data from 2005 (FIAS 2008) show that economic zones dominated the exports of many developing countries in Latin America (Nicaragua, 79%; the Dominican Republic, 77%; Panama, 67%); the Middle East and North Africa (Bahrain, 69%; Morocco, 61%); South and East Asia (Bangladesh, 75%; Philippines, 78%); and even Africa (Madagascar, 80%).
Table 3.1 Relative Importance of SEZs in East Asian Economies (as share of National economy)
Korea Malaysia Philippines Indonesia China
FDI (1980s)
Exports1 (1980s)
Employment (1995)
4.0% 13.4% 22.6% 5.5% 11.6%
1.0% 49.0% 16.0% N/A 12.0%
N/A 2.1% 0.3% N/A 12.0%
Source: Jayanthakumaran (2003).