The Great Recession and Developing Countries
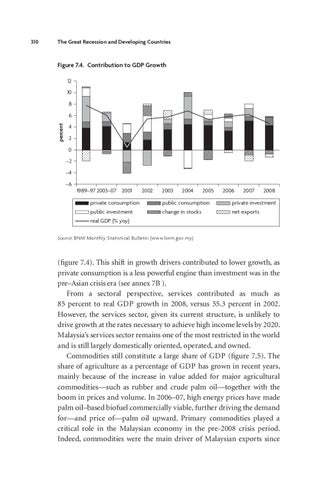
Figure 7.4. Contribution to GDP Growth 12 10 8 6 percent
310
4 2 0 –2 –4 –6 1989–97 2003–07 2001 private consumption public investment real GDP (% yoy)
2002
2003
2004
2005
public consumption change in stocks
2006
2007
2008
private investment net exports
Source: BNM Monthly Statistical Bulletin (www.bnm.gov.my).
(figure 7.4). This shift in growth drivers contributed to lower growth, as private consumption is a less powerful engine than investment was in the pre–Asian crisis era (see annex 7B ). From a sectoral perspective, services contributed as much as 85 percent to real GDP growth in 2008, versus 55.3 percent in 2002. However, the services sector, given its current structure, is unlikely to drive growth at the rates necessary to achieve high income levels by 2020. Malaysia’s services sector remains one of the most restricted in the world and is still largely domestically oriented, operated, and owned. Commodities still constitute a large share of GDP (figure 7.5). The share of agriculture as a percentage of GDP has grown in recent years, mainly because of the increase in value added for major agricultural commodities—such as rubber and crude palm oil—together with the boom in prices and volume. In 2006–07, high energy prices have made palm oil–based biofuel commercially viable, further driving the demand for—and price of—palm oil upward. Primary commodities played a critical role in the Malaysian economy in the pre-2008 crisis period. Indeed, commodities were the main driver of Malaysian exports since