Tanzania
Data Appendix
Tanzania
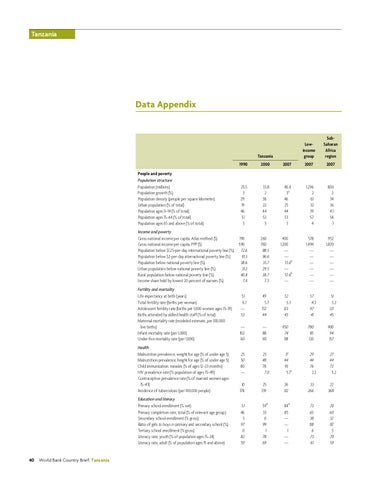
People and poverty Population structure Population (millions) Population growth (%) Population density (people per square kilometer) Urban population (% of total) Population ages 0–14 (% of total) Population ages 15–64 (% of total) Population ages 65 and above (% of total) Income and poverty Gross national income per capita, Atlas method ($) Gross national income per capita, PPP ($) Population below $1.25-per-day international poverty line (%) Population below $2-per-day international poverty line (%) Population below national poverty line (%) Urban population below national poverty line (%) Rural population below national poverty line (%) Income share held by lowest 20 percent of earners (%) Fertility and mortality Life expectancy at birth (years) Total fertility rate (births per woman) Adolescent fertility rate (births per 1,000 women ages 15–19) Births attended by skilled health staff (% of total) Maternal mortality rate (modeled estimate, per 100,000 live births) Infant mortality rate (per 1,000) Under-five mortality rate (per 1,000)
40
World Bank Country Brief: Tanzania
Lowincome group
SubSaharan Africa region
1990
2000
2007
2007
2007
25.5 3 29 19 46 51 3
33.8 2 38 22 44 53 3
40.4 3a 46 25 44 53 3
1,296 2 61 32 39 57 4
800 2 34 36 43 54 3
190 590 72.6 91.3 38.6 31.2 40.8 7.4
260 760 88.5 96.6 35.7 29.5 38.7 7.3
400 1,200 — — 33.6b — 37.6b —
578 1,494 — — — — — —
952 1,870 — — — — — —
51 6.1 — 53
49 5.7 132 44
52 5.3 123 43
— 102 161
— 88 141
950 74 118
25 50 80 —
25 48 78 7.0
57 4.3 97 41 780 85 135
51 5.2 121 45 900 94 157
Health Malnutriton prevalence, weight for age (% of under age 5) Malnutrition prevalence, height for age (% of under age 5) Child immunization, measles (% of ages 12–23 months) HIV prevalence rate (% population of ages 15–49) Contraceptive prevalence rate (% of married women ages 15–49) Incidence of tuberculosis (per 100,000 people)
10 178
25 339
26 312
33 266
22 368
Education and literacy Primary school enrollment (% net) Primary completion rate, total (% of relevant age group) Secondary school enrollment (% gross) Ratio of girls to boys in primary and secondary school (%) Tertiary school enrollment (% gross) Literacy rate, youth (% of population ages 15–24) Literacy rate, adult (% of population ages 15 and above)
51 46 5 97 0 82 59
59d 55 6 99 1 78 69
84d 85 — — 1 — —
73 65 38 88 6 73 61
70 60 32 87 5 70 59
17 44 93 5.7c
29 44 76 2.2
27 44 72 5.2