Table A.5
European Oil Product Prices and Russian Gas Export Gas Prices, 2000–05
Fuel a
Gas oil ($/bbl) Fuel oila ($/bbl)
2000
2001
2002
2003
2004
2005
34.4
29.2
27.8
34.0
46.8
67.7
23.7
18.5
21.8
25.8
25.0
39.2
85.9
101.0
85.7
106.0
109.0
151.1
101.9
120.2
99.0
124.3
126.2
181.3
b
Natural gas (average price) ($/Mcm) c
Natural gas (for Europe) ($/Mcm)
Sources: International Energy Agency’s Oil Market Report; Russian State Customs Committee, Gazprom; Russian State Statistics Committee; Energywise Consultants. Note: bbl = barrel; Mcm = thousand cubic meters. a. Prices for gas oil and fuel oil (sulfur content up to 1 percent), according to the International Energy Agency’s Oil Market Report, at Rotterdam. b. Average price for Russian gas exports, according to Russian State Customs Committee. c. Average price for gas exported to countries that are not members of the Commonwealth of Independent States, estimated on the basis of data from the Russian State Customs Committee, Gazprom, and the Russian State Statistics Committee.
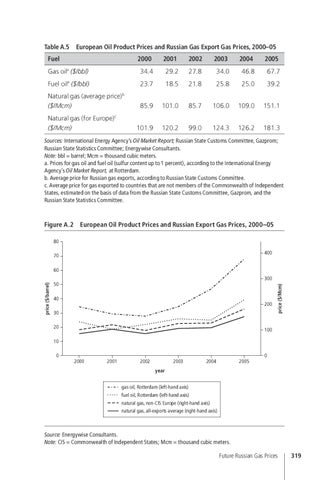
Figure A.2
European Oil Product Prices and Russian Export Gas Prices, 2000–05
80 400
70 60
40 200 30 20
price ($/Mcm)
price ($/barrel)
300 50
100
10 0
0 2000
2001
2002
2003
2004
2005
year gas oil, Rotterdam (left-hand axis) fuel oil, Rotterdam (left-hand axis) natural gas, non-CIS Europe (right-hand axis) natural gas, all-exports average (right-hand axis)
Source: Energywise Consultants. Note: CIS = Commonwealth of Independent States; Mcm = thousand cubic meters.
Future Russian Gas Prices
319