CHAPTER 16: Using Survey Data: Some Cautionary Tales
16
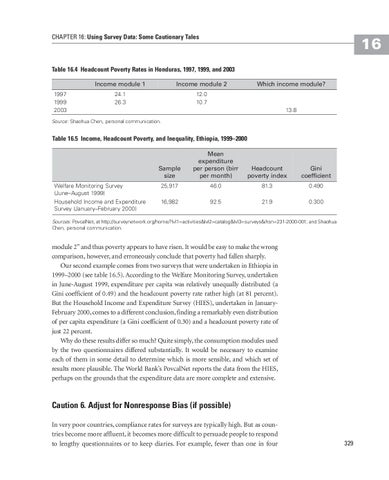
Table 16.4 Headcount Poverty Rates in Honduras, 1997, 1999, and 2003
1997 1999 2003
Income module 1
Income module 2
24.1 26.3
12.0 10.7
Which income module?
13.8
Source: Shaohua Chen, personal communication.
Table 16.5 Income, Headcount Poverty, and Inequality, Ethiopia, 1999–2000
Welfare Monitoring Survey (June–August 1999) Household Income and Expenditure Survey (January–February 2000)
Sample size
Mean expenditure per person (birr per month)
Headcount poverty index
Gini coefficient
25,917
46.0
81.3
0.490
16,982
92.5
21.9
0.300
Sources: PovcalNet, at http://surveynetwork.org/home/?lvl1=activities&lvl2=catalog&lvl3=surveys&ihsn=231-2000-001; and Shaohua Chen, personal communication.
module 2” and thus poverty appears to have risen. It would be easy to make the wrong comparison, however, and erroneously conclude that poverty had fallen sharply. Our second example comes from two surveys that were undertaken in Ethiopia in 1999–2000 (see table 16.5). According to the Welfare Monitoring Survey, undertaken in June-August 1999, expenditure per capita was relatively unequally distributed (a Gini coefficient of 0.49) and the headcount poverty rate rather high (at 81 percent). But the Household Income and Expenditure Survey (HIES), undertaken in JanuaryFebruary 2000, comes to a different conclusion, finding a remarkably even distribution of per capita expenditure (a Gini coefficient of 0.30) and a headcount poverty rate of just 22 percent. Why do these results differ so much? Quite simply, the consumption modules used by the two questionnaires differed substantially. It would be necessary to examine each of them in some detail to determine which is more sensible, and which set of results more plausible. The World Bank’s PovcalNet reports the data from the HIES, perhaps on the grounds that the expenditure data are more complete and extensive.
Caution 6. Adjust for Nonresponse Bias (if possible) In very poor countries, compliance rates for surveys are typically high. But as countries become more affluent, it becomes more difficult to persuade people to respond to lengthy questionnaires or to keep diaries. For example, fewer than one in four
329