Table 1.1 Aquaculture Production and Growth in 2004 Production (million tons)
Farmgate Value (billion $)
Growth Rate 2003–04 (quantity)
Aquatic animals
45.5
63.4
6.6%
Total aquaculture production
59.4
70.3
7.7%
Source: FAO Fishstat 2005. Note: Excludes aquatic plants.
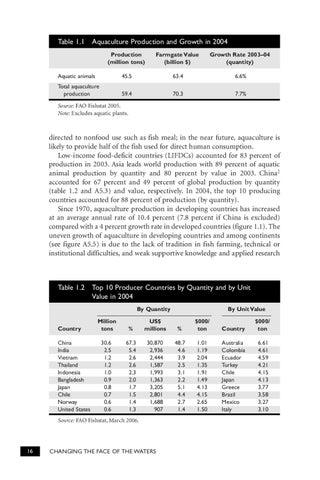
directed to nonfood use such as fish meal; in the near future, aquaculture is likely to provide half of the fish used for direct human consumption. Low-income food-deficit countries (LIFDCs) accounted for 83 percent of production in 2003. Asia leads world production with 89 percent of aquatic animal production by quantity and 80 percent by value in 2003. China2 accounted for 67 percent and 49 percent of global production by quantity (table 1.2 and A5.3) and value, respectively. In 2004, the top 10 producing countries accounted for 88 percent of production (by quantity). Since 1970, aquaculture production in developing countries has increased at an average annual rate of 10.4 percent (7.8 percent if China is excluded) compared with a 4 percent growth rate in developed countries (figure 1.1). The uneven growth of aquaculture in developing countries and among continents (see figure A5.5) is due to the lack of tradition in fish farming, technical or institutional difficulties, and weak supportive knowledge and applied research
Table 1.2 Top 10 Producer Countries by Quantity and by Unit Value in 2004 By Quantity Country China India Vietnam Thailand Indonesia Bangladesh Japan Chile Norway United States
Million tons
%
US$ millions
%
$000/ ton
Country
$000/ ton
30.6 2.5 1.2 1.2 1.0 0.9 0.8 0.7 0.6 0.6
67.3 5.4 2.6 2.6 2.3 2.0 1.7 1.5 1.4 1.3
30,870 2,936 2,444 1,587 1,993 1,363 3,205 2,801 1,688 907
48.7 4.6 3.9 2.5 3.1 2.2 5.1 4.4 2.7 1.4
1.01 1.19 2.04 1.35 1.91 1.49 4.13 4.15 2.65 1.50
Australia Colombia Ecuador Turkey Chile Japan Greece Brazil Mexico Italy
6.61 4.61 4.59 4.21 4.15 4.13 3.77 3.58 3.27 3.10
Source: FAO Fishstat, March 2006.
16
By Unit Value
CHANGING THE FACE OF THE WATERS