Squaring the Circle


© 2022 International Bank for Reconstruction and Development / The World Bank 1818 H Street NW Washington DC 20433 Telephone: 202-473-1000; Internet: www.worldbank.org
This work is a product of the staff of the World Bank Group. The findings, interpretations, and conclusions expressed in this work do not necessarily reflect the views of The World Bank, its Board of Executive Directors, or the governments they represent.
The World Bank does not guarantee the accuracy, completeness, or currency of the data included in this work and does not assume responsibility for any errors, omissions, or discrepancies in the information, or liability with respect to the use of or failure to use the information, methods, processes, or conclusions set forth. The boundaries, colors, denominations, and other information shown on any map in this work do not imply any judgment on the part of The World Bank concerning the legal status of any territory or the endorsement or acceptance of such boundaries.
Nothing herein shall constitute or be construed or considered to be a limitation upon or waiver of the privileges and immunities of The World Bank, all of which are specifically reserved.
The material in this work is subject to copyright. Because The World Bank encourages dissemination of its knowledge, this work may be reproduced, in whole or in part, for noncommercial purposes as long as full attribution to this work is given.
Please cite the work as follows: “The World Bank. 2022. Squaring the Circle: Policies from Europe’s Circular Economy Transition © World Bank.”
All queries on rights and licenses, including subsidiary rights, should be addressed to World Bank Publications, The World Bank Group, 1818 H Street NW, Washington, DC 20433, USA; fax: 202-5222625; e-mail: pubrights@worldbank.org.
Cover design: Colorcom
Inside pages: Shutterstock and The World Bank
Acknowledgments vii
Executive Summary 1
Chapter 1: Making the case for the circularity transition 19
1.1 Heavy growth 20
1.2 Two planets 22
1.3 The promise of circularity 27
1.4 Squaring the circle 31
Chapter 2: Progress toward a CE within the EU 33
2.1 Europe’s dematerialization trajectory 34
2.2 Uneven progress between Member States 35
2.3 Material consumption beyond borders 40
2.4 Europe’s evolving policy landscape 43
2.5 Conclusion 45
Chapter 3: The trade implications of the circularity transition 46
3.1 The EU’s dependency on external sources of materials 47
3.2 More stringent EU regulation may result in more leakage 51 3.3 Adverse effects on EU trade partners 53
3.4 Leveraging GVCs toward material-efficient production in the EU and in trade partner countries
Chapter 5: The economics of circular economy policies 85
5.1 Assessing the economic impacts of the circularity transition 86
5.1.1 Data and model overview 86
5.1.2 Policy options and scenario design 87
5.2 Current policy pathways are insufficient to achieve significant reductions in primary material use
92
5.3 CE policies have the potential to deliver absolute material decoupling 93
5.4 A mix of domestic policy instruments will be needed to achieve CE aims 95
5.5 Trade policy can play a role in balancing sustainability and competitiveness objectives of CE
5.6 CE policies will have modest growth impacts but will accelerate ongoing structural and distributional shifts in Europe
98
101
5.7 Using CE taxes to reduce labor taxes can be growth and welfare enhancing 105
5.8 Conclusions 106
Chapter 6 : A policy framework for the circularity transition 107
58
3.5 Conclusions 64
Chapter 4: The role of the private sector: Opportunities and barriers 67
4.1 Speed, depth, and scale 68
4.2 Country characteristics shape private sector capacity for circularity 69
4.3 Firm links within and across sectors make for thriving CEs 74
4.4 Addressing the barriers faced by CBMs 77
4.4.1 Micro-level barriers 77
4.4.2 Meso-level barriers 79
4.4.3 Macro-level barriers 81
4.5 Conclusions 83
6.1 Institutions 108
6.2 Incentives 111
6.3 Information 113 6.4 Financing 115
References 118
Annexes 128
Annex 1: Sectoral splits in GTAP-CE database 129
Annex 2: Regional and sectoral coverage of the ENVISAGE model used in this study 130
Annex 3: Opportunities and challenges across sectors 133
Annex 4: Focus Sections 145
ES.1 Historical and projected global material extraction by resource 2
ES.2 Environmental impacts of metal mining across time 3
ES.3 From linear to circular economies 4
ES.4 Circular material use rate (left) and resource productivity (right) of the EU MSs in 2020 5
ES.5 Perceived clarity of roles and responsibilities and cross-government coordination for CE implementation
ES.6 Development of strategies and legislation according to different stages of product life cycle
6
2.1 Resource productivity in comparison to GDP and DMC, EU (2000–2020) 34
2.2 EU resource productivity in relation to comparators (2020) 35
2.3 Municipal waste recycling rates 35
2.4 Europe’s recycling rates by waste stream (2004–2020) 36
2.5 DMC per capita 36
2.6 Circular material use rate (left) and resource productivity (right) of the EU MSs in 2020 37
6
ES.7 Circular economy opportunities across the product life cycle 7
ES.8 Barriers to CBMs 8
ES.9 Impact of combined CE policies on use of primary materials in Europe in 2030 (Index 2021 = 100) versus BAU
2.7 Per capita in-use stock of four focus countries versus comparators 38
2.8 Historical development of absolute and per capita material stocks by country by category from 1990 to 2019 for Bulgaria, Croatia, Poland, and Romania
38
11
ES.10 Change in real wage by skill level: Europe relative to the reference scenario (2030) 12
ES.11 Stakeholders’ perceptions of level of developments of strategic and planning measures
13
2.9 Historical development of absolute iron and steel stock in Poland (inset) and its flow (2019)
2.10 Historical development of absolute iron and steel stock in Croatia (inset) and its flow (2019)
2.11 Comparison between DMC per capita and material footprint per capita for the EU-27, Bulgaria, Croatia, Poland, and Romania
39
40
41
ES.12 Actors and roles in the CE network 15
ES.13 Stakeholders’ perceptions of level of development of CE regulatory instruments (score 0–5)
17
1.1 Global material use by category 20
1.2 Historical and projected global materials extraction by resource 21
1.3 Trends in material consumption: Human Development Index, Happiness Index, and GDP per capita
21
1.4 Environmental impacts of metal mining across time 23
1.5 Material use drives planetary boundaries’ overshoot 24
1.6 Commodities price trends proceed in step with material resource use 25
1.7 Domestic material consumption per capita (2017) 26
1.8 Distribution and dynamics of global material stocks (1990–2010) 26
1.9 Circular economy activities: the 9RS framework 27
1.10 From linear to circular economies 28
1.11 Promoting CE as a super-wicked problem 30
2.12 Copper flows in Poland (2019) 42
3.1 Importance of imports in EU domestic material consumption 47
3.2 Material extraction, direct and embedded trade, globally and in the EU 48
3.3 Largest exporters of materials and fossil fuels to the EU 49
3.4 EU versus RoW import dependency by category 50
3.5 EU trade of tier-1 material-intensive downstream goods - Import share and largest exporters of goods to the EU
3.6 Correlation of domestic material consumption and domestic material footprint with trade openness
51
52
3.7 Determinants of domestic consumption and footprint of materials and CO2 emissions 53
3.8 CGE estimates of impacts on exports and GDP 54
3.9 Countries that depend most on material exports to the EU, in terms of share on total trade and GDP or the adjusted RCA measure
55
3.10 Analysis of countries that depend on material exports to the EU 56
3.11 Main recipients of EU exports of waste 57
3.12 EU imports of plastic 59
3.13 CGE estimates of reconversion potential in LMICs 59
3.14 LMIC exports of environmental goods 61
4.1 CBMs across the product life cycle 68
4.2 Economic impact of CE sectors and their growth rate 69
4.3 CE VA versus drivers of production 70
4.4 KPIs for CE potential in Romania 72
4.5 KPIs for CE potential in Poland 72
4.6 KPIs for CE potential in Bulgaria 72
4.7 KPIs for CE potential in Croatia 73
4.8 Network analysis - Bulgaria 75
4.9 Network analysis - Poland 76
4.10 Network analysis - Romania 76
4.11 Micro-, meso-, and macro-level barriers facing CBMs 78
5.1 Index of material use: production based (left) and consumption based (right) under BAU
5.12 Change in unemployment rate (left) and real wage (right) by skill level: Europe relative to the reference scenario (2030)
104
5.13 Change in real wages by skill level at country level (2030) - Combined scenario 104
5.14 Percentage change in unemployment under alternative revenue recycling scenarios 106
6.1 Perception on a leading group/body in charge of the CE transition 108
6.2 Actors and roles in the CE network 109
6.3 Stakeholders’ perceptions of level of developments of strategic and planning measures
111
6.4 Perception of the development of policy/ regulatory instruments for promoting CE 112
6.5 Perceptions about the existence of an M&E system for CE 115
A3.1 Rates of post-consumer plastic waste recycling, energy recovery, and landfill per country in 2018
134
92
5.2 Impacts of the EGD-NDC scenario on primary material use in Europe 94
5.3 Impact of combined CE policies on use of primary materials in Europe in 2030 (Index 2021 = 100) versus BAU
5.4 Impact of primary production tax and secondary production subsidy on metal ore use compared to the EGD-NDC scenario
5.5 Impact of alternative scenarios on use of primary materials relative to the EGD-NDC scenario
5.6 Price competitiveness impacts on European producers relative to key global producers of alternative policy scenarios for metals (left) and construction materials (right)
5.7 Production, consumption, and leakage of alternative policies, with and without border adjustments for metals
5.8 Impacts of selected CE scenarios on exports in regions/country groupings outside Europe
5.9 Change in composition of LMIC exports by broad category under the ‘combined’ CE scenario
94
A3.2 Growth in demand for selected minerals from clean energy technologies in 2040 relative to 2020 levels
135
A3.3 WICER Framework 137
A3.4 Comparing life-cycle GHG emissions of gasoline cars with EVs 139
96
A3.5 Visualization of a resource cadasterAggregation of 46 construction materials used in the city of Odense, Denmark, stocked in buildings, roads, and pipe networks
142
97
98
A3.6 Practical application of the waste hierarchy for food 143
A4.1 Abatement potential and costs of circular economy opportunities by 2050 (cost in €/ tCO2)
99
101
101
5.10 Change in Europe’s GDP relative to the EGD-NDC scenario (2030) 103
5.11 Change in consumer prices in Europe relative to reference scenario (2030) 103
145
A4.2 Environmental tax revenues in EU MSs + UK as percentage of GDP 147
A4.3 Circular Taxation Framework 148
A4.4 Landfill taxes across EU MSs 148
A4.5 Increase in the number of EIPs by region (1990–2020) 150
A4.6 Distribution of EIPs by world region 151
A4.7 Integrated system of sludge from a wastewater treatment plant, Industriepark Höchst
153
A4.8 From sustainable to circular procurementA framework 157
ES.1 Changes in key variables relative to the EGD-NDC scenario (2030) resulting from tax on primary metals and fossil fuels when revenue is recycled directly to households versus through a reduction in labor taxes
13
1.1 The relevance of circularity to the achievement of SDGs 29
2.1 Examples of EU-wide targets in waste management 43
3.1 EU import concentration measures in different goods categories 50
3.2 Index of export market penetration by goods category 55
4.1 Economywide priority sectors with closer links to key product value chains 74
4.2 Practices available to corporate departments, by CE activity 79
5.1 Definition of modelled scenarios 90
5.2 Impact of combined CE policies on use of primary materials in 2030 (Index 2021 = 100) at the country level
4.1 Focus sector selection methodology and evaluation of their circular potential 71
4.2 Product life extension - firm capacities and beyond 80
4.3 Examples for clusters facilitating CBMs 81
4.4 Regulatory conflicts constrain secondary material use in construction 82
5.1 GTAP-CE database 87
5.2 Environmental fiscal policies to support the CE transition 88
5.3 Production and consumption-based material use accounting 93
A4.1 Examples of virgin materials Taxes in Europe 149
A4.2 Digital solutions to end life products 154
A4.3 Digital Information Platforms for circularity 154
A4.4 Digital solutions enable PaaS 155
95
5.3 Price and material use growth to 2030 (%) 95
5.4 Impact of alternative policies on productionbased metals and plastics use (2030) (%) 97
5.5 Impacts of BAT scenarios on key demand and use variables for primary metals and construction materials
100
5.6 Change in share of output by broad sector in 2030 relative to the reference scenario 102
5.7 Changes in key variables relative to the EGD-NDC scenario (2030) resulting from tax on primary metals and fossil fuels when revenue is recycled directly to households (metals and plastics - tax) versus recycled through a reduction in labor taxes (metals and plastics - tax*labor)
6.1 An ‘institutions, incentives, information, and financing’ policy package for the circular transition
105
A4.5 Solutions optimizing inputs at production stage 155
116
A3.1 Relevant CE actions across the construction life cycle 141
A4.1 Programs to encourage EIPs/industrial symbiosis in the EU 152
This report was written by a World Bank team including Andrea Liverani, Sameer Akbar, Jiyoun Christina Chang, Tom Farole, Daria Taglioni, Etienne Kechichian, and Arno Behrens. The extended World Bank team included Remi Pelon, Svetlana Edmeades, Gregoire Gautier, Thierry Davy, Silpa Kaza, Quamrul Hassan, Stefan Ott, Paul Phumpiu Chang Sanda Jugo, Orjana Ibrahimi, Samuel Ruben Alexander Garoni, Gemma Torras Vives, Eolina Petrova Milova, and Alexandru Cosmin Buteica.
Background analysis for the report was provided by Dominique Van der Mensbrugghe and Maksym Chepeliev (Purdue University, Global Trade Analysis Project); Penny Bamber and Karina FernandezStark (Duke University); Jacques Villeneuve (French Geological Survey and Geosciences Institute, BRGM); Gang Liu (University of southern Denmark); Konstantin Sommer (University of Amsterdam/ Tinbergen Institute); Soraya Cuesta and Iker Larrea (Global Factor); James Martin, Harry Doyle, Victoria Cherrier, Emma Watkins, Sophie Rippinger, Toon Smets, Nikul Pandya, Fleur Ruckley, and Daren Luscombe (Wood Group UK Ltd); Angel Anguiar, Le (Allan) Wang, Renilde Becqué, Nah-yoon Shin, Nidal Nouhad Mahmoud, Dario Quaranta, and Maria Daniela Cordova Pizarro (FCI); Joanna Kulczycka and Agnieszka Sznyk; Ruslan Zhechkov, Venelina Varbova, Asel Doranova, Iana Stoyanova, Nikolay Sidzhimov, Alexandra Chenaru-Ghenea, and Adriana Gheorghe; Heather Jones, Demetris Psaltopoulos, Philip Van der Celen, Nikša Tkalec, Domagoj Koprek, and Stefan Gospodinov.
Hrishikesh Prakash Patel, Susanna Dedring, and Nigara Abate supported graphics and editing. Anna Karpets, Linh van Nguyen, and Grace Aguilar provided project management support. Oliver Joy led communication and dissemination activities.
Ernesto Sanchez Triana, Mariana Iootty de Paiva Dias, Grzegorz Peszko, Qing Wang, Helena Naber, and David Knight Raffaello Cervigni (World Bank) and Miranda Schnitger (Government Lead, Ellen MacArthur Foundation) were peer reviewers for the activity.
The team is grateful to the following colleagues for their advice and collaboration: Janine Borg, Anna Cameron, and Alice Senga (Secretariat of the European Circular Economy Stakeholders Platform (ECESP), European Economic and Social Council (EESC); Peter Berkowitz and Sander Happaerts (EC DG REGIO); Michel Kubicky (EC DG Grow); Monica Bennet and Daniel del Rio (Global Infrastructure Hub); and Joss Blériot and Miranda Schnitger (Ellen MacArthur Foundation).
The work was carried out under the guidance of Steven Schonberger (Regional Director, Europe and Central Asia), Gallina Vincelette (Country Director, European Union), Arup Banerji (Country Director, Eastern Europe), and Kseniya Lvovsky (Practice Manager, Environment, Natural Resources and the Blue Economy, Europe and Central Asia).

Rising levels of resource consumption have marked the course of human development. Whereas hunter-gatherers survived on averages of 0.5–1 tons of resources per capita a year, agrarian societies prospered on 3–6 tons per head. Today, global average per capita consumption stands at roughly 12.5 tons per year. Over the last century, with widespread industrialization and rapid growth, the global economy has witnessed a surge in material extraction and use. The total amount of materials mobilized between 2000 and 2015 already equals more than half of those extracted between 1900 and 2000. By 2050, global demand for virgin materials is expected to at least double again (Figure ES1).
These trends are expected to accelerate. Persistently high levels of material consumption in high-income countries are accompanied by rapidly growing rates of consumption in emerging economies. Current levels of economic
dematerialization induced by global structural change will not suffice to contain the expected increase in material demand driven by population growth and the convergence in wealth and living standards. Average per capita resource consumption in high-income countries today is as high as five times the average of that in African countries.
Increasing rates of material use have serious sustainability repercussions. Although most materials remain abundant on earth, some— including those critical to emerging sectors such as renewables and electronics—are scarce. Regardless, rising demand leads to ever higher economic costs of extraction, commodity supply shocks, and competition over access to raw materials. But the real sustainability concerns arise from the environmental consequences of extraction, processing, use, and disposal of materials. Extraction and processing involve energy-
Changes in trends for extraction of minerals, non-metallic minerals and metal ores occured post World War 2 and at start of 1970s
1
intensive activities, causing large-scale disruption in ecosystems and water balances and air, soil, and water pollution. The transportation, utilization, and disposal of materials embodied in products (today, about 90 percent of the resources consumed worldwide end up in waste) require environmental sink services causing additional externalities. About 90 percent of total biodiversity loss and water stress impacts and 33 percent of health effects of air pollution are directly linked to resource extraction and processing. As material extraction and use attain ever higher levels, so do the corresponding environmental impacts (Figure ES2).
The global acceleration in material demand has implications for decarbonization targets. The production of goods and services, including food, for the global economy accounts for nearly half of the global greenhouse gas (GHG) emissions.
Addressing emissions from industry can be technologically challenging and costly, particularly in sectors such as iron, steel, aluminum, cement, and plastics, which are associated with hard-to-abate emissions related to high-temperature processes, production emissions, and end-of-life emissions. Previous assessments have shown that circular economy (CE) strategies can cut global emissions by 39 percent, mostly in the construction, transport, and food sectors. About one-third of nationally determined contributions (NDCs) updated and submitted in 2021 mention CE measures.1 2
Over the past decade, material efficiency and resource productivity have surfaced on the global policy agenda. The rise of the CE agenda reflects the objective of moving away from the current systems of production and consumption based on the ‘take-make-use-
https://emf.thirdlight.com/link/w750u7vysuy1-5a5i6n/@/preview/1?o; https://wri-indonesia.org/en/blog/3-steps-tackling-food-lossand-waste; https://www.circle-economy.com/news/circular-economy-strategies-can-cut-global-emissions-by-39; https://www.wri. org/insights/how-circular-economy-can-help-nations-achieve-their-climate-goals.
2 Metabolic analyses show that circular mitigation opportunities can reduce territorial GHG emissions and decrease the aggregate carbon footprint of imported goods and materials (scope 3 emissions) by another 28 percent. Recent reports from Circle Economy, the Ellen MacArthur Foundation, Material Economics, and Shifting Paradigms have pointed to the GHG mitigation potential of reducing excessive resource use and waste disposal. On average about 30 percent of a nation’s carbon footprint is embedded in imported goods and materials. However, efforts to reduce these emissions are poorly incentivized as such schemes usually focus on territorial emissions alone. These embedded emissions can be an important part of a systems approach that aims at reducing GHG emissions since this approach analyzes the full value chain of carbon-intensive products and their potential substitutes.
waste’ linear economic model toward economies centered on minimizing the use of virgin materials without adversely affecting welfare. The focus is on a life-cycle approach to resource management, which starts with reducing raw material demand by looping resources back into consumption and production systems, through innovations in material design, production, and reutilization processes.
In addition to easing the environmental pressures, the circular transition can be a driver of private sector growth. Although there are no ex-post studies to verify the growth and job creation potential of CE, several studies have indicated a link between resource efficiency and productivity gains, driven largely by the underlying level of technological innovation, resulting in production savings. Based on this previous modeling, work has focused on the growth effects of material efficiency gains, with less attention paid to distributional and labor market outcomes of ancillary policies.
This report reviews Europe’s experience in spearheading CE policy. Its aim is not only to highlight its features and accomplishments but also to identify existing barriers to future progress and key measures to overcome them. Its objective is dual: contributing to CE policy development within the European Union (EU) and identifying lessons from the EU’s CE leadership that can be of benefit to non-European countries.
Europe has made important progress in achieving material efficiency gains. Over the past two decades, total material use has decreased by 9.4 percent, from 6.6 billion to 6.0 billion tons. The share of resources used derived from recycled waste increased by almost 50 percent between
2000 and 2020. Overall resource productivity (euro per kg of domestic material consumption [DMC]) increased by nearly 35 percent over the same period. These gains were supported by both exogenous shocks—particularly the impact of the 2008 crisis on material intensive sectors such as construction—and structural change, leading to an increasing share of relatively less material-intensive services in EU total gross value added (VA).
The transition, however, is still in its infancy. More than 87 percent of EU resource consumption still comes from primary materials, and overall EU waste generation keeps increasing. When accounting for the actual material footprint of Europe’s consumption—that is, the resources required along the entire supply chains of, and effectively embodied in, the products consumed in Europe—progress in decoupling growth from material use appears more limited. Europe’s overall resource productivity remains below comparator countries such as the United States, Japan, and the United Kingdom. Although the EU per capita material footprint has stabilized following the 2008 financial crisis, it is likely that it will resume its upward trajectory once growth picks up again.
Progress remains uneven among member states (MSs). The four countries of focus of this report (Bulgaria, Croatia, Poland, and Romania [EU4]) lag on key CE performance metrics (Figure ES.4). Romania has the lowest circular material use rate among EU MSs, while Bulgaria, Croatia, and Poland are also scoring below the EU average. All four rank among the bottom tiers for resource productivity as well as on more basic indicators such as landfilling rates. Despite recent progress, Croatia still landfills over 75 percent of its waste, while at over 60
percent, Bulgaria and Romania have a similar performance as a non-EU country like Albania. While being some of the least resource efficient economies, Romania, Poland, and Bulgaria also display fast growth rates in material consumption.
Local circumstances determine the starting point of the transition. Due to the role that infrastructure plays in total resource use, low population densities typically lead to higher DMC per capita. The structural composition of the economy plays a key role, with economies displaying a predominance of primary sectors typically having relatively higher DMC. To varying degrees since EU accession, the four focus countries have been experiencing outmigration and a transition out of mining—and manufacturing— sector predominance. In addition, per capita income convergence requires catching up with the capital investments feeding growth through material stocks accumulation. Finally, in some of these MSs, a relatively large share of raw material production actually goes toward final products consumed in other countries.
The private sector CE potential is shaped by countries’ economic fabric. In addition to different initial conditions in terms of material flow composition and standard CE performance metrics, sectoral composition determines EU MSs’ readiness to embark on the circularity transition. The four countries of focus share some of the features described above as well as sectors with low circularity potential in terms of CE value added generated and growth rates, largely driven by weak performance in key CE enablers such as technology and innovation and human capital. Countries such as Bulgaria, Romania, and Poland show limited connectivity in their CE production networks, with weak or nonexistent sector links. In terms of sectors with higher circularity potential, the four countries tend to share some commonalities, such as machinery, automotive, food and beverage, and construction for Bulgaria and Croatia, as well as differences, such as the electrical and electronic equipment (EEE) sector in Romania.
OF THE EU MSS IN 2020 Source: Eurostat 2021b, 2022d.
FIGURE ES.5: PERCEIVED CLARITY OF ROLES AND RESPONSIBILITIES AND CROSS-GOVERNMENT COORDINATION FOR CE IMPLEMENTATION
67% 11%
Poland EU-27 avg. 12% 24% 52% 12% 22% 19% 29% 21% 79%
The roles and responsibilities are clear and there is an effective coordination between national, regional, and local governments. Croatia
55% 26%
65% 6%
100%
The roles and responsibilities are clear but coordination between national, regional, and local governments could be strengthened.
The roles and responsibilities are not clear and there is not an effective coordination between national, regional, and local governments.
Catching-up MSs also often display weaknesses in levels of awareness and policy development. Although initial conditions matter in determining the speed of the transition, they do not constitute destiny. While coming from a similar starting point, Slovenia achieved significant circularity gains in recent years in relation to the EU-4 countries, partly due to focused policy attention. Key stakeholders mobilized through the European Stakeholders Platform report a general lack of clarity as to the agencies leading the CE transition in the EU-4 countries (Figure ES5). While national circular economy legislation is emerging across the EU, in catching-up EU MSs, its scope tends to remain heavily focused on waste management concerns (Figure ES6).
materials are generally cheaper than recycled materials. In the plastics sector, for example, virgin materials are often cheaper than recycled ones while large quantities of plastics waste are still landfilled. In the area of critical raw materials, recycling is only economically viable for minerals that have reached a critical mass. In the water sector, low water tariffs prevent the transition to a circular water economy. Sectoral policies still focus on downstream waste management activities, whereas the potential for circular products is
0.5 1.0 1.5 2.0 2.5 3.0 Recovery
Use Consumption Distribution of products Manufacturing Extraction of materials 2.25 2.88 2.25 2.25 2.63
Source: World Bank.
typically set upstream in the design phase. Despite the limitations of recycling, particularly in sectors with fast-growing material requirements (for example, those related to low-carbon technologies), policies incentivizing reduced consumption, intensified product use, and extended lifetimes of products and components are still far from being mainstreamed across products’ life cycles.
Europe’s private sector is already playing a critical role in creating innovative circular business models (CBMs). Most technological and business model innovations across sectors have stemmed from the private sector, although public policies and support, including in research and development (R&D), have certainly played a role. CBMs—those centered on reducing the extraction and use of natural resources and the generation of waste—are already in operation in a number of economic sectors, including plastics, construction, agribusiness, water, textiles, and metallurgy. Existing CBMs tend to focus on recycling, reusing, repairing, refurbishing, and remanufacturing, although increasing instances of more sophisticated business models (product as a service [PaaS]) are emerging (Figure ES7). Despite their degree of sophistication, to the extent that these CBMs displace production from traditional modes (that is, avoiding any associated rebound effects from the transition), they deliver immediate benefits in reducing their environmental footprint—the life-cycle CBMs based on existing products or secondary raw materials typically have relatively small global warming, acidification, and pollution impacts compared to linear business models.
Although several sectors are already experiencing CE’s disruptive potential, CBM innovations tend to remain limited in scale, depth, and speed of adoption. The sharing economy in the hospitality sector is now estimated to be more than double the size of Europe’s traditional hotel economy. The ‘uberization’ of taxi services in major cities has had the same disruptive potential. Industries that have shifted away from one-off product sales toward capital equipment as a service (extractives equipment, jet and ship propellers) have typically recorded higher-thanaverage margins, often through cost savings in maintenance, equipment use optimization, storage/ logistics, and customer capture. In absolute terms, though, CBMs remain peripheral in most markets. Even recycled materials represent only 8.6 percent of raw material input, while remanufactured products take a tiny share of total manufacturing— the proportion of remanufacturing to new manufacturing in Europe is only 1.9 percent. Even producing secondary raw materials from waste only accounts for 30 to 40 percent of the physical output of sectors such as steel, as well as pulp and paper in which it is most established.


Firms face a range of barriers in scaling up and accelerating the deployment of CBMs. Despite their quick development, CBMs remain a small niche across sectors and firms. Limited progress with their introduction is often blamed on technological constraints. Indeed, advancements in recycling, design, and information technologies can in themselves give rise to new CBMs. Stakeholders, however, also point to a different set of

facing firms at different levels of their operating environment, including (a) firm-specific barriers typically under the direct control of firms; (b) those that affect the immediate environment surrounding the firm’s operations, including cross-firm behavior and collaboration along and across value chains and sectors; and (c) economy-wide barriers related to the way entire markets operate (Figure ES8). While interlinked in several ways, some of these— particularly the macro-level ones—shape and reinforce the others.
Corporate cultures, values, and beliefs shape firms’ openness to CBM innovation. Business model innovation requires adequate firm-level capacities, in terms of rethinking product offerings, the customer base, cash flow, and financing streams. Corporate inertia—resistance toward the need to adapt to external environment shifts arising from within firms—can slow sustainabilityoriented business model innovation. Even in leading countries such as the Netherlands, CE innovators within firms are frequently restricted to the corporate social responsibility (CSR) departments, with more
influential departments, such as operations or finance, taking limited interest in it. Companies with markedly ‘linear’ backgrounds will naturally find behavior change harder. Experience shows that business leaders’ commitment and their role in breaking linear inertia is a key enabler in CBM innovation.
Uncertainties related to the novelty of the transition compound risk perceptions and constrain access to finance. As with any new business models, the lack of proven track records can induce innovating companies to be perceived as highly risky. Initial investments to innovate and ‘create’ new markets can lead to short-term margins. Asset valuation in linear systems often does not capture the CBM’s value, particularly in cases of ‘servitization.’
In addition to generally being relatively labor intensive, CBMs tend to require relatively higher skill levels. ‘R’ activities, such as reuse, repurposing, and refurbishing, are more labor intensive compared to their linear alternatives.
Reverse logistics, resource sorting, and product refurbishing all require sophisticated skill sets. Jobs creation through these CBMs is today mostly concentrated in higher-skill categories and will continue to be in the future, with labor market constraints already posing a considerable barrier to firms. The analysis supporting this report shows that labor market effects induced by the transition will have a skills bias, supporting productivity growth but raising challenges for countries with higher concentrations of unskilled workers, such as the four Eastern European MSs examined in the report.
Beyond firm-specific and intra-firm barriers, macro-level constraints limit the private sector’s potential to innovate. Today’s linear economy prospers through economies of scale. It has been sustained by policies designed to develop and optimize the take-make-dispose model for the prevailing production and consumption systems. Regulations, markets, investment tools, and practices, including financial risk assessment, are adjusted to linear models, and externalities linked to linear business models are largely ignored. Publicly funded R&D still essentially caters to linear business models. CE policy today tends to focus on new regulation aimed at filling informational and mandatory standards gaps, which currently constrain CE uptake among consumers and producers. But, in addition to new rules, CE regulatory reforms need to address conflicts with existing regulation across sectors as well as actual adversarial regulation, such as health and safety standards preventing recycled material reutilization. Regulatory action also should consider the downstream needs created in terms of monitoring and enforcement, given the existing shortcomings in achieving mandatory targets and abiding by norms in basic aspects, such as recycling and landfilling.
The price competitiveness of circular products will continue to limit the attractiveness of most CBMs. It is typically cheaper for companies to buy virgin raw materials than to reuse waste materials. In 2020, recycled plastics cost an extra US$72 per metric ton compared with newly made plastic. With commodity prices still failing to internalize their environmental externalities, even an enabling regulatory environment will face hurdles. Regulation will have faster and deeper impacts once circular products can compete
with linear products based on true pricing. But today, not only are the externalities linked to linear business models not taken into account in the pricing of virgin natural resources, they are also directly supported. All major natural resourcebased sectors, starting with fossil fuels, are heavily subsidized—agriculture, fisheries, forestry, water, and mining. In addition to being subsidized directly by government budgetary and tax measures, natural resource extraction is often indirectly supported by trade and other policy instruments, which skews their opportunity cost.
In addition to progress at the country, sector, and firm levels within the EU, the achievement of CE outcomes in Europe depends on dynamics beyond its borders. Trade plays an increasingly significant role in the circularity transition. EU production has become less material intensive over time, but the intensity of material inputs in EU consumption and imports has increased at the same pace as income growth. In addition to direct raw materials imports, the EU also imports materials indirectly, and, in fact, most trade in materials takes place in the form of materials embedded into products. When these are considered, the EU’s dependency on extra EU sources increases from only 11 percent of the EU’s DMC to nearly 36 percent.
While the EU’s dependency on raw materials is concentrated among a relatively small set of export countries, imports of embedded materials originate from a vast number of sources. EU MSs are dependent on just a few trade partners for their direct imports of materials— Brazil, the United States, and Ukraine alone account for about 30 percent of all direct imports of materials into the EU. On the other hand, countries that produce these downstream, material-intensive products and export them to the EU include highto middle-income countries spanning from the most important global manufacturing hubs (such as China and the United States), to other technologically advanced countries (Switzerland and the United Kingdom), to regional hubs in important middleincome countries (Türkiye, Argentina, and Ukraine), but exclude lower-income countries that are just breaking into manufacturing.
Many low-income countries are economically dependent on the EU’s demand for materials.
Many lower-income countries are heavily dependent on the extraction of biomass, metals, and minerals that are exported to the EU. Trade dynamics are expected to witness significant declines in primary metals exports, balanced growth in recycled metals and exports, and significant opportunities in plastics until 2030. The benefits will be reaped by lower-middle-income countries (LMICs) shifting away from commodity production and increasing their presence in new industries, including trade and other services, while also making inroads into recycled copper, recycled steel, plastics, and plastics recycling. Countries with very little market diversification will have limited potential to react and rebound from a sudden contraction in EU demand for materials and will face additional hurdles in capturing opportunities.
The introduction of more stringent regulatory standards may induce production leakage. Regulatory differences have historically been a weak driver of shifts in trade in materials, and the current regulatory shift toward CE is unlikely to cause immediate harm to EU competitiveness. This may change in the future, though, if the gap in regulatory stringency between the EU and the rest of the world widens. Leakage of material-intensive production would mostly settle in capital-abundant economies, which tend to be more developed countries and China. If leaked production settles in jurisdictions with lower environmental standards, EU CE policies risk creating ‘linear production havens,’ which will create additional hurdles in limiting material footprint. This indicates the need for coordinated action across borders and, particularly, for cooperative solutions aimed at reducing the material intensity of production in other capital-abundant countries.
For over a decade, the EU has been at the leading edge of CE policy. The 2011 Roadmap to a Resource Efficient Europe already outlined a set of measures to increase resource productivity and decouple economic growth from resource use and its environmental impact. Since the first EU Circular Economy Package in 2015, the transition to a CE has acquired increased relevance and is today central to the EU’s policy agenda encompassed in the European Green Deal (EGD). The 2020 Circular Economy Action Plan represents the most ambitious and comprehensive CE policy roadmap developed anywhere and
an attempt to break away from previous policies focused on regulatory interventions on end-pipe material streams such as landfilling and recycling, in view of life-cycle approaches and an attention to economic barriers. CE concerns are starting to be mainstreamed across EU policy areas, starting with the 2021 Industrial Strategy update. Most recently, in March 2022, the European Commission (EC) set the stage for regulating circularity requirements of almost all categories of physical goods placed on the EU market, marking a potential step change toward more sustainable and circular products in the EU.
The scale of the challenge justifies the EU’s renewed level of ambition. Business-as-usual (BAU) policies will not suffice to achieve significant reductions in primary material use, which is expected to grow 2.5 times by 2050 compared to 2000—even as European economies become increasingly services based. Europe will be able to maintain the recent trend of resource efficiency gains but not relative, not absolute, decoupling. The shift in the production of material-intensive goods outside the EU borders will continue, leading to an increasing relevance of imported materials in overall resource consumption. Growth rates in material use across the EU reflect different structural conditions of MSs, with those MSs having more recently gained EU accession seeing a 2.5 faster growth in production-based materials than the EU average, reflecting their role in catering to material demand outside their borders.
EU decarbonization policies will influence material use patterns but will be insufficient to achieve substantial efficiency gains. In addition to significantly reducing fossil fuel consumption, mitigation policies taken under the EU Green Deal will affect the use of metal ores and nonmetallic minerals (NMM) by raising their production costs, but to a very limited extent. While critical to reducing CO2 emissions, decarbonization policies will have only a modest impact on primary material use and will need to be complemented by measures targeting materials.
To increase the speed of the transition, Europe needs a far-reaching suite of CE policies. A comprehensive package of CE policies can allow Europe to reduce aggregate material use by a range of 8 to 11 percent relative to the baseline and
achieve absolute decoupling between growth and virgin resource use—all within a decade. Policies will need to target both production and consumption, vary according to the specific material being targeted, and deploy different and complementary instruments, including both regulatory and fiscal measures.
Europe can achieve its CE objective without compromising growth while enhancing environmental benefits. CE will no doubt create economic opportunities and many ‘bottom-up’ studies find CE to be a significant driver of growth. The policy scenarios explored in this assessment all aim to achieve core CE sustainability objectives by reducing and shifting demand, thus incurring some economic costs. But even the most ambitious deployment of policies considered will reduce 2030 gross domestic product (GDP) by only around 1 percent below baseline projections—real GDP is still 13.5 percent higher in 2030 compared to BAU in 2021 under an ambitious CE scenario. This may be considered a minor cost in achieving material efficiency objectives. Moreover, the modeling results presented in this report do not take into account the substantial co-benefits of achieving CE objectives— for example, improved health, reduced congestion, and strengthened natural capital—all of which would be expected to contribute to higher growth and higher welfare.
Comprehensive CE policies will accelerate Europe’s shift toward services sector economies. Implementation of a broad combination of CE policies will have sizable impacts on the structure of Europe’s economy by 2030, with the services sector increasing its share of output by 2.3 percentage points, while industry will fall by a further nearly 1 percentage point and ‘other goods and services’ (including extraction) by 1.6 percentage points. Policies supporting solutions to design out materials from production and product life extension make a particular contribution to the shift toward services. The scale of this structural shift is larger in the EU-4 MSs.
CE policies are likely to have moderately regressive labor market impacts, cushioned somewhat by progressive price impacts. While individual policies have modest labor market impacts, their combination is likely to lead to aggravating the ongoing skills bias in Europe’s labor markets, with unskilled workers experiencing modest welfare loss from expected real wages decline, whereas skilled workers will see unemployment fall and wages rise. However, price changes induced by CE policies are likely to benefit poorer households relative to richer ones, with prices of food, transport, and services expected to fall, while the prices will rise for manufactured goods.
FIGURE ES.9: IMPACT OF COMBINED CE POLICIES ON USE OF PRIMARY MATERIALS IN EUROPE IN 2030 (INDEX 2021 = 100) VERSUS BAU
Country-level distributional impacts can be significant. A higher concentration of unskilled workers in the four focus countries results in greater exposure to declines in unskilled activities. In the case of Poland, the analysis shows a potential real wage decline of up to 5.6 percent. Although skilled workers tend to gain considerably, weaker skills concentrations in these countries result in overall fewer opportunities to benefit from gains in skilled activities. Moreover, skilled workers appear to fare less well in all four countries (compared to Europe overall) under the upstream and demand-side scenarios. Instead, their gains come mainly from the production-side CE intervention scenarios. This reflects the relatively weaker comparative advantage of these four countries in higher-skilled services activities and the concentration of skilled workers in activities that will experience a relative decline under the upstream and demand-side scenarios.
The choice in the use of tax revenues is critical to the outcomes of CE policies. The impacts above assume that revenues raised through CE taxes are distributed back to households. Using CE tax revenues to reduce other taxes that may have distortive impacts on the economy can be more efficient. Using revenue recycling to curtail labor taxes can lead to growth- and welfare-enhancing outcomes. The opportunity to use the substantial
revenues created by CE taxes to reduce labor taxes eliminates GDP losses and reverses negative labor effects—with unemployment for both skilled and unskilled workers now falling, while wages rise— highlighting the opportunity of using CE taxes to support growth and welfare (Table ES1).
The policy framework supporting the circular transition will need to target four dimensions: institutions, information, incentives, and financing. As discussed above, achieving material use reductions in economically efficient and socially inclusive ways requires the deployment of multiple policy instruments. These require policy packages to address concomitantly the role of institutions, information, incentives, and financing.
Achieving absolute decoupling between growth and material use calls for a retooling of government. Without the government’s enabling role, the private sector faces steep hurdles in leading the transition. Despite the novelty of the policy agenda, EU governments are already filling technical gaps and empowering existing or newly created units to support CE-related policies. Feedback gathered from public and private stakeholders, however, shows that governments still have some way to go to incorporate the CE in their
Unemployment rate — unskilled (percentage point change)
+0.20 −0.38
Real wage — unskilled (% change) −0.80 +1.50
GDP (% change) −0.20 +0.20
Consumer Price Index (CPI) (% change) −0.60 −0.70
Primary metals consumption based (% change) −5.10 −4.80
Source: World Bank.
policies and operations. Among the EU-4 countries, only Poland has a CE roadmap with clear priorities and focus areas.
Joined-up horizontal coordination across central government agencies can achieve improved policy coherence for circularity. CE mandates tend to remain confined to departments with remits limited to waste management. With stakeholders across EU MSs pointing to a leadership gap at the national level, the first task of policy makers is to raise the profile of material efficiency goals across agencies. Frontrunners such as the Netherlands have produced governmentwide programs to mainstream CE objectives across sectoral legislation and investments, including through the establishment of institutional
coordination mechanisms to enhance coherence across sectoral policies.
The opportunities and risks brought about by circularity call for close involvement of economic decision-making agencies. The need to deploy economic instruments such as material taxes and circularity subsidies calls for an active role of Ministries of Economy and Finance. In addition, Ministries of Finance typically have the reach and mandate to foster closer collaboration across line ministries. The fiscal and economic impacts of such tools, as well as their necessary modulation to preserve competitiveness and fairness outcomes during the transition, require further coordination with agencies covering social protection and labor market remits. Luxembourg’s CE strategy has
FIGURE ES.11: STAKEHOLDERS’ PERCEPTIONS OF LEVEL OF DEVELOPMENTS OF STRATEGIC AND PLANNING MEASURES
There is a clear Strategy and Action Plan for the implementation of a circular economy transition. There is a clear Strategy but an Action Plan that guides its practical implementation is missing. There is neither a clear Strategy nor an Action Plan to implement it. I don't know.
Source: World Bank.
seen the active involvement of the Ministries of Economy and Finance. This trend is already evident in countries outside Europe, especially those with important trade flows with the continent because of the implications of future regulatory developments.
Policy coherence for circularity needs to include the trade dimension of the transition. The possibility of leakage of material-intensive production toward linear production havens following an increasingly stringent CE policy environment in the EU calls for trade policy instruments to play a key role in addressing both sustainability and competitiveness concerns. International trade policy can be leveraged to support domestic measures aimed at transforming production and consumption patterns. The EU can leverage global value chains (GVCs) to disseminate technology and achieve material efficiency gains in production processes located outside Europe on a global scale while limiting risks of leakage. Given that most leakage takes place in downstream industries (see Chapter 3), designing policies (material taxes or regulatory measures) such that lead firms take responsibility for primary material use and other externalities across the full value chain will be critical to remove the risk that materials are relocated to ‘linear production havens.’ This calls for a growing relevance of CE considerations within trade agreements.
Seeking cooperative solutions through trade and other cross-border policies such as development cooperation appears crucial. Achieving CE gains in Europe will require supporting change beyond its borders. The impact of traderelated measures and the leveraging of lead firms in GVCs will be commensurate with LMICs’ capacities to reorient and upgrade production. Support to LMICs toward investing and diffusing CE technology will provide additional incentives aimed at raising production standards.
Actual implementation will require vertical collaboration with subgovernment tiers. Cities can become engines of circularity due to their regulatory and fiscal remits, responsibilities for key services such as waste and recycling, their role in fostering agglomeration economies, and, not the least, the relative share of final resource consumption taking place within their boundaries. A 2020 survey of 51 cities in Organisation for
Economic Co-operation and Development (OECD) countries showed that most cities still perceive themselves as being in the initial phase of the transition. Enabling and incentivizing cities to make circularity central to their development strategies is a top priority. Empowering cities should start by mainstreaming material efficiency concerns within critical sectors under their mandate such as waste management and recycling as well as in areas such as spatial planning, mobility, and the built environment.
Scaling up material efficiency gains requires coordinated efforts beyond government. Collaborative CE communities, hubs, and networks are needed within and across economic sectors, value chains, and regions. Such mechanisms can help increase the knowledge base, foster sharing experiences on CE policy, innovation and strategies, business models, and projects. Ensuring that supply chains and consumers have the necessary technical skills, finance, and information to respond to the EU’s CE aims requires a nuanced understanding of the interconnected networks currently in place. Decisions made in any market about how materials are extracted, transformed, transported, sold, and disposed of can have far-reaching ramifications.
Policies should aim to minimize coordination costs within and across firms. Despite increasing the attention of Europe’s private sector, CE often remains marginal to corporate considerations even when circularity can have positive benefits on margins and bottom lines. Firms’ cooperation requires information about circular aspects of products exchanged in business-to-business and business-to-consumer transactions—mandatory product information requirements such as material passports or publicly accessible databases can facilitate this. The sharing of data and best practices through knowledge platforms will bring down information and innovation costs. Involving business associations and existing private sector platforms can leverage existing institutional infrastructure to lower networking costs. Publicly supported initiatives triangulating research institutions with firms across value chains and sectors can lead to innovation in upstream and downstream material management.
Source: Adapted from Cramer (2020).
Industrial parks provide a cost-effective means to enhance CE synergies across industry sectors. CE-oriented industrial parks can facilitate interactions between science, technology and business, and upstream and downstream inputoutput links across businesses and sectors. Successful industrial parks provide high-quality, specialized services, with particular emphasis on business incubation, spinoff activities, networking, and logistics. Eco-industrial parks (EIPs) generate material efficiencies by promoting recycling and the reuse of resources and waste through industrial symbiosis in input-output relationships. In the process, tenant firms can achieve more costefficient production, which is also resilient to price fluctuations and resource scarcity. According to estimates, scaling up EIPs could save EU businesses €1.4 billion a year and generate €1.5 billion in sales (Annex 4, Focus Section D).
Supporting firms’ digitization processes is critical to material management innovation. Digital applications are today a key enabler of PaaS CBMs. Digital tools such as artificial intelligence (AI), robotics, and internet of things (IoT) are already being used to optimize production processes, resulting in less waste and reduced emissions. Digitally enabled solutions such as 3D printing can help cut costs and optimize production. Online platforms are already facilitating the reutilization of products, components, and materials by enabling reuse, repair, and remanufacturing business models. Due to their share in Europe’s productive networks and their role in creating and contributing to CBMs,
small and medium enterprises (SMEs) will benefit from policy measures addressing the up-front costs and skills requirements of digitization (Annex 4, Focus Section E).
Firm-level capacities can be supported by tailored skills programs. Due to the relatively higher labor and skills intensity of CBMs, public support to businesses in filling the circular skills gap will be crucial. Measures include (a) dedicated labor market needs assessments of CE development trends, business demand, and existing educational offerings; (b) targeted skills development programs where the market alone does not generate them; and (c) support for coordination across education and industry actors in establishing circular skills development partnerships. Different countries show different levels of readiness at the outset of the circularity transition. While displaying potential, the four MSs targeted by the analysis all lag in terms of skills presence. The ample material efficiency gains that can be reaped in these MSs call for an additional policy and investment focus in this area.
CE metrics should be geared to support transition policies. Today, standard CE metrics provide information on key outcome dimensions, such as waste collection/landfilling/sorting/recycling rates, usage of secondary materials, and domestic materials consumption. While they provide a necessary macro-level view, the level of aggregation of these indicators does not always lend itself to applications by policy makers and companies, even in basic commodities and critical sectors.
Water footprint metrics can guide the identification of efficient and sustainable water production and consumption systems, while metrics for ‘end-ofwaste’ construction and demolition waste (CDW) can enable actors to certify the quality of recycled and reused materials. Better material and sector resolution can allow for measures targeting value chains and material streams. Considering both stocks and flows would provide a more complete picture of countries’ different dematerialization pathways and improve the management of existing material assets. Finally, given that material flow dynamics are slow to change, metrics could better support policies by tracking their ongoing implementation and immediate impacts. Examples of results chain tracking of CE fiscal policies are (a) levels of material subsidies/taxes, (b) price wedge dynamics between primary and secondary materials, and (c) rates of secondary material utilization across sectors. Similar indicator chains can be designed for a range of CE measures, allowing for more regular and just-in-time feedback to decision-makers and citizens on progress.
Removing informational barriers constraining consumer actions is necessary but insufficient in itself. The parameters and benefits of the CE are still largely unknown to consumers, preventing their critical role in accelerating the transition. Policies empowering consumers include awareness-raising measures and tools such as product labeling and standards. Providing transparent and easily accessible information on parameters such as product life span, repairability, and refurbishing options creates consumer choice in relation to linear products. Opportunities for consumers to exercise their preferences will increase demand and send a message to the market, but this will also be insufficient without adequate information to other dimensions, such as incentives.
The lack of supportive regulation constrains the emergence of CBMs on several fronts. Regulatory barriers can be divided into three categories: (a) regulatory gaps lowering CE uptake; (b) regulations related to materials and resources that actually hinder CE goals; and (c) regulatory conflicts across sectors affecting CBMs. Insufficient implementation and enforcement of recycling targets and landfill bans, as well as the lack of
quality standards for repair activities, are examples of regulatory gaps. Adversarial regulations prevent some key CE practices such as those limiting the use of recycled materials in road construction or restrictions regarding cross-country waste trading. Examples of regulatory conflicts include provisions for addressing other policy goals that actually affect circularity objectives such as those addressing health and safety standards—progress on food waste reduction, recycled plastics, and CDW utilization. Starting at the EU level, policy makers can proactively create supportive regulation for the enabling framework for circularity. Addressing regulatory conflicts ahead of bringing new instruments to the table will enhance the impact of the latter.
Addressing the economic distortions that reinforce linear economies can unleash the private sector’s CE potential. The business case for CEs is limited by distorted pricing. Rebalancing the incentives requires a combination of fiscal and regulatory policies targeting both production and demand. As mentioned above, if implemented correctly such policies can redress the regressive impacts of attaining material decoupling, with both growth and welfare enhancing outcomes. A lowhanging fruit here is the phasing out of subsidies to material production and use, starting with fossil fuel subsidies, which reach €55–58 billion a year in the EU, mostly through tax expenditures. Beyond fossil fuels, material production and consumption are subsidized across sectors either directly or through tax deductions/reductions, including in construction (gravel and sand), agriculture, land and forestry, fisheries, water, and, of course, waste.
Circular fiscal reforms shift the tax burden from labor to materials. The introduction and increase of taxes on material production can be coupled with a corresponding, revenue-neutral decrease in labor taxes, with positive effects on growth and welfare. Shifting the tax burden from labor to materials has the potential to address both the market failures induced by linearity and the market distortions generated by labor taxation, which contributes to higher relative use of materials and offshoring (leakage) of production. Taxation also addresses rebound effects stemming directly from increased material efficiencies and indirectly from growth-enhancing policies.
(SCORE 0–5)
0 - 5)
There is ample potential in Europe to consider a circularity tax shift. Current taxation patterns make virgin raw materials cheaper than secondary ones, weaken the business case for CBMs, and constrain public investments in CE. In 2019, the 27 EU countries (EU-27) raised roughly €5.6 trillion in tax revenues—52 percent of those were labor taxes (personal income tax [PIT], payroll, social security contribution [SSC] taxes). The average EU tax wedge in total labor costs is about 39 percent: for every €1.00 in labor costs, €0.39 is taken by Treasury. Conversely, taxes on pollution and resources generated about €10 million—0.19 percent of total tax revenues and 0.08 percent of the total EU GDP.
No circularity-oriented fiscal reform will succeed without phasing out subsidies for material production and use, starting with fossil fuel subsidies. Europe’s experience shows how hard it is to eradicate environmentally harmful subsidies (EHSs). An assessment of the coherence of environmental policy with current subsidies in Italy showed 56 EHS categories that are detrimental to achieving CE objectives, for a financial value of at least €13.5 billion in 2019.
Although the design of any CE-oriented tax reforms will require EU-level coordination, responsibility for their implementation largely remains with MSs. EU-level policy action has long focused on instruments within the EU’s remit, notably regulatory measures backed by information instruments and tools. But the EC’s
2020 CE Action Plan encourages the application of economic instruments. Even in the case of value added tax (VAT), where broad application parameters are set in Brussels, their actual determination and application remains primarily under the remit of MSs. While the reform of VAT regimes to promote CBMs, such as repair services, PaaS, and the utilization of secondary materials, has already seen a limited application, it can be deepened and expanded.
Public procurement can play a key role in making markets for CBMs. Every year, over 250,000 public authorities in the EU spend around 14 percent of GDP (roughly €2 trillion per year) on the purchase of services, works, and supplies. Public procurement plays a key role in creating new markets but also in scaling demand. Today, Public Procurement Directives provide a framework to introduce sustainability considerations, but their voluntary nature makes for a limited uptake within national legislation and the procedures of purchasing authorities. In 2018, 60 percent of public contracts were awarded purely based on lowest-price criteria. The adoption of circular public procurement (CPP) remains, however, incipient in several MSs, including the four focus countries of this report. Policy should address existing constraints to deploying CPP, starting with the limited understanding of the economic benefits of CPP across and beyond government, particularly Budget Departments and legislators, and the systematic utilization of full-cost accounting and lifecycle costing (LCC).
The recent growth in CE financing is promising, and the EU is mainstreaming CE objectives through its different funding programs. The private sector is already paying attention, with commercial financing that flows into CE investments now growing rapidly, particularly in the form of equity and mainly driven by environmental, social, and governance (ESG) considerations. Traditional EU programs, such as the European Structural and Investment Funds, Horizon 2020, and the LIFE Programme, and the more recent Recovery and Resilience Facility (RRF) help integrate CE objectives. Some of the larger commercial banks are stepping up to the challenge, including by reconsidering traditional financial and accounting approaches not adapted to CBMs. While EU governments can perhaps do more to support CE investments, including through guarantee instruments and blended finance solutions, overall, there seems to be no lack of public and private financing opportunities. In fact, the absorption of funds seems to be a problem,
including in EU-4. But financing the CE will not take off in the absence of the reform of policies that continue to support linear models.
The CE calls for a new reform agenda. Promoting CBMs without dismantling the linear economy and the policies supporting it is inefficient and insufficient. It may well continue to foster the emergence of niche markets and products, but it will remain inadequate in decoupling welfare creation from material consumption. The circularity transition will proceed through incremental steps. More than by technological progress, its pace will be dictated by the removal of the institutional, informational, and incentive barriers limiting the profit-making opportunities brought about by CBMs and their wide adoption. Europe is already showing that the case for the transition no longer needs to be made and an acceleration is possible. Through comprehensive policies, the EU will achieve its circularity ambitions while creating growth and welfare and promoting resource efficiency progress beyond its borders.

Making the case for the circularity transition
Global economic development has proceeded hand in hand with material use. Over 96 billion tons (96 Gt) of natural resources were used by production and consumption systems globally in 2019. Nonmetallic minerals (NMM), such as sand, gravel, and limestone used in construction, particularly for infrastructure, account for about half of this, with the rest being taken by biomass (27 percent), fossil fuels (17 percent), and metals (10 percent). The evolution of human economies took place through steady increases in material per capita use. Hunter-gatherer systems developed and thrived on averages of 0.5 to 1 metric ton per capita, and agrarian societies prospered on 3 to 6 tons per head. Today, the global average per capita consumption stands at roughly 12.5 tons.3
Rapid and increasingly material-intensive growth over the past century has driven a surge in material extraction and use. Industrialization marked a step change in material consumption. The past century saw a fourfold increase in global population and a 23-fold increase in economic output. Economic growth was characterized by a relatively high resource elasticity of gross domestic product (GDP), with a
1.0 percent increase in GDP leading to an increase of about 0.8 percent in material consumption, both in high-income and low-income countries. The decades after the Second World War, particularly since the 1970s, witnessed a threefold increase in global materials’ harvesting. Roughly one-third of all materials extracted globally since 1900 were only mobilized between 2002 and 2015 (Figure 1.2).4
Global convergence in wealth and living standards, coupled with population growth, is expected to at least double demand for materials by 2050 (Figure 1.2). In addition to its historically strong correlation with income, material consumption tends to rise in line with other determinants of progress such as human capital and life satisfaction, albeit in a less linear fashion (Figure 1.3), as the quality of services delivered to society is frequently dependent on both material stocks and flows (Chapter 2).5
The expected economic dematerialization induced by global structural change will not suffice to contain the global surge in material demand in the coming decades. Material efficiency improves in line with technological progress and a higher share of services in the economy. Projections indicate that the growing
Source: Global Infrastructure Hub 2021.
3 Krausmann et al. 2009; Global Infrastructure Hub 2021; Halberl et al. 2009; IRP 2019.
4 Haberl et al. 2020; IRP 2011; Krausmann et al. 2018; OECD 2019.
5 Carmona et al. 2020; IRP 2017.
Changes in trends for extraction of minerals, non-metallic minerals and metal ores
post World War II and in early of 1970s
Source:
Commission (EC) Joint Research Center.
Human Development Index, Happiness Index, GDP per Capita
1.0 0.9 0.8 0.7 0.6 0.5 0.4 0.3 0.2 0.1 0.0
Source: World Bank data.
Real Material Consumption, per Capita, Tons
Human Development Index GDP per Capita Log. (Happiness Index)
Happiness Index Log. (Human Development Index) Linear (GDP per capita)
share of the tertiary sector in the global economy will reduce growth in material use by unit of GDP, as it is less material intensive than agriculture or industry. This effect is expected to be coupled with the impact of technological developments helping to delink growth in production levels from the material inputs to production. This would lead the global economy’s material intensity declining at a rate of 1.3 percent per year on average in the coming decades, reflecting relative decoupling. This means that economic growth is happening faster than growth in resource extraction. However, absolute decoupling (total material use falling while the economy grows) has not yet been observed, even in advanced economies, particularly once materials embodied in imports are considered. The result is that, although not as fast as GDP, use of global materials will continue to increase as countries achieve higher levels of income.6
The linear business as usual (BAU) carries sustainability, security, and equity implications. Natural assets remain the key foundations of our prosperity and well-being, but our economic model is increasingly predicated on their erosion. In a linear economy, the production of goods and services comes at the expense of ecosystems and the vital services they provide such as biodiversity; resilience to extreme weather events; and clean air, water, and soil. The great acceleration in material resource extraction and consumption has long been identified as being responsible for major shares of today’s environmental burden. Material management—the extraction, production, transformation, transport, consumption, and disposal of materials used to make products and infrastructure—today accounts for 90 percent of total biodiversity loss and water stress impacts and 33 percent of health impacts due to air pollution.
Natural resource management significantly contributes to global greenhouse gas (GHG) emissions. The production of goods and services, including food, for the global economy accounts for
6 OECD 2018a.
7 Mcilgorm et al. 2022.
nearly half of the global GHG emissions. Addressing GHG emissions from industry can be technologically challenging and costly, particularly in sectors such as iron, steel, aluminum, cement, and plastics, which are associated with hard-to-abate emissions related to high-temperature processes, production emissions, and end-of-life emissions. In the food system, food waste is a major source of GHG emissions. In fact, it is estimated that if food waste were a country (including food lost in supply chains and food wasted by retailers and consumers), it would be the third largest GHG emitter in the world. An increasing focus on material efficiency and circularity will help align the emissions trajectory of these sectors with the goals of the Paris Agreement.
Waste is a major cause of public health, environmental, social, and economic costs. Globally, inadequate solid waste management contributes to climate change—accounting for about 5 percent of global carbon emissions—and plastic pollution, which has caused damages to the marine environment estimated at over US$21 billion per year.7 Locally, solid waste harms public health, putting millions at risk due to soil and water contamination and poor air quality. Solid waste generation is set to double in large and mediumsize cities by 2050 and triple in the world’s poorest countries.
Reducing material consumption leads to less pollution, waste, and related health impacts and is key to preserving vital ecosystem services and natural resources, including biodiversity. In the linear system, products eventually end up as waste, most of which is landfilled or incinerated. For instance, the world generates around 400 million tons of plastics waste annually as well as 54 million tons of electronic waste,8 which becomes hazardous to human health and ecosystems when mismanaged. One of the principal aims of the circular economy (CE) is to minimize waste and pollution by returning products, materials, and resources into the product cycle at the end of their use. Reducing waste and pollution and associated negative environmental impacts will thus have substantial benefits for public health,
8 UNEP https://www.unep.org/interactives/beat-plastic-pollution/#:~:text=Today%2C%20we%20produce%20about%20300,of%20 the%20entire%20human%20population.; Ellen Macarthur Foundation https://ellenmacarthurfoundation.org/topics/biodiversity/ overview; Forti et al. (2020).
(2000 = 1.0)
Iron and Steel Aluminium Copper Zinc, Lead, Tin, and Nickel Gold, Platinum, and Silver
Source: UNEP 2019.
Note: Metal mining covers 10 metals meeting more than 95 percent of global extraction of metal ores.
including through designing out toxic chemicals. In addition, it is estimated that the extraction and processing of natural resources is responsible for more than 90 percent of biodiversity loss. Decreasing the need for virgin materials can thus make a major contribution to healthy ecosystems and biodiversity preservation.
The objectives of several international environmental agreements revolve around the achievement of material efficiency gains. There is currently no international environmental agreement specifically dedicated to the CE, even though the Sustainable Development Goals (SDGs) contain several targets and indicators aimed at increasing circularity under SDG 12. Indeed, circularity will be required to achieve the visions and goals of numerous international environmental agreements, particularly those related to the elimination of toxic substances and waste. For example, the Basel, Rotterdam, and Stockholm (BRS) Conventions aim to protect human health and the environment from hazardous chemicals and wastes. The Basel Convention is the only global legally binding agreement that specifically
addresses plastic waste and has been instrumental in generating momentum to launch negotiations for a new treaty to end plastic pollution. Similarly, chemical safety as promoted by the Strategic Approach to International Chemicals Management (SAICM) will require improving chemicals management through the adoption of circularity in chemistry and its products. Further links exist with the Montreal Protocol, for example, through designing out ozone-depleting substances (ODSs) and increasing the lifetime of refrigeration and air conditioning appliances, and with the Minimata Convention, where the elimination of mercury from industrial activities aligns with the circularity principle of designing out toxic materials.
crossing of key planetary boundaries has material use as its main driver 9
The immediate limits to current levels of virgin materials stem from their environmental impacts, particularly when considering the potential irreversibility of some of these impacts on natural ecosystems, biodiversity, and climate trends. Based on today’s production technologies and resource demand patterns for major metals, global
9 Allwood et al. 2011; IRP 2019; Klee and Graedel 2004; Rockström et al. 2009; Steffen et al. 2015.
Source: Stockholm Resilience Center, based on Steffen et al. (2015); and Persson et al. (2022).
production will need to be reduced by 40 times compared with 2016 levels to keep within safe earth system boundaries.10
In addition to sustainability concerns, ballooning resource consumption compounds risks from commodity supply shocks, with worldwide trade and economic security implications. Many basic materials such as iron ore as well as NMM are generally available and remain abundant in the earth’s crust, albeit at lower and decreasing concentrations than the deposits mined today. But concerns around resource constraints cannot be dismissed. Extraction rates for NMM—including sand, gravel, and clay that are used in large quantities to produce concrete, asphalt, and glass for infrastructure and account
for the largest proportion of global material consumption—are rapidly increasing. In a world of increased competition over resource access and ever higher rates of extraction, both advanced and emerging economies face supply risks. The COVID-19 pandemic compounded the already existing exposure of both advanced and emerging economies to commodity markets volatility and supply chain and price shocks (Figure 1.6). More importantly, several raw materials that are ‘critical’ to emerging sectors (such as renewables and digital industries) as well as established ones (such as machinery, vehicle parts and standard electronics) are actually rare. Manufacturers are running increasing supply risks because of their dependence on rare earth metals such as cobalt,
10 Steinman et al. (2017) argue that resource use accounts for more than 90 percent variation in environmental damage indicators across countries. Van der Voet, van Oers, and Nikolic (2004) show a tight coupling between aggregate mass flows and ecological impact.
MAKING THE CASE FOR THE
tungsten, tantalum, tin, indium, bauxite, and copper, which are ultimately finite, nonrenewable resources, whose remaining reserves are increasingly located in remote or protected locations.11
Current patterns of resource consumption reflect the growing divide between and within countries. On average, each human being consumed 8 tons of materials in 1980, 10 tons in 2009, and over 12 tons today. But per capita consumption levels are increasingly uneven across countries and income brackets. North America’s average stands at 21.94 tons compared with Africa’s at 4.76 tons. The wealthiest billion people on the planet consume 72 percent of the world’s resources, while the poorest billion consume less than 1 percent.12
Once measured in terms of global material stocks dynamics, rather than yearly flows, the materials divide is even starker. The extent of resource extraction needed for developing countries to match high-income countries’ material endowments is staggering. Between 1900 and 2010, industrial countries held the largest share of global material stocks, essentially embodied in fixed capital assets, such as buildings and infrastructure.
11 Valero and Valero 2015; Van Vuuren, Strengers, and De Vries 1999
12 IRP and UNEP 2018.
By 2010, countries outside the Organisation for Economic Co-operation and Development (OECD) group and China had a share of only 18 percent of global stocks, whereas their share of the global population was 62 percent. Although the share of global materials stocks held by industrial countries is slowly decreasing in line with the rapid acceleration in stocks held by emerging economies such as China (by 2010 China already owned 22 percent of global stocks), developing countries’ share in the global stock of materials is projected to continue to remain limited based on current flows, with large differences in per capita stocks continuing to exist between industrial and emerging countries, on the one hand, and developing countries, on the other (Figure 1.8).
Addressing the growing environmental, equity, and economic security imbalances brought about by material consumption patterns requires breaking away from traditional production and consumption systems Our economy is based on a linear model of extraction, utilization, and disposal (also known as takemake-use-waste model, Figure 1.10) of resources. Globally, the amount of materials embodied in
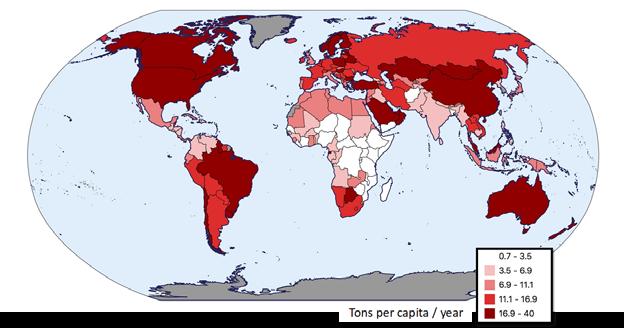
Source: Based on data from United Nations (UN) Statistics Division.


Source: Krausmann et al. 2017.
products discarded after reaching their end of life is expected to increase by 70 percent by 2050, largely outpacing population growth. This is far from being solely a solid waste management problem. With roughly 90 percent of the raw materials used in manufacturing becoming waste before the final product leaves the production plant and about 80 percent of products manufactured being
13 Ellen MacArthur Foundation 2021a; World Bank 2018.

disposed of within the first six months of their life, it is estimated that 80 percent of a product’s environmental impact is determined during the design phase. This indicates that the solutions require a transformation of the entire operating system, not just at the end-of-life disposal of resources.13
Smarter product use and manufacture R0
Make product redundant by abandoning its function or by offering the same function with a radically different product R1 Rethink R2 Reduce
Extend lifespan of product and its parts R3 Reuse
R4
Re-use by another consumer of discarded product which is still in good condition and fulfills its original function
Repair and maintenance of defective product so it can be used with its original function
R5 Refurbish Restore an old product and bring it up to date R6 Remanufacture Use parts of discarded product in a new product with the same function
R7 Repurpose Use discarded products or its part in a new product with a different function
Useful applications of materials R8 Recycle Process materials to obtain the same (high grade) or lower (low grade) quality R9 Recovery Incineration of material with energy recovery
Source: Adapted from Potting et al. (2017) and Morseletto (2020)
Linearity implies that by 2060 we will need at least two planets to meet the demand for materials. Unless prosperity can be dramatically decoupled from resource use, environmental pressures, economic risks, and inequality will continue their rise, and an increasing number of tipping points will rapidly be crossed. The rise of the CE concept responds to a growing consensus of the relevance of these trends.
A CE aims at creating welfare while minimizing the production, consumption, and disposal of materials. CE-related policies, investments, and business models strive to maximize resource efficiency by organizing production-consumption systems into closed loops, thereby reducing extraction, waste, and related environmental pressures.
Current definitions of CE tend to articulate complementary objectives: (a) preserving the value of products, materials, and resources for as long as possible; (b) phasing out waste by
intervening at the different stages of the product life cycle, including during design and production; (c) avoiding inefficiencies, thereby inducing resource savings within the whole productionconsumption cycle; and (d) encouraging innovation through new business models that minimize the negative environmental externalities associated with extraction, production, and consumption processes.14 Its conceptualization has evolved by extending end-of-pipe waste management approaches centered on the 3Rs rule (reduce, reuse, and recycle) to more extensive and finegrained frameworks encompassing upstream consideration of materials, such as the 9Rs hierarchy adopted by the Ellen MacArthur’s Foundation, which further articulates the hierarchy of circularity and has become a benchmark (Figure 1.10).15 Given that material management accounts for up to two-thirds of global GHG emissions, the CE can play a key role in climate change mitigation. In industry, circularity can cost-effectively reduce GHG emissions, which are considered hard to abate—particularly in the production of iron, steel, aluminum, cement, and plastics.
14 A 2017 metareview counted more than 114 definitions of CE (Kirchherr, Reike, and Hekkert 2017). Among the most known is the one by the Ellen MacArthur Foundation (2013) which frames CE as “an industrial economy that is restorative or regenerative by intention and design.” For an overall discussion, see Kirchherr, Reike, and Hekkert (2017).
15 Cramer 2014.
Source: Based on BoI (2020).
In addition to easing environmental pressures, the circular transition can be a driver of private sector growth. Although there are still very few ex post studies to verify growth and job creation potential of CE, technological innovation in resource efficiency can lead to productivity gains. What is certain is that the goal of decoupling natural resource extraction and use from economic output has already led to a range of concrete business applications aimed at closing resource utilization loops, slowing down material use, as evidenced by the growth of repair and remanufacture services, the birth of the sharing economy,16 or quite simply by an uptick in recycling and reuse rates. Today, an estimated 8 percent of the Dutch workforce is employed in CE jobs, with the biggest concentration in activities that preserve and extend the value of materials already in use, such as reuse and recycling.17
Despite the promise of multiple environmental and economic objectives, actual progress on the ground remains slow. Indeed, by some measures, the global ‘circularity gap’ is growing. The global rate of recycling—the most elemental level of the circularity hierarchy, for which technologies are largely available—is still limited, at just 13 percent. Even perfectly and infinitely recyclable materials are lost every day to landfills. About 22 percent of all copper ever mined has been landfilled, only 75 percent of aluminum ever
produced is still in use today, and 7 million tons of potentially recyclable aluminum is lost to landfills every year, particularly through consumer products. Overall, the adoption of circular business models (CBMs) remains in its infancy.18
A range of theoretical weaknesses often go unaddressed in the mainstream description and promotion of CE. This further adds to the complexity of the concept.
• Despite the attempts to articulate the concept of circularity through a more refined hierarchy of actions, the diverse definitions of the different Rs that exist within the discipline add to the fuzzy conceptualization of the CE agenda.19
• Perfectly closed material loops are ideal archetypes. Today technology allows certain materials (glass and aluminum) to be fully recyclable, but even zero waste advocates recognize that a share (up to 10 percent) is nonrecyclable/non-compostable/nonreusable.20
• Rebound effects expected from resource efficiency gains are often not considered.
• While being over-conceptualized, CE is currently ‘under measured.’ The flurry of CE dimensions is matched by a dearth of attention to classifying and measuring material stocks and flows in CE metrics reports.
16 The sharing economy means different things to different people. In one of its accepted meanings, the sharing economy is a system of renting and a service economy as a shift from a system of selling and buying to just utilization of products (Stahel 1986; Zhu 2010). The suggested system will reduce resource needs and the wasted and lower production capacity will be compensated by the creation of a new service economy (PaaS) which has been heralded as an effective instrument for moving society toward resource efficiency (Tukker 2015).
17 Circle Economy 2017; EC 2019a; IISD 2020.
18 Circle Economy 2020.
19 Reike, Vermeulen, and Witjes 2018.
20 Hestin et al, 2010.
12 Sustainable Consumption and Production
2 Zero Hunger
3 Good Health and Wellbeing
6 Clean Water and Sanitation
CE practices decoupling economic activity from resource use and associated environmental and social impacts are at the heart of this goal.
SDG target 12.3 pledges to reduce food losses along production and supply chains, including post-harvest losses. Regenerative agricultural practices are key to reducing malnutrition and eliminating hunger.
Circular mobility solutions can cut urban air pollution and provide low-carbon mobility. Toxic waste and industrial effluent reduction has a direct impact on population health
CE practices such as small-scale water purification, sustainable sanitization, waste water treatment, water reuse and recycling, nutrient recovery, biogas systems, and so on can help increase access to safe drinking water and equitable sanitation, reduce pollution, and improve water quality.
7 Affordable and Clean Energy
8 Decent Work and Economic Growth
9 Resilient Infrastructure
11 Sustainable Cities and Communities
14 Life below Water
The shift to renewables and increased energy efficiency are examples of circularity in the use of energy resources.
CBMs can generate efficiency savings. Waste valorization can generate higher-value green jobs.
Very high resource efficiencies required due to the large share of materials embodied in infrastructure
Cities account for 75% of global natural resource consumption, 78% of energy, 60–75% of GHG emissions, and 50% of waste generation. Because of their remits, cities are key actors in designing and implementing material efficiency interventions.
Preventing waste generation and leakages from land-based activities through CE practices will directly reduce waste entering the oceans. This also includes recovery of nutrients from wastewater streams before entering oceans. Additionally, CE contribution to tackling climate change will indirectly reduce ocean acidification.
Source: Schroeder et al. 2019.
Despite such shortcomings, the mounting awareness of the need to transition away from ‘linear’ economic models has placed CE within the realm of mainstream sustainability policy. With CE approaches increasingly seen as central to the achievement of various SDGs, starting with SDG 12 on Sustainable Consumption and Production (Table 1.1), entities such as the Group of Seven (G7) and the Group of Twenty (G-20) have made it the centerpiece of their work programs.21
21 Schroeder et al. 2019.
But its actual application remains nascent. Explicit CE policy development only dates back to the late 1990s, with the early application of closed-loop thinking in Germany22 and Japan.23 China has in many ways been a frontrunner in considering the policy implications of the concept, with a first strategy developed in 2003 and then later developed and extended within several fiveyear plans.24 But the transition clearly requires systemic changes that only powerful, disruptive, and steadily implemented measures can trigger.
22 Germany’s 1996 ‘Closed Substance Cycle and Waste Management Act’ made both producers and consumers responsible for recycling, reuse, and dispose of waste “in order to conserve natural resources and ensure environmental sustainability.”
23 Bangert 2021.
24 Mathews and Tan 2016.


The challenges that national and local policy makers face in building CEs are mostly not of a technical nature. They are rather economic and institutional in nature. Information and accountability frameworks, normative and legal tools, and collaboration platforms have been built to suit linear models; institutional and cultural inertia hinders change and maintains the status quo or leads to uncoordinated and fragmented approaches; and externalities are not factored into material resource pricing, inevitably leading to linear preferences. In this light, the achievement of substantial materials efficiency gains seems to have all the hallmarks of a super-wicked policy problem25 (Figure 1.11).
The circular transition will require countrylevel attention. Most of the existing analytical and policy work has a global or business/sector focus, with relevant studies mostly utilizing a case-by-case or sector-by-sector approach, without considering systemic interdependencies. The progress of circular models of production and consumption will largely revolve around country-level and local
actions underpinned by coherent and operational policy frameworks. Opportunities for closing the resource loop are highly contextual, depending on what drives an inefficient resource cycle within a country. Actions should be designed around those drivers. Progress is also constrained by multiple barriers, including policy biases providing advantages to linear economic models, and the mix of regulatory, economic/fiscal, and soft tools needed to shape economic actors’ incentives to overcome such barriers, which are largely country specific. Although the willingness and capacities to shape such incentives lie primarily within the realm of national policy making, an adequate level of action and attention by national governments is still missing.
Lastly, CE policies have implications for the developing world. The CE can often be dismissed as a high-income country policy problem. In many ways, it is—wealthy countries bear a disproportionate share of materials consumption and its environmental and economic spillovers.
Original elaboration for this publication.
At the same time, the environmental impacts of linear economic models are felt globally and often, primarily, in lower-income countries. Conversely, while the current distribution of material flows and stocks has global equity implications, material efficiency policies implemented by high-income countries will inevitably have repercussions beyond their borders.
This report proposes a policy framework to bridge the gap between envisioning and implementing the circularity transition. Its main aim is to contribute to the development of reforms and investments accelerating CBMs and limiting linear ‘take-make-use-waste’ activities. The focus is on the EU and its MSs, with particular attention paid to Bulgaria, Croatia, Poland, and Romania (EU4). The EU is a frontrunner in the CE agenda and plays a global role in ‘exporting’ it, through both the sheer weight of the single market and its role as a global environmental standards maker. The report showcases the EU’s significant achievements as well as aspects to consider for accelerating the circularity transition, with a view to contributing to policy development inside the EU and sharing lessons with countries outside the bloc. The report therefore targets not only EU policy makers but also a global audience willing to learn from the EU’s experience.
This report is structured in six chapters, complemented by an annex with sectoral deep dives and focus sections dedicated to thematic issues.
Following this introduction, Chapter 2 gives an overview of the state of circularity in the EU. It shows that significant resource efficiency gains have been achieved over the past two decades and the EU has mainstreamed resource efficiency and CE principles into its policy. However, progress among MSs is uneven and needs to accelerate to contain the environmental impacts of Europe’s resource consumption.
The role of trade in making or breaking the circularity ambitions of the EU is introduced in Chapter 3. The chapter describes the impacts of the potentially widening gap in regulatory stringency between
the EU and the rest of the world and provides recommendations on how possible negative effects can be overcome through trade and aid policy.
The role of the private sector in driving the transition is addressed in Chapter 4. While it is already an engine of CE innovation, the private sector is still confronted with barriers at different levels. If companies are to scale up CE-related investments, removing these barriers is the policy priority for governments.
Chapter 5 addresses the economics of the transition to a CE through a computable general equilibrium (CGE) modeling exercise. It shows that neither BAU nor limited measures will achieve substantial efficiency gains. However, a comprehensive suite of targeted policies can reduce Europe’s resource use at very little economic cost or in ways that are both growth and welfare enhancing, depending on how new fiscal revenues are used.
Chapter 6 proposes a policy framework for the circular transition, drawing on the preceding analysis. The framework is built on four key policy pillars (institutions, incentives, information, and financing) critical to addressing the barriers to accelerating Europe’s progress in achieving materials efficiency and circularity objectives.
The report is based on different methodological approaches. Most of the research is based on the analysis and elaboration of official data as well as desk research and a literature review, including a review of policies, strategies, and action plans. In addition, a survey has been conducted among key stakeholders in the CE in various EU MSs, the results of which are integrated into the different chapters. Results on the economics of circularity (Chapter 5) and partly of the trade implications (Chapter 3) are based on a unique global CGE exercise using the ‘environmental impact and sustainability applied general equilibrium’ (ENVISAGE) model. This model was calibrated on the extended Global Trade Analysis Project Circulatory Economy (GTAP-CE) database, which includes both primary and secondary activities for key materials. The geographical coverage of the modeling exercise included the 27 EU countries (EU-27), European Free Trade Association (EFTA) states (Iceland, Liechtenstein, Norway, and Switzerland), and the
United Kingdom. In the rest of the report, the terms ‘EU’ and ‘Europe’ are used interchangeably unless otherwise stated explicitly.
The report does not aim to provide a comprehensive treatment of challenges and potential solutions. The complexity of the circular transition and its systemwide nature cannot be easily covered within a single piece. The report does
not cover all economic sectors. It does not delve into micro-level processes related to technology and engineering constraints and opportunities nor does it provide an exhaustive treatment of regulatory landscapes. Nonetheless, it provides insights on the direction of travel of the EU and its MSs and recommendations to accelerate the transition.
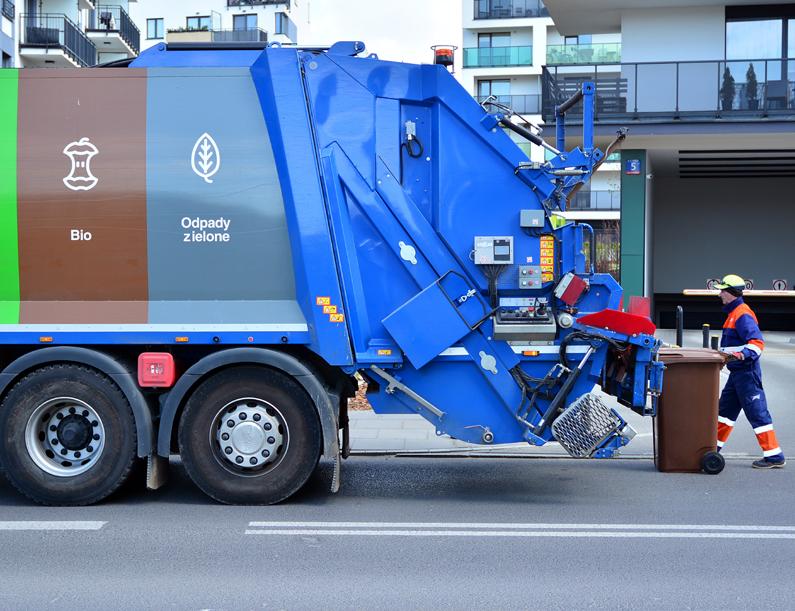
Since 2008, the EU has made important progress in its transition toward a more material-efficient economy. Dematerialization is caused by both endogenous and exogenous drivers and is differentiated within and across MSs. EU MSs, including the four countries of focus in this study, show different initial conditions in embarking on the CE transition, in terms of economic structure and capacities. Such heterogeneity will emerge as an opportunity for achieving further materials efficiency gains, but it is also a challenge for implementing the increasingly ambitious direction being set by the EU’s CE policy.
Since 2008, the EU has made significant progress in increasing its resource productivity. Europe’s economy depends on virgin materials for about 87 percent of its material consumption, but it is increasingly becoming more resource efficient. Its circular material use rate— the share of resources used derived from recycled waste—increased from 8.3 percent in 2004 to 12.8 percent in 2020. Domestic material consumption (DMC), the annual quantity of raw materials extracted in the EU plus all physical imports minus all physical exports, is also decreasing. DMC 26 Eurostat 2021b. 27 Eurostat 2021c; OECD 2022.
went down by 9.4 percent, from 6.6 billion tons in 2000 to 6.0 billion tons in 2020 (Figure 2.1). DMC increased consistently between 2000 and 2007, decreased sharply after 2008, and has since flattened out after 2012.26
Europe’s resource productivity is improving but remains below peer countries. Between 2000 and 2020, Europe achieved absolute decoupling of economic growth from domestic resource use. DMC decreased by 9.4 percent while the economy grew by 22.5 percent (Figure 2.1). As a result, EU resource productivity improved by 35.2 percent, from €1.19 per kg of DMC in 2000 to €2.23 per kg in 2020. Despite such progress, the EU’s resource productivity remains slightly below comparator economies (Figure 2.2), although it is significantly higher than emerging economies such as China.
Reduced rates of DMC have been accompanied by increased waste generation. Overall EU waste generation (excluding major mineral waste) continued to increase at an average annual rate of 4.2 percent between 2004 and 2018, reaching 812 million tons. Despite progress in recycling rates in key waste streams (Figure 2.4), the EU still recycles less than half its total waste generation (2016) and large differences remain across MSs (Figure 2.3).27
particularly construction. Due to its relatively low resource productivity, the sector’s contraction led to an improvement in overall resource productivity. EU dematerialization was supported by the transition toward renewable energy and away from fossil fuel consumption, which decreased by 32.2 percent during the same period. Europe’s structural shift away from manufacturing and toward less material-intensive services—the contribution of the services sector to EU total gross value added (GVA) increased from 71.0 percent in 2005 to 73.1 percent in 2020—was a second driver. Finally, increased rates of material-intensive production outsourced outside of Europe reduced domestic material consumption, as imports of finished or semifinished products typically weigh less than the total raw materials used to produce them.28
Source: Eurostat 2022d; OECD 2022.
The transition to a CE does not proceed homogeneously. Vast differences characterize the progress achieved by EU MSs. The Dutch economy recorded the highest circular material use rate (31 percent), followed by Belgium and France. Other Western European member states (MSs) such as
FIGURE 2.3: MUNICIPAL WASTE RECYCLING RATES
Source: EEA 2021.
Material efficiency gains have been supported by a number of drivers. In addition to demand contractions induced by economic shocks, decreasing DMC was driven by structural change and the outsourcing of material-intensive production beyond Europe’s borders. The 2008 global financial crisis severely affected material-intensive sectors, 28 Eurostat 2021d.

Tons per capita
Most Recent Value* 2017: Bosnia and Herzegovina 2018: Turkey, Albania 2019: Iceland, Norway, Switzerland, Serbia, United Kingdom and North Macedonia 2020: Rest of values

Portugal (2.2 percent) and Ireland (1.8 percent) were among the worst performers. The four countries of focus in this report show large potential for further circularity gains. Romania (1.3 percent) had the lowest circular materials use rate among EU MSs. But Bulgaria (2.6 percent), Croatia (5.1 percent), and Poland (9.9 percent) also score below the
EU average. Resource productivity follows similar patterns of variation between EU MSs, with the highest-performing country, the Netherlands, displaying almost 14 times higher resource productivity than that of the most under performing country, Romania.29
Circular material use rate (%)
Netherlands Belgium France Italy Estonia Luxembourg Czechia Germany EU-27 Slovenia Austria Spain Poland Hungary Malta Denmark Sweden Slovakia Finland Greece Croatia Lithuania Latvia Cyprus Bulgaria Portugal Ireland Romania
30.9 23 22.2 21.6 17.3 13.6 13.4 13.4 12.8 12.3 12
0 5 10 15 20 25 30 35
Sources: Eurostat 2021b, 2022d.
Material consumption varies between, and within, MSs. DMC per capita between MSs ranges from 7.4 tons per capita to 31.3 tons (Figure 2.6). Structural characteristics play a role. Low population density (Scandinavia) is a key driver of DMC rates, because of the relatively larger material requirements for infrastructure, for example, roads and energy, serving relatively smaller numbers of people living in these regions. The relative importance of primary sectors such as mining and forestry as well as downstream industries such as pulp production and a higher dependence on fossil fuels for electricity generation are often determining factors in Eastern Europe countries.30
Initial conditions matter in determining the speed of the transition, but they do not constitute destiny. Although income levels and the share of the services sector in the economy are important drivers, they are not determining factors. Slovenia provides an example of vision and policy playing a role in moving an economy toward circularity from initially unfavorable conditions. The
30 ESPON 2019.
2020
Resource productivity (Euro per kg.) 5.4 5.0 3.7 3.3 3.3 3.3 3.0 2.9 2.3 2.2 2.2 2.1 1.8 1.7 1.7 1.4 1.4 1.4 1.3 1.2 1.2 1.1 1.0 0.9 0.8 0.7 0.4 0.4
Netherlands Luxembourg Italy France Belgium Ireland Germany Spain Austria EU-27 Denmark Malta Sweden Greece Slovenia Slovakia Czechia Finland Cyprus Portugal Latvia Croatia Hungary Lithuania Poland Estonia Bulgaria Romania
0 1 2 3 4 5 6
country underwent a similar economic transition to the four focus countries of this report but has achieved significant circularity gains in recent years. From a nearly all-landfilling economy, it moved to a predominantly recycling society by making circularity a national priority and developing a solid CE framework with advanced national policies and contributions from local and regional authorities. As a result, Slovenia is now a frontrunner in separate waste collection and recycling rates. Municipal waste recycling rates are above the EU average and the country scores second place at the EU level with a recycling rate of 59.2 percent.
Current levels of in-use stocks shape resource consumption rates. In-use materials stocks31 in buildings, infrastructure, machinery, and equipment of all four focus countries are also increasing (Figure 2.7), albeit at varying levels. Between 1990 and 2019, absolute stocks’ growth recorded average annual growth rates between 0.2 and 1.5 percent. Bulgaria’s in-use materials stock decreased until 2003 but started growing thereafter. Growth of
31 In-use stock is defined as the matter within any final commodity with a positive or economic value that is used by a human population (Gerst and Graedel. 2021).
Source: Original analysis (Bulgaria, Croatia, Poland, and Romania); Streeck 2021 (United States); Streeck et al., 2020 (United Kingdom); Schiller et al. 2017 (Germany).
in-use stock is mainly driven by NMM in all four countries. Per capita in-use stocks have been growing in recent years without showing any indication of saturation. In fact, their per capita inuse stock in 2018 was surprisingly higher than higher-income economies (Figure 2.8). In addition to rapid materials stock accumulation, high per capita materials stocks reflect material-intensive construction methods before 1990 and decreasing population (Bulgaria 20 percent, Croatia 15 percent, and Romania 17 percent) during the same period.32 This calls for more efficient use of materials in-built in capital assets.
32 Daxbeck et al. 2009; Streek et al. 2020, 2021; Schiller et al. 2017.
33 IRP. Global Material Flows Database by International Resource Panel. https://www.resourcepanel.org/global-material-flowsdatabase; EuroStat, economy-wide material flow account (EW-MFA);https://ec.europa.eu/eurostat/web/environment/material-flowsand-resource-productivity; USGS,, https://www.usgs.gov/; BGS. https://www.bgs.ac.uk/; World Bureau of Metal Statistics. https:// world-bureau.co.uk/; UN ComTrade. https://comtrade.un.org/; FAO. https://www.fao.org/statistics/en/; UN Statistical Commission. https://unstats.un.org/unsd/statcom/; World Steel Association, Steel statistical yearbook https://worldsteel.org/steel-by-topic/ statistics/steel-statistical-yearbook/; Tilasto database https://www.tilasto.com/en; Statistics Poland https://stat.gov.pl/en/; National Institute of Statistics of Romania https://insse.ro/cms/en; National statistical institute of Bulgaria. https://www.nsi.bg/en.
Increasing rates of material stock accumulation can limit countries’ future circularity potential. Material stocks remain in service for a long time, locking in opportunities and constraining material efficiency. While building new stocks requires material flows, so do their maintenance, operation, and functioning. The estimated average lifetimes for typical materials used in buildings, including concrete, bricks, and iron/steel are 52, 75, and 34 years, respectively.35 When added to in-use stocks, these materials will typically not be available for recycling and recovery for several decades while requiring additional materials and energy during their lifetime. Catching up on in-house stocks therefore locks in resource flows, for instance, in-use steel stock in Poland, which has been saturated for the past two decades
(Figure 2.8). In 2019, 9.4 million tons of steel was added to its stock and 8.8 million tons out of stock became available for recovery, of which 6 million tons was recycled back into the country (Figure 2.9). In contrast, in-use steel stock in Croatia is still accumulating without any saturation (Figure 2.10). In the same year, in Croatia, 0.86 million tons of steel was added to the stocks, whereas only about half of that went out of the stock (Figure 2.10), while only 0.03 million tons (6 percent) of end-of-life steel is recycled back to its economy. At current accumulation rates and BAU policies, Croatia will not meet the growing demand for steel even with full recovery of end-of-life materials. This underscores the scale of the challenge in achieving material decoupling.
34 IRP, Global Material Flows Database by International Resource Panel https://www.resourcepanel.org/global-material-flows-database; EuroStat, economy-wide material flow account (EW-MFA) https://ec.europa.eu/eurostat/web/environment/material-flows-andresource-productivity; World Steel Association, Steel statistical yearbook. https://worldsteel.org/steel-by-topic/statistics/steelstatistical-yearbook/; USGS, Iron and Steel Statistics and Information, https://www.usgs.gov/centers/national-minerals-informationcenter/iron-and-steel-statistics-and-information
35 Streeck et al. 2020.
(2019)
Source: Original analysis for this publication based on (a) IRP; (b) Eurostat; (c) World Steel Association; and (d) USGS.36
Europe’s dematerialization progress partly stems from the outsourcing of materialintensive processes. As seen above, Europe’s resource consumption, as measured in DMC terms, has decreased since 2008 and remained flat since then. But when considering the total amount of raw materials extracted to meet final demand (that is, the material footprint), the resource consumption of the EU-27 has actually increased.37 Figure 2.11 shows that the EU per capita material footprint also declined sharply after the 2008 global financial
crisis. However, contrary to DMC, it picks up thereafter, reaching 23.4 tons per capita in 2017 (the latest available). Comparison between DMC and material footprints clearly shows that the EU has shifted raw material extraction and processing to other regions to meet the resources required for their societal needs. In other words, DMC-based dematerialization in the EU has been realized at the cost of increasing domestic consumption and associated environmental burdens in other countries.
In the four focus countries, DMC per capita has increased during the same period. Figure 2.11 presents DMC per capita for the four
36 IRP, Global Material Flows Database by International Resource Panel https://www.resourcepanel.org/global-material-flows-database; EuroStat, economy-wide material flow account (EW-MFA) https://ec.europa.eu/eurostat/web/environment/material-flows-andresource-productivity; World Steel Association, Steel statistical yearbook https://worldsteel.org/steel-by-topic/statistics/steelstatistical-yearbook/; United States Geological Survey (USGS) Iron and Steel Statistics and Information, https://www.usgs.gov/ centers/national-minerals-information-center/iron-and-steel-statistics-and-information
37 By including all materials used across a product supply chain, rather than merely those embodied in the product, material footprint indicators better represent the environmental pressures stemming from material consumption (Wiedmann et al. 2015this question is far from trivial to answer and has indeed not been addressed satisfactorily in the scholarly literature. We use the most comprehensive and most highly resolved economic input–output framework of the world economy together with a detailed database of global material flows to calculate the full material requirements of all countries covering a period of two decades. Called the “material footprint,” this indicator provides a consumption perspective of resource use and new insights into the actual resource productivity of nations.Metrics on resource productivity currently used by governments suggest that some developed countries have increased the use of natural resources at a slower rate than economic growth (relative decoupling).
THE EU-27, BULGARIA, CROATIA, POLAND, AND ROMANIA
Source: Eurostat and OECD.
Note: DMC per capita and material footprint per capita from OECD statistic database (https://stats.oecd.org). Currently, Eurostat does not publish material footprint for individual MSs other than the EU-27 in raw material equivalent (RME). While the difference between DMC from the OECD statistic database and EuroStat is minimal within 1–2 percent, material footprint of the EU-27 between two sources has a large difference as material footprint of the EU-27 measured in RME from Eurostat is relatively similar to DMC and only slightly higher than DMC in 2019 (DMC 14.1 tons per capita versus RME 14.5 tons per capita). This report uses OECD data for consistency due to lack of data for MSs.
focus countries. While the per capita material consumption of all countries dropped after the financial crisis, it has since been increasing continuously, with no indication of dematerialization in terms of domestic consumption. Croatia has not recovered to the level of DMC per capita before the global financial crisis, but it shows an increasing trend in the past five years.
The shifting burden of raw material extraction also takes place across EU MSs. The four focus countries show different trends in their material footprint and DMC trajectories (Figure 2.11). Bulgaria and Romania, characterized by lower income levels and strong mining sectors, have a
lower material footprint per capita than DMC per capita, meaning that raw materials produced in these countries are mostly used for meeting the demand for final products in other countries. This explanation is also supported by waste generation statistics. The share of mining and quarrying waste in total waste in Bulgaria and Romania is at 82.4 and 88 percent, respectively, compared with 26.6 percent of the EU average in 2018. Non-exported mine tailings are included in the DMC of exporting countries, whereas they are allocated to the countries importing final products when accounting for the material footprint. In Poland, the material footprint per capita surpassed DMC per capita in 2002, indicating a transition from producing raw
materials to focusing on more downstream activities of the value chains as well as the country’s record levels of growth. Poland is following the path of other wealthier countries in externalizing resourceintensive processes.38
Both DMC and material footprint are highly aggregated indicators that do not reflect the heterogeneity of circularity progress by different materials. For example, as a transitioning economy, Poland has significantly different trade patterns depending on materials. Poland is a copper exporting country with a strong focus on upstream activities (that is, extraction) within the copper life cycle. It therefore generates a significant amount of mining waste, as shown in Figure 2.12. Conversely, for steel, Poland strongly depends on import flows, not only raw materials, but also semi- and final steel-based material products, as shown in Figure 2.9, and the country has the highest recycling rate for steel, achieving more than 89 percent in 2018.39
Waste exports contribute to shifting the environmental burden associated with resource consumption. In 2020, EU exports of waste to non-EU countries reached 32.7 million tons, representing an increase of 75 percent since 2004. Waste trade could facilitate more efficient and cost-effective recovery, for instance, by leveraging the international network of recovery facilities. However, recipients tend to include countries with weaker environmental regulations and poor recovery capacities. In 2020, the largest recipient was Türkiye (13.7 million tons), followed by India and the United Kingdom. Waste export is also considered a serious loss of materials and resources. It is estimated that the EU annually loses between €800 million and €1.7 billion through waste exports. Given that some of these materials are considered critical and subject to supply risks, the opportunity costs of exporting these materials need to be considered. The revision of the Waste Shipments Regulation proposed by the EC in 2021 contains measures
Source: Original analysis for this publication based on (a) IRP; (b) Eurostat; (c) Statistics Poland; and (d) USGS.40
38 Eurostat 2021c.
39 WEKA Industrie Medien GmbH 2021.
40 International Resource Panel (IRP), Global Material Flows Database https://www.resourcepanel.org/global-material-flows-database; EuroStat, economy-wide material flow account (EW-MFA) https://ec.europa.eu/eurostat/web/environment/material-flows-andresource-productivity; Statistics Poland https://stat.gov.pl/en/; United States Geological Survey (USGS) Iron and Steel Statistics and Information, https://www.usgs.gov/centers/national-minerals-information-center/iron-and-steel-statistics-and-information
to limit the environmental impacts of waste trade and is expected to induce EU MSs to take more responsibility for their waste by building their own capacity for recycling and recovery.41
The transition to a CE has become a central feature of the EU’s policy agenda. As a term, CE has been around for many years, but in the EU, it only became widely used with the first EU Circular Economy Package in 2015. Since then, it has featured in various strands of policy and is now central to the 2019 European Green Deal (EGD). Beyond its sustainability objectives, EU policy casts circularity within long-term growth considerations, as shown in the EU’s 2020 Industrial Strategy. The 2020 Circular Economy Action Plan (CEAP) provides a product-focused policy framework aimed at improving product design, empowering consumers and public buyers, and promoting circularity in production processes. The CEAP focuses on seven key product value chains that combine resource intensity and circularity potential: electronics and information and communication technology (ICT); batteries and vehicles; packaging; plastics; textiles; construction and buildings; and food, water, and nutrients. While the plan includes a list of 35 actions that promote circularity along the entire life cycle of products, it does not set an EU-level target to reduce the material footprint with respect to the use of the material in absolute terms.42
While EU legislation already embodies circularity principles, it remains largely focused on recycling. EU legislation encourages MSs to prioritize waste hierarchy principles (that is, prevention and reuse as first-order options), followed by recycling (including composting) and energy recovery, with landfilling only as a last resort. In applying the waste hierarchy, the Waste Framework Directive (WFD) sets targets for recycling and preparing for reuse of municipal waste and calls on MSs to set up systems for the separate collection of biowaste and textiles. The Packaging and Packaging Waste Directive sets targets for recycling packaging waste, and the Waste Electrical and Electronic
Equipment (WEEE) Directive sets targets for the separate collection and recycling of electrical and electronic waste. In addition, the Landfill Directive sets a target for limiting the share of municipal waste landfilled. Overall, EU waste legislation has set more than 30 binding targets for 2015–2030.43
Legislation Objective Target (%) Year
Waste Framework Directive
Preparing for reuse and the recycling of municipal waste (by weight)
Preparing for reuse, recycling, and other material recovery of nonhazardous construction and demolition waste (CDW) (by weight)
50 2020 55 2025 60 2030 65 2035
70 2020
Packaging and Packaging Waste Directive
Recycling - all packaging 65 2025 70 2030
Recycling - plastic 50 2025 55 2030
Recycling -wood 25 2025 30 2030
Recycling - ferrous metals 70 2025 80 2030 Recycling - aluminum 50 2025 60 2030
Recycling - glass 70 2025 75 2030
Recycling - paper and cardboard 75 2025 85 2030
Directive on Single-Use Plastics
Separate collection of plastic bottles 77 2025 90 2029
Recycled plastic in polyethylene terephthalate (PET) beverage bottles
25 2025 Recycled plastic in all plastic beverage bottles 30 2030
Landfill Directive Share of municipal waste landfilled 10 2035
Source: Directive on waste (2008/98/EC), Directive (EU) on packaging and packaging waste (2018/852), Directive (EU) on the reduction of the impact of certain plastic products on the environment (2019/904), and Directive on the landfill of waste (1999/31/EC).
41 EC 2021b; Eurostat 2021e; Parajuly and Fitzpatrick 2020; United Nations University 2015.
42 EC 2019b, 2020e; Pantzar and Suljada 2020.
43 EEA 2021.
New policy proposals are shifting the focus upstream toward more sustainable and circular products. With the proposal for a new Ecodesign for Sustainable Products Regulation (ESPR) published in March 2022,44 the EC has presented a framework that will allow it to regulate circularity requirements for almost all categories of physical goods placed on the EU market. Performance and information requirements covered by the framework address the entire range of circular activities, including product durability, reusability, upgradability, reparability, and recyclability, among others. Based on the existing eco-design framework, the approach allows for product-specific measures based on dedicated impact assessments. Importantly, the ESPR proposal enables mandatory green public procurement (GPP) criteria, prevents the destruction of unsold consumer goods, and reinforces the market surveillance and customs control on the products regulated.
The EU’s regulatory framework for circularity is rapidly evolving, but the application of economic instruments remains modest. The EU’s system of quotas, for instance, regarding mandatory minimum recycled material content of products (see the example of plastic beverage bottles in Table 1.1), aims to encourage secondary raw material markets. In most sectors, however, secondary raw materials tend to remain noncompetitive compared to virgin resources. EU legislation mandates MSs to introduce extended producer responsibility (EPR) to support recovery and recycling of materials in areas including packaging, waste electrical and electronic equipment (WEEE), batteries, and endof-life vehicles (ELVs). But the application of fiscal incentives to achieve material efficiency objectives has been more limited, partly due to the limited EU competence in taxation matters. One remarkable exception is a new contribution of EU MSs to the EU budget introduced in 2021, which is based on the quantity of packaging waste that is not recycled (at a rate of €0.80 per kg). Technically, this contribution is not a tax but a levy based on national plastics waste management patterns and treated as an own resource.
Slow uptake of EU-level CE policies by MSs delays progress. EU-level policy setting (Section 2.4) requires and builds on national- and regionallevel visions and implementation. Among the four focus countries, only Poland has adopted a national CE strategy. While circular strategies are under development in Bulgaria and Romania, progress has been limited and their adoption has been delayed. Supportive national legislation still largely focuses on waste management, and, even in this area, the transposition of EU legislation is incomplete. All four countries received an early warning report from the EC in 2018 because they were identified at risk of missing the 2020 target of 50 percent preparation for reuse/recycling for municipal waste stipulated in the EU WFD.
Subnational governments often drive the transition, even within countries with lagging national-level attention. In Romania, the city of Buzau has developed a CE strategy until 2030 and is home to the largest integrated recycling park in Europe. In Bulgaria, the city of Burgas is developing projects in support of the CE, including an industrial park focusing on industrial symbiosis. In Poland, many cities and regions are actively working toward the transition to a CE through its participation in EU programs such as Horizon 2020 and Interreg. Examples include the regions of Łódzkie, Małopolska, Mazowieckie, Pomorskie, and Wielkopolska. In Croatia, three cities, namely Prelog, Krk, and Koprivnica, have reached a separate waste collection share exceeding 50 percent. Prelog, for example, is the city with the first reuse center in Croatia.
Progress will require increased coherence across policy areas and increased uptake by MSs. The need for additional coherence starts at the EU level. One example is agriculture. Despite its increasing focus on incentivizing sustainable agricultural practices, the EU’s Common Agricultural Policy (CAP)—responsible for 36 percent of the overall EU budget in 2019—continues to provide incentive structures encouraging linear production processes, which maintain the material footprint of the EU agri-food sector. Similarly, EHSs encouraging resource consumption, such as fossil fuel subsidies, are still pervasive within MSs’ expenditure frameworks (Annex, Focus Section C), creating
systemic disincentives to accelerate the circular transition.45
The EU has mainstreamed resource efficiency and CE principles into its policies. Its CEAP has become an indispensable part of Europe’s growth strategy and the EGD. These policies have accompanied decreased DMC and improved resource productivity over the past two decades. Progress remains limited to some key indicators, however, and when accounting for material footprint dynamics, progress in reducing resource intensity appears more limited still.
Progress in transitioning toward a CE remains uneven between MSs and material categories. The four focus countries show growing resource consumption and limited use of circular materials.
Some of their economies depend on the materialintensive sectors that partly meet the global demand for resources. In addition, their in-use material stocks have been continuously increasing and will continue to increase in line with their economic transition.
The progress achieved so far will not contain the environmental impacts of Europe’s material consumption. Under a BAU scenario, the amount of materials needed to meet EU demand could increase by a factor of 2.1 by 2050 compared with 2000. With a per capita resource consumption of 13 tons per European (2020) and waste generation of 5.2 tons (2018), the average European has an ecological footprint of 4.8 global hectares (gha), compared with the global biocapacity of 1.7 gha per person.46 Ambitious policies are required to address these trends.47
45 EC, n.d.-f.
46 The ecological footprint is the area required to address resource production and waste absorption (Global Footprint Network 2022). 47 Baldock and Charveriat 2018; Eurostat 2021c.

The trade implications of the circularity transition
International trade has a significant impact on the trajectory and outcomes of CE policy. This chapter assesses the dynamics of the relationship between trade and CE outcomes both in the EU and globally, with a specific focus on developing countries. Four key findings are as follows:
• About 11 percent of EU MSs’ DMC and almost 36 percent of their total footprint are imported. Interestingly, while EU production has become less intensive in material inputs over time, the intensity of material inputs in EU consumption and imports has increased at the same pace as income growth. This suggests that reducing imports of materials will require more than just a change in the relative cost of materials at the border. A shift in EU consumer habits will also be necessary.
• Most material-intensive production that leaks out of the EU is likely to go to other capital-intensive countries, not to capitalconstrained low- and middle-income countries (LMICs). Hence, while LMICs will not benefit from possible trade diversion, they will suffer from adverse effects on their exports and GDP. The largest impacts are likely to be felt by the poorest and most fragile countries in the world, whose dependency on commodity exports to the EU is greater.
• Most of the trade partners from which the EU sources its materials could potentially diversify away from commodity production. But such a structural change needs to be supported by the EU and other high-income countries. Facilitating the shift toward a CE in partner countries is in the EU’s interest, as it represents the most effective way of reducing the net material intensity of global production.
• Leveraging the major presence of brands and lead firms in global value chains (GVCs) would accelerate the needed changes in production and consumption. Firms holding major brands are responsible for designing products, organizing financing, and innovation. This allows them to use their influence to push for more stringent standards worldwide.
The EU’s direct imports of materials are nonnegligible. The EU imports 11.2 percent of its domestic consumption (Figure 3.1). Import dependency on materials is much lower than import dependency on fossil fuels, which stands at almost 80 percent. However, the aggregate figures overshadow much higher external dependency on some categories such as metal ores, where it
Million tons Million tons
Tons of materials extracted and traded globally, 2017 Materials imported or extracted by the EU
Non-metallic minerals Metal ores Fossi fuels Biomass
Embedded Imports Imports Extracted
Import dependency in materials (aggregated) Import dependency in EU DMC and MF % %
stands at 78.3 percent of DMC.48 Some individual goods such as rare earths also post high external dependency, despite representing a small share of overall EU imports, and are indispensable and critical inputs for many advanced technologies. Annex 3 discusses rare earths specifically.
The EU’s dependency increases threefold when materials embedded in other imports are included. In addition to direct imports of materials, the EU also imports materials indirectly,
that is, as embedded in other products. Materials are a major input to manufactured products as diverse as communication equipment, jewelry, and wet corn milling. When this indirect (or virtual) trade of materials is considered, the EU dependency on extra-EU sources more than triples (that is, it increases from 11.2 to 35.7 percent; see Figure 3.2 and Figure 3.3).49 The EU’s external dependency figures are in line with world aggregates, except for metal ores, a category in which the EU dependency from extra-EU sources is high, concerning both
48 Import dependency is measured as physical imports over extraction plus physical imports minus physical exports. External dependency on biomass and minerals is 12.9 and 3.3 percent, respectively.
49 Estimates of embedded materials may be downward biased. Embedded materials are not a directly observed quantity. These flows are calculated based on final consumer demand and global input-output tables. Hence, materials embedded in intermediate trade flows are not included and thus their relevance compared to physical imports can in some cases be underestimated.
Largest exports of materials (w/o fuels) to EU T$
India Vietnam Morocco Chile Argentina Peru South Africa Turkey China Great Britain Russia Canada Ukraine United States Brazil
0 3 6 9 12 15
Share on materials (w/o fuels) imports from EU %, Other=countries with <1.5%
India Vietnam Morocco Chile Argentina Peru South Africa Turkey China Great Britain Russia Canada Ukraine United States Brazil Other
0 5 10 15 20 25 30 Switzerland
Source: BACI-ComTrade data.
direct and total consumption.
A handful of countries account for most of the EU direct imports of materials. Overall, EU MSs are dependent on just a few trade partners for their direct imports of materials.50 The largest EU trading partner of materials is Brazil, followed by the United States and Ukraine (Figure 3.3). Taken together, these three countries alone account for about 30 percent of all direct imports of materials into the EU.51
Largest exports of fuels to EU T$
0 3 6 9 1 15 Egypt Turkey Qatar India Azerbaijan Algeria Libya Iraq Nigeria Saudi Arabia Kazakhstan Great Britain United States Norway Russia
Share on fuel imports from EU %, Other = countries with <1.5%
India Azerbaijan Algeria Libya Iraq Nigeria Saudi Arabia Kazakhstan Great Britain United States Norway Other Russia
0 5 10 15 20 25 30 35
There is, however, substantial heterogeneity across different materials, and treating all direct imports of materials to the EU as one aggregate may be misleading. Table 3.1 presents measures of concentration known as the Theil Index and Hirschman-Herfindahl Index (HHI), adjusted by the authors to capture the specificity of trade in different categories of materials. Overall, the table shows that EU sourcing of biomass and minerals is more diversified than metals, a category in which sourcing is almost as concentrated as
50 Data by trade partners are only available for direct trade, so we will not be able to capture diversification of the supplier base for virtual or embedded trade.
51 When we include fuels in the definition of materials, the largest single exporter of materials to the EU is not surprisingly the Russian Federation. Its exports account for about 25 percent of EU imports in materials. But the largest part of these imports are fuels, accounting for almost 76 percent of all Russian exports to the EU. Other large exporters of fuels to the EU are Norway, the United States, and Kazakhstan.
Source: UNEP and Eurostat data. Note: MF = Material Footprint; RoW = Rest of the world.
in fuels. About 54.9 percent of all EU imports of metals are sourced in as few as five countries (for fuels, this figure is 59.7 percent). At the other end of the spectrum, direct imports of biomass are the least concentrated category of materials, posting a degree of diversification in sourcing that is similar to non-primary commodities. Despite the lower measures of concentration, as soon as one focuses on individual products, the EU’s dependency on just a few sources increases for biomass too.
Most indirect imports of materials originate from other high-income countries or China. Most of the EU’s exposure to the rest of the world is through materials embedded in downstream products. Thus, the analysis above would be incomplete without assessing which countries produce and export these downstream, materialintensive products to the EU. Two conclusions can be drawn. First, following all the downstream links of materials rapidly becomes difficult. Some international convergence on how to define and delimit which goods should be considered
environmentally harmful or worth protecting becomes vital. To some degree, these decisions will be arbitrary, but they also have important implications for the destiny of many more countries, firms, and industries that the sole focus on direct trade of materials might suggest. Second, most of the countries that produce these downstream, material-intensive products and export them to the EU are high- to middle-income countries spanning from the most important global manufacturing hubs (China and the United States) to other technology advanced countries (Switzerland and the United Kingdom) to regional hubs in important middleincome countries (Türkiye, Argentina, and Ukraine) but exclude lower-income countries that are just breaking into manufacturing (Figure 3.5).
In conclusion, most trade in materials takes place in the form of embedded materials, and this has important policy implications. Most materials are not shipped in their raw form but instead are incorporated in manufactured goods, which has important policy implications (see Section
Largest Exporters of indirect goods to EU T$
Share on indirect goods imports from EU %, Other = countries with < 1.5%
Source: Original calculations based on BACI-ComTrade data. Note: Tier-1 downstream goods are defined as those whose direct input of material accounts for 10 percent or more of the total (see methodology in Annex B).
3.2). Effective legislation on the CE will need to account for the fact that most materials that enter the EU are embedded in downstream products and the set of countries and trading partners that EU legislation will affect is broader than the analysis of direct trade flows would suggest. A first conclusion is, therefore, that the EU will need to seriously consider the potential repercussions of its policy on the CE on some of its largest trading partners. Furthermore, the bloc itself is likely to be vulnerable to policy responses by these countries.
Following the introduction of more stringent CE legislation, production may ‘leak’ out of the EU. If this then settles in jurisdictions with lower environmental standards, we refer to such countries as ‘linear production havens.’ Given this risk, it is useful to analyze the relationship between trade and a country’s domestic usage of materials and its total material footprint. Based on evidence from 147 countries worldwide over 23 years, three main conclusions can be reached. First, freer trade is associated with higher levels of production and consumption of materials, but most of this positive association is explained by increases in GDP that
trade stimulates. Second, most material-intense production settles in places with a capital-abundant economy. Third, regulatory differences have historically been a weak driver of trade in materials, but this may change in the future.
Freer trade is associated with GDP growth and, through this channel, with higher levels of domestic and total consumption of materials. Material consumption, both domestic and its footprint, grows in sync with trade openness. In periods of rapid trade integration, such as during the 1990s, material usage has also increased at a comparable speed (Figure 3.6). This correlation between trade openness and environmental exploitation does not present a causal link, however, since these increases in trade openness also correspond to periods when global income and consumption increase. Econometric analysis confirms that it is precisely the increase in income triggered by trade that leads to more material usage. It does so by increasing the scale of production, which in turn is responsible for higher material usage. In theory, increases in income can also bring about improvements in technique and efficiency gains, which refer to the use of materials per unit of production. In practice, these incomerelated improvements in technique decrease domestic consumption significantly, but they
Percentage Change (dlog)
Source: Sommer and Taglioni 2022.
Note: Average of a sample of 147 countries over 23 years.
have no significant effect on the material footprint measure. The results for raw materials mimic those already well studied of CO2 emissions.
In overall terms, the negative scale effect associated with more income dominates, leading to more overall consumption of materials. These results are illustrated in Figure 3.7, which plots the coefficients and confidence intervals of a set of econometric regressions evaluating the role that trade openness, income (GDP), and a country’s capital intensity play in accounting for DMC and footprint. The corresponding effects for pollution (CO2 emissions) are also reported for benchmarking. Focusing first on Figure 3.7a, which presents baseline results for variables expressed in levels, the key finding is that the seemingly strong correlation between trade openness and material consumption depicted in Figure 3.6 does not survive the econometric treatment. Once country differences in income levels are accounted for, the trade openness coefficient is close to zero and statistically not significant. The large-scale effect of GDP dominates the entire relationship and drives domestic material and total consumption.
Improvements in techniques associated with higher income reduce DMC but not a country’s footprint. The results of Figure 3.7b show another important insight: while in theory income leads to improvements in technique, these effects are too small to offset the negative size or scale effect. This
is easily shown by expressing the variables in trade intensity terms instead of levels. This modification allows us to neutralize the size effect of income so that the resulting coefficient associated with the income only reflects the technique effects. Incomerelated improvements in technique are highly visible on domestic consumption and emissions but not for the footprint of a country. This means that richer countries may be able to reduce their domestic/direct usage of materials, but they do not significantly reduce their consumption of embedded materials and CO2. This discrepancy between domestic and total consumption also indicates that—absent a modification in consumption habits—some outsourcing of material-intensive production is in order. The next key question is therefore what drives the relocation of such production. This is discussed in the following paragraphs.
Most material-intense production settles in places with a capital-abundant economy. Based on historical data, evidence for a ‘linearproduction-haven’ effect in material consumption is weak. Poorer countries, which tend to have laxer environmental legislation, tend to increase their DMC when opening up for trade, while rich countries do not reduce it. Similar evidence holds for CO2 emissions. The overall result is a coefficient close to zero for the interaction between trade openness and income, as shown in Figure 3.7. Most material-intense production settles, instead,
FIGURE 3.7: CO2 -.2 0.2 -.2 .4 .2 0 .4
Openness
DETERMINANTS OF DOMESTIC CONSUMPTION AND FOOTPRINT OF MATERIALS AND CO2 EMISSIONS Materials Trade Openness Relative Capital Intensity * TO Relative Income * TO Income Capital Intensity Domestic Material Consumption Material Footprint CO2 Emissions - Consumption CO2 Emissions - Production
Source: Sommer and Taglioni 2022.
in places with a capital-abundant economy. In Figure 3.7, this is demonstrated by the fact that the interaction between trade openness and income is dominated by the interaction between capital intensity and income, although both coefficients are small. This means that capital-intense countries, which tend to be high-income or middle-income countries, become both more material intensive and dirtier when opening up for trade. Interestingly, that is the case for both the domestic and the footprint measure, meaning that if more capital-abundant countries open up, then they will also increase their material and CO2 footprints.
What will happen if the EU starts tightening CE regulation? By computing the marginal effects of increasing trade openness for different levels of relative income and relative capital intensity, one can attempt to answer this question. The results indicate that, for high levels of relative capital abundance, an increase in trade openness significantly increases DMC and emissions. This is demonstrated by the fact that while a 1.0 percent increase in trade openness leads to an increase of DMC by about 0.1 percent and of CO2 emissions by 0.065 percent for low to median levels of relative income, the effect moves toward zero or becomes negative the richer the country is. We take this as a weak signal of looming ‘material leakage and linear production haven’ (LPHH) and of ’pollution haven’ (PHH) should the regulatory gap between countries increase. In short, richer countries decrease their emissions and domestic material usage when opening up to trade, while the opposite is the case for poor countries. This, together with the fact that we cannot establish
OF THE CO2 -.2 -.1 0.2 -.4 -.2 0.2 .1
such effects for the footprint measures, provides some evidence for both material and emission leakage. Even though the magnitude of these effects is small, it may increase as regulations start diverging more. However, the analysis also shows that material-intensive production mostly settles in places with capital abundance, which tend to be mostly developed countries and China, as discussed in Section 3.3. Hence, this evidence should indicate to policy makers that trade policy must be taken seriously when designing future regulation on CE issues. Furthermore, cooperative solutions with other capital-abundant countries are needed to reduce the material intensity of the production that potentially accumulates there and make it environment friendly.
Exports (2030) relative to baseline (EGD-NDC scenario) for Combined CE scenario GDP (2030) relative to baseline (EGD-NDC scenario) for Combined CE scenario
1
-0.1% -0.5% -0.5% -0.2% -2
-1
0.0% -0.6% -4
-8 -7 -6 -5 0
-0.4% -0.4% -3
-0.6% -1.0%
LMIC* MNA SSA China Non-EU ECA EU -1.2 -1.0 -0.8 -0.6 -0.4 -0.2 0.0 LMIC* MNA SSA China Non-EU ECA EU
threat to many neighbors and some of the poorest developing economies. The potential effects that a reduction in material imports will have on specific developing countries should be considered, not as an afterthought but as an integral part of the EU CE strategy.
Dependency on EU demand is high among many small and fragile countries. While the United States and Brazil are the largest EU partners in the direct trade of materials (see Section 3.1), these countries are not those most dependent on EU demand. Many lower-income countries possessing very little market diversification are heavily dependent on the extraction of biomass, metals, and minerals that are exported to the EU. To identify which countries might be especially dependent on material exports to the EU, we defined an adjusted revealed comparative advantages (RCAs) measure that gives insights into how large the share of a given good is in the total exports of a country compared with the same measure on a global scale.
For as many as 17 countries, exports of materials to the EU represented more than 10 percent of the total in 2019 (Figure 3.9). In the case of Sierra Leone, for example, more than 30 percent of its total exports are in materials to the EU (mostly metal ores). Monserrat (22 percent)
Country Overall Biomass Metal ores Minerals Fuels Dirty goods (World Bank)
KAZ - Kazakhstan
0.026 0.024 0.036 0.025 0.056 0.039
MDG - Madagascar 0.035 0.036 0.028 0.027 0.046 0.010
CRI – Costa Rica 0.042 0.047 0.017 0.018 0.028 0.033
NOR - Norway 0.043 0.034 0.051 0.067 0.086 0.139
UKR - Ukraine 0.061 0.064 0.116 0.045 0.046 0.054
MAR - Morocco 0.067 0.070 0.081 0.065 0.027 0.057
RUS - Russia 0.107 0.100 0.101 0.100 0.210 0.175
Source: BACI-ComTrade data. Note: Higher numbers indicate that a country exports to relatively more countries in this category and thus indicate a greater diversification, and countries are ranked by increasing degree of diversification.
Most of the countries that we consider to be heavily dependent on exports of materials to the EU are also often poorly diversified in terms of their export basket in general. In particular, for Sierra Leone, Ukraine, Madagascar, and Mauritius, more than 35 percent of total exports are material exports, mostly either metal ores or biomass (Figure 3.10), and these countries, plus a handful of others, also serve very few export markets (Table 3.2). Our adjusted version of the
index of export market penetration also shows that larger and more developed countries in the list manage to serve more markets than smaller or less developed countries such as Armenia, Moldova, and Mauritania.
These numbers suggest that the potential for diversification and a rebound from a sudden contraction in EU demand for materials is limited. This potential is even more limited in
FIGURE 3.10: ANALYSIS OF COUNTRIES THAT DEPEND ON MATERIAL EXPORTS TO THE EU
Export intensity Total export value as % share of GDP
Share of materials (w/o fuels) exports on total exports %
Source: Sommer and Taglioni 2022
those countries that will be hurt the most. From a dynamic point of view, if the EU succeeds through its regulatory agenda in setting new more stringent global standards for the CE, that is, exporting de facto its regulatory framework, then the medium-term effects for countries that do not manage to comply may become even more severe over time, lowering demand for these countries’ exports of raw materials even further. It will thus be important for the EU to consider these large dependencies when designing new policies and regulations on material inputs.
Reducing waste and material intensity in consumer goods may also lead to unwanted negative economic and social impacts in partner countries. The EU’s CEAP targets the reduction of waste in the EU as one of the key areas for improvement. In recent years, waste exports have become a global emergency and a problem that calls for urgent solutions. There may, however, be unwanted negative economic and social impacts associated with such a move which should also be considered.
Reducing exports of waste will adversely affect important regional trade partners. When, in 2017, China decided to reduce the amount of waste imported from the G-7 countries from 60 to 10 percent in less than a year, there were considerable global repercussions. The EU’s intent to reduce the volume of waste produced and exported to world markets may have similarly large global repercussions. Currently, the EU exports roughly US$1.4 billion in waste. The largest importer of EU waste in 2019 was Türkiye, a country that increased its imports of EU waste dramatically after China banned ‘dirty’ waste imports in 2017. As a result, EU waste represents 1.6 percent of total Turkish imports, which is a nonnegligible share. Another EU neighbor, Moldova, is also relatively reliant on EU waste imports (1 percent of the country’s total imports) and Pakistan is not far behind, at 0.7 percent of its imports (Figure 3.11). It is hard to judge the full extent to which these imports of waste are critical to the recipient economy, but their existence and importance for some EU trade partners should not be underestimated.
Economic and social impacts of reducing e-waste in the consumer durable industry should also not be neglected. EU legislation to reduce waste may also affect developing countries through this indirect but important channel, potentially disrupting development trajectories within the developing world and undermining gains made in female employment. This sector is resource intensive and an immense waste generator. Millions of goods, from cell phones and printers to microwaves and washing machines, are disposed of every year. This is fueled by the industry preference for business models based on maximizing the number of units sold and for products with ever shorter life cycles and limited repair options. Although there is already a global proliferation of multiple extended producer responsibility requirements to limit these nefarious business trends—78 countries have policies and/ or legislation to make manufacturers responsible for environmentally sound disposal—the EU may want to go further, with the potential to force a reshaping of those consumer goods value chains, from apparel to electronics and white goods that span numerous countries around the world and whose business model is based on mass production of goods with unnecessary short life-cycles and limited to none opportunities to reuse and repair.
Many developing countries depend significantly on the consumer goods value chain for their socioeconomic development. For example, electrical and electronic goods exports accounted for 44 percent of Vietnam’s exports in 2019 (US$123 billion), employing more than 600,000 people, 85 percent of whom are young females. Making more durable, more sustainable products reduces the need for factories and laborintensive operations. While new but fewer jobs can be created in high-value knowledge roles to analyze data, many factory workers in developing countries will be at risk of losing their jobs if a successful transition occurs to more sustainable and less-material-intensive consumer goods. This will not only have a potential impact in the assembly stages of manufacturing changes but is also likely to replicate throughout the supply chain. Manufacturers will need stronger and more capable suppliers that can provide them with the quality guarantees required to produce durable goods, and the weaker suppliers of components,
especially those in developing countries, may end up being pushed out of the chain. In these cases, sustainability gains will have negative social impacts, which will also need to be managed. Section 3.4 discusses how these outcomes can be avoided.
With regard to plastics and single-use plastics, the EU is more self-sufficient, and legislation can move faster. The CEAP also targets the reduction of single-use plastics, which makes it interesting to look at EU imports in this category. Since we focus only on three HS4 codes for which we are confident of capturing nothing else but single-use plastics, packaging, and waste, the share relative to total EU imports is naturally small. Interestingly, it appears that most EU imports are from within the bloc (about 71 percent, Figure 3.12). The largest non-EU trading partner in single-use plastics is China, which provides about one-third of EU imports in this category, followed by the United Kingdom and Switzerland. Some small countries and insular states, such as Montserrat or Samoa, however, are highly dependent on exports of such goods, even if the total volumes are negligible in the aggregate. This evidence suggests that singleuse plastics is one area in which the EU can move faster, since most of the effects will not be felt by third countries. In the countries where these effects are felt, the relatively small overall amounts would make it possible to address the negative externalities with compensation schemes.
Between now and 2030, there will be significant declines in exports of primary metals, balanced growth in recycled metals and exports, and significant opportunities in plastics, according to CGE analysis. LMICs could shift away from commodity production and increase their presence in new industries, including trade and other services, while also making inroads into recycled copper, recycled steel, plastics, and plastics recycling (Figure 3.13).
Helping developing countries diversify away from commodity production is also in the
3.4 Leveraging GVCs toward material-efficient production in the EU and in trade partner countries
EU’s interest. A shift toward low material intensity requires producing many new and innovative products at affordable prices—and doing so at a rapid pace. The successful experience from technology-intensive goods as diverse as smartphones, solar energy panels, wind turbines, electric vehicles (EVs), and, most recently, vaccine production has shown that when this has happened, it was because of the complementary capabilities that GVCs can leverage. Moreover, there are important lessons to learn also from the only country that has made significant inroads into many new emerging sectors, China. Its significant investment to develop an industrial expertise in the production and manipulation of base materials, and in their usage inputs in downstream production, is one possible reason for its successful outcomes.
The main question is whether LMICs have the capacity to invest and compete in the new sectors. This section shows that, despite some promising inroads in some areas, at present most developing countries are still marginal players in the new emerging industries. For a structural shift to take place toward material-efficient products, the EU and other rich countries need to facilitate the transition in these countries, including by creating incentives for the private sector to design and invest in material-efficient products and business models.
Almost no developing country participates in the production of recycled metals. In recycled copper, aluminum, and steel, the upstream stages of these industries (exploration, extraction, and primary processing) are highly concentrated in a small number of locations. This limited global footprint is due to reserve locations, geological conditions of those reserves, and the capital intensity of the operations necessary to extract the metals from the ground. These stages involve locating and extracting metal
ores from the ground and the first stages of removing superfluous materials and impurities. This is also the only segment of recycled metal GVCs in which developing countries other than China play a significant role.52 China is the largest producer in the next stage of these GVCs. Chinese commitments to establishing processing capacity in the 2000s, together with Japan’s historical leadership in the smelting of nonferrous metals and the region’s primacy in manufacturing, have made Asia-Pacific the center of the mid- and downstream stages of the GVCs of these metals.53 While Europe is the second-largest region in concentrate processing, refining, and usage for both aluminum and copper, this share has steadily declined as China’s position in the industry has strengthened.54 The downstream segments of the value chain are mostly dominated by highincome countries, since recycling and reduction efforts largely hinge on the proactive stance of the industries into which these commodities flow. Products must be designed and developed with recycling and reduced metal use as the end goal. For example, reducing alloy use and improving traceability of the metals used to allow for direct melt recycling. The downstream industries for these commodities are similar, except for the large food and beverage participation in aluminum. Three categories, namely machinery equipment, construction, and transportation, account for three-quarters of the end use in these metals.
The potential impact of EU initiatives and private actors is global in the industry of food packaging. Meeting the steadily increasing demand for food by a growing and richer world population places significant pressure on the planet’s biomass. Innovative business models aimed at reducing food loss in producer countries and food waste in consumer countries are emerging. In
52 The upstream mining stages of the copper GVC are dominated by Latin America (led by Chile and Peru), which accounts for 44 percent of copper concentrate production. Together with Australia, Canada, and Mexico, these top five countries accounted for 69 percent of global ore concentrate exports in 2019. The aluminum sector is even more consolidated with Australia accounting for 29 percent of the world’s bauxite output, followed by China (23 percent) and Guinea (15 percent). Guinea, indeed, is a central actor to the aluminum GVC. It holds 25 percent of the world’s bauxite reserves and accounted for 51 percent of global exports of aluminum concentrate in 2019.
53 Asia accounts for 75 percent of traded copper concentrate imports and produces 56 percent of the world’s refined copper; China accounts for two-thirds of that. Chile is the only significant non-Asian exporter of refined copper. China’s growing dominance is even more pronounced in the aluminum chain, where it increased its world market share of bauxite imports from 40 percent in 2010 to 72 percent in 2019. It is also by far the largest smelter of aluminum globally accounting for approximately 58 percent of primary aluminum output in 2020/21.
54 Very few aluminum and copper mining countries depend on the EU today as a destination. Only 7.5 percent of Guinea’s aluminum concentrate and 10 percent of Latin America’s copper concentrate are processed in European plants.
this context, food packaging has become a major focus of CE initiatives.55 This is not surprising, as the food sector also accounts for about 37 percent or 8.2 billion tons of global plastics.
The most immediately available option to improve sustainable goals for actors in the fresh produce chain is to improve plastic PET containers as much as possible. This includes several actions: (a) increasing the share of recycled content and recyclability of packaging materials; (b) reducing the total weight of PET in each container; (c) shifting designs such as reduced labeling; and (d) changing packaging type (from clamshells to sealed punnets), which can reduce PET content by 40 percent. On recycling these containers, the EU, the United Kingdom, and Canada are driving much of the change, establishing legal packaging requirements around these issues for food containers.
However, capacity to meet these new requirements varies across the diverse range of global fruit and vegetable exporters, especially in developing countries. When
sufficient economies of scale in packaging demand and regulations that support recycling are in place, exporters from developing countries can adapt to these new demands. However, where these conditions are not met, they are forced to import, adding to global emissions and cost.
To drive this change, regulatory decisions in the EU, together with the choice of business models by EU firms and GVCs, matter. The potential impact of EU initiatives and private actors is global; Europe is the world’s largest importer and sources close to 40 percent of its imports from outside the region. Achieving sustainable goals thus requires policy makers and private sector firms alike to examine how actors beyond the EU’s borders are positioned to respond to these changes.
The lack of significant presence of developing countries in material-efficient products mimics well-known patterns in green goods. The above anecdotal evidence is consistent with trends in green goods as reflected in the AsiaPacific Economic Cooperation (APEC) definition (APEC 2012) of clean and environment-friendly
55 Packaging plays a critical role in the fresh produce industry, extending the shelf life of products, reducing post-harvest losses, and protecting quality and food safety. Simply sheathing a cucumber in plastic wrap extends its shelf life by 66 percent. Transparent, sturdy, and resistant to humidity, plastic has been essential in facilitating long-distance shipping of high-value soft fruits from the production location to supermarket shelves. These soft fruits, such as berries and cherries, need greater protection and less handling than hard fruits that can be shipped in cartons (for example, bananas, citrus, and apples).
goods. This is a measure that we take as a rough proxy for countries’ ability to develop innovative and environment-friendly business models and products. Based on such a list of goods, it appears that the EU is a major producer and exporter and much less an importer of them. Almost 60 percent of the imports of these goods are supplied from within the EU (Figure 3.14). From a development perspective, the other largest exporters of these goods are capital-intensive countries and mostly do not overlap with the exporters of raw materials that need to shift away from commodity production. Clean goods are imported for the most part from larger and richer economies. China is the biggest extra-EU source of clean goods imports (27.7 percent of total EU imports), followed by the United States (19.2 percent), the United Kingdom (9.5 percent), and Switzerland (8.3 percent). Almost none of the countries that we previously identified as heavily dependent on material exports also export green goods (Figure 3.15). Norway is an exception, but even there these goods exports are minor, at only 1.7 percent of its total exports. This finding is not surprising and is fully consistent with the econometric results shown above that most material-intense production settles in capitalabundant countries (see Section 3.2).
One sector in which developing countries are making promising inroads is the one of sustainable forestry products. The growing importance of CEs amid rising concern for climate change has revitalized the global forestry industry. After a decade of slowdown induced by digitization’s steady elimination of printing paper, the industry is once again preparing for booming future demand. Buoyed by global commitments to climate action since 2015, forestry’s value proposition has shifted from providing basic printing paper and fuel to providing innovative, sustainable substitutes for a wide range of products, from concrete to plastics, fabrics, and steel.56 Developing countries are still marginal players in these new areas of growth, but their presence is growing, particularly in the upstream (plantation and harvesting) and midstream (milling and processing) stages of production.
Tropical and southern hemisphere suppliers have gained in importance in the upstream and midstream stages of the chain. While northern hemisphere developed-country suppliers have dominated the industry (top four in 2001: 44 percent), the past two decades have seen this market share decline (top four in 2019: 31 percent), with increased globalization of the industry and significant growth from tropical and southern hemisphere suppliers. Tropical and southern hemisphere suppliers have gained importance in the milling stage of the chain by undertaking more sawmill and pulp mill activities. The leading wood chip exporters include Vietnam, Australia, Chile, Thailand, and South Africa (total 82 percent of non-coniferous wood chip exports). China imports about half of this trade (47 percent) and Japan a further 38 percent. Similar to the case of metals and some green goods such as solar panels, the development of the global trade in pulp and the increasing opportunities for developing countries to capture a market share in this segment have also grown as a result of China’s installation of processing capacity in its paper mills. Canada, the United States, and Sweden have been among the leading exporters of pulp for a long period. However, new southern hemisphere exporters, including Brazil, Chile, and Indonesia, have emerged as important competitors supplying market pulp to the new Chinese paper mills. China’s growth as an import market to process and create forest-based products to meet demand has been explosive, with its market share increasing from 6.3 to 24 percent. As a result of the entry of these new actors, trade in forest-based products has doubled in both value and volume since the turn of the century.
Firms can help in this goal through disseminating technology and contributing to lower production costs and prices for CE products, but legislation needs to create the incentives for them to do so. To realize a CE at scale, effective material flow and longer life span on products need to be enabled globally. Making these products possible requires changing consumer demand, making
56 Paper packaging is being adopted as a biodegradable alternative to single-use plastics; resin-lined carts can even be used for long shelf-life liquids, from milk to whisky. PureFibre from StoraEnso replaces single-use plastic—not only is it recyclable, but it has a 75 percent lower carbon footprint. New high-performance textiles such as modal and lyocell are being made from cellulose fibers. These can be even more sustainable than organic cotton; a t-shirt made from wood fiber, for example, uses just 1 percent of water required for a cotton shirt. These substitutions are driving renewed demand in the industry.
innovative goods rapidly affordable, and pushing stringent standards of production down the value chain to producers globally. To achieve this effort, regulatory interventions need to be matched with measures that make firms with leading brands responsible for their global industrial strategies and facilitate financing of new technologies and their dissemination across the globe.
Firms need to finance and design new technology, products, and business models and disseminate them globally. Firms will need capital investments in material-efficient business (greenfield or through acquisitions) or strategic efforts to evolve (new) market segments. The current efforts in climate finance can serve as guidance on the tools that can help speed up the financing of innovative, material-efficient business. Various environmental, social, and governance (ESG)-linked sources of capital terms have both grown and become more standardized by 2021, with total issuance being estimated at over US$1 trillion (Green Bond Initiative).
Firms will also need to design products and business models in a way that avoids production leaking away from jurisdictions with more stringent regulatory environments. To do so, they need to be made responsible for the overall material footprint associated with the products they produce. A good starting point is to make them responsible for Scope 3 emissions.57 This will lead them to disseminate new technologies and support the development of new competences in LMICs in the critical areas of manufacturing of base materials; sensor and connectivity technology; and supporting of trade, recycling, and other services. Evidence on how countries transition out of commodities and break into higher-value-added activities suggests that developing competences in manufacturing, particularly in base metals, is a successful way of laying the foundations for sustainable industrialization.58
Helping firms develop product-as-a-service (PaaS) approaches, of the type already
adopted by capital equipment manufacturers in the past, is also likely to help the shift toward material-efficient production. Today’s global economy is driven largely by a disposable society, in which consumer business models are sustained on economies of scale, while quality, durability, and reuse are not central to producers’ core business. The PaaS approach moves away from the traditional product-oriented business under which the good is sold outright to use-oriented (that is, pay per use) and results-oriented (that is, pay per outcome) ones where the product’s ownership remains with the provider and the contracting depends on availability or outcomes. As the product then shifts from being a profit generator to part of the cost function, the manufacturer is incentivized to increase its efficiency, extend its life cycle, and optimize the potential for reuse. By definition, these products become capital equipment.
The experience in capital equipment value chains offers numerous insights into how to shift toward more material-efficient and durable products. It highlights both the opportunities and challenges related to the approach of shifting the revenue stream from the product itself to the associated services. In capital equipment value chains, this strategy shift toward PaaS has turned out to be good for both sellers and buyers and has facilitated a shift to a more circular economy in the capital equipment industry. For manufacturers, this has been a profitable move, leading to high margins and opportunities for innovative services offering. Margins (EBITD)59 generated by services-based models have been found to be considerably higher compared with new equipment sales. Moreover, unlike new equipment sales, PaaS provides a long-term, captive, and constant revenue generator for the manufacturer, mitigating revenue fluctuations and uncertainty during periods of economic downturn.
There are challenges to applying this model to the consumer durables sector, however. Highly fragmented buyer power and information asymmetries do not create the incentives for
57 GHG emissions are categorized into three groups or ’scopes’ by the most widely used international accounting tool, the GHG Protocol. Scope 1 covers direct emissions from owned or controlled sources. Scope 2 covers indirect emissions from the generation of purchased electricity, steam, heating, and cooling consumed by the reporting company. Scope 3 includes all other indirect emissions that occur in the value chain.
58 Cherif and Hasanov 2019; World Bank 2020b.
59 EBITD = Earnings before interest, taxes, and deduction.
producers to manufacture good quality products and invest in shifting their revenue stream toward maintenance and repair services. In addition, strong forces exist against change from developing countries, especially those currently specializing in the mass manufacturing of consumer goods. These countries are largely dependent on rapid production systems for employment and export revenue and, as a consequence, are likely to be the major losers in this shift.
Hence, legislative change is also needed for such structural changes to happen at scale. Some countries are working to introduce legislation and incentives to force consumer goods companies to manufacture more durable products for their markets. Requiring durability of products, however, may prove insufficient to fully stimulate firms to shift to services-led products due to the myriad of challenges that they face in doing so. Many of these are internal organization challenges, from restructuring, operationalizing changes, and shifting attitudes among teams to finding the correct pricing strategy across their market segments. While resolving these challenges depends mostly on managerial strategies, there are other more fundamental issues where government intervention could catalyze change. In particular, there are three areas in which governments could accelerate change. First, governments can push for a change in consumer demand. Consumer protection agencies around the world need to be strengthened to channel consumer demands for more materialefficient and durable goods. Second, the shift to PaaS has a major impact on short- and mediumterm cash flow within businesses. Continued equipment ownership by the manufacturer means that they must assume full up-front costs of that product. The information asymmetries regarding how potential services clients might treat these products increases the risk associated with financing them, making it more difficult or expensive to borrow. Governments can play a role during this transition period by providing access to lowercost financing. Third, such a shift hinges on welldeveloped digital connectivity and infrastructure, another area in which public investment can help. Governments have a key role to play in improving these enabling factors and overcoming the market failures in access to finance to facilitate the transition.
The EU’s dependence on material imports is significant, particularly when looking at total material consumption, inclusive of material footprint (Section 3.1). The analysis has also found small but significant signs that if regulation tightens in the future, some production of materials as well as downstream activity that is intensive in material inputs may relocate outside of the EU (Section 3.2). Based on evidence from historical data, however, it seems as if most material-intense production settles in places that already have a capital-abundant economy, that is, mostly other rich countries and China. Still, unilateral action in the EU risks having destabilizing spillovers on many lower-income countries, many of which are very poor, sometimes plagued by conflict and fragility, and posting an undiversified domestic economy (Section 3.3). The more ambitious the CE regulatory agenda, the broader the range of impacts and affected countries. Most importantly, the analysis has shown that more production means more use of materials and more pollution. That connection has to be disrupted. To do so, addressing the problem at its source, that is, the production stage, is important. But targeting production alone will not suffice. Consumption habits also need to change. Currently, as countries become richer, they consume more materials, even when their domestic production becomes less intensive in raw commodities.
The EU can leverage GVCs for achieving overall reduction in the net resource intensity of production on a global scale and avoid leakage. Assigning responsibility for Scope 3 emissions and material usage along the entire value chain to the firms that design products and unlock financing can speed up the CE transition. New products that are material efficient and low waste need to be invented, made affordable, and adopted rapidly on a global scale. Pushing lead firms to make such changes will help in pivoting toward more material efficiency on the production side. It will also help disseminate new technology and lower the prices for innovating CE-friendly products. This will also facilitate the shift in end consumer habits, since brands design products and influence consumer taste. Finally, such measures help pricing in externalities along the whole value chain associated with their end products, curbing the
risk of leakage and future relocation of production toward pollution havens. Anything short of pricing in externalities along the whole value chain could imply some form of leakage, even if so far none of this has been observed.
The EU is an important global buyer, exporter, and home to many lead firms in GVCs. With this status comes a large standard-setting power, which the EU exerts through the globalization of its standards and the internationalization of its lead firms. This role is visible in many industries but perhaps most notably in those linked to forestry and in food-related value chains. The current policy in Europe for forestry and related products is an extension of decades-long efforts to improve recycling, enhance sustainable management of global forests, and eliminate illegal logging. The region is the world’s largest exporter (33 percent) and second-largest importer (29 percent) of forest products. It leverages extensive influence over the global industry through widespread adoption of the sustainability standards largely set by Europe, the internationalization of its lead firms, and the market power it exerts over end products, from furniture to packaging of materials. It has used this market access through trade agreements to encourage and facilitate the development of multistakeholder sustainability initiatives across the developing world.60 In food industries, a host of initiatives in the European Union (EU) have set out to improve the sustainability of the fruit and vegetables GVC. These leverage public sector regulations, private sector requirements, and civil society demands not only to make the GVC more environmentally friendly and healthy but also to ensure it operates on a fair and inclusive basis. The potential impact of these EU initiatives is global because of Europe’s importance as the world’s largest importer and its sourcing of close to 40 percent of its imports
from outside of the region. Even for countries that are not dependent on EU sales, as the leader in the industry, the region has been at the forefront of global standards setting. With increased trade in produce, issues of food safety, phytosanitary conditions, and acceptable product quality became increasingly important.61
How actors beyond the EU’s borders are positioned to respond to policy changes matters. The multitude of global spillovers and spill-backs in both the production and consumption of materials and in downstream industries suggests that unilateral measures are likely to face pushbacks from trade partners across the globe. Take the example of a shift from the current way the EU consumer goods industry works to PaaS business models. As discussed in Section 3.4, PaaS is considered a critical strategy to reduce both material intensity and waste and increase the duration and reuse of many manufactured products. At first sight, one could argue that this is a purely domestic measure, but in fact it can have major global repercussions. It is likely to create many challenges in many emerging economies that specialize in mass manufacturing, since these are largely dependent on such rapid production systems for employment generation and export revenue and to achieve a range of socioeconomic objectives. These countries are therefore likely to be the major losers if such a shift occurs, unless they also operate the same shift. The global food value chain offers another telling example of why trade policy coordination is needed. Upstream segments of the chain comprise many developingcountry suppliers. Policies in these locations have not necessarily focused yet on issues of the CE, as priorities are focused more on social and economic needs of jobs creation and income generation. As stand-alone measures, regulations, norms,
60 There are many examples of how the EU has shaped global sustainable forestry policy over the past three decades through the globalization of its standards and the internationalization of its lead firms. In the 1990s, the region pioneered certifications for sustainable forestry management (SFM) to alleviate the local consequences of deforestation. The Pan European Forest Certification (PEFC) was founded in 1999, introducing independent third-party certification. The PEFC has since expanded significantly beyond Europe, covering over 300 million ha of forest by 2021. Today, the PEFC works with national governments and regional groups (for example, Cameroon, Congo, and Gabon - Pan African Forest Certification for the Congo Basin) around the world to establish SFM frameworks. Its leading firms, Stora Enso (Finland), Holmen (Sweden), and UPM (Finland), are among the largest in the world (top 12). These firms have expanded abroad, with forests not only across Europe and Russia but also across North and South America, and have expanded their sustainable practices to both their own plantations and those they source from. Uruguay, a major supplier for pulp plants for both Stora Enso and UPM, has certified all of its forests in Forest Stewardship Council (FSC)/Programme for the Endorsement of Forest Certification.
61 In 1997, the EU, along with its leading supermarkets, established the now globally accepted norms through the creation of EUrepG.A.P. This became the predecessor to GLOBALG.A.P.—the most widely adopted standard around the world for fruit and vegetable production. This revolutionized global agriculture and pushed small actors out of the industry.
standards, and policies made in the EU may end up having exclusionary effects on developing countries producers. For example, smallholders who cannot effectively certify efficient use of materials could be pushed out of the chain. Suppliers that cannot access sufficient recyclable packaging also may no longer be able to sell fruit to high-value markets.
These findings motivate three main policy conclusions. First, trade policy and trade diplomacy at all levels (bilateral, regional, and multilateral) can be deployed not only to pursue
a unilateral reduction in the amount of materials in the EU but also to help other countries make the same transition and manage any adverse impacts. Second, assigning responsibility for CE outcomes to the firms that design products and unlocking financing can be achieved effectively through accountability for Scope 3 emissions. Finally, the EU can deploy its large standard-setting power and the internationalization of its lead firms to push for more stringent standards globally.
The private sector will be central to the introduction of CE business models. Across sectors, most, if not all, technological and business model innovations have stemmed from the private sector, although public policies and support, including in research and development (R&D), have certainly played a role. CBMs—those centered on reducing the extraction and use of natural resources and the generation of waste—are already in operation in several economic sectors, including plastics, construction, agribusiness, water, textiles, and metallurgy.62
Existing CBMs tend to focus on recycling, reuse, repair, refurbish, and remanufacture, although increasing instances of more sophisticated business models (PaaS) are emerging. Despite their degree of sophistication, to the extent that these CBMs displace production from traditional modes, they deliver immediate benefits in reducing their environmental footprint. The life-cycle CBMs based on existing products or secondary raw materials typically have relatively small impacts on global warming, acidification, and pollution compared with linear business models.
The rise of CBMs has the potential to disrupt key economic sectors. For instance, the sharing economy in the hospitality sector (of which Airbnb is
the best known model) is now estimated to be more than double the size of Europe’s traditional hotel economy and is having a huge impact on the hotel industry. The ‘uberization’ of taxi services in major cities has had the same disruptive impact. Industries that have shifted away from one-off product sales toward capital equipment as a service (extractive industries equipment, jet and ship propellers) have typically recorded higher than average margins, often through cost savings in maintenance, equipment use optimization, storage/logistics, and customer capture.63
But CBM innovations remain limited in scale, depth, and speed of adoption. Although instances of CBMs—whether adopted wholly or partly by a firm—are increasing, they are still limited in absolute terms and occupy a peripheral position in most markets, averaging a market penetration of between 5 and 10 percent in economic terms. Recycled materials (metals, plastics, pulp and paper) represent only 8.6 percent of raw material input, and remanufactured products account for only a tiny share of global manufacturing—the proportion of remanufacturing to new manufacturing in Europe is only 1.9 percent. Even producing secondary raw materials from waste only accounts for 30–40 percent of the physical output of the sectors in which it is most established (such as pulp and paper and steel).64
Source: Adapted from Mirjam Bani and Marieke Blom, “Rethinking the Road to the Circular Economy,” (January 2020), https://think.ing. com/uploads/reports/Rethinking_the_road_to_the_circular_economy _FINAL_RB1.pdf. and OECD 2019
62
63 European Parliament 2017.
64 Bocken et al. 2016; Circle Economy 2022; Geyer, Jambeck, and Law 2017; Van Ewijk, Stegemann,
Without rapid scale-up, the CE risks remaining a niche rather than a fundamental disruptor. This is true within sectors as well as often even in some of the larger firms that are pioneering CE models. If circularity entails the large profit opportunities foreseen by modeling exercises and advocates of the concept, why have competitive firms not embraced the concept already? What prevents the CE from reaching scale? Some of the answers lie within the firms themselves, but most are found well beyond them.
CBM penetration differs across EU MSs. As with any transition, countries’ initial conditions shape the potential gains from the shift toward circularity. Chapter 2 discusses how EU MSs depart from different starting points in terms of material flow composition and standard CE performance metrics. The private sector’s potential for circularity also differs markedly across countries. EU MSs, depending on their economic structure, show
Growth rate() by country and VAcategpcCE Norway
Netherlands Latvia Hungary Italy Slovenia Lithuania Denmark France Romania Poland Serbia Greece Slovakia Belgium Spain Finland Sweden Croatia United Kingdom Bulgaria Cyprus Austria Portugal Germany (until 1990 former territory of the FRG)
High CE VA pc
Mid-high CE VA pc
European Union - 28 countries (2013-2020)
Ranking of countries by VA growth rate (From top to bottom)
Value added from CE sectors (average, 2008-18)
Source: Eurostat 2021.
Growth rate of the CE Value Added
Mid-low CE VA pc Low CE VA pc
Category of countries by VA per capita (From top to bottom)
Value per capita, CE sectors (average, 2000-18)
Note: Indicator of CE impact includes ‘gross investment in tangible goods,’ ‘number of persons employed,’ and ‘value added at factor costs’ in three sectors: the recycling sector, repair and reuse sector, and rental and leasing sector. Data run from 2008 to 2018. Most countries have information after 2010. The VA growth rate was estimated as an average of annual growth rates. Data from 2008 to 2018 show that the growth rate of the value added generated by CE sectors varies across countries.
from Europe’s Circular Economy Transition
varying potential in key dimensions of a CE, such as sustainable inputs, extension of useful lifetime, or increase in the intensity of use.65 This is in line with the findings of Chapter 5 which show that countries’ different economic fabrics yield different economic gains and labor market effects, also depending on the suite of CE policies followed.
VA generated by CE sectors varies across countries. Growth rates of CE VA show how fast EU MSs have been moving in the transition toward CBMs (Figure 4.2). The speed of the transition depends on a country’s characteristics, with some MSs with lower growth rates already in the top category of economic impact (that is, higher CE VA per capita). Bulgaria and Romania are among the
countries with lower CE economic impact. Although Romania shows higher growth rates than Bulgaria, economic outcomes are still not significant. Croatia is on the borderline between mid-low CE and low CE VA per capita but with low levels of growth rates. If this trend continues, it may lose the modest CE economic impact achieved so far. Poland is in the upper of the mid-low CE VA per capita group, and its growth rate is above the EU average. Thus, it has a higher potential to move ahead, at a faster pace, in its CE economic standing among European countries.
Differences in the CE VA of countries depend on specific production drivers. Drivers of production are enablers allowing countries to
Source: Based on WEF (2018) data on production drivers.
65 Indicators of the category of sustainable inputs include circular material use rate; share of total organic area in total utilized agricultural area; and energy consumption in manufacture, transportation, and households. Indicators of the category of end-of-life include packaging waste recycle, generation of waste per GDP unit, industrial and municipal waste treated by recycle, patents to recycling, and secondary raw materials. Indicators of the category of extension of useful life include ELVs recovered and reuse, value added of retail sale of second-hand goods, and employment in repair and reuse sectors. Indicators of the category of increase of the intensity of use include individuals using websites or apps for transportation, accommodation services, collective transportation, and internet usage (European House - Ambrosetti and Enel foundation 2020).
In countries such as Romania, Bulgaria, Croatia, and Poland, where VA from the CE is still relatively low, a focus sector selection methodology can help better evaluate where policy makers’ actions should be directed to foster additional value creation and overcome barriers. To identify the barriers and enablers for adopting CE business models in the private sector more concretely in a country, targeting the right sectors is essential. A methodological approach to prioritizing sectors and evaluating their circular potential can help in better understanding the challenges and opportunities in the country context. The team developed such a focus sector selection methodology, including an evaluation of the CE potential in strategically relevant sectors. The first step involved selecting the strategic sectors according to their institutional and economic importance to the growing CE. Potential sectors were identified through a review of CE-related regulations, policies, national strategies, and action plans as well as other documents associated with industrial investments in markets and services (Annex 1). This first step produced a list of top five sectors which then allow for narrowing the prioritization down to the top three sectors with higher CE potential and impact over time. The second step determined the CE potential across 10 CE indicators, which allowed the sectors to be ranked. This step involved analyzing the top three sectors on their potential to adopt CE approaches in selected country examples with low CE VA, such as Bulgaria, Croatia, Romania, and Poland.
capitalize on emerging technologies and future of production opportunities. Countries with high and mid-high CE VA rank higher on indicators linked to drivers of production positively correlated with the CE VA, including technology and innovation, human capital, global trade and investment, and institutional framework (Figure 4.3). On the other hand, countries with mid-low to low CE VA are also ones that rank lower in the same indicators.66 The latter applies to Bulgaria, Croatia, and Romania, which rank low in terms of CE VA and indicators linked to drivers of production.67
Sectoral composition influences the potential for the emergence of CBMs. The analysis shows that although certain sectors such as machinery and appliances and food and beverages are common, the EU-4 countries show differences in terms of priority sectors (see Box 4.1).
Bulgaria’s main CE potential sectors are machinery and appliances, construction, and food and beverages. The first principal sector, machinery and appliances (orange), with 81 percent of circularity potential, has a better performance than construction and food and beverages. The results show (Figure 3) that this sector has enormous potential in the CE pillar: (a) extension of a useful lifetime regarding transport and distribution at 83 percent of circularity potential (for example, remote transport and geo-
localization, research, development, and innovation [R&D&I]); (b) sales at 100 percent of circularity potential (eco-labeling, servitization); and (c) useful life (reverse logistics), product life extension, and repairability at 100 percent of circularity potential. The secondary sector is construction (blue), with a total of 68 percent circular potentiality. This market presents excellent opportunities for improvement at the beginning of the pipe (key performance indicator [KPI] sustainable inputs at 56 percent), such as selecting local materials, fair trade, and using recycled or secondary raw materials (50 percent). Finally, the third leading sector is food and beverages at 53 percent of circularity potentiality (green). This sector shows significant opportunities for the enhancement of R&D&I to develop products with adequate traceability (50 percent) and fair trade with suppliers and the use of sustainable and green raw materials for packaging (87 percent).
Sectors including machinery and appliances, construction, and food and beverages display the highest level of circularity potential in Bulgaria and Croatia (Figure 4.6 and 4.7). The machinery and appliances sector (orange) has enormous potential in the CE pillar extension of useful lifetime (for example, distribution [83 percent], sales [100 percent], useful life [100 percent], product life extension [100 percent], and repairability [100 percent]). The second circular sector is
66 The drivers of production include about 60 indicators that aim to assess the country’s readiness for the future of production.
67 World Economic Forum 2018.
Source:
Original analysis for this publication based on The European House – Ambrosetti and Enel Foundation (2020).
construction (blue), with 68 percent circularity. This sector presents excellent improvement opportunities regarding eco-design (63 percent), secondary raw materials selection (50 percent), product life extension (58 percent) (industrial symbiosis with other industries), and repair and recycling materials (67 percent). Finally, food and beverages, with 53 percent of CE potential (green), is the third leading sector. This sector holds significant opportunities for improving packaging (87 percent) (eco-design, useful lifetime, and recycling), which is one of the most significant steps for these industries to achieve circularity in the value chain.
The most promising sectors in Poland include automotive, construction, and agriculture and food. Automotive (orange) presents the best CE potentiality (78 percent) among the main sectors (Figure 5.5). This sector has vast potential in the CE pillars: extension of useful lifetime and increase of the intensity of use through six KPIs (for example, distribution [83 percent], sales [89 percent], useful life [89 percent], product life extension [92 percent], repairability [100 percent], and recycling [89 percent]). The second circular industry is construction (blue), with 68 percent circularity. This sector presents good upstream development opportunities at the beginning of the tube regarding eco-design (63 percent), secondary raw material selection (50 percent), and ample end-of-pipe
opportunities at the end of the tube for reusing/ recycling materials in new facilities and construction (67 percent). The third main sector is agriculture and food (green), with 64 percent circularity. This sector has significant opportunities for packaging improvements (87 percent) in KPIs such as ecodesign (63 percent), useful lifetime (44 percent), and recycling (22 percent). Packaging is one of the most significant barriers for these industries to achieve circularity in the value chain. For example, the eco-design analysis improves the material use of secondary raw material selection (67 percent), and there are significant opportunities at the end of the tube for recycling packaging.
six KPIs (for example, distribution, sales, useful life, product life extension, repairability, and recycling). Food and beverages is the third leading sector, with 53 percent of circularity potential (green). This sector presents major improvement opportunities in packaging (87 percent) through different KPIs, such as eco-design, useful lifetime, and recycling.
Firms’ capacity to engage in CBMs depends on their position within production networks. Accelerating CE development at scale and prioritizing actions require strengthening sectors with circularity potential and firms’ links within production networks. CE sectors are often made of primarily local industries with different sectoral economic activities interconnecting with each other to form key product value chains. These activities include sustainable design, reuse, remanufacturing,
recycling, and repair and maintenance, among others. These links form the network of production supporting the emergence and consolidation of CBMs.68
CE business models require strong links across two types of sectors. The network structure of CEs is composed of supporting sectors [A] strongly related to key CE-related product value chains as well as ancillary sectors [B] (Table 4.1). Strong network connectivity between supporting [A] and ancillary [B] sectors correlates with higher CE VA in key product value chains. The 2020 CEAP identifies seven key product value chains as priorities for the transition: electronics and ICT; batteries and vehicles; packaging; plastics; textiles; construction and buildings; and food, water, and nutrients. Table 4.1 considers the EC CEAP value chains in relation to supporting and ancillary sectors. For instance, a key product value chain such as ‘electronics and ICT’ has two strongly connected supporting sectors [A]: ‘computer, electronics, and optical products’ and
‘telecommunications.’ In turn, these two supporting sectors are fostered by four [B] ancillary sectors: ‘electrical equipment,’ ‘IT and other information services,’ ‘machinery and equipment,’ and ‘business services.’
Network analysis shows different CE network connectivity between supporting [A] sectors and ancillary [B] sectors in Bulgaria, Poland, and Romania.69 Using information from OECD’s Supply Use Tables,70 Figures 4.8, 4.9, and 4.10 show the network for Bulgaria, Poland, and Romania, respectively. In these figures, red lines highlight the outgoing market business relationship from ancillary [B] sectors to other ancillary or supporting sectors. Blue lines highlight the outgoing market business relationship from supporting [A] sectors to other supporting [A] or ancillary [B] sectors. While it is normal for all sectors to be connected to others, strong CE production networks show several sector connectivity chains between supporting [A] and ancillary [B] sectors. The figures show that Bulgaria, Poland, and Romania have limited connectivity in their CE
production networks, with weak or nonexistent sector links. Compared with Bulgaria and Romania, Poland has a better-connected production CE network, with more sector connectivity chains and overlaps between them, with a likely reinforcement of spillover effects between sector chains. Bulgaria, on the other hand, shows fewer solid connections, revealing fewer business transactions.
To accelerate the transition, policy should focus on accelerating connectivity. Policy measures should aim to incentivize new business relationships and markets between CE transition sectors and other sectors to which they provide outputs or from which they receive inputs. Policy makers whose countries show little connectivity, such as in Bulgaria or Romania, should consider the incentivization of business between sectors connected with dashed lines or without connection, for example, through stakeholder platforms or cooperation initiatives to accelerate CE development.
Supporting CE sectors:
Transport equipment (TrnEq),

Manufacturing,
Repair & installation of machinery (RepM),
Information technology (IT).
Chemicals (Chml),
Machinery and equipment (MaEq),
Fabricated basic metals (MaMeb)
Manufacture of metals (MaMe),


Electrical equipment (EleEq),


Professional and technical services (Prof. services).
Ancillary sectors: • Motor vehicles (MotVe),
Transport,
Telecom,
Wholesale & retail trade,
Computers (Comp),
Construction, Rubber & Plastics (Plast),
Food, Beverage, and Tobacco (FoodBT),
Agricultural, Forestry, Fishing (AgrF).
Source: Based on OECD (2018).
69
The network analysis follows the same approach as the World Bank Group World Development Report (WDR) on GVCs (World Bank 2020), with the difference that here the focus is on local economies with a view to identify supporting and ancillary sectors related to CE key product value chains (see Table 4.1).
70 OECD 2018.
Supporting CE sectors:
• Transport equipment (TrnEq),
• Manufacturing,
• Repair & installation of machinery (RepM),
• Information technology (IT).
• Chemicals (Chml),
• Machinery and equipment (MaEq),
• Fabricated basic metals (MaMeb)
• Manufacture of metals (MaMe),
• Electrical equipment (EleEq),
• Professional and technical services (Prof. services).
Ancillary sectors:
• Motor vehicles (MotVe),
• Transport,
• Telecom,
• Wholesale & retail trade,
• Computers (Comp),
• Construction, Rubber & Plastics (Plast),
• Food, Beverage, and Tobacco (FoodBT),
• Agricultural, Forestry, Fishing (AgrF).
Source: Based on OECD (2018).
FIGURE 4.10: NETWORK ANALYSIS
Supporting CE sectors:
• Transport equipment (TrnEq),


• Manufacturing,
• Repair & installation of machinery (RepM),
• Information technology (IT).

• Chemicals (Chml),
• Machinery and equipment (MaEq),

• Fabricated basic metals (MaMeb)
• Manufacture of metals (MaMe),

• Electrical equipment (EleEq),


• Professional and technical services (Prof. services).
Ancillary sectors:
• Motor vehicles (MotVe),
• Transport, • Telecom,
• Wholesale & retail trade,
• Computers (Comp),
• Construction, Rubber & Plastics (Plast),

• Food, Beverage, and Tobacco (FoodBT),
• Agricultural, Forestry, Fishing (AgrF).
Source: Based on OECD (2018).
The business case for circularity typically revolves around well-defined considerations. Alignment with public expectations in line with ESG objectives is definitely one such consideration. But the drivers of private sector innovation stem more from the identification of profit opportunities than corporate responsibility considerations. Cost savings and higher margins resulting from using less material inputs and energy (including resilience to value chain disruptions) remain a core driver in several sectors, particularly the digital and electronics industry which increasingly relies on rare earths. Even more important are the commercial opportunities arising from product and business model innovations, including accessing new markets, delivering greater customer value, and diversifying the consumer base.71
Several barriers affect firms’ decisions and capacity to develop and implement CBMs. Limited progress with the introduction of CBMs is often blamed on technological constraints. Advances in recycling, design, and information technologies, particularly in digitalization and artificial intelligence (AI), can in themselves give rise to new CBMs. Stakeholder surveys, however, also point to a different set of barriers facing firms at different levels of their operating environment. At the micro level, there are barriers that are firm specific and typically under the direct control of firms. Meso-level barriers are found in the immediate environment surrounding a firm’s operations. These barriers affect cross-firm behavior, for instance, along and across value chains and sectors, where cooperative behavior can be hindered. At the macro level, there are barriers relating to the way entire markets operate and policy is made. While interlinked in several ways, some of these— particularly the macro-level barriers—shape and reinforce the others (Figure 4.11).72
Introducing CBMs often requires an overhaul of corporate cultures, values, and beliefs. Companies’ values shape their behavior, including choices on business model innovation and entry into new markets. Organizational inertia— the inability of firms to adapt to shifts in their environment—can generate strong internal resistance to change, including in relation to sustainability-oriented business model innovation. Dedicated surveys indicate the private sector’s doubts regarding the potential to move to CBMs, with firms seeing their own organization as the main barrier to a transition to CE. Even in leading countries such as the Netherlands, the CE innovations are frequently restricted to the corporate social responsibility (CSR)/environmental departments of a firm, with more influential departments in a firm (for example, operations or finance) taking only a limited interest. Without addressing corporate values, the expectations of advocates and policy makers of the private sector’s driving role in the CE transition will go unmet.73
Business leaders’ commitment is a key enabler in CBM innovation. Companies with markedly ‘linear’ backgrounds will naturally find behavior change harder. However, while corporate value systems can be and are changed from within, forces outside the firm can encourage or hinder change. If the reputational market value of firms being CE-friendly prevails among consumers, this can incentivize firms to promote a CE corporate culture.74
Business model innovation necessitates adequate firm-level capacities. From a capacity perspective, CE business practices require a specific set of organizational resources to be managed or developed throughout the innovation process. This ranges from rethinking product offerings, redefining the target customer base, and in some cases changing revenue streams and financing models.75 Take the example of a firm that is considering shifting to a PaaS business model. The shift would alter cash flow and up-
71 Adapted from UNEP (2021).
72 Kirchherr et al. 2018; Geissdoerfer et al. 2017; Masi et al. 2018; Rizos et al. 2016.
73 Deloitte 2017.
74 Bertels et al. 2010; Linnenluecke and Griffiths 2010; Matinaro and Liu 2017; Rizos et al. 2016; Salvador et al. 2020; Schaltegger, Hansen, and Lüdeke-Freund 2016.
75 Ünal, Urbinati, and Chiaroni (2019) suggest size has an impact, and Salvador et al. (2020) describe size as a limiting factor.
front investment dynamics, with information gaps regarding links up and down the value chain and associated financing risks, thus making access to credit more challenging.
Uncertainties related to the novelty of the transition compound firms’ risk perceptions. Although corporate value systems and capacities can be and are changed from within firms, outside forces can encourage corporate inertia. The nascent nature of the CE transition is one. Uncertainties can be numerous and varied in nature. Depending on the specific CBM, they can include (a) doubts on the quality, quantity, and timing of product returns in reverse logistics; (b) customer perceptions on used or remanufactured products; (c) regulatory compliance with health and safety provisions; (d) litigation risks related to new circular products; (e) unknown residual product value; (f) the impact of future legislation; (g) long payback periods typical of CBMs; and (h) dynamic contextual factors, such as
rapid technological shifts and market volatility.76
Risk perceptions arising from linear to circular shifts extend beyond the firm, affecting access to finance. Overall, the financial sector sees circular projects as highly risky and often not bankable. When measuring risk, two main factors have to be considered: (a) the creditworthiness of the borrower (or the risk profile of the project) and (b) the value of the collateral (for example, underlying assets or contracts). As new CBMs often do not have a strong track record, these firms can easily be labeled as being too risky. Often, initial investments to innovate and access the market are high, which may have implications for margins in the short run but may lead to a profitable company in the longer run. The value of the collateral is measured by the market value of the company, where the valuation of assets (and their residual value) plays an important role—asset valuation for linear business models may be different from valuation in a circular system.77
76 Antikainen and Valkokari 2016; Guldmann and Huulgaard 2020; Hopkinson et al. 2018; Linder and Williander 2017 77 ING.
Activity Corporate Department CE Practice
Design Research, Innovation and Design
Buy Procurement
Bio-mimicry, Cradle to Cradle, Design for: disassembly/deconstruction
Design for flexibility, recoverability/recyclability, durability, regenerative design, modularity and standardization, green chemistry
Bio-based, biodegradable, compostable resources; critical raw materials and rare earths substitutes, Reclaimed, Recycled, Renewable, Reused/reusable resources, Safe chemicals, Services (not products)
Make Production and Manufacturing Additive manufacturing, Dematerialization, Jidoka (autonomation), Kaizen (continuous improvement), Kanban (just-in-time), Lean manufacturing, Poka Yoke, Prefabrication, Refurbishing, Re-manufacturing, Resource efficiency, Six-Sigma
Sell Sales and Marketing
Dispose Waste Management
Finance Finance and Accounting
Co-branded services, Digitization and virtualization, Leasing, Pay-per-service unit Sharing platforms
Cascading Compatibilizers, Composting, Deconstruction and disassembly, Energy recovery, Feedback recycling, Industrial symbiosis, Recycling, Re-purposing, Reverse logistics, Secondary material marketplaces, Selective extraction, Takeback programs, Waste to Energy
Assess creditworthiness risk, Assess ESG risk, Assess linear risk, Extend investment time horizon, Factoring, Incentives end-of-life returns, Integrate circular value in models, Natural capital valuation, Prioritize cash flow, Purchase order finance, Standard asset management, Supply chain financing
Source: Original elaboration for this publication.
These challenges are compounded for small and medium enterprises (SMEs), which are central to Europe’s transition. SMEs dominate the private sector landscape in several EU countries. Smaller firms may not have the capabilities or financial resources to engage in organizational transformations, particularly when high up-front investments are required. Although the circularity innovation landscape is rife with start-ups capable of capturing niche markets, when the issue is going to scale, a firm’s size matters. Shifting from BAU linear business models to CBMs requires strong functions in distribution and production planning, inventories, reverse logistics management, and marketing. Overhauling such a set of core functions requires substantial amounts of time and investment on the firm’s part, which can deter initiatives to explore and invest in CE activities. In addition, SMEs typically have few resources to invest in technological R&D and little ability to influence the behavior of other firms in their value chain.78
78 Rizos et al. 2016.
Information costs and risk perceptions can be smoothened out by favoring collaborative knowledge generation and cooperative learning among firms throughout production networks and across value chains. In addition to identifying common necessary changes in production processes and bringing down information and innovation costs by sharing data and best practices, shared knowledge platforms can help firms organize their interaction with government policy makers and regulators. This interaction should be done with a view to improving the overall business environment, standardizing or harmonizing the technical characteristics of products, and creating transparent industry-level incentives that better support the industry development of the CE and possibilities of new CBMs.
Regulation and incentives can encourage manufacturing for durability and avoiding planned obsolescence. Right to Repair policy approaches include making consumer manufacturers responsible for ensuring reparability and providing access to the necessary spare parts for an extended period. Obligatory extended warranty systems go a step further by making the producer accountable for either the repair or replacement of the product. Extended producer responsibility or end-of-life regulations make manufacturers responsible for the adequate collection, treatment, and recovery of products. Turning appropriate disposal of goods into a cost for the manufacturer can incentivize them to improve durability. EU countries are at the forefront in the application of these instruments. Requiring durability of products, however, may prove insufficient to fully stimulate firms to shift to a servicesled product due to the myriad of challenges they face. Many of these are internal organization challenges, from restructuring, operationalizing changes, and shifting attitudes among teams to finding the correct pricing strategy across their market segments. While resolving these depends mostly on managerial strategies, there are other more fundamental issues where government intervention could catalyze change. First is the scale of changes. Whereas capital equipment sales volumes are typically low, in the consumer goods markets, a services model requires keeping track of millions of items in every market. Digital technology is essential in making this both possible and economically feasible. The internet of things (IoT) can provide companies with up-todate information on the status and use of their products. IoT, nonetheless, requires widespread and low-cost digital connectivity and infrastructure and sufficient human capital with digital skills to enable manufacturers to build the data systems required to manage, analyze, and act on the information from each consumer product. Governments need to accelerate developments in digital connectivity and infrastructure and invest in human capital development in digital (See Annex 4, Focus Section E). Second, the shift to PaaS has a major impact on short- and medium-term cash flow within businesses. Continued equipment ownership by the manufacturer means that the manufacturer must assume full up-front costs of that product. The information asymmetries regarding how potential services clients might treat these products increases the risk associated with financing them, making it more difficult or expensive to borrow. Third, due to weak and fragmented buyer power in consumer goods, it is difficult for individual consumers to make demands of producers to change their approach and the latter thus have little incentive to change.
Clustering has important network effects in lowering the costs of the transition faced by firms. Clusters are geographically close groups of interlinked companies and ancillary agencies within or across sectors that share commonalities and externalities. In facilitating collaboration between private companies, public stakeholders, investors, and knowledge institutions, clusters can be powerful tools in closing material loops in systems of interconnected firms. They result in (a) less dispersed value chains; (b) economies of scale and scope through shared core corporate functions; (c) improved operational and resource efficiencies in manufacturing, transport, and input-output links; and (d) knowledge spillovers and other forms of industrial symbiosis. Studies show that clusters also promote circular approaches for firms not explicitly aiming to implement CBMs. The analysis in Section 4.3 shows that industrial density matters in establishing networking effects. Industrial density
79 Cluster Excellence Denmark 2019; Porter and Kramer 2011, 2019.
is higher in Western Europe MSs, where more than 250 circularity relevant clusters are already operating. In Eastern Europe, where the industrial landscape is more scattered, additional incentives will be needed to support the development of circularity-oriented clusters. Selected examples can be found in Box 4.3 79
Value chain organization can reduce transaction costs across markets and geographies. Value chains shape input-output relationships and the collaboration of participating firms and in themselves are already established networks where firms can collaborate toward CBM innovation along the design-make-sell-dispose and finance spectrums. Because of their size and clout, lead firms in GVCs have a key role to play in stewarding the CE transition. Lead firms can shape the design of products, require resource efficiency standards in production processes,
identify investors, create and open new markets, and engage in supply chain financing for new CBMs. GVCs become particularly relevant when the objective is to encourage CBM innovations across markets and geographies.
In addition to generally being relatively labor intensive, CBMs tend to require relatively higher skill levels. ‘R’ activities, such as reuse, recycling, repurposing, refurbishing, and so on, are relatively labor intensive compared to their linear alternatives. Jobs directly associated with the CE were estimated to employ 3.9 million people in Europe as of 2018, up from 3.4 million in 2014. Circular jobs are currently mostly concentrated in higher-skill categories and will continue to be so in the future. Reverse logistics, resource sorting and product refurbishing all require sophisticated skill sets. As to be discussed in Chapter 5 labor market effects induced by the CE transition will have a clear skills bias. Labor market constraints will pose a considerable barrier to firms, particularly in countries with a higher concentration of unskilled workers, such as the EU’s Eastern Europe MSs examined in the report.80
Beyond firm-specific and intra-firm barriers, macro-level constraints limit the private sector’s potential to innovate. Today’s global economy is driven by linear business models sustained by economies of scale. The take-makedispose model has since prospered through policies designed around it. The activities of today’s economic operators are shaped by systems developed and optimized for the prevailing linear production and consumption. Regulations, markets, investment tools, and practices, including financial risk assessment, are adjusted to linear models, and externalities linked to linear business models are largely not considered.
Consumers are not yet driving demand for circular products. Surveys show that although consumers are increasingly asking for circular products, only a minority are willing to pay up for them. Perceived quality issues, lack of understanding of the environmental benefits, and particularly higher costs per se are key barriers. These results suggest that willingness to pay and
Clustering starts at the firm level. In Poland, AgroBioCluster promotes and channels circular vouchers, C-VoUCHER, to their members. C-VoUCHER is the first pan-European initiative funded by the EC to support SMEs in rethinking business models, providing access to new knowledge, linking to smart green venture capital, and opening doors to new markets and customers. Swedish (Paper Province cluster) and Danish (Circular North Denmark) clusters engage companies in a CE while creating synergies between social, sustainable challenges and business. Finland and Holland also play a central role in building circular knowledge bridges between research and business. For instance, Tapojärvi Oy is a Finland company specialized in mining services, industry processes, and material handling. The cluster has been supporting the company to achieve its goal that no disposable waste would be generated at any stage. To promote CBMs, government can take various measures to create networks between public and private companies. In the Netherlands, the central government has set up the Versnellingshuis Nederland Circular and launched the programs Van Afval Naar Grondstof (VANG) and the Ruimte in Regelels voor Groene Groei (Space in Rules for Green Growth). The International Council for Local Environmental Initiatives (ICLEI) focuses on how local governments can lead the transition to a CE. Their project and initiatives tackle issues of production, consumption, and waste prevention from multiple perspectives.81
80 EC 2018.
81 Arctic Smartness, n.d.; Holland Circular Hotspot 2022; ICLEI n.d.; OECD 2020; Polish Circular Hotspot, (accessed in March 2022), http://circularhotspot.pl/en; Versnellingshuis Nederland Circular n.d.
increased demand for circular products require broad-based awareness campaigns plus accepted definitions and labelling of circular products which are currently not existing. Even with those in place, businesses will still face the challenge of making circular products price competitive compared to their linear alternatives. Until this is achieved, the public sector can contribute to making and supporting markets for circular products through public procurement measures (Annex 4, Focus Section F).82
Labor market features affect firms’ uptake of CBMs. Circular jobs are today mostly concentrated in higher-skill categories and will continue to be so in the future. Business in countries with higher concentrations of unskilled workers—such as the Eastern Europe MSs examined in the report—will find it comparatively harder to locate adequate resources as well as customers—consumers of circular products at times may require additional skills. Digitally enabled PaaS models, such as those based on mobility applications, are accessible to citizens who can use digital tools.83
Emergence of CBMs is limited by policies designed for take-make-dispose economic models. The activities of today’s economic operators are shaped by systems developed and optimized for the prevailing linear production and consumption systems. Linear policy lock-ins constrain the emergence of CBMs on a number of fronts—starting with regulation. Regulation is the area where policy makers, starting first and
foremost with the EC, are creating the enabling framework for circularity, both through actual regulatory reforms or by helping to increase companies’ capacity to factor their impacts into business decisions. But regulatory barriers remain—they can be divided into three categories: (a) regulatory gaps lowering CE uptake, (b) regulatory conflicts across sectors affecting CBMs, and (c) regulations related to materials and resources actually hindering CE goals. Insufficient implementation and enforcement of recycling targets and landfill bans as well as the lack of quality standards for repair activities are examples of regulatory gaps. Examples of regulatory conflicts include provisions addressing health and safety standards which affect progress on food waste reduction and plastics use. Regulatory conflict compounds the effect of adversarial regulations preventing key CE practices such as those limiting the use of recycled materials in road construction or restrictions regarding cross-country waste trading.
The price competitiveness of circular products will continue to limit the attractiveness of most CBMs. An enabling regulatory environment can have faster and deeper impacts once circular products can compete with linear products based on true pricing. Not only are the externalities linked to linear business models not considered in the pricing of virgin natural resources, but they are also directly supported, for example, fossil fuel subsidies. In addition to providing a disincentive to key circularity objectives in the energy sector,
Secondary materials are those that cease to be waste through appropriate preparation and processing (taking into account EN15804) and can therefore be used as a substitute for primary materials. The construction industry currently uses almost no secondary materials. For instance, in the Netherlands, a leading country in the CE, secondary materials account for only 3–4 percent of all construction materials used in buildings. When materials are separated during the demolition of buildings, they are classified as waste because of health and safety regulations which prevents their reuse in construction. The latter typically fall within the framework of national and EU waste legislation, while use of CDW in construction, on the other hand, is regulated by the Construction Products Regulation [CPR] (EU, Regulation No. 305/2011). To promote recycling, CDW needs to stop being classified as waste and should be given the status of ‘end-of-waste’ material, to be covered by product—not waste—regulations. Only a few countries (Austria, Belgium, France, the Netherlands, and the United Kingdom) have developed end-of-waste criteria for CDW.
82
83
such as resource efficiency and the penetration of renewables, fossil fuel subsidies shape the cost structures of extraction, transport, and production of materials and products, lowering the cost of linear products for the consumer. Despite its decarbonization objectives, Europe’s fossil fuel subsidies have remained at close to €50 billion since 2008. When using bottom-up, inventory methodologies and including less traditional (often off-budget) subsidies provided through fiscal support, public finance, and investment by stateowned enterprises, the measures are even higher. This is particularly the case in energy-intensive economies such as Bulgaria, Croatia, Poland, and Romania, where total fiscal support to fossil fuels is estimated to range between 0.2 percent of GDP (Romania) and 3.1 percent (Bulgaria).84
Limiting the current levels of fiscal support to the linear economy is the priority. Beyond fossil fuels, all major natural resource-based sectors are heavily subsidized—agriculture, fisheries, forestry, water, and mining.85 Natural resource extraction is often subsidized (a) directly by government budgetary and tax measures, (b) indirectly by trade and other policy instruments that alter price signals, and (c) implicitly by allowing producers not to internalize the costs of externalities associated with the production process or to include in the price the opportunity cost of immediate consumption. In certain sectors, such as metal production, subsidies make mineral resources more profitable and accessible to extract than the corresponding resources in the built environment. Similarly, recycled plastics end up costing substantially more than virgin plastic. This, combined with the fact that secondary materials typically struggle to achieve the same level of quality as virgin production, means that businesses have little or no incentive to use secondary materials, despite well-known environmental benefits.86
Firms are and will remain the engines of CE. Adopting CBMs is likely to generate positive returns on (economywide) aggregate welfare. Still, effects
84 World Bank 2021c.
on private returns might not be necessarily positive, at least in the short term, due to immediate impacts on costs. In this context, each firm is expected to react differently, and the adoption of CBMs at the firm level will also be contingent on the firm’s intrinsic characteristics—firm size, age, export orientation, ownership structure, and managerial practices which are key determinants of change and capacity for business model innovation. But in addition to firm-level heterogeneities, individual firms’ capacity to benefit from and drive the transition is determined by differences in their external operating environments—the economic fabric and the policy landscapes in which they conduct their transactions.
Important barriers prevent them from accelerating, scaling, and deepening the transition. Some of the constraints faced by firms in engaging in CBMs are similar to those they face in linear economies, but they typically are of a different scale—access to finance is one example. While certain barriers are under firms’ full or partial control, others fall squarely outside of it, which in turn shape firm specific constraints. To unlock the potential of the private sector, policy needs to address these barriers one by one, as firms on their own will not be able to tear them down, particularly those at the meso and macro levels.
Enabling the private sector’s role requires multifaceted policy packages. Supporting policies include changing economic incentives such as through fiscal measures, changing public investment and procurement processes, providing targeted funding, supporting cross-firm knowledge spillovers, encouraging business-to-business collaboration, and investing in skills.
Europe’s public authorities will need to support businesses in filling the circular skills gap. Central and subnational governments can address the CE skills gaps through various measures, for example, by (a) financing dedicated labor market needs assessments of CE development trends, business demand, and existing educational offerings; (b) financing or subsidizing targeted skills development programs where the market does not
85 Environmental Assessment Institute 2005; Porter 1996 86 Environmental Assessment Institute 2005; Johansson, Krook, and Eklund 2014; Porter 1996.
Policies from Europe’s Circular Economy Transition
generate them; and (c) supporting coordination across education and industry actors to establish circular skills development partnerships.87
Supporting policies will be particularly important in MSs in need of catching up on the CE agenda. Different countries show differing levels of readiness at the outset of the CE transition. This chapter shows that, while displaying potential, particularly in key sectors, the four MSs targeted by this analysis are lagging in those areas where other MSs are leading the CE transition, namely the industrial density needed to generate cross-firm links, consumer awareness, and skills presence. The significant material efficiency gains that can
be reaped in these MSs (see Chapter 2) call for an additional policy and investment focus.
Policy lock-ins mask the risks facing linear business models. Linear business models face uncertainties posed by fluctuating raw material prices, scarce materials, geopolitical dependence on different materials, and uncertain demand. But for most firms, linear risks are still outweighed by the uncertainties that CBMs face in changing key building blocks of their business, navigating against dominant business paradigms, and confronting barriers stemming from the current economic models and the policies built to support them.88
87 Circular Jobs Initiative 2021.
88 Bocken, Boons, and Baldassarre 2019; Circle Economy 2018.

This chapter aims to assess the implications of alternative policy choices for achieving CE objectives and their wider economic and social impacts. It builds on the insights provided in previous chapters on the dynamics that determine the use of primary materials, including the incentives that shape private sector decisions and the role of trade. Given the broad scope of CE and the need to influence both supply- and demand-side decisions at the local and global levels, policy responses will likely need to be comprehensive, incorporating elements of fiscal, trade, and regulatory policy and potentially even education policy and public communication to influence consumer preferences. Ultimately, the success of CE policies will depend not only on how they contribute to reduce material use but also on their relative economic and social impacts, including the degree to which they encourage or discourage investment, how they influence processes of structural economic change, and their distributional consequences.
Because these issues involve complex processes shaped by changing prices, trade patterns, and technology choices, this chapter makes use of a unique global CGE modeling exercise to assess the economic impact of achieving CE policy objectives and how outcomes differ across alternative broad policy approaches. The analysis explores the outcomes of CE policy across a number of dimensions:
• Sustainability: How do CE policies affect use of primary materials, both from the production and consumption perspectives? What impact do CE policies have on broader sustainability objectives, notably reduction in GHG emissions (and conversely, to what degree do policies targeting GHG emissions reduction reduce primary materials use?)
• Resilience: How do CE policies affect import dependence and exposure to primary commodity shocks?
• Growth and competitiveness: How do CE policies affect growth? What are the implications for competitiveness of European producers in domestic and export markets?
• Development: How do CE policies affect development outcomes of trading partners, particularly developing countries?
• Inclusion: How do CE policies affect distributional outcomes through price and labor market channels?
The analysis focuses on Europe,89 and selected country-specific results for EU-4 are also included to illustrate or highlight differences in the overall findings. The remainder of this section summarizes the modeling approach. Section 5.2 motivates the need for CE-specific policies. Section 5.3 provides an overview of the overall impacts of CE policies on achieving core CE sustainability objectives. Sections 5.4 and 5.5 follow on from the discussions in previous chapters, assessing the implications of domestic and trade policy options for achieving CE aims. Section 5.6 assesses economic and distributional impacts of CE policies. Finally, Section 5.7 concludes with a summary of main findings.
The model is based on a newly developed CE database that allows to splitting primary and secondary activities for key materials. The standard GTAP database that underlies nearly all global CGE modeling efforts, including those focused on the CE policies,90 does not provide sufficient representation of production technologies (that is, primary, secondary, and recycling activities), mining sectors (for example, metal ores and Nonmetallic Minerals [NMM]), and information on the quantity flows of the corresponding resources required for a consistent assessment of the CE transition pathways. To overcome this limitation, a specific version of the GTAP-CE database has been developed for this report (Box 5.1) to allow for detailed reporting on primary materials.
89 In this chapter, ‘Europe’ refers to countries in the EU as well as EFTA countries and the United Kingdom—see Annex 2 for detailed country coverage of the modeling.
90 Bibas, Château, and Lanzi 2021; OECD 2018; Winning et al. 2017.
The modeling focuses on critical materials but does not cover all aspects of what could be considered part of the CE. The analysis of primary materials presented in this chapter encompasses metal ores, NMM, and fossil fuels but does not include biomass. It also does not explicitly cover aspects of the CE related to water use and agriculture or energy efficiency.
The GTAP-CE database introduces additional disaggregation of certain GTAP sectors and incorporates material flows accounting for the selected commodities. The starting point for the disaggregation is the GTAP-Power 10 database with 76 sectors, 141 regions, and 2014 reference year (Chepeliev 2020). Four sectors of the original GTAP-Power 10 database are further split into 23 subsectors, providing a more detailed representation of categories such as metallic and nonmetallic minerals mining, rubber and plastic products, iron and steel, and nonferrous metals (see Annex 1). Corresponding sectoral splits are developed for all 141 regions reported in the GTAP-Power 10 database.
The analysis relies on a recursive dynamic global CGE model, the ENVISAGE model, calibrated on the GTAP-CE database. For modeling, an aggregation of the GTAP-CE database that includes 20 regions and 42 activities is used (see Annex 2). Three specific features of the model should be highlighted in the context of the current analysis: (a) the model assumes that different electricity generation technologies and primary versus secondary production activities produce homogenous goods; (b) the model includes a wage formation mechanism that allows for short-run deviations from full-employment (induced by the policy shock) but long-term equilibrium between labor supply and demand; and (c) ENVISAGE uses vintage capital specification, with old vintage representing installed capital and new vintage representing the most recent supply of capital. The former is meant to be only partially mobile across sectors, whereas the latter is fully mobile. Finally, the
model runs through 2030 and so should be viewed as reflecting the relatively short-run impacts of CE.
ENVISAGE is applied to simulate a baseline and a set of stylized policy scenarios which intend to represent main pillars of CE transition. The starting point is a baseline scenario (BAU), which is ‘policy free’ except for countryspecific Nationally Determined Contributions (NDCs). NDCs are converted to country-specific prices on carbon that depend on a country’s economy and carbon intensity and the stringency of its commitment and are achieved using countryspecific carbon prices.91 NDC mitigation targets are derived from recent empirical studies.92 The actual reference point for the policy simulations, however, is based on a scenario that represents an interpretation of the EU’s Green Deal mitigation target (EGD-NDC). While the Green Deal in practice includes a broad range of environmental objectives and instruments,93 the modelled EGD-NDC scenario focuses on achieving the EU’s enhanced NDC target of reducing CO2 emissions by 55 percent by 2030 relative to the 1990 level (compared to 40 percent in the BAU scenario). Again, the model achieves the target primarily through a carbon price, although several fiscal policies are implemented within the EGD-NDC scenario to complement carbon pricing, including removal of production subsidies to fossil fuels and transportation activities (production tax rates are set to 3 percent), increase in the sales tax for petroleum products (by 5 percent), and subsidy to renewable generation (5 percent). Thus, the reference scenario in the model incorporates emission reduction policy but no explicit measures targeting reduction of material use.
91 Actual implementation of a country’s mitigation policy is likely to rely on one or more instruments, which may or may not include an explicit carbon price.
92 Böhringer et al. 2021; Chepeliev et al. 2021. 93 EC 2019.
Environmental fiscal policy is well established. Environmental taxes and levies are used in virtually every jurisdiction as a tool to cut pollution levels and, of course, to raise revenues. Their rationale is grounded in the Pigouvian principle of internalizing the environmental impacts and therefore addressing market failures and their welfare implications (Annex 4, Focus Section C).
Circular taxation addresses key bottlenecks affecting the transition. Circular taxation aims to change economic agents’ incentives toward circular principles rather than traditional linear models. Conventional environmental taxation targets end-of-life stages of production and consumption, leaving aside other stages of the product’s life cycle. Levels of taxation are often too low to alter behaviors. Rather than a product-by-product approach, circular taxation requires rethinking critical building blocks of current taxation systems. A CE taxation framework includes the following building blocks:
• The introduction or strengthening of taxes on raw materials.
• A general shift from labor to resource/material taxes
• A reconsideration of value added tax (VAT) application
• The strengthening of waste management taxes, starting with stronger landfill taxes
• A general shift from taxation away from ‘services’ to ‘material intensive products.’
Material taxes can achieve both environmental and revenue raising results. In addition to (a) internalizing the environmental externalities arising from resource extraction and use and (b) supporting environmental regulations addressing the relevant market failure, raw material taxes address concerns of resource depletion and encourage the substitution of virgin material resources with secondary and recycled materials. From a fiscal resource point of view, the current centrality of raw materials in economic activity and its likely persistence in the future imply a low long-run price elasticity of demand. Raw material resources could thus represent a stable tax base for governments.94
While the use of fiscal tools is recognized as critical to advance the transition, their use remains relatively limited in Europe. Both the Green Deal Communication and the CEAP make reference to the relevance of fiscal instruments to promote the transition. The 2015 EU CE Action Plan states that “price is a key factor affecting purchasing decisions, both in the value chain and for final consumers. Member States are therefore encouraged to provide incentives and use economic instruments, such as taxation, to ensure that product prices better reflect environmental costs.” So far, however, the main initiatives have been focusing on the energy/ climate sectors, in the context of the revisions of the energy taxation directive and the introduction of the carbon adjustment border mechanism. The utilization of fiscal measures to promote circularity by altering relative prices and changing the behavior of firms and consumers has not yet been addressed widely. Indeed, just 5.9 percent of total tax revenues in the EU come from environmental taxes (versus almost 52 percent from labor taxes), and environmental taxes as a share of GDP have declined by 20 percent over the last two decades. Nevertheless, some good examples exist:
• In Denmark, a tax on extracted raw materials (sand, gravel, stones, peat, clay, and limestone) was introduced in 1990 in conjunction with a waste tax, to reduce the use of these natural materials and promote the use of recycled products, such as CDW. The combined aggregate and waste taxes have produced a greater demand for recycled substitutes: in 1985 only 12 percent of CDW was recycled, compared with 94 percent in 2004. The Danish model of sorting CDW at source is an effective strategy of increasing the supply of recycled material, according to the study.
• In Sweden, since 2016 a deduction of 50 percent (RUT tax deduction) on labor costs has been allowed for home repairs and maintenance, to support product lifetime extension.95 Similarly, in 2017 Sweden introduced a VAT reduction from 25 to 12 percent for repair of products such as textiles, shoes, leather products, and bicycles.96 Belgium has introduced a reduced VAT rate of 6 percent for demolition and reconstruction activities, while Ireland, the Netherlands, Slovenia, Luxembourg, and Finland have introduced VAT reductions for certain repair services.
Source: Adapted from Milios (2021).
The main scenarios are structured around reduction of primary material use in the EU, that is, improving circularity. These are specified in Table 5.1. Apart from the BAU scenario, all policy shocks introduced in the scenarios apply only to Europe. They will be introduced from 2023 and fully implemented by 2027. The first set of scenarios considers various fiscal policy approaches, with a focus on reducing extraction and production using primary materials. As discussed in Chapter 4, linear business models often benefit from subsidies across the value chain as well as not having to pay for resulting environmental externalities. Fiscal policies are therefore likely to play a critical role in levelling the playing field between linear and circular business models by pricing in environmental externalities (Box 5.2). Getting prices right through fiscal policy will also be critical to underpin the effectiveness of regulatory policy. Scenarios presented here assess policies whereby (a) a tax is imposed on primary production of metals (for example, steel, aluminum, and copper) and plastics (metals and plastics - tax); (b) a subsidy is granted to secondary production that uses recycled
95 Almén et al. 2020. 96 OU 2017. 97 EEA 2008.
materials (metals and plastics - subsidy); and (c) both the tax and subsidy are combined (metals and plastics - total). In the case of construction materials (NMM such as limestone and clay), which account for the largest share of primary materials (in volume terms), recycling and secondary production are uncommon, so only a tax scenario is considered (Non-metallic minerals - tax). Following the approach in the United Kingdom and elsewhere,97 the scenario imposes a tax on extraction of raw minerals rather than taxing the production of processed commodities. This different treatment of metals and construction materials also offers the opportunity to see how outcomes differ when imposing taxes at different stages in the value chain.
Chapter 3 highlights the likelihood of trade leakage along the value chain as a result of material taxes, a finding that is replicated in this chapter. This chapter therefore also considers, for both metals and construction materials, additional scenarios assessing the implications of trade policy action that extends the tax on domestic producers to also cover foreign producers exporting to Europe, through the imposition of a tax at the
border (metals and plastics - total*BAT and Nonmetallic minerals - tax*BAT) 98
Finally, the analysis considers alternative approaches for using the revenues generated by materials taxes. Essentially, revenues can be distributed (through the government) to three agents: (a) to producers, to reduce corporate taxes or provide a general or targeted subsidy, for example, a subsidy on the use of secondary materials; (b) to consumers, through income tax reductions or direct transfers, potentially targeting households likely to lose out from the transition;
and (c) to workers and employers, through labor tax relief. Given the heavy burden of labor taxes in Europe and the likelihood that CE policies will shift the balance of demand toward (skilled) labor,99 as discussed in Chapter 4, the analysis considers the implications of a scenario whereby tax revenues are used to reduce taxes on labor (metals and plastics - tax*labor) rather than transferred directly to households, which the default for all other scenarios. The primary metals and plastics tax scenario is chosen to illustrate this alternative revenue recycling scenario.
BAU
EGD-NDC (Reference scenario)
Reducing extraction and production/ increasing recycling
Metals and plastics - tax
Metals and plasticstax*labor
Metals and plastics - subsidy
Metals and plastics - total
Metals and plasticstotal*BAT
Initial scenario, which includes interpretation of global NDCs100 and implemented using carbon prices to drive decarbonization
BAU plus an interpretation of the EU’s NDC commitment under the EU Green Deal intended to lead to a 55% reduction in EU CO2 emissions in 2030 relative to 1990 and implemented with carbon prices to drive decarbonization
EGD-NDC plus 30% tax on primary production of metals and plastics in Europe only
(sub-scenario) Metals and plastics - tax with recycling of all additional tax revenue from taxing primary production of metals and plastics by reducing labor taxes (uniform reduction across all sectors)
EGD-NDC plus a 30% subsidy on secondary production of metals and plastics in Europe only
EGD-NDC plus a 30% tax on primary production of metals and plastics and a 30% subsidy on secondary production of metals and plastics in Europe only
Metals and plastics - total with BAT based on the content of primary metals and plastic embedded into imports of manufactured goods plus a subsidy to exporters to offset the impact of the primary materials tax on the value of materials embedded in export products
98 BAT = Border adjustment tax.
99 EC 2022.
100 Based on countries’ first NDC submissions to UNFCC.
Non-metallic minerals - tax
Non-metallic mineralstax*BAT
Redesign/‘design out’ materials and material waste
Redesign
EGD-NDC plus 20% tax on mining and imports of Nonmetallic minerals (construction materials), with rebate for exports
Non-metallic minerals - tax with BAT based on the content of NMM embedded into imports of manufactured goods plus a subsidy to exporters to offset the impact of the primary materials tax on the value of materials embedded in export products
EGD-NDC plus an improvement in the efficient use of materials in six activities (wood and paper products, primary plastics, secondary plastics, metal casting, other manufacturing, and construction) in Europe only. The improvement in materials’ use affects the use of wood and paper products, chemicals, plastics, plastic recycling, NMM, iron and steel, recycled steel, aluminum, recycled aluminum, copper, recycled copper, other metal products, other recycled metals, metal casting products, and other manufacturing. The improvement is 2% per year starting in 2023. These improvements are compensated by increasing use of other services per unit of output due to higher R&D, design, and other expenditures
Extending product lifetime Product life extension
EGD-NDC plus a 20% reduction in the final consumption of other manufacturing with respect to EGD-NDC, achieved by an increase in the consumption of other services, in Europe only (demand for all other categories is fixed at the EGD-NDC level)
Shifting consumption patterns away from materials
Combined
Consumption bundle shift
EGD-NDC plus a 20% reduction in the final consumption of material goods (including fossil fuels) achieved through changes in consumption (through phantom taxes) in Europe only. In this scenario, there is a compensating increase in the consumption of other (nonmaterial) goods
Metals and plastics - tax + Non-metallic minerals - tax + Redesign + Consumption bundle shift scenarios101
The second set of scenarios focuses on CE actions that affect the upstream design and consumption of products. Such actions are likely to involve policies that are regulatory and behavioral in nature (although fiscal policy levers may also be relevant), and so scenarios in the model are more exploratory and are defined by CE outcomes rather than by specifying policies. They address the following CE objectives:
• ‘Designing-out’ materials and material waste (redesign). The stylized scenario aims to reflect the outcomes of policies that would incentivize firms to invest in design that would reduce the relative use of materials in final products and material waste from the production process.
101 The ‘product life extension’ scenario was not included in the ‘combined’ scenario due to some overlaps with the ‘redesign’ and ‘consumption bundle shift’ scenarios.
• Extending product lifetime (product life extension). The stylized scenario aims to reflect the outcomes of policies (for example, extended producer responsibility and right to repair) that would allow for extension of usable life of products and thus reduce relative material disposal and reduce demand for new material.
• Reducing consumer demand for materials (consumption bundle shift). The stylized scenario aims to reflect the outcomes of policies (including potentially regulatory, fiscal, and behavioral in nature) designed to shift consumption patterns away from material goods (for example, toward services).
The remainder of the chapter describes the results based on the above scenarios.
below economic growth (Figure 5.1), maintaining recent trends toward relative, but not absolute, decoupling.
BAU will entail an increasing share of imported materials. As discussed in Chapter 3, over recent decades, the European economy has shifted the production of material-intensive goods outside its borders. The modeling results show that this trend is set to continue. Across all of Europe, use of primary materials, as measured by productionbased accounting (see Box 5.3), will grow by 10 percent by 2030 (compared with 2021) under BAU. When measured in terms of consumptionbased accounting, though, growth in material use increases to almost twice as much (17 percent), showing the increased role of imported materials.
Under ‘BAU’, Europe will not achieve absolute decoupling in material use. Chapter 2 details how over the past decades Europe’s economy has achieved substantial resource efficiency gains, in line with other higher-income economies. At the same time reaching and sustaining absolute material decoupling in production, especially consumption of primary materials, has remained challenging, particularly in periods of economic expansion. Under BAU, the production and use of primary materials continue to grow, if only at a pace well
Growth rates in material use across the EU reflect different structural conditions of MSs. From a production-based perspective, material use grows significantly faster in MSs having more recently gained EU accession—2.5 times faster in EU-7 compared to EU-16 + EFTA and the United Kingdom. One exception here is Poland, which sees a decline in production-based material use by 2030, even while consumption-based material use grows in line with the European average. This likely reflects structural change in the Polish economy (a relative shift away from extraction and primary materials processing). Overall, much smaller differences in growth of material use are apparent across countries using consumptionbased measures (except for Croatia, which is the only country showing faster production-based than consumption-based growth).
5.2 Current policy pathways are insufficient to achieve significant reductions in primary material use
To provide an accounting of material use flows, two distinct conceptual frameworks are used. The first approach follows a production-based perspective, which can also be referred to as a territorial-based accounting, and tracks the raw materials (for example, bauxite ore) at the point of their direct consumption (for example, country where bauxite is used to produce aluminum). Production-based accounting can be represented through the direct material consumption (DMC) indicator and is obtained by adding domestic extraction and imports of the corresponding raw commodity and subtracting exports (Eurostat 2001).
While being conceptually sound, for open economies the production-based approach fails to adequately quantify the life cycle-wide environmental pressures associated with domestic consumption (Schaffartzik et al. 2014). For instance, if iron ore is used to produce steel in country A, which is further exported and actually consumed in country B, the production-based perspective would attribute the iron ore use to country A (where steel was produced) and not country B (where actual consumption of steel took place). To account for the raw commodities embedded into traded goods, a consumption-based perspective is introduced. From a consumption perspective, raw materials used in the production of exported goods should be accounted for in the importing country. This concept has also been applied in a similar way for the accounting of GHG emissions (for example, Davis and Caldeira 2010 and Peters 2008).
To provide an accounting of the life-cycle materials embedded in bilateral trade, the analysis presented in this chapter follows an approach outlined in Peters (2008) for the case of CO2 emissions. Country-specific raw material use per unit of output by sector is used to estimate materials associated with bilateral trade flows. For every commodity, the total weight of raw materials associated with production of the specific commodity and embedded in trade flows from region r to region s (frs) is estimated as frs = Fr(E - Ar)-1mrs, where Fr is a vector of region-specific raw material uses per unit of output by industries, E is an identity matrix, Ar is the technological matrix, which represents the industry requirements of domestically produced products in region r, and mrs corresponds to the bilateral trade flow from region r to region s.
From the consumption-based perspective, material consumption in a country is then estimated as a weight of all materials used for the production process in this country minus materials embedded into exports plus materials embedded into imports.
Decarbonization policies under the EGD are not sufficient to deliver resource efficiency gains but can complement circularity policies. Policies targeting GHG emission reduction under the EGD (EGD-NDC) will have large impacts on fossil fuel use from a production-based accounting perspective and a smaller, yet significant, impact when measured on a consumption basis. These policies will also contribute to reduce metal ores and non-metallic minerals use by raising the cost of their production, but the scale of the effect will be limited—less than 1 percent relative to BAU for metals and 1 to 2 percent for non-metallic minerals (Figure 5.2). Thus, while decarbonization policies are a helpful complement, policies that specifically target primary materials will be required.
Can CE policies have the same scale of impact on primary materials like metals and construction materials that decarbonization has on fossil fuels? Can they achieve absolute decoupling? Figure 5.3 summarizes the material use impacts of a comprehensive set of CE policies addressing both production and consumption sides (combined) The results suggest that a package of CE policies not only delivers large reductions in primary material use relative to BAU, but would also result in absolute material decoupling by 2030 from a production-based accounting perspective. In the combined scenario, use of primary metals falls 15 percent from 2021 levels in 2030 and nearly 30 percent from BAU, while non-metallic minerals use remains flat (and
0%
-5%
-10%
-15%
-20%
-25%
-30%
Source: World Bank.
Change in primary materials use in Europe (2030): EGD-NDC versus BAU Production-based Consumption-based
falls 15 percent relative to BAU). Fossil fuels will fall by 11 percent even under BAU, but they decline another 20 percent under the combined scenario (although most of this is driven by EGD-NDC rather than targeted CE policies).
Overall progress masks country-specific variation in material reduction rates. Overall,
Bulgaria and especially Poland are expected to experience a decline in (production-based) primary material use at a much faster rate than Europe overall (Table 5.2). However, in both cases, this is driven primarily by a rapid decline in fossil fuel use driven by decarbonization policies (EGD-NDC policy scenario) rather than specific CE policies. In fact, Bulgaria and Croatia actually experience a small
IN 2030 (INDEX 2021 = 100) VERSUS BAU
Source: World Bank.
increase in use of metals, while Poland experiences a small increase in non-metallic minerals use by 2030.
Achieving material decoupling from a consumption-based perspective is more challenging. It is important to emphasize that modeled combined CE policies achieve absolute decoupling only from a production-based perspective. From a consumption-based accounting perspective, use of primary metals and non-metallic minerals still rises (by 4 percent and 13 percent, respectively) over this period. This reflects the challenges of trade leakage presented in Chapter 3 (see later discussion in Section 5.5 for further details on modeling results with trade leakages).
reducing primary material use is getting prices right, for instance, through economic instruments aimed at better reflecting the environmental externalities stemming from material production and consumption. A first question here is whether emission reduction policies can substantially reduce material use by increasing fossil fuel prices. The EGD-NDC scenario shows that while significantly increasing fossil fuel prices, carbon pricing has minimal impacts on prices of metals and non-metallic minerals. However, dedicated policies aimed at correcting materials’ pricing can significantly reduce material use (Table 5.3). Where fiscal policies (in this case, production taxes) are imposed, producer prices rise significantly, contributing to reduced material use. Of course, elasticities vary across products, and in the examples shown here, use of metals and non-metallic minerals appears to be somewhat less sensitive to price changes than fossil fuels (coal). Nevertheless, the role of pricing is clear, highlighting the importance of fiscal policy tools in delivering on CE objectives.
Prices will need to rise to meet the objectives of reducing materials use. A starting point to
102 Production-based material use. 103 Results shown here for metals are based on the metals and plastics – tax scenario; results shown for non-metallic minerals are based on the ‘non-metallic minerals - tax’ scenario.
5.4 A mix of domestic policy instruments will be needed to achieve CE aims
Taxing primary materials can have similar effects as subsidizing secondary production. Fiscal policy targeting production prices to reduce use of primary materials can take two broad forms—taxes or subsidies. The modeling exercise explored a scenario with a 30 percent tax imposed on primary metals and plastics production to raise prices and incentivize a shift away from primary production (either to secondary production using recycled metals or to other materials). A second scenario provides a 30 percent production subsidy for secondary materials production, to reduce the gap in relative prices between primary and secondary metals production and incentivize a shift to secondary production. The results shown in the Figure 5.4 suggest that both policies would have a similar impact in reducing production-based material use. FIGURE 5.4:
effects on overall consumption trends. Also, both have a similar impact on consumption-based material use—in both cases a much smaller impact, which may be expected given that the policy is targeting production rather than consumption and a number of barriers may restrict pricing pass-through to consumers (for example, leakage, as discussed later).
While the price channel will clearly play an essential role in reducing demand for primary materials, it will not be sufficient on its own. A range of policy approaches will need to be tailored to the specific dynamics of different materials, particularly to address both the production and consumption sides of the equation. Policies targeting upstream product design and downstream consumption can effectively complement fiscal policies. These include
• Designing products to reduce material usage and waste (redesign),
• Extending the useable lifetime of products (product life extension), and
• Shifting consumption patterns away from materials and toward services (consumption bundle shift).
Bank.
A policy mix combining taxes and subsidies delivers the highest material efficiency gains. Perhaps the most important finding from the analysis comes in a scenario where both the tax and subsidy are combined. In this case, the impact on reducing material use nearly doubles. This suggests that the approaches are complementary.
When limited to targeting production, however, both subsidies and taxes will have limited
Fiscal measures can support all three approaches, as price signals at the consumer level are likely to play an important role in shifting demand. But they are also likely to benefit from regulatory (for example, material standards, rights to repair, extended producer responsibility) and social/behavioral policies (for example, education and public awareness, behavioral incentives). Figure 5.5 presents the results on material use from a combination of production-side fiscal policies as well as complementary policies targeting upstream product design and downstream consumption.
Alternative policies deliver varying impacts. For example, while material tax policies affect production-based material use much more than consumption-based use, upstream and consumption-side CE policies appear to reduce both on a similar scale (affecting consumption slightly more than production in most cases). Moreover, while material taxes have almost no impacts outside the specific materials they target,
upstream and consumption-side CE policies reduce demand for all materials, although their influence on demand for metals is larger than for NMM and fossil fuels. Combining both productionand consumption-side policies almost doubles material reduction impact of introducing any one of the measures individually. This suggests production- and consumption-side measures are complementary and supports the idea of introducing integrated policy packages to achieve CE objectives.
Appropriate policy choices may also depend on the specific material being targeted. For example, a tax on primary production of metals and fossil fuels has large impact in reducing primary
production of iron and steel, aluminum, copper, and plastics. But while in the case of iron, steel, and copper, the tax alone stimulates a significant growth in recycling and secondary production, the response is much more muted in aluminum and plastics; in the case of plastics, introducing a subsidy for secondary production is highly effective in stimulating a growth in recycling and secondary production, but again for aluminum the response is smaller (Table 5.4). Upstream and demand-side scenarios reduce both primary and secondary production, again with a much stronger response in iron and steel and copper relative to aluminum (with plastics in the middle).
Aluminumrecycling 8 12 21 −6 −2 −2
Copper - primary −20 −23 −40 −13 −3 −3
Coppersecondary 37 51 101 −13 −3 −3
Copperrecycling 23 34 67 −11 −3 −4
Plasticsprimary −32 −7 −37 −10 −2 −4
Plasticssecondary 14 88 115 −10 −2 −4
Plasticsrecycling 9 49 64 −16 −2 −3
Circularity-oriented fiscal policies may hit the competitiveness of European producers. As discussed earlier, by changing relative prices, fiscal (and regulatory) policy levers can have a powerful impact on European production and consumption of primary materials. But of course, raising relative prices for domestic producers will influence their competitiveness in global markets compared to
producers who are not required to comply with those policies. Figure 5.6 shows how material taxes compound already-eroding price competitiveness for European producers of primary metals and construction materials. European exporters are likely to be hit significantly in global markets unless some sort of export exemption or subsidy is put in place to offset the impacts of policies raising production prices. And European producers are likely to face threats to domestic markets from lower-cost importers.
FIGURE
5.7: PRODUCTION, CONSUMPTION, AND LEAKAGE OF ALTERNATIVE POLICIES, WITH AND WITHOUT BORDER ADJUSTMENTS FOR METALS
EU production, consumption, and trade leakage in non-metallic minerals (2030)
Domestic fiscal policies risk weakening competitiveness while trade leakage can undermine sustainability objectives. The price gap induced by the application of fiscal policies on material production can result in substantial leakage (as shown in Chapter 3) whereby primary materials production is offshored and exported back into European markets. This undermines the sustainability objectives of CE policy and is illustrated by the gap in the decline of material use as measured by production and consumption. Figure 5.7 shows how significant this problem may be, particularly in fiscal policy scenarios, where leakage is large as is the subsequent erosion of material reduction achieved by CE policies.
Taxing primary material imports reduces leakage. BATs have received considerable attention of late as the EU plans to introduce them on carbon emissions (the ‘carbon border adjustment mechanism’ [CBAM]) under the Green Deal to stem leakage of emissions-intensive activities.104 Under CBAM, exporters of emission-intensive goods to the EU would be required to pay a tax (equivalent to what EU producers pay under the emissions trading
104 EC 2021.
105
-50.0
-100.0
-150.0
-200.0
-250.0
448.0 -16.8
-47.4
13.3
0.0 500.0 400.0 300.0 200.0 100.0 0.0 -100.0 -200.0 -144.8
Non-metallic mineralstax
Non-metallic mineralstax*BAT
Redesign Product life extension
Consumption bundle shift
Production Consumption Leakage rate (right axis)
To model these impacts, two sub-scenarios are introduced to incorporate BATs into the fiscal instrument scenarios for primary metals and non-metallic minerals: metals and plastics - total*BAT and non-metallic minerals - tax*BAT
106 The BAT scenarios impose a tax on imports and subsidize exporters to offset the costs of domestic taxes on exporters competing with producers in export market who do not face such taxes.
METALS
EGD-NDC Metals and plasticstotal
Metals and plasticstotal*BAT
Impact of material tax versus EGD-NDC scenario (%)
Impact of BAT versus EGD-NDC scenario % (versus material tax scenario %)
EU production-based use 278 199 201 −28 −28 (+0.8)
EU consumption-based use 518 469 434 −9 −16 (−7)
Rest of world production 6,007 6,012 5,992 0 0 (0)
EU exports (embedded) 88 61 60 −31 −32 (−2)
EU imports (embedded) 327 331 293 1 −10 (−11)
Non-metallic minerals
EGD-NDC Non-metallic minerals - tax
Non-metallic mineralstax*BAT
Impact of material tax versus EGD-NDC scenario
Impact of BAT versus EGD-NDC scenario (versus material tax scenario)
EU production-based use 4,302 4,087 4,215 −5 3 (−2)
EU consumption-based use 6,524 6,427 6,420 −1 0 (−2)
Rest of world production 85,472 86,436 85,346 1 −1 (0)
EU exports 678 626 672 −8 7 (−1)
EU imports 2,900 2,966 2,877 2 −3 (−1)
Source: World Bank.
But BATs raise prices and can be difficult to implement. Price effects will be felt by both consumers and producers demanding primary materials in the production of downstream products. Imposing BATs in the metals sector would raise Europe’s Consumer Price Index (CPI) by close to 1 percent over the fiscal policy scenario without BAT. Material-intensive economies would be affected more adversely—for example, prices would increase by 1.4 percent in Poland and Romania. Moreover, the experience with CBAM suggests that BATs face significant implementation challenges. Politically, BATs are a barrier to free trade and a BAT on primary materials would, like CBAM, be seen as biased against developing countries, with justification under Article XX of the General Agreement on Tariffs and Trade (GATT) even more challenging than for CBAM. They are also administratively complex with requirements for sometimes complex monitoring, reporting, and verification arrangements.
Irrespective of the instrument, CE policy needs to consider embedded materials across the value chain if it is to address leakage effectively. CE policies can contribute to changes in relative prices of inputs at different stages of the
value chain, with potentially negative consequences for competitiveness of domestic producers in higher-value-added positions further down the value chain. For example, imposing a border tax on primary steel levels the playing field for domestic primary producers with foreign producers who do not pay a material tax, but if it is not also imposed on cars using that steel, domestic producers of cars may find themselves outcompeted by those same foreign producers. This is important because, as discussed in Chapter 3, the majority of primary materials consumed in the EU come in not through primary material imports but rather through primary materials embedded in other imported products. In the scenarios presented above, taxes are imposed on all primary material inputs embedded in imports (so, for example, not just primary steel but the value of primary steel in the import of a car). In practice, however, imposing any material tax across the value chain can be technically difficult to implement, so it is likely that, at least initially, a tax on primary materials would not account for embedded materials in downstream products, creating a potential distortion for European producers. In the long term, however, anything short of pricing in externalities along the whole value chain will likely result in some form of leakage.
Change in LMIC export value by main sector under Combined CE scenario, relative to baseline EGD-NDC scenario (2030)
0.0%
-0.5%
-1.0%
Exports (2030) relative to baseline (EGD-NDC scenario) for alternative scenarios -0.1% -0.8%
-1.5%
-2.0%
-2.5%
-3.0%
-0.3%
0.1% 0.0% -0.5%
0.5% Combined Metals & plastics-total
Non EU ECA China SSA MNA LMIC*
Source: World Bank.
Other goods and services (incl extractives)
Transport and trade
Power
Industry
Trade and other services
Agriculture
-0.4% 0.1% -0.8% -0.3% 1.8% 0.0%
-0.1% -0.5% -0.2% -0.2% -1.0% -0.5% 0.0% 0.5% 1.0% 1.5% 2.0%
Note: *LMICs are defined here as low- and middle-income countries outside of the EU, excluding China and Russia
Given the importance of the trade channel in shaping CE outcomes, Europe’s CE policies will have significant global spillovers. Chapter 3 describes the potential risks to developing countries of policies that reduce European demand for primary materials, particularly for those countries highly concentrated in primary commodity exports. Results from the modeling suggest that overall export impacts are modest if not insignificant (Figure 5.8). In most regions, and especially in China, imposition of BAT substantially reduces exports. Under a comprehensive CE scenario that combines production- and consumption-side measures (but does not include BAT), Europe’s neighbors face the largest hit to exports, while overall impacts in SubSaharan Africa and in LMICs are not more than 0.5 percent compared to the reference scenario. One reason why the impacts appear modest is that while some CE measures reduce overall demand for primary materials, others may strengthen the relative comparative advantage of LMICs as exporters (particularly if BAT is not imposed). Overall, however, the model results probably underestimate the potential negative impacts on developing-country exporters as it assumes that economies adjust equally to changing demand and price structures. For example, while the model shows developing countries experiencing substantial declines in primary metals exports, these are largely offset
by gains in exports of recycled metals. Overall, the results imply large shifts in the structure of developing-country exports—away from extractives, power, and industry and toward more services (Figure 5.9). In practice, as discussed in Chapter 3, many countries will not have the capacity (skills, institutions, technology) to make these adjustments in the short to medium term.
Comprehensive CE policies will accelerate Europe’s shift toward services economies. Implementation of a broad combination of CE policies would have sizeable impacts on the structure of Europe’s economy by 2030, with services increasing its share of output by 2.3 percentage points while industry falls further by a nearly 1 percentage point and ‘other goods and services’ (including extraction) fall by 1.6 percentage points (Table 5.6).
Upstream and consumption-side CE policies will have the largest impact on these structural shifts. The shifts are largest under a scenario where
5.6 CE policies will have modest growth impacts but will accelerate ongoing structural and distributional shifts in Europe
producers ‘design-out’ materials from production, in effect replacing material inputs with services inputs. Similarly, product lifetime extension sees a shift away from production sectors to services sectors (for example, repair and reuse), while overall consumption shifts away from materials quite obviously shift economic activity toward services. By contrast, production-side fiscal policies in the metals and plastics sectors work in the opposite direction to the consumption-side policies, increasing industry relative to services. This may seem counterintuitive but relates to the relative impact of tax and subsidy policies on driving secondary production to the point where it more than offsets primary production, increasing the relative share of industry.107
The scale of structural shifts is larger in the newer MSs. In Bulgaria and Poland, for example, the share of the ‘trade and other services’ sector increases by 6 percent relative to the EGD-NDC scenario by 2030 in the ‘redesign’ scenario (and by 3 percent in the ‘product life extension’ and ‘consumption bundle shift’ scenarios) while the relative share of the industry sector declines commensurately. For production-side policies,
impacts are again relatively larger in newer MSs (5 percent growth in relative share of the industrial sector in Bulgaria, 3 percent in Croatia, and 2 percent in Romania, under the ‘metals and plastics - total’ scenario) and appear to come more at the expense of the power and extraction sectors than from services.
CE objectives can be achieved at a relatively small direct cost to the economy. The policies scenarios explored in this assessment all aim to achieve core CE sustainability objectives by reducing and shifting demand. Thus, they have macroeconomic costs, if relatively minor.108 In the combined scenario, total annual GDP is around 1 percent lower relative to the reference scenario in 2030—for most of the individual policy scenarios, the cost is around 0.3–0.4 percent of 2030 GDP (Figure 5.10). These findings are in line with other recent CGE assessments.109 However, a number of other studies indicate that moderate to significant economic gains are possible from adopting CE, based on assumptions of large efficiency gains, no resource constraints, and price declines leading to substantial increases in consumer spending (rebound effects).110 Importantly, the modeling
Source: World Bank.
107 Specifically, the tax on primary materials reduces primary production to the point where it actually becomes smaller relative to secondary production. When the subsidy to secondary production is introduced together with the tax, it is stimulating a part of the industrial sector that is now larger than the primary sector, so the net effect becomes positive for industry.
108 One important methodological note: upstream and consumption scenarios (redesign, product life extension, consumption bundle shift) do not consider costs (investments) required to achieve them—such investments would be expected to contribute positively to growth.
109 Bibas, Chateau, and Lanzi 2021.
110 Cambridge Econometrics, Trinomics, and ICF 2018; Ellen MacArthur Foundation, McKinsey, and SUN 2015.
Change in CPI Europe (2030) relative to EGD emissions scenario
0.73%
-0.02%
-0.33%
-0.45% -0.36% -0.40%
0.60%
0.40%
0.20%
-0.76%
0.00%
-0.20%
-0.98%
Change in real GDP-Europe (2030) relative to EGD-NDC scenario -0.40%
EGD-NDC (v BAU) Nonmetallic mineralstax
Source: World Bank.
Redesign Consumption bundle shift
Metals & plasticstax
Metals & plasticssubsidy
0.42% -0.20%
Combined
EGDNDC (v BAU)
results presented here do not consider the substantial co-benefits of achieving CE objectives, for example, improved health, reduced congestion, and strengthened natural capital, all of which would be expected to contribute to higher productivity and GDP growth as well as higher welfare. Moreover, it is important to recognize that this ‘cost’ is relative to baseline growth—real GDP in the combined scenario is still 13.5 percent higher in 2030 compared to BAU in 2021. GDP implications at the country level are broadly in line with overall EU trends, with Bulgaria and Poland most exposed to production-side policies targeting metals and fossil fuels and Poland and Romania most exposed to policies that aim to ‘design-out’ materials as inputs in production, perhaps reflecting their positions in European manufacturing value chains.
Overall welfare impacts are slightly higher but still modest. Household welfare in the combined scenario is around 1.5 percent lower than in the reference scenario in 2030, driven by impacts on consumer prices and labor earnings (see below). At the country level, welfare costs in the combined scenario range from a low of −0.4 percent in Bulgaria (that is, households experience small net welfare gains in Bulgaria) to a high of 2.5 percent in Romania.
Consumer price impacts vary across CE policies, but they are broadly progressive
Metals and plastics - Total
-0.03%
0.02%
0.16%
0.48% 0.52% 0.03%
Metals and plastics -Total* BAT
Nonmetallic minerals - Tax
Nonmetallic minerals - Tax* BAT
Redesign Combined Consumption bundle shift
Product life extension
and may be welfare enhancing for poorer households. The combined scenario shows virtually no change in overall consumer prices compared to the reference scenario (Figure 5.12), although this masks significant differences across scenarios. While fiscal policy scenarios are expected to result in lower consumer prices, as noted earlier, the imposition of a border tax for primary metals would have the opposite effect, increasing CPI by 0.7 percent. Demand-side scenarios (product life extension and consumption bundle shift) also result in modest increases in consumer prices. But price impacts vary significantly across consumption categories. Under the ‘combined’ scenario, for example, prices for food and beverages, transport, and other services— items with a heavy weight in the consumption baskets of lower-income deciles—fall by more than 5 percent in Europe relative to the reference scenario (and in the range of 10–20 percent in EU4). Meanwhile, prices of extractive and manufactured goods—which have a heavier weight in the consumption basket of higher-income deciles—rise sharply. Energy prices experience modest gains (less than 1 percent) in Europe overall but fall in each of the EU-4 countries. The net effect of this pattern of price changes is that poorer households in each of these countries, especially in Bulgaria and Romania, may experience lower relative prices as a result of CE policies and will certainly experience lower prices relative to richer households.
Europe change in average real wage (2030) relative to EGD-NDC scenario
0.50
EGD-NDC (v BAU)
0.01
0.35
0.35 0.33 -0.02 -0.04 -0.05
Metals and plastics - Total
0.02 0.01
Nonmetallic minerals - Tax
Skilled Unskilled
Source: World Bank.
Redesign Product life extension
Consumption bundle shift
111 Donati et al. 2020.
0.00
-0.50
-1.00
0.57 -1.3% -1.3%
-1.50
-2.00
Europe percentage point change in unemployment rate (2030) relative to EGD-NDC scenario -3.00
0.1% 0.0% -0.1%
-0.1% -1.4%
-0.7%
-0.4%
-2.50
0.2% 0.0% 0.10 0.06 0.09 -0.03
Combined EGD-NDC (v BAU) Metals and plastics - Total
Nonmetallic minerals - Tax
Skilled Unskilled
These positive distributional impacts from price changes are offset by modest, regressive impacts from CE policies in labor markets. While labor market impacts from most individual CE policies are modest, in combination (‘combined’) they are relatively significant for unskilled workers (Figure 5.12). Compared to the reference scenario, unskilled workers see unemployment rise by 0.6 percentage points and real wages decline by 2.6 percent. Skilled workers, by contrast, experience lower unemployment and only slightly lower wages. Impacts vary markedly across individual CE policy scenarios. Fiscal policies targeting production of primary materials have almost no impact on unemployment and wages. By contrast, the upstream and demand-side scenarios show much larger effects, with a clear skills bias. Under all three scenarios (redesign, product life extension, and consumption bundle shift), unemployment rises and wages fall for unskilled workers, while unemployment falls and wages rise for skilled workers. The findings on labor market outcomes are broadly in line with several studies which expect decline111 or marginal gains112 in employment from CE policies. However, many other studies (again, as
112 Cambridge Econometrics, Trinomics, and ICF 2018; OECD 2020.
113 IISD 2020; ILO 2019; Wiebe et al. 2019.
Redesign Product life extension
0.1% -2.6%
Consumption bundle shift
-0.6%
Combined
noted above on GDP, with different methodologies and assumptions) project substantial employment growth as a result of a shift to CE.113 Most of these studies support the findings on the expected strong relative growth of skilled employment.
Change in real wages by skill level at country level (2030)Combined scenario
2.9% 1.4% -2.5% -4.5%
2.0% -0.4% -5.6%
-3.9%
FIGURE 5.13: CHANGE IN REAL WAGES BY SKILL LEVEL AT COUNTRY LEVEL (2030) - COMBINED SCENARIO -7.0% -6.0% -5.0% -4.0% -3.0% -2.0% -1.0% 0.0% 1.0% 2.0% 3.0% 4.0%
Skilled Unskilled Skilled Unskilled Skilled Unskilled Skilled Unskilled Bulgaria
Croatia Poland Romania
Source: World Bank.
Country-level distributional impacts can be significant, driven by underlying sectoral and skills structures. For example, in the combined scenario (Figure 5.13), real wages for unskilled workers in Poland are down 5.6 percent. Moreover, skilled workers gain considerably in all countries but Croatia. One notable difference in the newer MSs relative to Europe overall is that the largest impacts are seen through the production-side CE scenarios than through the upstream and demand-side scenarios. Specifically, skilled workers appear to fare poorly in all four countries (compared to Europe overall) under the upstream and demand-side scenarios; rather their gains come mainly in the production-side CE intervention scenarios. In parallel, unskilled workers in these countries see wages fall more through production-side interventions than in Europe overall. This likely reflects the higher concentration of unskilled workers in the newer MSs, resulting in greater exposure to declines in unskilled activities and at a weaker position to benefit from gains in skilled activities. This reflects the relatively weaker comparative advantage of these four countries in higher-skilled service activities and the concentration of skilled workers in activities that will experience relative decline under the upstream- and demand-side scenarios.
The choice of how tax revenues are used can have a significant impact on the outcomes of material fiscal policies. While the above discussion shows that CE policies have some negative welfare effects, the scale of the effects is modest and there may be opportunities in the implementation of CE policies to mitigate negative impacts. One such mechanism is the way in which revenues raised through taxes are used. In all the modelled scenarios discussed in this chapter, the default is that any revenues raised through tax policies are distributed back to households in a lump sum. But in practice, governments have many choices in how they use revenues, which may be more or less efficient depending on the
114 Chen et al. 2020; Zhu et al. 2018.
circumstances. Like all environmental taxes, CE material taxes have the potential to be used to reduce other taxes that may have distortive impacts on the economy, including labor taxes. A large body of literature has shown that revenue recycling through the reduction in labor taxes can be used to maximize economic efficiency, compared with alternative revenue recycling options.114
Metals and plasticstax
Metals and plasticstax*labor
Unemployment rate - unskilled (percentage point change) +0.20 −0.38
Real wage - unskilled (% change) −0.8% +1.5%
GDP (% change) −0.2% +0.2%
CPI (% change) −0.6% −0.7%
Primary metal consumption based (% change) −5.1% −4.8%
Source: World Bank.
Leveraging material taxes to reduce labor taxes has significant positive labor market and growth impacts. Table 5.7 illustrates how significant these impacts can be—in this case by taking the scenario that imposes a tax on primary metals and fossil fuels (metals and plastics - tax) which is recycled to households and creating an alternative scenario where this same tax is used to reduce labor taxes. The results indicate large and positive labor market impacts—unemployment for both skilled and unskilled workers now falls while wages rise—while overall economy impacts turn positive, with only a small rise in material demand. Thus, shifting the tax burden from labor to materials has the potential to address both the market failures induced by linearity and the market distortions generated by labor taxation, which contributes to higher relative use of materials and offshoring (leakage) of production.
FIGURE
Europe percentage point change in unemployment rate (2030) relative to EGD-NDC scenario under alternative revenue recycling scenarios
Europe % change in average real wage (2030) relative to EGD-NDC scenario under alternative revenue recycling scenarios
2.00%
1.50%
1.00%
0.50%
0.00%
-0.50%
-1.00%
-1.50%
Metals & plastics-tax
Source: World Bank.
Metals & plastics-tax*labor
&
Current policy pathways are not sufficient to achieve significant reductions in primary material use. Consumption of primary materials continues to grow even as European economies increasingly become services economies. Climate mitigation measures taken under the EU Green Deal will reduce CO2 emissions but have only a modest impact on primary material use.
CE policies have the potential to deliver absolute material decoupling. Aggregate material use in the EU could decline up to 8–11 percent (relative to the baseline in 2030) under alternative CE policies, allowing to achieve absolute decoupling.
One size does not fit all: achieving CE objectives will require a comprehensive policy mix that targets production and consumption. Both fiscal and regulatory policies targeting production and consumption will be needed; the nature and scope of policies will also need to vary depending on the specific material being targeted.
Trade leakage is a concern—CE policies should target consumption and reach across the value chain. Targeting consumption is particularly critical to address leakage, as the results show substantial leakage from productionbased policy measures but negative leakage from consumption (demand)-based measures. Given that most leakage takes place in downstream industries
Metals & plastics-tax*labor
(as described in Chapter 3), designing policies (material taxes or regulatory measures) such that lead firms take responsibility for primary material use and other externalities across the full value chain will be critical to remove the risk that materials are relocated to ‘linear production havens.’ Importantly, such a measure may also support LMICs to reorient and upgrade production, since it will provide a strong incentive for investing and diffusing CE technology and raising standards in LMICs.
CE policies are likely to have small growth and moderately regressive labor market impacts, cushioned somewhat by progressive price impacts. Under a comprehensive set of CE policies, GDP is only around 1 percent below the baseline in 2030; considering co-benefits of CE policies, growth impacts are likely to be positive. Unemployment is expected to rise and wages are expected to fall slightly, with unskilled workers experiencing modest welfare loss. However, price changes induced by CE policies are likely to benefit poorer households relative to richer ones, as prices of food, transport, and services fall while prices of manufactured goods rise.
Leveraging CE tax revenues to reduce labor taxes can be both growth and welfare enhancing. Taking the opportunity to use the substantial revenues created by CE taxes and using it to reduce labor taxes eliminates GDP losses and reverses negative labor effects, highlighting the opportunity of using CE taxes to support growth and welfare.
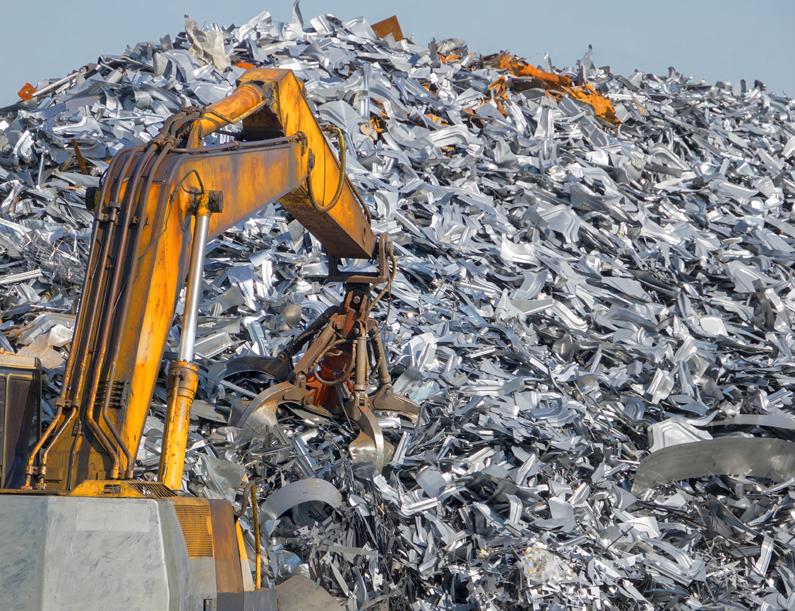
A policy framework for the circularity transition
This report has identified key constraints to Europe’s progress in achieving material efficiency and circularity objectives. Several of these are inbuilt in the linear bias inherent in the current economic model and the policies supporting it. This chapter highlights the major constraints that need to be addressed, which can be elaborated along four dimensions: institutions, incentives, information, and financing.
Europe is championing the CE agenda globally, but progress will be determined by nationallevel leadership. The relative infancy of CE as a national-level agenda will require deliberate steps, starting with the mandates and capacities of central government agencies. Because of the emphasis on environmental sustainability gains and the relative importance of recycling at least in the early stages of implementation, in most countries the CE agenda remains linked to the solid waste management policy and operations. So far this has meant that Ministries of Environment have been tasked with operationalizing the EU policy and normative framework as well as developing country-specific policy. Increasingly, though, the multiple benefits promised by the circularity transition, together with its complexity, have led to the recognition that other agencies beyond Environment Ministries have an active role to play. However, based on a survey of key stakeholders in the EU-4 countries, the general
perception is of the lack of a competent authority leading the CE transition (Figure 7.1).
The opportunities and risks brought about by circularity, and the need for adequate levers to shift business models across sectors, call for the close involvement of economic decision-making agencies. This trend is evident in countries both inside and outside Europe, especially those with important trade flows with the continent, as future policy developments in Europe have the potential to affect its commercial partners, particularly in key value chains. Türkiye’s institutional setup for developing and implementing its CE policy sees a collaboration between the Ministry of Environment and the Ministry of Trade with a view to anticipating threats and grasping new competitiveness opportunities.
The policy mix necessary to achieve material efficiency gains also calls for a frontline role for economic decision-making agencies. The need to deploy economic instruments, such as material taxes and circularity subsidies, calls for an active role of Ministries of Economy and Finance. In addition, Ministries of Finance typically have the reach and mandate to foster closer collaboration across line ministries. The fiscal and economic impacts of such tools, as well as their necessary modulation to preserve competitiveness and fairness outcomes during the CE transition, require further coordination with agencies covering social protection and labor market remits.
A range of institutional tools can support a ‘whole-of-government’ approach to the CE transition. The creation of coordination platforms or advisory bodies to steer the CE transition provides one of the most common approaches. A lead agency such as a Ministry of Environment/ Commerce, or, at times, a higher-level body such as the Cabinet of the Prime Minister or the Ministry of Economy and Finance, is tasked to foster collaboration across ministries. An alternative path pursued by some countries (for example, Italy) is to set up Ministries for Ecological Transition, with a mandate covering coordination across environmental, economic, energy, or demographic policy areas. For example, Croatia has created its Ministry of Economy and Sustainable Development, which takes a lead on the circularity agenda.
Cross-sectoral ownership tends to increase the visibility of the CE agenda among business stakeholders and consumers and helps support greater policy coherence. National CE legislation is emerging in all EU countries, but its scope tends to remain heavily focused on waste management concerns. Mainstreaming CE principles across sectors can ensure mutually reinforcing policies across different levels of government and reduce regulatory conflict through broadly owned revisions of existing and planned policies and legislation.
Governments can foster the formation and strengthening of collaborative CE communities, hubs, and networks within and across economic sectors, value chains, and regions. Such mechanisms can help increase the knowledge base and foster sharing experiences on CE policies, innovations, and business models (Figure 6.2). The EU-4 countries are still characterized by a fragmentation of actors (national/ local) as well as weak capacity. Croatia has recently created a Circular Economy Committee (CEC) comprising technical representatives of relevant ministries as well as businesses, academia, and civil society. The Strategic Research and Innovation Partnership (SRIP) in Slovenia, which was founded by the Chamber of Commerce and Industry of Štajerska, the National Institute of Chemistry and the Faculty of Chemistry and Chemical Technology of the University of Maribor brings together the central government, private sector, academia, and research organizations. While fostering greater collaboration and coherence, such partnerships/ platforms can also promote technological innovation and serve as a conduit of global best practices for the public and private sectors. The European Circular Economy Stakeholder Platform is an example of a cross-country community of practice structured through in-country networks.
While national governments can create nationwide enabling conditions, cities are the incubators for solutions and innovation. Cities are centers of resource consumption and incur significant expenses to manage the externalities. About 75 percent of the world’s natural resources, 78 percent of world energy, 60–75 percent of the world’s GHG emissions, and 50 percent of the world’s waste are generated in cities. At the same time, because of their remits, city governments incur many of the costs induced by economywide linearities—solid waste management, structural waste such as underutilized buildings, and congestion and pollution all fall within cities mandates. Managing waste costs on average 20 percent of municipal budgets in low-income countries, 10 percent in middle-income countries, and 4 percent in high-income countries.115
However, cities also have the means to support the CE transition. They have inherent advantages such as density and proximity of producers and consumers and access to resources such as capital, technology, and skills, which can pave the way for innovative business models. City governments have key financial tools to facilitate the transition to CEs, for example, (a) taxing power on critical segments of product life, starting from waste; (b) financial incentives (subsidies and so on) to local businesses to support repair and reuse shops and other CE-related initiatives; (c) construction permits disincentivizing virgin materials and promoting recycling by mandating the amount of secondary materials required in construction projects; (d) land planning through zoning and permits, which is critical to keep cities dense and prevent sprawl and additional soil sealing; and (e) demolition and renovation permits which regulate deconstruction and how CDW is handled.
Nonetheless, cities need to overcome a number of important barriers to pursue circularity, some common to national-level governments and other specific to cities themselves. Barriers that cities face can be summarized as lack of awareness, lack of technical capacity, lack of coherent strategies, funding constraints, and regulation. Without an enabling environment across governance levels, cities’
115 Ellen MacArthur Foundation 2020; World Bank 2018.
116 Jonker and Navarro 2017; OECD 2020.
leeway can be reduced. In countries such as the Netherlands, for instance, cities are not allowed to set local requirements for construction and demolition that exceed the national Construction Act.116
Despite these barriers, European cities are increasingly turning to circularity as a key principle of their development strategies. Amsterdam, Brussels, and Paris are the leading examples of a number of cities developing citywide circular economy plans and strategies, developing ad hoc metrics and facilitating collaboration among agencies and private stakeholders, and empowering local communities.
Ambitious CE strategies and action plans can catalyze private investments. Ensuring alignment with the EU’s CEAP requires strategic and planning efforts based on country-specific circumstances. Participative process and careful analysis can elicit competitive advantages and impacts of policy options (Figure 6.3). Building blocks include (a) material flow analyses; (b) identification and prioritization of key materials, products, sectors, and value chains; (c) assessment of co-benefits with climate, pollution, and nature protection goals; (d) stakeholder mapping and consultations; (e) action planning; (f) funding for implementation; and (g) monitoring and evaluation (M&E). Feedback gathered from public and private stakeholders, however, shows that governments still have some way to go. Among the EU-4 countries only Poland has a CE roadmap that was published in 2019 and focuses on prioritized thematic areas.
Policy coherence for circularity needs to include the trade dimension of the transition. The possibility of leakage of material-intensive production toward linear production havens following an increasingly stringent CE policy environment in the EU calls for trade policy instruments to play a key role in addressing both sustainability and competitiveness concerns. International trade policy can be leveraged to support domestic measures aimed at transforming production and consumption patterns. The EU can leverage GVCs to disseminate technology and achieve material efficiency gains in production
FIGURE 6.3:
Do a national CE Strategy and an Action Plan adequately support the transition in your country?
There is a clear Strategy and Action Plan for the implementation of a circular economy transition.
There is a clear Strategy but an Action Plan that guides its practical implementation is missing.
There is neither a clear Strategy nor an Action Plan to implement it. I don't know.
processes located outside Europe on a global scale while limiting risks of leakage. Given that most leakage takes place in downstream industries (as discussed in Chapter 3), designing policies (material taxes or regulatory measures) such that lead firms take responsibility for primary material use and other externalities across the full value chain will be critical to remove the risk that materials are relocated to ‘linear production havens.’ This calls for a growing relevance of CE considerations within trade agreements.
Stronger market-based incentives supporting the transition toward circularity are required to make circular products more competitive. Most importantly, due to current taxation patterns, virgin raw materials are often cheaper than secondary ones, weakening incentives to engage in business transformation. For example, recycled plastics are more expensive than conventional virgin plastics as the cost structure of recycled plastics production is different from that of virgin production. Government support and subsidies for hydrocarbon inputs to plastics production undermine the competitiveness of recycled materials. Other than pricing, regulations
are still largely aligned with the linear economy models and hence get in the way of using secondary raw materials.
Regulation can push circularity at three levels: product, company, and procurement. The product level is about setting standards so that products can be recirculated after their useful life, and ‘planned obsolescence’ does not get in the way’.117 So, the proposed Eco-design for Sustainable Products Regulation that allows benchmarking for circular aspects of product performance, including durability, reparability, recyclability, minimum recycled content, and hazardous substances content, will be key. At the company level, the EU taxonomy and the adoption of corporate sustainability reporting standards can lead to CE becoming an integral part of business, whereby companies are nudged to be transparent about their circular activities. Private and public procurement can then focus on products and services that are actively supporting circularity and hence help scale solutions led by companies that are built around the concept of circularity.
Additional regulatory instruments that could be instrumental in pushing circularity include the right to repair, recycled content mandates,
117 The concerns with planned obsolescence are as follows: design features that do not allow for repair and refurbishment, the unavailability of spare parts and high repair costs, and marketing strategies pushing consumers to buy new products and replace existing one quickly.
product labeling, and extended producer responsibility schemes. The right to repair is not a well-developed instrument, since repair, remanufacturing, and refurbishment of products are still not the norm. However, it is a powerful instrument to advance in the CE transition that countries need to make further efforts to advance. There is a need to document and disseminate the economic and social benefits from the adoption of the right to repair, given its relative competitiveness, since the right to repair is a labor-intensive process for which a market could develop in most countries and bring substantial employment and growth. EPR is already showing promising results in EU MSs, although with differing levels of success. However, its use is limited to certain sectors such as electronics, tires, and packaging. It is important to assess the options to expand EPR to cover additional sectors to reduce waste. Additional effort could be made to use EPR to spur innovation. For example, introducing eco-differentiation of the fee in the EPR schemes instead of focusing on the cost of management of waste as the basis for the fee could induce eco-innovation and lead to waste avoidance. Additional regulatory instruments in the EU include recycled content mandates, green procurement, product labeling, and sanctions against polluters. However, implementation across EU-4 remains uneven (Figure 6.3).118
Strong economic and fiscal incentives are needed to promote circular markets. In the present linear economy model, externalities are not included in cost-benefit analysis, which means that
environmentally damaging products remain price competitive. Economic instruments, starting from taxation, can complement the role of regulation by closing the gap between linear pricing and the ‘true pricing’ of products, thus serving to increase demand and supply of circular solutions. Some countries are already leading the way. For example, while China put in place a ban on importing plastics waste, it also reduced VAT on recycled plastics, thus encouraging its use. In the EU, however, VAT regimes still tend to favor linear business models, thereby discouraging the emergence of CBMs based on rent, repair, refurbish, and repurpose activities.
Shifting the fiscal burden from labor to materials and pollution is a powerful mechanism to support the CE transition. This requires reducing the tax on labor while increasing it on polluting activities. The challenge of an immediate backlash from industries and from countries concerned about competitiveness can be addressed by gradual implementation and clear signals of the direction of travel and medium-term targets. The opportunities arising from recycling revenues from the pollution taxes to decrease the cost of labor will not only support material efficiency but also stimulate growth.
Public procurement has a significant potential to accelerate the transition to a CE. Representing about €1.8 trillion each year, public procurement accounts for about 14 percent of the EU’s GDP. Given its sheer size, public procurement
118 Normalized data in which the best performer gets the highest score, and the lowest performer gets the lowest score.
has the power to shape markets and create new ones by stimulating demand for circular goods and services. However, traditional valuation approaches used in public procurement perpetuate a linear bias. The 2017 EC guidelines on circular procurement call for “a framework for the holistic consideration of environmental impacts and waste creation across the whole life-cycle of goods and services.” The EGD calls for public authorities to ensure that their procurement is green. However, circular public procurement (CPP) remains a voluntary instrument and has yet to become common practice across the EU public authorities on all levels.119
Full cost accounting is central to CPP implementation, and some EU MSs are spearheading pilot projects to test its viability and acceptability. Life-cycle costing (LCC) considers ‘true pricing’ related to environmental externalities, as long as they can be monetized and monitored, as well as internal costs related to research, development, production, transport, use, maintenance, and end-of-life disposal. 120 The Dutch government has launched pilot projects such as the N33 highway renovation applying a circular procurement process, among others, aimed at using renewable input resources. Other European experiences are following suit (for example, Denmark, Sweden, and Latvia). These and other early adopters underline the importance of (a) preexisting market conditions that allow for greater recycling; (b) close collaboration between stakeholders, both inside the government and outside; (c) a good understanding of the concept of circular procurement; (d) sufficient fiscal space to bear initially higher up-front costs; and (e) political will.121
However, the adoption of circular procurement remains incipient in several EU MSs, as its widespread uptake faces numerous barriers. In the short term, procurement agencies are constrained in launching tenders with circularityoriented criteria by what the market can actually offer, given the still limited uptake of CBMs within the private sector. And yet, CPP’s promise is precisely to encourage and guide innovation in the private sector by signaling demand for circularity
119 EC, n.d.-d, n.d.-e.
120 Circular Flanders, n.d.
121 Alhola and Salmenperä 2019; SZREDA 2020.
122 Behrens 2018.
goods and services. Unless full cost accounting and LCC are considered and communicated, Budget Departments and other government agencies are unlikely to agree to procurement activities promising unclear long-term benefits but higher up-front costs. Lastly, CPP benefits need to be communicated to legislators, as public procurement legal frameworks do not yet include principles of circularity or green procurement.
However, given the political will, procurement agencies can stimulate the market for CPP by overcoming the informational barriers constraining its rollout. Current market readiness levels do not prevent procurement agencies from introducing nonbinding circularity requirements in tendering scoring systems, with a view to creating market expectations of their mandatory nature in the longer term. Provided the government is supportive, procurement agencies can encourage policy coordination among central and local government authorities, leading to legal/regulatory frameworks codifying the rationale for government function (Annex 4).
Informational barriers at different levels constrain the CE transition. At the public sector level, a CE strategy with concrete targets and headline indicators is important to set the pathway and manage expectations regarding the transition.122 However, this requires clarity on priority measures to promote the circularity agenda, which decision-makers often lack. Within the private sector, while large companies often have the capacities to initiate the shift to CBMs, SMEs lack the resources to do so. Working through business associations and other private sector platforms is one way to conduct the necessary outreach. Furthermore, awareness raising at the level of both internal organizations and external stakeholders (including the value chain network) is crucial, and they can advise on and improve the economic viability and bankability of projects and visualize collaborative arrangements within the supply chain.
Influencing the demand side through greater information and awareness of consumers is the ultimate lever in supporting the CE transition. Eco-design standards and labels for products and services can provide transparent and easily accessible information for consumers to exercise their preferences and send a message to the market. However, this presupposes levels of awareness among consumers that are not yet present. Consumer demand can be more readily affected by linking circularity to issues that affect them directly, such as pollution and environmental health, or are part of an ongoing transition, such as that related to energy and climate mitigation.123 Similarly, increased cooperation by firms requires information about circular aspects of products exchanged in business-to-business and businessto-consumer transactions through product information requirements (for example, product passports) or publicly accessible databases.
Transparency can increase accountability among public and private stakeholders involved in the transition. To support trade and aid aspects of the global CE agenda, information on embodied materials in imports and their environmental effects should be transparently available, for example, through standards and labeling. A system of accountability could be set up where the comparative strength of civil society organizations (CSOs) in playing a watchdog role can be tapped to create a stronger accountability mechanism.
Efforts to develop CE metrics should be geared to support transition policies. The EU tracks key indicators gathered by its MSs such as waste collection, recycling rates, and the usage of secondary materials. But while these indicators provide a good macro-level overview, their level of aggregation may limit their application by policy makers and companies (Annex 4, Focus Section B). Better materials and sector resolution can allow for measures targeting value chains and material streams. Considering both stocks and flows of materials would provide a fuller picture of countries’ different dematerialization pathways and help improve the management of existing
material assets. Finally, given that standard material flow indicators tend to have long material cycles, standard metrics of circularity policy implementation would allow for more regular and just-in-time feedback to decision-makers and citizens on progress.
Setting up measurable targets for circularity can be an important driver for the CE transition when complemented with appropriate indicators. Target setting in the EU has so far focused on waste management. An advantage of waste targets is that they are often easier to enforce than targets based on resource use or the raw material used. The disadvantage is that a general waste target can lump all kinds of waste together irrespective of their environmental impacts. Far fewer countries have targets on resource productivity, which is usually expressed as GDP over DMC. Even less in use are targets related to the supply of raw materials, though there are widespread concerns about reliance on resource imports and security of supply. The Netherlands and Belgium are exceptions in the EU in that they both have absolute resource reduction targets.
CE policies require a better understanding of the firm-level features which can enable or constrain the private sector’s capacity to engage in and drive the transition. Firm size, age, export orientation, ownership structure, and managerial practices are all likely to influence companies’ capacity to develop CBMs. But a better grasp of firm-level constraints is needed for policies to provide adequate and targeted support to firms.
More granular indicators can support the development of CE targets. Materials differ in their environmental impacts, availability, scarcity, and origin. Hence, it is important to further detail CE targets through more granular indicators to ensure that the target is met foremost through reductions in raw materials that are scarce, whose supply is considered critical, and/or that are considered high impact from an environmental or social perspective. This could be complemented with indicators to strengthen the existing macroeconomic indicators adopted at the national level, to measure, monitor, and benchmark the CE performance also at the
123 The successful phaseout of lead from gasoline is an example of consumer demand driven by pollution and environmental health concerns, while the shift away from compact fluorescent lamps is a good example of the global transition in energy and climate mitigation.
Source: World Bank.
regional, local, sector, and corporate levels. Once developed, these indicators can be used for M&E of CE, which is essential for tracking progress and achieving targets. Currently, there is a lack of knowledge about the level of M&E systems that are in place and their performance across the EU-4 countries (Figure 6.5).
While recent growth in CE financing is promising, far more capital and activity are needed to scale the CE and fully seize its opportunity. Since the beginning of 2020, assets managed through public equity funds with the CE as the sole or partial investment focus have increased sixfold, from US$0.3 billion to over US$2 billion. Risk perceptions affecting the promoters of CE projects are driven by traditional financial and accounting approaches that are not adapted to CBMs as well as by the institutional, informational, and pricing barriers that perpetuate linear biases.124 There is a key role for governments, central banks, and financial regulators in aiding this transition. While governments can directly invest in circular activities and use regulation and fiscal incentives to drive capital toward circular businesses, central banks and financial regulators can integrate linear risks in their risk assessment and modeling. Deployment of guarantee instruments and blended finance solutions can catalyze commercial capital toward CBM start-ups.
The EU is providing several funding programs to support the transition to a CE, but the challenge is taking them to scale. Traditional EU programs include the European Structural and Investment Funds, Horizon 2020, and the LIFE program. In addition, the European Investment Bank (EIB) is providing finance and advice for CE projects through the European Fund for Strategic Investments and the ‘EU Finance for Innovators’ (InnovFin) Program. The Recovery and Resilience Facility (RRF) provides the opportunity for financing material efficiency investments. Overall, there seems to be no lack of (EU) finance, but absorption of funds is a problem, especially in the EU-4. The challenge of scaling needs to be overcome through connecting CE projects with commercial financing, given that these projects require co-financing of about three to four times grant amounts.
Some of the larger commercial banks are stepping up to the challenge. The Dutch Bank ING has moved into the space of financing circular deals and investments. ING regularly hosts Circular Economy Business Simulation games, as a start of its journey with clients as well as with employees and cities. They help clients develop circular propositions and create valid business cases for circular propositions, focusing on a proper risk reward distribution among all parties involved. Together with Accenture and Circle Economy, ING has set up a ‘circular supply chain accelerator’ (CiSCA) to help large multinationals and their small and medium-size suppliers shift to CBMs. They have also introduced Circular Economy Finance
Guidelines together with two other Dutch banks, ABM AMRO and Rabobank.
Financing the CE will not take off in the absence of the reform of those policies that continue to bias toward a linear model. The EU financing framework for the CE is evolving, addressing both public and private sectors. A potential game changer is the inclusion of the CE in the EU taxonomy for sustainable activities, which could substantially ease access to finance for CBMs. However, these efforts will not be
successful without the simultaneous development of a comprehensive and consistent policy framework supporting circular and disincentivizing linear activities. Finance requires more than a green tag, needing a business case at an acceptable risk level. If policies and incentives continue to discriminate against circularity, finance may well foster the emergence of niche markets and products, but these will be inadequate to decouple welfare creation from material consumption.
•
Knowledge
•
Step up technical expertise within line and central ministries
Enhance vertical coordination and empower cities
Introduce subsidies to secondary materials and remove subsidies to material production and consumption
Increase/introduce taxes on materials production, consumption, and disposal
Policy coherence
Introduce CE objectives in the trade and industrial policy
Resolve regulatory conflicts
Consider trade-offs of transition and supporting policies, such as tax shifts
Economic instruments
Tradable permits
EPR instruments Regulations
Prohibitory/ mandatory provisions
Support circular skills development
Raise consumer awareness
Introduce material labelling and passports Direct public support
Public-private initiatives
Concessional credit schemes
Material efficiency targets in public-private partnerships (PPPs).
Sector and material disaggregation plus stocks and flows metrics
Institutions, incentives, information, and financing are the pillars of the policy packages to enable and support the circular transition. National public institutions need to have the capacity and institutional framework to ensure policy coherence across sectors to drive the CE agenda using a ‘whole-of-government’ approach. Fiscal measures can be powerful tools, but they need to be coupled with smart regulations for greater
impact. Information asymmetries can be remedied by improving metrics and ensuring their effective communication. Improved metrics can then enable the production of targets supporting monitoring and reporting on progress. The removal of linear biases will unlock private sector financing and ensure that scarce public resources are leveraged to support the scale, depth, and speed of adoption of business models supporting the transition.
Adams, K. T., M. Osmani, T. Thorpe, and J. Thornback. 2017. “Circular economy in construction: current awareness, challenges and enablers.” Proceedings of the Institution of Civil Engineers – Waste and Resource Management 170 (1): 15–24. https://www. icevirtuallibrary.com/doi/full/10.1680/jwarm.16.00011
Alhola, K., and H. Salmenperä. 2019. Summary Report Work Package 2.1 State-of-the-Art on Circular Procurement Policy in the Baltic Sea Region. Helsinki: Finnish Environment Institute (SYKE).
Allwood. J., M. F. Ashby, T. Gutowski, and E. Worrell. 2011. “Material Efficiency: A White Paper”, Resource, Conservation and Recycling, 55, 3, 362-381
Almén, J., M. Anehagen, E. Enström, C. Hartman, C. Jonsson, F. Lindbladh, and J. Ohlsson. 2020. “Promoting the Repair Sector in Sweden.” American Economic Review 105 (10): 3150–3182.
Antikainen, M., and K. Valkokari. 2016. “A Framework for Sustainable Circular Business Model Innovation.” Technology Innovation Management Review 6 (7): 5–12.
APEC. 2012. “ANNEX C - APEC List of Environmental Goods.” https://www.apec.org/meeting-papers/leaders-declarations/2012/2012_aelm/2012_aelm_annexc
Arctic Smartness. n.d. “Arctic Industry and Circular Economy Cluster” (accessed March 2022), https://arcticsmartness.eu/arcticindustry/.
Baldock, David, and Céline Charveriat. 2018. 30x30 Actions for a Sustainable Europe, #Think2030 Action Plan. The Institute for European Environmental Policy.
Bangert, H. 2021. Japan’s Circularity. Minerva Past Reports. EU-Japan Centre for Industrial Cooperation.
Behrens, A. 2018. “Sustainable Indicators for a Resource Conscious Europe.” In Eurostat, Power from Statistics: Data, Information and Knowledge Outlook Report. Luxembourg: Publication Office of the European Union.
Bertels, S. L. Papania, D. Papania, Embedding Sustainability in Organizational Culture (A systematic review of the body of knowledge. London, Canada: Network for Business Sustainability) (2010) https://embeddingproject.org/pub/resources/EP-EmbeddingSustainability-in-Organizational-Culture.pdf
Bibas, R., J. Château, and E. Lanzi. 2021. “Policy Scenarios for a Transition to a More Resource Efficient and Circular Economy.” OECD Environment Working Papers 169. Paris: OECD Publishing. https://doi.org/10.1787/c1f3c8d0-en.
Bin, S., Y. Zhiquan, L. S. C. Jonathan, D. K. Jiewei, D. Kurle, F. Cerdas, and C. Herrmann. 2015. “A Big Data Analytics Approach to Develop Industrial Symbioses in Large Cities.” Procedia CIRP 29: 450–455.
Bleda, M., and J. Chicot. 2020. “The Role of Public Procurement in the Formation of Markets for Innovation.” Journal of Business Research 107: 186–196.
Board of Innovation. 2020. “Business Models for the Circular Economy.” https://www.boardofinnovation.com/
Bocken, N., F. Boons, and B. Baldassarre. 2019. “Sustainable Business Model Experimentation by Understanding Ecologies of Business Models.” Journal of Cleaner Production 208: 1498–1512.
Bocken, N. M., I. De Pauw, C. Bakker, and B. Van Der Grinten. 2016. “Product Design and Business Model Strategies for a Circular Economy.” Journal of Industrial and Production Engineering 33 (5): 308–320.
Böhringer, C., S. Peterson, T. F. Rutherford, J. Schneider, and M. Winkler. 2021. “Climate Policies After Paris: Pledge, Trade and Recycle: Insights from the 36th Energy Modeling Forum Study (EMF36).” Energy Economics 103: 105471.
Cambridge Econometrics, Trinomics, and ICF. 2018. Impacts of Circular Economy Policies on the Labour Market. Luxemburg: Publication Office of the European Union
Carmona, L. G., K. Whiting, H. Haberl, and T. Sousa. 2020. “The Use of Steel in the United Kingdom’s Transport Sector: A Stock–Flow–Service Nexus Case Study.” Journal of Industrial Ecology 25 (1): 125–143.
CAWEB. 2021. “Landfill taxes and Restrictions Overview”, https://www.cewep.eu/wp-content/uploads/2021/10/Landfill-taxes-andrestrictions-overview.pdf
Chen, J., M. Chepeliev, D. Garcia-Macia, D. Iakova, J. Roaf, An. Shabunina, D. van der Mensbrugghe, and P. Wingender 2020. “EU Climate Mitigation Policy.” International Monetary Fund. Departmental Paper Series No. 20/13.
Chepeliev, M. 2020. “GTAP-Power Data Base: Version 10.” Journal of Global Economic Analysis 5 (2): 110–137.
Chepeliev, M., I. Osorio-Rodarte, and D. van der Mensbrugghe. 2021. “Distributional Impacts of Carbon Pricing Policies Under the Paris Agreement: Inter and Intra-Regional Perspectives.” Energy Economics 102:105530.
Cherif R., and F. Hasanov. 2019. “The Return of the Policy That Shall Not Be Named: Principles of Industrial Policy.” IMF Working Paper WP/19/74.
Circle Economy. 2017. “Circular Jobs: Understanding Employment in the Circular Economy in the Netherlands.” https://www.circleeconomy.com/resources/circular-jobs-understanding-employment-in-the-circular-economy-in-the-netherlands
Circle Economy. 2018. “Linear Risks.” https://assets.website-files.com/5d26d80e8836af2d12ed1269/5de8eff3bbf4da023e254ea4_ FINAL-linear-risk-20180613.pdf.
Circle Economy. 2020. The Circularity Gap Report 2020 https://pacecircular.org/sites/default/files/2020-01/Circularity%20Gap%20 Report%202020.pdf
Circle Economy. 2021. “Circular Economy Strategies Can Cut Global Emissions by 39%.” https://www.circle-economy.com/news/ circular-economy-strategies-can-cut-global-emissions-by-39
Circle Economy. 2022. Circularity Gap Report 2022 https://www.circularity-gap.world/2022#Download-the-report
Circular Economy Stakeholder Platform. 2021. “Circular Taxation Reflection Paper.” https://circulareconomy.europa.eu/platform/sites/ default/files/leadership_group_on_economic_incentives_-_circular_taxation_reflection_paper_2021.pdf
Circular Flanders. n.d. “Financing of Circular Procurement” (accessed March 2022), https://aankopen.vlaanderen-circulair.be/en/gettingstarted/financing
Circular Jobs Initiative. 2021. “Closing the Skills Gap: Vocational Education and Training for the Circular Economy.” https://www.circleeconomy.com/resources/closing-the-skills-gap-vocational-education-and-training-for-the-circular-economy,
Cluster Excellence Denmark. 2019. “Clusters in the Circular Economy.” http://circularpp.eu/wp-content/uploads/2019/11/Clusters-inCircular-Economy.pdf
Conseil Européen de Remanufacture. n.d. “Remanufacturing: A Primer.” https://www.remancouncil.eu/files/CER_Reman_Primer.pdf
Cramer, J. 2014. Milieu: Elementaire Deeltjes: 16. Amsterdam: Athenaeum.
Cramer, J. M. 2020. “The Function of Transition Brokers in the Regional Governance of Implementing Circular Economy—A Comparative Case Study of Six Dutch Regions.” Sustainability 12 (12): 5015.
Daddi, T., F. Iraldo, M. Frey, P. Gallo, and V. Gianfrate. 2016. “Regional Policies and Eco-Industrial Development: The Voluntary Environmental Certification Scheme of the Eco-Industrial Parks in Tuscany (Italy).” Journal of Cleaner Production 114: 62–70.
Davis, S. J., and K. Caldeira. 2010. “Consumption-based Accounting of CO2 Emissions.” Proceedings of the National Academy of Sciences 107 (12): 5687–5692.
Daxbeck, H., H. Buschmann, S. Neumayer, and B. Brandt. 2009. “Methodology for mapping of physical stocks.” Sixth Framework Programme. http://forwast.brgm.fr/Documents/Deliverables/Forwast_D23(V1-0).pdf
Deloitte. 2015. Increased EU Plastics Recycling Targets: Environmental, Economic and Social Impact Assessment - Final Report. https://www.plasticsrecyclers.eu/_files/ugd/0af79c_d3c616e926e24896a8b82b833332242e.pdf
Deloitte and Utrecht University. 2017. “Breaking the Barriers to the Circular Economy.” https://www2.deloitte.com/content/dam/Deloitte/ nl/Documents/risk/deloitte-nl-strategic-risk-breaking-the-barriers-to-the-circular-economy-white-paper.pdf
Donati, F., G. A. Aguilar-Hernandez, C. P. Sigüenza-Sánchez, A. de Koning, J. F.D. Rodrigues, and A. Tukker. 2020. “Modeling the circular economy in environmentally extended input-output tables: Methods, software and case study”, Resources, Conservation and Recycling 25 (5): 36–50.
EC (European Commission). 2011. “Roadmap to a Resource Efficient Europe.” https://eur-lex.europa.eu/legal-content/EN/ TXT/?uri=CELEX:52011DC0571
EC. 2012. “Ecodesign Your Future: How Ecodesign Can Help the Environment By Making Products Smarter.” https://pmesustentavel. apee.pt/images/doc/1-Ecodesign-Brochura.pdf
EC. 2015. “Communication From the Commission to the European Parliament, The Council, The European Economic and Social Committee and the Committee of the Regions: Closing the loop - An EU Action Plan for the Circular Economy”, https://eurlex.europa.eu/resource.html?uri=cellar:8a8ef5e8-99a0-11e5-b3b7-01aa75ed71a1.0012.02/DOC_1&format=PDF
Policies from Europe’s Circular Economy Transition
EC. 2017. “Priority Sector Report: Circular Economy.” https://ec.europa.eu/docsroom/documents/24681/attachments/3/translations/ en/renditions/native
EC. 2018. “Impacts of Circular Economy Policies on the Labor Market: Final Report” https://circulareconomy.europa.eu/platform/sites/ default/files/ec_2018_-_impacts_of_circular_economy_policies_on_the_labour_market.pdf
EC. 2019a. “Press Release—Closing the Loop: Commission Delivers on Circular Economy Action Plan.” https://ec.europa.eu/ commission/presscorner/detail/en/IP_19_1480
EC. 2019b. “The European Green Deal.” Communication from the European Commission. https://ec.europa.eu/info/strategy/ priorities-2019-2024/european-green-deal_en
EC. 2020a. “Critical Raw Materials Resilience: Charting a Path towards Greater Security and Sustainability.” https://eur-lex.europa.eu/ legal-content/EN/TXT/?uri=CELEX:52020DC0474
EC. 2020b. “Proposal for a Regulation of the European Parliament and of the Council Concerning Batteries and Waste Batteries, Repealing Directive 2006/66/EC and Amending Regulation (EU) No 2019/1020.” https://eur-lex.europa.eu/legal-content/EN/ TXT/?uri=CELEX%3A52020PC0798
EC. 2020c. “Questions and Answers: Sustainable and Smart Mobility Strategy.” https://ec.europa.eu/commission/presscorner/detail/en/ qanda_20_2330
EC. 2020d. “A New Circular Economy Action Plan.” https://ec.europa.eu/environment/circular-economy/pdf/new_circular_economy_ action_plan.pdf
EC. 2020e. “Communication from the Commission: A New Industrial Strategy for Europe.” https://eur-lex.europa.eu/legal-content/EN/ TXT/?uri=COM%3A2020%3A102%3AFIN
EC. 2021a. “Proposal for a Regulation of the European Parliament and of the Council Establishing a Carbon Border Adjustment Mechanism, COM (2021) 564 Final.” https://eur-lex.europa.eu/legal-content/EN/TXT/?uri=celex:52021PC0564
EC. 2021b. “Proposal for a New Regulation on Waste Shipments.” https://environment.ec.europa.eu/publications/proposal-newregulation-waste-shipments_en
EC. 2022. “Taxes on Labour as % of Total Taxation, Environmental Taxes as % of Total Taxation.” https://ec.europa.eu/taxation_ customs/business/economic-analysis-taxation/data-taxation_en
EC. n.d.-a. “Critical Raw Materials” (accessed March 2022). https://ec.europa.eu/growth/sectors/raw-materials/areas-specific-interest/ critical-raw-materials_en
EC. n.d.-b. “Climate Action: How Will We Be Affected?” (accessed March 2022). https://ec.europa.eu/clima/eu-action/adaptationclimate-change/how-will-we-be-affected_en.
EC. n.d.-c. “Internal Market, Industry, Entrepreneurship and SMEs: Buildings and Construction” (accessed March 2022). https:// ec.europa.eu/growth/industry/sustainability/buildings-and-construction_en
EC. n.d.-d. “Environment: What Is GPP?” (accessed March 2022), https://ec.europa.eu/environment/gpp/what_en.htm
EC. n.d.-e. “Circular Procurement” (accessed March 2022). https://ec.europa.eu/environment/gpp/circular_procurement_en.htm
EC. n.d.-f. “The Common Agricultural Policy at a Glance” (accessed March 2022). https://ec.europa.eu/info/food-farming-fisheries/keypolicies/common-agricultural-policy/cap-glance_en
EC, Directorate-General for Environment. 2014. “Scoping Study to Identify Potential Circular Economy Actions, Priority Sectors, Material Flows and Value Chains: Final Report”, https://data.europa.eu/doi/10.2779/29525
EC, Directorate-General for Environment, R. Williams, and L. Baroni. 2018. “Study Report in Support of Evaluation of the Directive 2006/66/EC on Batteries and Accumulators and Waste Batteries and Accumulators: Final Report Under the Framework Contract on Economic Analysis of Environmental and Resource Efficiency Policies ENV.F.1./FRA/2014/0063.” https:// ec.europa.eu/environment/pdf/waste/Published%20Supporting%20Study%20Evaluation.pdf
Eckermann, F., M. Golde, M. Herczeg, M. Mazzanti, R. Zoboli, and S. Speck. 2015. “Material Resource Taxation–An Analysis for Selected Material Resources.” European Topic Centre on Sustainable Consumption and Production & European Topic Centre on Waste and Materials in a Green Economy: Copenhagen.
EEA (European Environment Agency). 2008. “Effectiveness of Environmental Taxes and Charges for Managing Sand, Gravel and Rock Extraction in Selected EU Countries.” https://www.eea.europa.eu/publications/eea_report_2008_2/
EEA. 2013. “Managing Municipal Solid Waste—A Review of Achievements in 32 European Countries. Report No 2/2013.” Copenhagen: European Environment Agency.
EEA. 2018. “Water Use in Europe Quantity and Quality Face Big Challenges” https://www.eea.europa.eu/signals/signals-2018content-list/articles/water-use-in-europe-2014
EEA. 2020a. “Construction and Demolition Waste: Challenges and Opportunities in a Circular Economy.” https://www.eea.europa.eu/ publications/construction-and-demolition-waste-challenges/construction-and-demolition-waste-challenges
EEA. 2020b. “Bio-Waste in Europe: Turning Challenges into Opportunities. EEA Report No 4/2020.” https://www.eea.europa.eu/ publications/bio-waste-in-europe/at_download/file
EEA. 2021. “Waste Recycling in Europe.” https://www.eea.europa.eu/ims/waste-recycling-in-europe
EIT. n.d. “Making Innovation Happen” (accessed March 2022). https://eit.europa.eu/
Ellen MacArthur Foundation. 2016a. “The New Plastics Economy: Rethinking the Future of Plastics” https://ellenmacarthurfoundation. org/the-new-plastics-economy-rethinking-the-future-of-plastics
Ellen MacArthur Foundation. 2016b. “Intelligent Assets: Unlocking the Circular Economy Potential.” https://ellenmacarthurfoundation. org/intelligent-assets-unlocking-the-circular-economy-potential
Ellen MacArthur Foundation. 2019. “Completing the Picture: How the Circular Economy Tackles Climate Change.” https:// ellenmacarthurfoundation.org/completing-the-picture
Ellen Macarthur Foundation. 2021a. “Recycling and the Circular Economy: What’s the Difference?” https://ellenmacarthurfoundation. org/articles/recycling-and-the-circular-economy-whats-the-difference#:~:text=Recycling%20is%20the%20action%20 or,created%20in%20the%20first%20place
Ellen MacArthur Foundation. 2021b. “Financing the Circular Economy.” https://ellenmacarthurfoundation.org/topics/finance/overview
Ellen MacArthur Foundation, McKinsey, and SUN. 2015. “Growth within: A circular economy vision for a competitive Europe.” https:// ellenmacarthurfoundation.org/growth-within-a-circular-economy-vision-for-a-competitive-europe
Environmental Assessment Institute. 2005. “Environmentally Harmful Subsidies.” https://www.cbd.int/financial/fiscalenviron/gsubsidiesoverview.pdf
ESPON. 2019. “CIRCTER - Circular Economy and Territorial Consequences. Final Report, Annex 3.” https://www.espon.eu/sites/ default/files/attachments/CIRCTER%20FR%20Annex%203%20Analysis%20of%20material%20and%20waste%20 patterns%20and%20flows.pdf
European Monitoring Centre on Change. n.d. “Industrial Parks and Industrial Zones” (accessed March 2022). https://www.eurofound. europa.eu/observatories/emcc/erm/support-instrument/industrial-parks-and-industrial-zones
European Parliament. 2017. “Tourism and the Sharing Economy.” https://www.europarl.europa.eu/RegData/etudes/BRIE/2017/595897/ EPRS_BRI(2017)595897_EN.pdf
European Parliament. 2019. “Regulation of the European Parliament and of the Council Concerning Batteries and Waste Batteries, Repealing Directive 2006/66/EC and Amending Regulation (EU) No 2019/1020.” https://eur-lex.europa.eu/legal-content/EN/ TXT/?uri=CELEX%3A52020PC0798
European Policy Center. 2020. “The Circular Economy: Going Digital.” https://www.epc.eu/content/PDF/2020/DRCE_web.pdf
Eurostat. 2001. “Economy-Wide Flow Accounts and Derived Indicators. A Methodological Guide.” Luxembourg: Office for Official Publications of the European Communities. https://ec.europa.eu/eurostat/documents/3859598/5855193/KS-34-00-536-EN. PDF.pdf/411cd453-6d11-40a0-b65a-a33805327616?t=1414780409000.
Eurostat. 2018a. “Economy-Wide Material Flow Accounts Handbook. 2018 Edition.” https://ec.europa.eu/eurostat/ documents/3859598/9117556/KS-GQ-18-006-EN-N.pdf/b621b8ce-2792-47ff-9d10-067d2b8aac4b?t=1537260841000
Eurostat. 2018b. “Waste Generation by Economic Activities and Households, 2018 (% Share of Total Waste).” https://ec.europa.eu/ eurostat/statistics-explained/index.php?title=File:Waste_generation_by_economic_activities_and_households,_2018_(%25_ share_of_total_waste_).png
Eurostat. 2021a. “Private Investments, Jobs and Gross Value Added Related to Circular Economy Sectors.” https://ec.europa.eu/ eurostat/web/products-datasets/-/cei_cie010
Eurostat. 2021b. “EU’s Circular Material Use Rate Increased in 2020.” https://ec.europa.eu/eurostat/web/products-eurostat-news/-/ ddn-20211125-1
Eurostat. 2021c. “Waste Statistics.” https://ec.europa.eu/eurostat/statistics-explained/index.php?title=Waste_statistics
Eurostat. 2021d. “National Accounts and GDP.” https://ec.europa.eu/eurostat/statistics-explained/index.php?title=National_accounts_ and_GDP
Eurostat. 2021e. “Where Does EU Waste Go?.” https://ec.europa.eu/eurostat/web/products-eurostat-news/-/ddn-20210420-1
Eurostat. 2022a. “Water Statistics: Water Uses.” https://ec.europa.eu/eurostat/statistics-explained/index.php?title=Water_ statistics#Water_uses
Eurostat. 2022b. “Material Flow Accounts.” https://ec.europa.eu/eurostat/databrowser/view/ENV_AC_MFA__custom_1987434/default/ table?lang=en.
Eurostat. 2022c. “Recovery Rate of Construction and Demolition Waste.” https://ec.europa.eu/eurostat/cache/metadata/en/cei_ wm040_esmsip2.htm
Eurostat. 2022d. “Resource Productivity Statistics.” https://ec.europa.eu/eurostat/statistics-explained/index.php?title=Resource_ productivity_statistics
Eurostat. 2022e. “Environmental Tax Revenue.” https://ec.europa.eu/eurostat/databrowser/view/env_ac_tax/default/table?lang=en
Forti, V., C. P. Balde, R. Kuehr, and G. Bel. 2020. “The Global E-waste Monitor 2020: Quantities, Flows and the Circular Economy Potential.” https://collections.unu.edu/view/UNU:7737. Garrido-Prada, P., H. Lenihan, J. Doran, C. Rammer, and M. PerezAlaniz. 2021. “Driving the Circular Economy through Public Environmental and Energy R&D: Evidence from SMEs in the European Union.” Ecological Economics 182:106884.
Geissdoerfer, M., P. Savaget, N. M. Bocken, and E. J. Hultink. 2017. “The Circular Economy–A New Sustainability Paradigm?” Journal of Cleaner Production 143:757–768.
Gerst. M.D., and T. E. Graedel. 2008.”In-use stocks of metals: status and implications”, Environmental Science & Technology 42 (19) 7038–7045.
Geyer, R., J. R. Jambeck, and K. L. Law. 2017. “Production, Use, and Fate of all Plastics Ever Made.” Science Advances 3(7): 1–5.
Global Footprint Network. 2022. “Ecological Footprint of Countries 2018.” https://data.footprintnetwork.org/#/ compareCountries?type=EFCpc&cn=2002&yr=2018#Gross_value_added_in_the_EU_by_economic_activity
Global Infrastructure Hub. 2021. “Advancing the Circular Economy through Infrastructure.” https://cdn.gihub.org/umbraco/media/4265/ gi-hub-paper_advancing-circular-economy-through-infrastructure_2021.pdf
Guldmann, E., and R. D. Huulgaard. 2020. “Barriers to Circular Business Model Innovation: A Multiple-Case Study.” Journal of Cleaner Production 243:118160.
Haberl, H., M. Fischer‐Kowalski, F. Krausmann, J. Martinez‐Alier, and V. Winiwarter. 2011. “A Socio‐Metabolic Transition Towards Sustainability? Challenges for Another Great Transformation.” Sustainable Development 19 (1): 1–14.
Haberl, H., D. Wiedenhofer, D. Virág, G. Kalt, B. Plank, P. Brockway, T. Fishman, D. Hausknost, F. Krausmann, B. Leon-Gruchalski and A. Mayer. 2020. “A Systematic Review of the Evidence on Decoupling of GDP, Resource Use and GHG Emissions, Part II: Synthesizing the Insights.” Environmental Research Letters 15 (6): 065003.
Hestin, M. , S. Mudgal, V. Portugal, G. Obersteiner, S. Scherhaufer, P. Beigl, A. Pertl, L. Barruetabeña, O. Salas, C. Delgado, R. Peagam, R. Orsato, L. Van Wassenhove, T. Teichert, D. Pokorny, B. Kopacek, F. Becker, K. Schischke, and T. Woolman. 2010. “Towards Zero Waste in Industrial Networks.” ZeroWin: Literature Review - Approaches to Zero Waste. Southampton, UK: University of Southampton.
Hogg, D., M. S. Andersen, T. Elliott, C. Sherrington, T. Vergunst, S. Ettlinger, L. Elliott, and J. Hudson. 2014. “Study on Environmental Fiscal Reform Potential in 12 EU Member States.” AARHUS University and Eunomia.
Hopkinson, P., M. Zils, P. Hawkins, and S. Roper. 2018. “Managing a Complex Global Circular Economy Business Model: Opportunities and Challenges.” California Management Review 60 (3): 71–94.
ICCT (The International Council on Clean Transportation). 2021. “A Global Comparison of the Life-cycle Greenhouse Gas Emissions of Combustion Engine Electric Passenger Cars.” https://theicct.org/publication/a-global-comparison-of-the-life-cyclegreenhouse-gas-emissions-of-combustion-engine-and-electric-passenger-cars/
ICLEI (International Council for Local Environmental Initiatives). n.d. “Local Governments for Sustainability Europe.” Circular Economy and Waste. https://circulareconomy.europa.eu/platform/en/dialogue/existing-eu-platforms?page=8
IEA (International Energy Agency). 2017. The Future of Trucks: Implications for Energy and the Environment. Paris: IEA.
IEA. 2021. The Role of Critical Minerals in Clean Energy Transitions. Paris: IEA.
IISD. 2020. “Effects of the Circular Economy on Jobs.” https://www.iisd.org/publications/circular-economy-jobs
International Labour Office. 2019. Skills for a Greener Future: A Global View Based on 32 Country Studies. Geneva: ILO.
Global News Wire. 2018. “Europe Extends its Lead in the Industrial IoT with Three Times More Extensive Implementations versus the U.S.” https://www.globenewswire.com/fr/news-release/2018/12/19/1669723/0/en/Europe-Extends-Its-Lead-in-theIndustrial-Internet-of-Things-With-Three-Times-More-Extensive-Implementations-Versus-the-U-S.html
IPCC (Intergovernmental Panel on Climate Change). 2019. “Summary for Policymakers. Climate Change and Land: An IPCC Special Report on Climate Change, Desertification, Land Degradation, Sustainable Land Management, Food Security, and Greenhouse Gas Fluxes in Terrestrial Ecosystems.” https://www.ipcc.ch/srccl/
IRP (International Resource Panel) and UNEP. 2011. “Decoupling Natural Resource Use and Environmental Impacts from Economic Growth” https://wedocs.unep.org/handle/20.500.11822/9816
IRP. 2017. Assessing Global Resource Use: A Systems Approach to Resource Efficiency and Pollution Reduction. A Report of the International Resource Panel. Nairobi, Kenya: United Nations Environment Programme.
IRP. 2019. Global Resources Outlook 2019: Natural Resources for the Future We Want. Nairobi, Kenya: United Nations Environment Programme.
IRP. 2020. Resource Efficiency and Climate Change: Material Efficiency Strategies for a Low-Carbon Future. A Report of the International Resource Panel. Nairobi, Kenya: United Nations Environment Programme.
IRP and UNEP. 2018. “Resource Efficiency for Sustainable Development: Key Messages for the Group of 20.” https://www. resourcepanel.org/reports/resource-efficiency-sustainable-development
Jagtap, S., and S. Rahimifard. 2017. “Unlocking the Potential of the Internet of Things to Improve Resource Efficiency in Food Supply Chains.” In Innovative Approaches and Applications for Sustainable Rural Development, edited by A. Theodoridis, A. Ragkos, and M. Salampasis, 287–301. Denmark: Springer, Cham.
Jansson, K., S. Vatanen, I. Karvonen, K. Behm, R. Waugh, D. Fitzsimons, E. Sundin, and D. Parker. 2017. “D6.3 Targeted Recommendations for Horizon 2020.” Grant Agreement No 645984, European Commission. https://ec.europa.eu/research/ participants/documents/downloadPublic?documentIds=080166e5afc9d681&appId=PPGMS
Johansson, N., J. Krook, and M. Eklund. 2014. “Institutional Conditions for Swedish Metal Production: A Comparison of Subsidies to Metal Mining and Metal Recycling.” Resources Policy 41: 72–82.
Jonker, J., and N. M. Navarro. 2017. “Circular City Governance: An explorative research study into current barriers and governance practices in circular city transitions across Europe.” Luxembourg: European Investment Bank (EIB). https://circulareconomy. europa.eu/platform/sites/default/files/circular-city-governance-an-explorative-research-study-into-current-barriers-andgovernance-practices-in-circular-city-transitions-across-europe-2018.pdf
Khan, O., T. Daddi, and F. Iraldo. 2021. “Sensing, Seizing, and Reconfiguring: Key Capabilities and Organizational Routines for Circular Economy Implementation.” Journal of Cleaner Production 287: 125565.
Kirchherr, J., L. Piscicelli, R. Bour, E. Kostense-Smit, J. Muller, A. Huibrechtse-Truijens, and M. Hekkert. 2018. “Barriers to the Circular Economy: Evidence from the European Union (EU).” Ecological Economics 150: 264–272.
Kirchherr, J., D. Reike, and M. Hekkert. 2017. “Conceptualizing the Circular Economy: An Analysis of 114 Definitions.” Resources, Conservation and Recycling 127: 221–232.
Klee, R. J., and T. E. Graedel. 2004. “Elemental Cycles: A Status Report on Human or Natural Dominance.” Annu. Rev. Environ. Resour. 29: 69–107.
Kodukula, S., 2018. “Integrated Land Use Planning and Urban Transport in Low Carbon Cities.” UNCRD, Environmentally Sustainable Transport (EST) Forum, Ulaanbaatar, Mongolia. https://www.uncrd.or.jp/content/documents/711420190924_EST_LUT_ Final(1).pdf
Krausmann, F., S. Gingrich, N. Eisenmenger, K-H. Erb, H. Haberl, M. Fischer-Kowalski. 2009. “Growth in Global Materials Use, GDP and Population during the 20th Century” Ecological Economics 68 (10): 2696–2705.
Krausmann, F., D. Wiedenhofer, C. Lauk, W. Haas, H. Tanikawa, T. Fishman, A. Miatto, H. Schandl, and H. Haberl. 2017. “Global Socioeconomic Material Stocks Rise 23-Fold over the 20th Century and Require Half of Annual Resource Use.” Proceedings of the National Academy of Sciences 114, 8: 1880–85.
Krausmann, F., C. Lauk, W. Haas, and D. Wiedenhofer. 2018. “From Resource Extraction to Outflows of Wastes and Emissions: The Socioeconomic Metabolism of the Global Economy, 1900–2015.” Global Environmental Change 52: 131–140.
Kristoffersen, E., F. Blomsma, P. Mikalef, and J. Li. 2020. “The Smart Circular Economy: A Digital-Enabled Circular Strategies Framework for Manufacturing Companies.” Journal of Business Research 120: 241–261.
Lacy, P., J. Long, and W. Spindler. 2020. The Circular Economy Handbook. UK: Palgrave Macmillan.
Lanau, M., and G. Liu. 2020. “Developing an Urban Resource Cadaster for Circular Economy: A Case of Odense, Denmark.” Environmental Science & Technology 54 (7): 4675–4685.
Levin, K., B. Cashore, S. Bernstein, and G. Auld. 2012. “Overcoming the Tragedy of Super Wicked Problems: Constraining Our Future Selves to Ameliorate Global Climate Change.” Policy Sciences 45 (2): 123–152.
Linder, M., and M. Williander. 2017. “Circular Business Model Innovation: Inherent Uncertainties.” Business Strategy and the Environment 26 (2): 182–196.
Linnenluecke, M. K., and A. Griffiths. 2010. “Corporate Sustainability and Organizational Culture.” Journal of World Business 45 (4): 357–366.
Policies from Europe’s Circular Economy Transition
Liu, Y., and Y. Bai. 2014. “An Exploration of Firms’ Awareness and Behavior of Developing Circular Economy: An Empirical Research in China.” Resources, Conservation and Recycling 87:145–152.
Long, X., T. Shu, S. Chen, S. Wang, K. K. Lai, and Y. Yang. 2017. “Strategy Analysis of Recycling and Remanufacturing by Remanufacturers in Closed-Loop Supply Chain.” Sustainability 9 (10): 1818.
Low, J. S. C., T. B. Tjandra, F. Yunus, S. Y. Chung, D. Z. L. Tan, B. Raabe, N. Y. Ting, Z. Yeo, and S. Bressan, S. Ramakrishna, and C. Herrmann. 2018. “A Collaboration Platform for Enabling Industrial Symbiosis: Application of the Database Engine for Wasteto-Resource Matching.” Procedia CIRP 69: 849–854.
Masi, D., V. Kumar, J. A. Garza-Reyes, and J. Godsell. 2018. “Towards a More Circular Economy: Exploring the Awareness, Practices, and Barriers from a Focal Firm Perspective.” Production Planning & Control 29 (6): 539–550.
Material Economics. 2018. “The Circular Economy—A Powerful Force for Climate Mitigation.” https://materialeconomics.com/ publications/the-circular-economy-a-powerful-force-for-climate-mitigation-1
Mathews, J. A., and H. Tan. 2016. “Circular Economy: Lessons from China.” Nature 531 (7595): 440–442.
Matinaro, V., and Y. Liu. 2017. “Towards Increased Innovativeness and Sustainability Through Organizational Culture: A Case Study of a Finnish Construction Business.” Journal of Cleaner Production 142: 3184–3193.
Mcilgorm, A., K. Raubenheimer, D. E. McIlgorm, and R. Nichols. 2022. “The Cost of Marine Litter Damage to the Global Marine Economy: Insights from the Asia-Pacific into Prevention and the Cost of Inaction.” Marine Pollution Bulletin 174.
McNeill, J. R. 2001. Something New under the Sun: An Environmental History of the Twentieth-Century World (the Global Century Series). New York: WW Norton & Company.
Milos, L. 2021. “Towards a Circular Economy Taxation Framework: Expectations and Challenges of Implementation.” Circular Economy and Sustainability 1 (2): 477–498.
Morseletto, P. 2020. “Targets for a Circular Economy.” Resources, Conservation and Recycling 153: 104553.
OECD (Organisation for Economic Co-operation and Development), 2018a. “Global Material Resources Outlook to 2060 Economic Drivers and Environmental Consequences.” https://www.oecd.org/env/global-material-resources-outlook-to-20609789264307452-en.htm
OECD. 2018b. “Supply and Use Tables.” https://www.oecd.org/sdd/na/supply-and-use-tables-database.htm
OECD. 2019. “Business Models for the Circular Economy: Opportunities and Challenges for Policy.” https://www.oecd.org/environment/ business-models-for-the-circular-economy-g2g9dd62-en.htm
OECD. 2020. “The Circular Economy in Cities and Regions Synthesis Report. “https://www.oecd.org/regional/the-circular-economy-incities-and-regions-10ac6ae4-en.htm
OECD. 2022. “Material Productivity (indicator)” doi: 10.1787/dae52b45-en.
Platform for Accelerating Circular Economy (PACE). 2021. “Circular Indicators for Governments. Accelerating Action in the Circular Economy.” https://pacecircular.org/sites/default/files/2021-04/CircularIndicatorsForGovernments_FINAL.pdf
Pantzar, M., and T. Suljada. 2020. “Delivering a Circular Economy Within the Planet’s Boundaries: An Analysis of the New EU Circular Economy Action Plan.” Brussels and Stockholm: Institute for European Environmental Policy (IEEP) and Stockholm Environment Institute (SEI).
Parajuly, K., and C. Fitzpatrick. 2020. “Understanding the Impacts of Transboundary Waste Shipment Policies: The Case of Plastic and Electronic Waste.” Sustainability 12 (6): 2412.
Persson L., M. B. M. C. Almroth, C. D. Collins, S. Cornell, C. A. de Wit, M. L. Diamond, P. Fantke, M. Hassellöv, M. MacLeod, M. W. Ryberg, P. S. Jørgensen, P. Villarrubia-Gómez, Z. Wang, and M. Z. Hauschild. 2022. “Outside the Safe Operating Space of the Planetary Boundary for Novel Entities.” Environmental Science & Technology 56 (3), 1510–1521.
Peters, G.P. 2008. “From Production-Based to Consumption-Based National Emission Inventories.” Ecological Economics 65 (1): 13–23.
Plastics Europe. 2021. “Plastics – the Facts 2020. An Analysis of European Plastics Production, Demand and Waste Data.” https:// issuu.com/plasticseuropeebook/docs/plastics_the_facts-web-dec2020
Porter, G. 1996. “Natural Resource Subsidies, Trade and Environment: The Cases of Forests and Fisheries.” Journal of Environment and Development 6 (3): 1–35.
Porter, M. E., and J. E. Heppelmann. 2014. “How Smart, Connected Products Are Transforming Competition.” Harvard Business Review 92 (11): 64–88.
Porter, M., and M. R. Kramer. 2011. Creating Shared Value. (Vol. 17). Boston: FSG.
Porter, M. E., and M. R. Kramer. 2019. “Creating Shared Value.” In Managing Sustainable Business, edited by G. Lenssen and N. Smith, 323–346. Dordrecht: Springer.
Potting, J., M. P. Hekkert, E. Worrell, and A. Hanemaaijer 2017. “Circular Economy: Measuring Innovation in the Product Chain”, Planbureau voor de Leefomgeving 2544. https://dspace.library.uu.nl/handle/1874/358310
Pretner, G., N. Darnall, F. Testa, and F. Iraldo. 2021. “Are Consumers Willing to Pay for Circular Products? The Role of Recycled and Second-Hand Attributes, Messaging, and Third-Party Certification.” Resources, Conservation and Recycling 175: 105888.
Reike, D., W. J. Vermeulen, and S. Witjes. 2018. “The Circular Economy: New or Refurbished as CE 3.0?—Exploring Controversies in the Conceptualization of the Circular Economy Through a Focus on History and Resource Value Retention Options.” Resources, Conservation and Recycling 135: 246–264.
Rizos, V., A. Behrens, W. Van der Gaast, E. Hofman, A. Ioannou, T. Kafyeke, A. Flamos, R. Rinaldi, S. Papadelis, M. Hirschnitz-Garbers, and C. Topi. 2016. “Implementation of Circular Economy Business Models by Small and Medium-Sized Enterprises (SMEs): Barriers and Enablers.” Sustainability 8 (11): 1212.
Salvador, R., M. V. Barros, L. M. da Luz, C. M. Piekarski, and A. C. de Francisco. 2020. “Circular Business Models: Current Aspects that Influence Implementation and Unaddressed Subjects.” Journal of Cleaner Production 250: 119555.
Sanchez, Javier, Carla Caldeira, Valeria De Laurentiis, Serenella Sala, and Marios Avraamides. 2020. “Brief on Food Waste in the European Union.” https://joint-research-centre.ec.europa.eu/publications/brief-food-waste-european-union_en
Sauvé, S., S. Lamontagne, J. Dupras, and W. Stahel. 2021. “Circular Economy of Water: Tackling Quantity, Quality and Footprint of Water.” Environmental Development 39: 100651.
Schaffartzik, A., N. Eisenmenger, F. Krausmann, and H. Weisz. 2014. “Consumption‐Based Material Flow Accounting: Austrian Trade and Consumption in Raw Material Equivalents 1995–2007.” Journal of Industrial Ecology 18 (1): 102–112.
Schaltegger, S., E. G. Hansen, and F. Lüdeke-Freund. 2016. “Business Models for Sustainability: Origins, Present Research, and Future Avenues.” Organization & Environment 29 (1): 3–10.
Schandl, H., M. Fischer-Kowalski, , J. West, , S. Giljum, M. Dittrich, N. Eisenmenger, A. Geschke, M. Lieber, H. Wieland, A. Schaffartzik, F. Krausmann, S. Gierlinger, K. Hosking, M. Lenzen, H. Tanikawa, A. Miatto, and T. Fishman, 2018. “Global Material Flows and Resource Productivity: Forty Years of Evidence.” Journal of Industrial Ecology 22 (4): 827–838.
Schiller, G., F. Muller, and R. Ortlepp. 2017. “Mapping the anthropogenic stock in Germany: Metabolic evidence for a circular economy.” Resource, Conservation and Recycling 123: 93 –107.
Schroeder, P., K. Anggraeni, and U. Weber. 2019. “The Relevance of Circular Economy Practices to the Sustainable Development Goals.” Journal of Industrial Ecology 23 (1): 77–95.
Schweitzer, J.-P., and M. Zill 2019. “Climate Action Needs Better Products.” Euractiv https://www.euractiv.com/section/circulareconomy/opinion/climate-action-needs-better-products/
Shrouf, F., J. Ordieres, and G. Miragliotta. 2014. “Smart Factories in Industry 4.0: A Review of the Concept and of Energy Management Approaches in Production Based on the Internet of Things Paradigm.” IEEE International Conference on Industrial Engineering and Engineering Management 697-701. doi: 10.1109/IEEM.2014.705872.
Smart Prosperity Institute. 2020. “Circular Economy Global Sector Best Practices Series: Background Material for Circular Economy Sectoral Roadmaps.” https://institute.smartprosperity.ca/BestPractices
Söderholm, P. 2011. “Taxing Virgin Natural Resources: Lessons from Aggregates Taxation in Europe.” Resources, Conservation and Recycling 55 (11): 911–922.
Söderholm, P., and J. E. Tilton. 2012. “Material Efficiency: An Economic Perspective.” Resources, Conservation and Recycling 61: 75–82.
SOFIES (Solutions for Industrial Ecosystems). 2013. “Industrial Symbiosis and Eco-industrial Parks: Best Practices in the European Union.” https://ec.europa.eu/docsroom/documents/11843/attachments/9/translations/en/renditions/native
Sommer K., and D. Taglioni. 2022 (forthcoming) “Leakage in Material Intense Production and CO2 Emissions. Policy Research Working Paper.” Washington DC: World Bank
Stahel, W. R. 1986. “Product Life as a Variable: The Notion of Utilization.” Science and Public Policy 13 (4): 185–193.
Steffen, W., W. Broadgate, L. Deutsch, O. Gaffney, and C. Ludwig. 2015. “The Trajectory of the Anthropocene: The Great Acceleration.” The Anthropocene Review 2 (1): 81–98.
Steinman, Z. J. N., A. M. Schipper, M. Hauck, S. Giljum, G. Wernet, and M. A. J. Huijbregts. 2017. “Resource Footprints are Good Proxies of Environmental Damage.“ Environmental Science & Technology 2017 51 (11): 6360 –6366.
Streeck, J., D Wiedenhofer, F Krausmann, and H Haberl. 2020. “Stock-flow relations in the socio-economic metabolism of the United Kingdom 1800–2017.” Resources, Conservation and Recycling 161: 104960.
Streeck, J., Q. Dammerer, D. Wiedenhofer, and F. Krausmann. 2021. “The role of socio-economic material stocks for natural resource use in the United States of America from 1870 to 2100” Journal of Industrial Ecology 25(6): 1486-1502.
Szreda. 2020. “Input Paper: For the Interregional Workshop on How to Facilitate the Market Placement of Alternatives for Single-Use Plastics.” https://projects2014-2020.interregeurope.eu/fileadmin/user_upload/tx_tevprojects/library/file_1614693018.pdf
Talens Peiro, L., P. Nuss, F. Mathieux, and G. Blengini. 2018. “Towards Recycling Indicators based on EU flows and Raw Materials System Analysis data.” https://publications.jrc.ec.europa.eu/repository/handle/JRC112720
The European House – Ambrosetti and Enel Foundation. 2020. “Circular Europe. How to Successfully Manage the Transition from a Linear to a Circular World.” https://circulareconomy.europa.eu/platform/sites/default/files/research-study-circular-europe.pdf
Tukker, A. 2015. “Product Services for a Resource-Efficient and Circular Economy–A Review.” Journal of Cleaner Production 97: 76–91. UN (United Nations). 2021. The United Nations World Water Development Report 2021: Valuing Water. Paris: UNESCO. https://www. unwater.org/publications/un-world-water-development-report-2021/
Ünal, E., A. Urbinati, and D. Chiaroni. 2019. “Managerial Practices for Designing Circular Economy Business Models: The Case of an Italian SME in the Office Supply Industry.” Journal of Manufacturing Technology Management 30 (3): 561–589.
UNEP (United Nations Environment Programme). 2020. “Used Vehicles and the Environment: A Global Overview of Used Light Duty Vehicles - Flow, Scale and Regulation.” https://wedocs.unep.org/bitstream/handle/20.500.11822/34298/KFUVE. pdf?sequence=1&isAllowed=y
UNEP. 2021. “The Role of Business in Moving from Linear to Circular Economies.” https://wedocs.unep.org/bitstream/ handle/20.500.11822/36830/RBMLCE.pdf?sequence=3
UNFCCC (United Nations Framework Convention on Climate Change). n.d. “The Paris Agreement” (accessed March 2022). https:// unfccc.int/process-and-meetings/the-paris-agreement/the-paris-agreement
UNIDO (United Nations Industrial Development Organization), WBG (World Bank Group), and GIZ (Deutsche Gesellschaft für Internationale Zusammenarbeit). 2021. An International Framework for Eco-Industrial Parks, Version 2.0 Washington, DC: World Bank; Vienna: United Nations Industrial Development Organization; Bonn: Deutsche Gesellschaft für Internationale Zusammenarbeit.
United Nations University. 2015. “Discarded Electronics Mismanaged within Europe Equals ~10 Times the Volume of E-waste Exported.” https://unu.edu/media-relations/releases/discarded-electronics-mismanaged-in-europe-is-10x-volume-of-e-waste-exports. html
Valero A. and A. Valero. 2015. “Thanatia: Earth’s Mineral Resources Destiny. The Need for Efficiency and Sufficiency” at The Aurelio Peccei Lectures & Dialogues Club of Rome, European Chapter. https://www.researchgate.net/publication/281405062_ Thanatia_Earth’s_Mineral_Resources_DestinyThe_need_for_efficiency_and_sufficiency_May_19_2015
Van der Voet, E., L. van Oers, and I. Nikolic. 2004. “Dematerialization: Not Just a Matter of Weight.” Journal of Industrial Ecology 8 (4): 121–137.
Van Ewijk, S., J. A. Stegemann, and P. Ekins. 2017. “Global Life Cycle Paper Flows, Recycling Metrics, and Material Efficiency.” Journal of Industrial Ecology 22 (4): 686–693.
Van Vuuren, D .P., B. J. Strengers, and H. J. De Vries. 1999. “Long-Term Perspectives on World Metal Use—A System-Dynamics Model.” Resources Policy 25 (4): 239–255.
Versnellingshuis Nederland Circular. n.d. “Circular Entrepreneurship: We Help Entrepreneurs Further” (accessed March 2022), https:// versnellingshuisce.nl/#
Water Footprint Network. n.d. “What is a Water Footprint?” (accessed March 2022), https://waterfootprint.org/en/water-footprint/whatis-water-footprint/
WEKA Industrie Medien GmbH. 2021. “Recycling: Poland Is Slowly Catching Up.” https://waste-management-world.com/artikel/ recycling-poland-is-slowly-catching-up/ Wiedmann, T. O., H. Schandl, M. Lenzen, D. Moran, S. Suh, J. West, and K. Kanemoto. 2015. “The Material Footprint of Nations.” Proceedings of the National Academy of Sciences 112 (20): 6271–6276.
Wilson, S. 2016. “Let’s Design Out Waste for a Real Circular Economy.” Euractiv. https://www.euractiv.com/section/sustainable-dev/ opinion/lets-design-out-waste-for-a-real-circular-economy/ Winning, M., A. Calzadilla, R. Bleischwitz, and V. Nechifor. 2017. “Towards a Circular Economy: Insights Based on the Development of the Global ENGAGE-Materials Model and Evidence for the Iron and Steel Industry.” International Economics and Economic
Policy 14 (3): 383–407.
World Bank. 2017. The Growing Role of Minerals and Metals for a Low Carbon Future. Washington, DC: World Bank.
World Bank. 2018. What a Waste 2.0 : A Global Snapshot of Solid Waste Management to 2050. Overview Booklet. Washington, DC: World Bank.
World Bank. 2020a. World Development Indicators 2020. Indicator: CO2 Emissions (tons per capita). Washington, DC: World Bank. World Bank. 2020b. World Development Report 2020: Trading for Development in the Age of Global Value Chains. Washington, DC: World Bank.
World Bank. 2021a. Circular Economy in Industrial Parks: Technologies for Competitiveness. https://openknowledge.worldbank.org/ handle/10986/35419
World Bank. 2021b. Water in Circular Economy and Resilience (WICER).” https://www.worldbank.org/en/topic/water/publication/wicer World Bank. 2021c. EU Regular Economic Report - Green Fiscal Reforms. Washington, DC: World Bank.
World Economic Forum. 2018. Readiness for the Future of Production, Report 2018 https://www3.weforum.org/docs/FOP_Readiness_ Report_2018.pdf
World Economic Forum. 2020a. Raising Ambitions: A New Roadmap for the Automotive Circular Economy https://www3.weforum.org/ docs/WEF_Raising_Ambitions_2020.pdf
World Economic Forum. 2020b. Forging Ahead: A Materials Roadmap for the Zero-Carbon Car https://www3.weforum.org/docs/WEF_ Forging_Ahead_2020.pdf
WRI (World Resources Institute), Veldhoven S, and Schmidt C. 2021. How the Circular Economy Can Help Nations Achieve Their Climate Goals. https://www.wri.org/insights/how-circular-economy-can-help-nations-achieve-their-climategoals#:~:text=Currently%2C%20the%20global%20economy%20is,2032%2C%20compared%20to%20current%20levels
WRI Indonesia. 2018. “3 Steps for Tackling Food Loss and Waste” https://wri-indonesia.org/en/blog/3-steps-tackling-food-loss-andwaste
WWAP (World Water Assessment Programme). 2012. The United Nations World Water Development Report 4: Managing Water under Uncertainty and Risk. Paris: UNESCO.
Zhu. J., C. Fan, H. Shi, and L. Shi. 2019. “Efforts for a Circular Economy in China: A Comprehensive Review of Policies.” Journal of Industrial Ecology 23 (1): 110–118
Zhu, Y., M. Ghosh, D. Luo, N. Macaluso, and J. Rattray. 2018. “Revenue Recycling and Cost Effective GHG Abatement: An Exploratory Analysis Using a Global Multi-Sector Multi-Region CGE Model.” Climate Change Economics 9 (1): 1840009.

Non-metallic minerals mining oxt Other extraction 2 mio Mining of iron ores 3 mao Mining of aluminum ores 4 mco Mining of copper ores 5 moo Mining of other ores 6 rbr Rubber products rpp Rubber and plastic products 7 plp Plastic products - primary 8 pls Plastic products - secondary 9 plr Recycling - plastics 10 isp Iron and steel - primary i_s Ferrous metals 11 iss Iron and steel - secondary 12 ris Recycling - iron and steel 13 isc Iron and steel casting 14 app Aluminum - primary nfm Non-ferrous metals 15 aps Aluminum - secondary 16 ral Recycling - aluminum 17 cpp Copper - primary 18 cps Copper - secondary 19 rcp Recycling - copper 20 mpp Other metals - primary 21 mps Other metals - secondary 22 rom Recycling - other metals 23 nfc Non-ferrous metals casting
No. Countries/regions represented in this study Disaggregated GTAP countries/regions
1 United States (USA) United States of America (USA)
2 China (CHN) China (CHN)
3 Russian Federation (RUS) Russian Federation (RUS)
4 Poland (POL) Poland (POL)
5 Romania (ROU) Romania (ROU)
6 Bulgaria (BGR) Bulgaria (BGR)
7 Croatia (HRV) Croatia (HRV)
8 Türkiye (TUR) Türkiye (TUR)
9 EU-16+EFTA+Great Britain (X16) Austria (AUT), Belgium (BEL), Cyprus (CYP), Denmark (DNK), Finland (FIN), France (FRA), Germany (DEU), Greece (GRC), Ireland (IRL), Italy (ITA), Luxembourg (LUX), Malta (MLT), Netherlands (NLD), Portugal (PRT), Spain (ESP), Sweden (SWE), United Kingdom (GBR), Switzerland (CHE), Norway (NOR), Rest of EFTA (XEF)
10 Rest of EU transition economies (EU7) Czech Republic (CZE), Estonia (EST), Hungary (HUN), Latvia (LVA), Lithuania (LTU), Slovakia (SVK), Slovenia (SVN)
11 Other OECD (XOE) Australia (AUS), New Zealand (NZL), Canada (CAN), Israel (ISR), Rest of the World (XTW)
12 Europe and Central Asia (ECA) without Russia (ECA) Albania (ALB), Belarus (BLR), Ukraine (UKR), Rest of Eastern Europe (XEE), Rest of Europe (XER), Kazakhstan (KAZ), Kyrgyz Republic (KGZ), Tajikistan (TJK), Rest of Former Soviet Union (XSU), Armenia (ARM), Azerbaijan (AZE), Georgia (GEO)
13 High income Asia (HYA) Hong Kong SAR, China (HKG); Japan (JPN); Republic of Korea (KOR); Taiwan, China (TWN); Singapore (SGP)
14 Low-income Asia and the Americas (LAP) Rest of Oceania (XOC), Cambodia (KHM), Lao PDR (LAO), Rest of Southeast Asia (XSE), Bangladesh (BGD), Nepal (NPL), Rest of South Asia (XSA), Rest of South America (XSM), Dominican Republic (DOM), Jamaica (JAM), Puerto Rico (PRI), Trinidad and Tobago (TTO), Rest of Caribbean (XCB)
15 Rest of East Asia and Pacific (XEA) Mongolia (MNG), Rest of East Asia (XEA), Brunei Darussalam (BRN), Indonesia (IDN), Malaysia (MYS), Philippines (PHL), Thailand (THA), Vietnam (VNM)
16 Rest of South Asia (XSA) India (IND), Pakistan (PAK), Sri Lanka (LKA)
17 Middle East and North Africa (MNA) Bahrain (BHR), Iran (IRN), Jordan (JOR), Kuwait (KWT), Oman (OMN), Qatar (QAT), Saudi Arabia (SAU), United Arab Emirates (ARE), Rest of Western Asia (XWS), Egypt (EGY), Morocco (MAR), Tunisia (TUN), Rest of North Africa (XNF)
18 Rest of Latin America and Caribbean (XLC) Mexico (MEX), Rest of North America (XNA), Argentina (ARG), Bolivia (BOL), Brazil (BRA), Chile (CHL), Colombia (COL), Ecuador (ECU), Paraguay (PRY), Peru (PER), Uruguay (URY), Venezuela (VEN), Costa Rica (CRI), Guatemala (GTM), Honduras (HND), Nicaragua (NIC), Panama (PAN), El Salvador (SLV), Rest of Central America (XCA)
No. Countries/regions represented in this study Disaggregated GTAP countries/regions 19 Low-income Sub-Saharan Africa (LAF) Benin (BEN), Burkina Faso (BFA), Guinea (GIN), Senegal (SEN), Togo (TGO), Rest of Western Africa (XWF), Central Africa (XCF), South-Central Africa (XAC), Ethiopia (ETH), Madagascar (MDG), Malawi (MWI), Mauritius (MUS), Mozambique (MOZ), Rwanda (RWA), Tanzania (TZA), Uganda (UGA), Zambia (ZMB), Rest of Eastern Africa (XEC), Rest of South African Customs Union (XSC) 20 Rest of Sub-Saharan Africa (XAF) Cameroon (CMR), Côte d’Ivoire (CIV), Ghana (GHA), Nigeria (NGA), Kenya (KEN), Zimbabwe (ZWE), Botswana (BWA), Namibia (NAM), South Africa (ZAF)
No.
1 Agriculture (AGR)
Paddy rice (PDR), Wheat (WHT), Cereal grains nec (GRO), Vegetables, fruit, nuts (V_F), Oil seeds (OSD), Sugarcane, sugar beet (C_B), Plant-based fibers (PFB), Crops nec (OCR), Bovine cattle, sheep and goats, horses (CTL), Animal products nec (OAP), Raw milk (RMK), Wool, silkworm cocoons (WOL), Forestry (FRS), Fishing (FSH), Processed rice (PCR), Sugar (SGR)
of metal ores (MMO)
of iron ores (MOI), Mining of aluminum (bauxite) ores (MAO), Mining of copper ores (MCO), Mining of other metal ores (MOO)
(GAS)
(GAS), Gas manufacture, distribution (GDT)
food (PFD) Bovine meat products (CMT), Meat products nec (OMT), Vegetable oils and fats (VOL), Dairy products (MIL), Food products nec (OFD), Beverages and tobacco products (B_T)
No. Activities represented in this study Disaggregated GTAP-CE activities 24 Other metals - primary (MPP) Other metals - primary (MPP) 25 Other metals - secondary (MPS) Other metals - secondary (MPS) 26 Recycling other metals (ROM) Recycling other metals (ROM) 27 Metals casting (MEC) Metals casting (MEC) 28 Other manufacturing (XMF) Textiles (TEX), Wearing apparel (WAP), Leather products (LEA), Wood products (LUM), Metal products (FMP), Computer, electronic and optical products (ELE), Electrical equipment (EEQ), Machinery and equipment nec (OME), Motor vehicles and parts (MVH), Transport equipment nec (OTN), Manufactures nec (OMF) 29 Electricity transmission and distribution (ETD) Electricity transmission and distribution (TnD) 30 Nuclear power (NUC) Nuclear power (NuclearBL) 31 Coal power (CLP) Coal power baseload (CoalBL) 32 Gas and oil power (GOP) Gas power baseload (GasBL), Gas power peakload (GasP), Oil power baseload (OilBL), Oil power peakload (OilP) 33 Wind power (WND) Wind power (WindBL) 34 Hydro power (HYD) Hydro power baseload (HydroBL), Hydro power peakload (HydroP) 35 Other power (XEL) Other baseload (OtherBL) 36 Solar power (SOL) Solar power (SolarP) 37 Construction (CNS) Construction (CNS) 38 Trade including warehousing (TRD) Trade (TRD), Accommodation, Food and service activities (AFS), Warehousing and support activities (WHS) 39 Other transport (XTP) Transport nec (OTP) 40 Water transport (WTP) Water transport (WTP) 41 Air transport (ATP) Air transport (ATP) 42 Other services (XSV) Water (WTR), Communication (CMN), Financial services nec (OFI), Insurance (formerly isr) (INS), Real estate activities (RSA), Business services nec (OBS), Recreational and other services (ROS), Public Administration and defense (OSG), Education (EDU), Human health and social work activities (HHT), Dwellings (DWE)
The transition to a CE requires a system-wide effort affecting all economics sectors. Part of the complexity involved has to do with prioritization. This annex focuses on six sectors central to the European circularity agenda. It makes the case for the criticality of these sectors, including their relevance for the climate and broader sustainability implications while at the same time highlighting sector-specific challenges and solutions, some of which have a bearing beyond specific sectors themselves. The sectors selected include plastics, critical raw materials (CRMs), water, transport, construction, and agriculture.
Plastics are under increasing scrutiny due to their growing presence in marine and terrestrial environments. The plastics value sector is a prominent contributor to the EU economy: with a turnover of €350 billion in 2019, it supports over 1.56 million jobs across 55,000 companies. Total EU consumption amounted to almost 51 million tons in 2019, with key sectors of demand including packaging (40 percent), buildings and construction (20 percent), and automotive (9.6 percent). The sector faces growing environmental concerns, not only due to its continuing dependence on oil and gas extraction and transformation as well as their associated GHG emissions but also because of the increasing presence of (micro) plastics parts in marine and terrestrial environments—plastics today account for approximately 80–85 percent of marine litter in the EU.125
Plastics recycling remains generally low across the EU, causing significant economic and environmental damage. Only about onethird of the 29.1 million tons of plastics collected across the EU in 2018 was recycled (both within and outside the EU). A large part of plastics waste continues to be burnt for energy recovery (42.6 percent), while about one-quarter of waste is
125
126
landfilled—the most unsustainable form of waste management. However, the situation differs significantly across MSs with recycling rates as low as 21 percent in countries such as Bulgaria and Finland (see Figure A3.1). Low recycling rates cause significant losses for the economy and the environment. For example, it is estimated that 95 percent of the value of plastic packaging material is lost to the economy after a short first-use cycle. And recycling plastics can reduce GHG emissions by 76–93 percent (depending on the plastic resin type) compared to the production of the same quantity from fossil feedstock.126
Economic considerations and technological limitations constitute key barriers to more circularity in the plastics sector, but consumers are increasingly demanding more sustainable products. Recycled feedstock is often not economically competitive with virgin feedstocks at the local level. For example, stakeholders in Romania indicated that the cost for recycled material locally was 30 percent higher than virgin material. This is thought to be because local markets are typically unable to satisfy the demand of local manufacturers due to limited availability and quality of feedstock. In addition, price volatility for recycled raw materials is an issue, often due to local supply issues, costs for reprocessing materials, and international market developments. On the technical side, key barriers are the difficulties (and costs) associated with separating mixed and often contaminated plastics into polymer-specific fractions ready for recycling. This problem is worsened by products made of composite materials. On a positive note, consumer awareness of packaging waste leakage is increasing, leading to growing demand for improved use and collection and management of plastics waste.
While national governments tend to focus on the downstream of the plastics value chain, circularity is often determined at the upstream stage. In each of the four MSs considered in this study, stakeholders have identified that the upstream sector is a weak point in the plastics
France Italy Portugal Spain Lithuania Ireland
Luxembourg Sweden Finland Belgium Denmark Norway Estonia
Switzerland Austria Netherlands
Czech Republic Poland Slovakia Hungary Romania Latvia Croatia Bulgaria Cyprus Greece Malta United kingdom Slovenia Germany 80 90 100
0 10 20 30 40 50 60 70 Landfill
Energy Recovery Recycling
Source: Plastics Europe 2021.
value chain. Across MSs, the primary focus on ensuring high rates of plastic waste collection has been accompanied by a narrow preference for landfilling or, at most, incinerating materials. This has disregarded the significant potential to increase the capture and availability of clean recycled material for local industry at the downstream end. At the same time, the circularity potential of the plastic value chain is mainly determined upstream. Unless product designers choose properties and materials to align them with downstream recycling capabilities, capturing materials for recirculation will be less cost-effective if not outright impossible.
Among upstream elements of the value chain, particular attention is required around
127 Deloitte 2017.
innovations in materials, feedstocks, and product design. The high diversity of postconsumer plastic types can pose challenges to conventional plastic recycling. Other issues include ‘small format’ processing (for example, tear-off lids), composite packaging (for example, sandwich box windows), and infrequently used resins which can be difficult to sort and subsequently contaminate more common recyclates. Different grades of the same plastic within a product can also negatively affect the quality of the output.127 At the same time, the use of more sustainable (biobased) plastics and products is still limited, with advancement of this technology in its infancy. With regard to product design, the focus is generally on the use phase of products, with widespread disregard of their
recyclability at the end of their useful life. More work is, therefore, needed to ensure that products offer better options for future circularity. This requires addressing—already at the design stage— concerns about additives (for example, colors, plasticizers, flame retardants) and thermoplastics that complicate recycling.
Business innovation is required to identify, pilot, and roll out upstream solutions for the plastics value chain—financial incentives are critical at the outset of the transition. In addition to regulation and fiscal tools, financial subsidies are a key incentivizing factor for the expansion of CE and eco-innovation in business. Currently, businesses appear to have little, if any, financial incentive to facilitate innovation. Funding through countries’ own mechanisms or EU sources for new technologies is lacking in all the four MSs considered. Furthermore, funds for innovation in the design and manufacture of plastic products, or the collection and separation of plastics, are limited. Where funding is available, such as Romania, awareness and the release of capital to industry is limited. This lack of finance limits the ability of the value chain to invest in innovative approaches and new technologies.
CRMs are characterized by crucial economic importance and elevated supply risks. Another distinguishing characteristic is that they are indispensable to both the dual green and digital transitions. The EU’s ‘digital sovereignty’ and the intention to confront semiconductor shortages and strengthen Europe’s technological leadership in chip making rely on security of CRM supply, together with the resilience and competitiveness of the EU economy. The range of CRMs identified by the EU has more than doubled over the last decade—from 14 in 2011 to 30 in 2020. Economic importance is a function of a material’s role in end-use applications and the value added of manufacturing sectors, while the supply risk is derived from the concentration of supplies in producing countries and substitution and recycling rates. One of the most prominent examples of CRMs is rare earth elements used in numerous low-carbon technologies. They bear the highest supply risk of all CRMs because 98 percent of EU demand is sourced from China and recycling input rates are as low as 3–8 percent.128
128 EC, n.d.-a, 2020a.
Given that CRMs are essential for low-carbon technologies such as solar panels, wind turbines, and EVs, their demand is expected to increase significantly in the context of the energy transition. The expected demand for metals required to produce electric storage batteries—aluminum, cobalt, iron, lead, lithium, manganese, and nickel—is projected to rise by more than 1000 percent under a 2°C scenario. Meeting the Paris Agreement objective would see global demand for minerals quadruple between 2020 and 2040. Projected demand growth is highest for lithium (over 40 times), followed by graphite, cobalt, and nickel (19–25 times). Estimates show that the EU would need 60 times more lithium and 15 times more cobalt for vehicle batteries and energy storage by 2050 and 10 times more rare earths in permanent magnets.129
Increased recycling rates can help address supply security concerns associated with such high levels of projected demand. Efforts to increase the circularity of metals and minerals could reduce demand for primary materials as well as the EU’s dependence on imported materials. Indeed, metals are ideal candidates for a CE as they are in theory eternally recyclable. But recycling is only economic viable for CRMs that have reached a critical mass, such as tungsten and cobalt. The EU is targeting battery minerals through a new Batteries Regulation130 as there is sufficient potential for increased recycling rates. However, more recycling does not necessarily imply that these materials will become less critical, as the continuing surge in demand will maintain pressures on the reliability of supplies.
The sheer scale of demand calls for additional efforts in CRM’s circularity, which remains limited by economic barriers. An assessment of the ‘recyclability’ of some critical minerals in the EU economy shows that the maximum contribution from recycled scrap to EU demand is 49 percent of the material input of tungsten and 8.4 percent of indium. This means that even in a maximum recycling scenario, there is still a need of primary input for roughly 50 percent of tungsten and 90 percent of indium production. Similarly, even a 95
129 EC 2020a; IEA 2021; World Bank 2017.
130 EC 2020b.
131 EC et al. 2018; Talens Peiro 2018.
132 Smart Prosperity Institute 2020.
percent recovery rate of cobalt from batteries in 2030 would only cover 20.4 percent of demand in 2035. The flows of metals contained in end-oflife products correspond to a past demand (years ago) that is not able to satisfy the future demand. In addition, some ‘minor’ metals—such as tantalum, niobium, and rare earths—are used in such small quantities that their recycling is uneconomic. A case in point is niobium: it is used in as low concentrations as 0.1 percent in microalloyed steels whereas it is found at 1 percent grade in Araxá (Brazil), the largest niobium deposit in the world. Policies to improve the recyclability of minor metals, such as improved eco-design, will need to be considered to have an impact.131
For circularity to help address the CRM demand, circular policies need to go beyond recycling. These include, but are not limited to, reducing consumption (through eco-design, process optimization, responsible consumption and procurement), intensifying product use (sharing economy, short-term renting), extending life of products and components (maintenance and repair, donating and reselling, refurbishing, performance economy), and giving resources new life (industrial ecology, recycling and composting, energy recovery).132 In addition, in the face of increasing demand for CRMs, more emphasis needs to be placed on reducing the carbon intensity, particularly in the extraction and refining stages. For example, producing cobalt sulfate requires twice as much energy as producing nickel sulfate, which would plead in favor of shifting toward more nickelrich chemistries. A ‘green differentiation’ at the extraction and refining of raw materials would provide the basis for selecting producing countries, companies, or processes that have the lowest carbon footprint.
A3.3 Water Efficiency: Striking the Right Balance between Sustainability and Affordability
Over 100 million Europeans are already affected by water scarcity and their number will increase as climate change further
exacerbates preexisting water stresses. Water is circular by nature, but Europe’s water resources have been under increasing stress over the past 50 years, mainly due to climate change and increasing demand. In general, freshwater is abundantly available in Europe, but it is unevenly distributed. About one-third of the EU territory is exposed to permanent or temporary water stress conditions, with major hotspots in intensively irrigated agricultural areas, southern European islands with large tourism sectors, and large urban areas. But even northern central European countries such as Finland (decrease in snow cover) and Germany (changes in precipitation patterns) are
experiencing water scarcity. As defined by the UN, a country experiences water stress when its annual water supplies drop below 1,700 m3 per capita. In the EU, this is the case in Malta, Cyprus, the Czech Republic, and Poland, with Romania just above this threshold.133
A circular water economy increases resilience to water stress, reduces waste and pollution, and preserves natural ecosystems. Circularity in the water sector means saving water where possible and ensuring that water and other natural resources can be reused. The Water in Circular Economy and Resilience (WICER) Framework (see
Figure A3.3) describes the key actions needed to achieve three main outcomes: (1) deliver resilient and inclusive services, (2) design out waste and pollution, and (3) preserve and regenerate natural systems. 134
Low water tariffs prevent the transition to a circular water economy. In Europe, as elsewhere, water consumption is driven by its cost rather than availability. As a result, countries with scarce water resources but low tariffs such as Greece, Italy, and Spain have some of the highest rates of water abstraction in the EU. As with other commodities, water prices do not reflect scarcity nor full economic costs. More than for other commodities, political economy considerations play a key role in setting pricing. Although cost recovery, including environmental and resource costs, is a key principle of the EU Water Framework Directive, it is rarely fully applied across MSs. The resulting undervaluation of water is partly due to the complexity of estimating environmental and resource costs but partly also due to social and competitiveness issues related to the affordability of water in the face of rising prices. In addition to the inefficient and unsustainable use of water and the degradation of water supplies, the lack of true pricing constitutes a major barrier to a more circular water economy.135
EU MSs need to strike the right balance between higher water tariffs necessary to increase the sustainable use of water and social tariffs required to grant affordable access to water services. The WFD’s requirement to internalize environmental and resource costs in water pricing requires the implementation of water charges (both for abstraction and pollution) that would automatically induce an increase of water tariffs. On the other hand, in response to growing affordability issues and as water is considered as a primary good (essential for life), there is an increasing application of social water tariff subsidies across MSs aimed at securing access to water services (water and sanitation) also for the poor. However, current tariff structures reduce incentives for water savings. To ensure the long-term sustainability of water resources, MSs thus face the challenge of reflecting true pricing within tariffs
134 World Bank 2021b.
135 Directive 2000/60/EC; UN 2021.
136 Water Footprint Network n.d.
137 Sauvé et al. 2021.
while maintaining access to the most vulnerable in a context of climate change, which is exacerbating the issue of water stress.
Water subsidy schemes can make good business sense as water tariffs increase. It is remarkable that in many EU countries, water companies have introduced social water subsidies on a purely voluntary basis. This demonstrates that well-designed water subsidy schemes for the poor make good business sense for commercially run utilities. The provision of social water subsidies helps in reducing the rate of uncollected bills as well as the administrative cost of managing unpaid debt. It is becoming a key feature for making water tariffs increases both financially and socially viable.
Better data are needed to align water use with its actual availability. The reporting and monitoring frameworks supported by EU water legislation allow for a solid information base regarding water supply in terms of availability and quality. However, much less information is available regarding the amount of water embodied in agricultural and manufactured products. The water footprint of goods and services, also known as ‘virtual water’, is the amount of water consumed or polluted for their production: this can be large, including in imported goods—producing 1 kg of beef requires on (global) average around 15 tons of water. In addition to consumption, water footprint can be applied to water quality, to assess the level of water pollution caused in the production of goods and services.136
Adequate water footprint metrics can guide the identification of efficient and sustainable water production and consumption systems. In the water sector as well, progress toward circularity requires better data. Water footprint knowledge based on standardized methodologies across the EU and applied to a wider range of products can enable policy to better target CE interventions at those products and value chains with the largest impact on water resources.137
The transport sector is an important driver of material consumption and land use. The material demand of the transport sector is mainly driven by passenger cars and road infrastructure. Some 300 million tons of steel, aluminum, and plastics are currently embodied in passenger cars registered in the EU. Car production actually requires even more materials, as up to 40 percent of metals get lost as scrap on the factory floor. The EU-27’s road network of around 4.5 million km contains roughly 85 billion tons of asphalt, bitumen, steel, and cement. Transport infrastructure uses a major portion of urban land (up to 60 percent in commercial centers) and increasingly extends outside of cities as urban sprawl accelerates even in regions with decreasing populations.138
Cars are among the most underutilized assets. Cars sit idle about 90 percent of the time, making them among the most underutilized assets owned by households and commerce. Light commercial vehicles, primarily used for last mile deliveries, run empty for 40–60 percent of the time, while they operate with 50–60 percent capacity utilization rates (weight based) on laden trips.139 Achieving efficiencies can therefore have vast economic benefits. Innovations in urban and freight transport—car sharing, carpooling, and efficient logistics systems such as those piloted by cities like Paris—are examples of circularity-oriented solutions which rely on both carrots (subsidies) and sticks (taxation, such as road taxes or VAT rates for new cars) to drive change in the behavior of consumers and economic actors.
Recycling of vehicles and infrastructure often results in downcycling in terms of quality and value. For ELVs, the primary focus of recycling is on avoiding hazardous substances and recovering spare parts, while material recovery is less of a concern. Although EU legislation requires most materials to be recycled, current processes results in significant degradation of quality and loss of materials value. As a result, the scrapping value of an ELV is close to zero, even though its raw
138 Kodukula 2018; Material Economics 2018.
139 IEA 2017.
140 Material Economics 2018.
141 World Economic Forum 2020a, 2020b.
ICEV
Source: ICCT 2021. Note: Life-cycle GHG emissions of average medium-size gasoline internal combustion engine and BEVs registered in Europe in 2021 and projected to be registered in 2030.
materials on input have a value of €2,000-3,000.140
Reducing material use can be cost-effective in decarbonizing the sector. Combined with electrification, circularity strategies can potentially reduce carbon emissions by up to 75 percent while reducing resource consumption by up to 80 percent per kilometer by 2030. The policy mix would include the decarbonization of vehicles life cycle, resource recovery and closed material loops, lifetime optimization, and higher efficiency of vehicle use both in terms of time and occupancy. Increasing the material efficiency of EVs can be cost-effective. For example, around 59 percent of emissions from material production for battery-electric vehicles (BEVs) could be abated in 2030 with long-term cost savings.141
EV batteries
The EU’s Sustainable and Smart Mobility Strategy aims to reach at least 30 million zero-emission cars on European roads by 2030 (and all cars by 2050), most of which will be electric. EV batteries will drive demand for CRMs, raising questions on how to ensure resilience to
encapsulate a range of existing tensions between electrification and material management objectives.
their elevated supply risks (see above section on CRMs). High rates of battery penetration also raise questions as to their afterlife once wear and tear coupled with innovation in higher performing batteries makes them obsolete for use in cars. While a ‘second life’ in stationary applications may be possible, batteries will inevitably require retirement at the end of their life. In the EU, more than 80 percent of standard lead-acid batteries are recycled, but lithium-ion or nickel-cadmium batteries typically equipping EVs do not yet rely on any sustainable and industrial recycling solutions. The proposed Battery Regulation’s objectives of full collection of automotive batteries and their recycling and high level of recovery will require adequate policy incentives. Without these incentives, further investments in research innovation may not come fast enough to avoid the first waves of EV batteries to be scrapped, together with the valuable materials they contain.142
The rate of fleet renewal induced by the required EV’s penetration will bring climate dividends—but also entails material risks Switching to EVs can significantly reduce lifecycle GHG emissions of cars. Figure A3.4 shows that lifetime emissions of BEVs in Europe may already be more than two-thirds lower than those of comparable gasoline cars. As the electricity mix continues to decarbonize, this gap is expected to widen until 2030. But the accelerating uptake of EVs will reduce the average age and lifetime of Europe’s current car fleet (currently at 11.5 years)— reinforcing linear buy-own-scrap processes, at least in the short term. For this to not become a norm as EV innovation drives ever faster rates of fleet renewal, reducing the resource footprint of the next generation’s fleets through upstream and downstream interventions is critical.143
Secondhand car markets bring resource efficiencies through lifetime extension but also lock in pollution and its externalities for longer, including in import markets. The EU is the world’s largest exporter of used vehicles. Major destinations for used vehicles from the EU are West/ North Africa, Eastern Europe, the Caucasus, and Central Asia. As environmental regulations (fuel
efficiency, vehicle emissions) tighten in Europe, more cars are retired or pushed out of the market before the end of their economic life-span, leading to an increase in the supply of ELVs. Extending the lifetime by exporting old cars meets resource efficiency objectives but also dumps the pollution and safety risks associated with old cars on less wealthy markets.144
The circularity of the transport sector will be determined not only by the sustainability of cars and related recycling systems but also by the transport infrastructure and urban planning. Existing urban and inter‐urban transport solutions help curb the transport sector’s carbon and resource footprint by reducing the number of private vehicles on the road as well as the volume of land dedicated to roads and parking. Upscaling already existing best practices will facilitate the transition to a CE, for example, by providing highquality and high-frequency public transport, expanding high-quality cycling and walking infrastructure, and improving urban design in view of more compact cities built for people, not for cars.
High levels of resource use and waste generation make construction materials a priority for the transition to a CE. The construction sector is a major driver of material consumption and waste generation in the EU. The sector contributes about 9 percent to EU GDP but accounts for about half of all extracted materials. Sand and gravel alone—intensively used in construction, among other items, for making cement—made up more than one-third of EU DMC in 2019. At the same time, CDW is the largest waste stream, with a share of 36 percent of total EU waste generated in 2018. CDW represents an extensive reservoir of secondary materials, including concrete, bricks, wood, glass, metals, and plastic, which have the potential to be used over several life cycles and partially replace new products and materials.145
142 EC 2020b, 2020c, 2021a; Eurostat 2018a; European Parliament 2019
143 ICCT 2021.
144 UNEP 2020.
145 EC, n.d.-c; Eurostat 2018a, 2022b.
Through the large share of material stocks in use in the sector, construction drives current and future material flows. As seen in Chapter 2, material stocks remain in service for a long time, locking in opportunities and constraints to material efficiency. While building new stocks requires material flows, so does their maintenance, operation, and functioning. In-use material stocks need more attention and should not be overlooked in shaping a CE policy. Better managing in-use stock materials may help reduce the growing demand for new stock-building materials as well as waste generation simultaneously, thus also contributing to addressing existing issues in the waste management sector, for example, renovating existing buildings rather than demolishing and building new ones.146
The full potential of the CE in the construction sector can only be realized by extending the focus beyond waste to cover all phases of the construction life cycle. Even though the vast majority of EU CDW (88 percent) has been recovered in 2018, most of the recovered 146 Eurostat 2021c. 147 EEA 2020a; Eurostat 2022c.
waste has been used for low-value backfilling (for example, to fill holes on construction sites) and other low-grade recovery applications (for example, in road construction). This erodes the value the materials had in CDW. The main reason is that past construction practices make it difficult to generate high-purity materials during demolition. Increasing the circularity of the construction sector thus requires action beyond waste management to cover all phases of the life cycle (Table A3.1).147
The future circularity of buildings is determined by the way they are built today; buildings and their components need to be designed in such a way that they can be easily deconstructed, reused, and recycled. While much policy emphasis has been placed on CDW management, there is much less attention on reversible buildings, that is, buildings that can easily be deconstructed or allow for individual components to be replaced. Numerous barriers need to be addressed, including high investment costs, difficulty in finding easily disassembled building products on the market, difficulty in obtaining legal authorization for the
Source: Lanau and Liu 2020.
Note: Data unit is 1,000 tons per cell, where one cell measures 100 m × 100 m.
construction of reversible buildings, and involvement of a large number of operators during construction which can reduce ambitions. Economic incentives play a key role in the development and application of reversible building technologies but need to be complemented with awareness raising about the economic and environmental benefits of product lifetime extension and sustainable endof-life management. In addition, collaborative, multi-stakeholder processes (involving designers, constructors, producers, and demolishers) help create transparency about buildings and their components, which facilitates reuse and recycling.
Detailed knowledge about the type, amount, and distribution of secondary materials stocked in the built environment is essential for circular strategies and activities in the
construction industry. Existing knowledge about secondary materials stocked in buildings and infrastructure is still scarce, fragmented, and aggregated. High resolution ‘urban resource cadasters’ generated from building stock modeling can help inform stakeholders along the construction value chain to improve planning for materials and component recovery and smart waste management. Similar information on secondary materials is needed for individual buildings. Material passports, for example, provide specifications of raw materials and components used in a building as well as their potential future use. Upscaling these kinds of information systems will require standardization of terminology and methodology and, more generally, a harmonization of tools and systems.
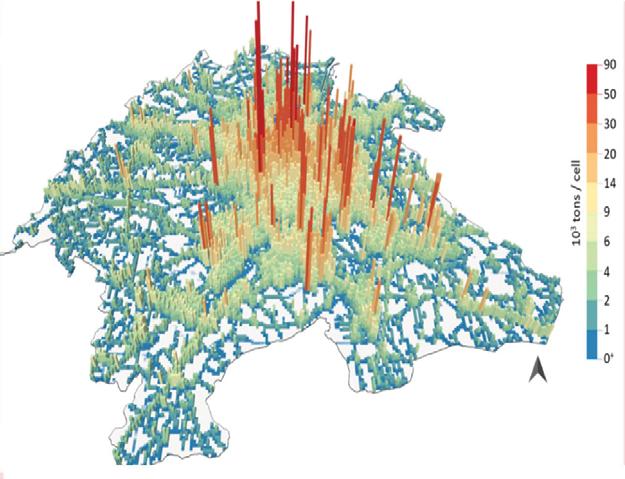
Innovation requires local and national institutions formation and transparency to create a trust-based secondary material market. Since the construction sector largely operates within local value chains, institutions fostering local stakeholder networking are critical to enhance material flow and waste management across sectors and value chains. But without common definitions, criteria, and metrics for ‘endof-waste’ CDW, economic actors will not be able to certify the quality of recycled and reused materials. The current levels of distrust in the quality of secondary materials will continue to prevent the capturing of their value through recycling and reuse applications. Similarly, a piecemeal approach by MSs regarding the definition of end-of-waste criteria, traceability guidelines, pre-demolition audits, and material passports will create barriers to scale and efficiency.
European agriculture is a major driver of climate change and environmental
degradation. Around 20 percent of the total food produced in the EU is lost or wasted along the entire food value chain. This amounts to significant economic losses, considering the natural resources utilized for food production and the environmental externalities generated. Also, biodegradable municipal waste—of which 60 percent is food waste—is still largely destined for landfill or incineration in the EU, with particularly low collection rates in Romania, Croatia, and Bulgaria. A circular food economy builds on biocycles to use minimal external inputs, closing nutrient loops, reducing waste and emissions, and valorizing agri-food waste. The waste hierarchy adapted to food waste offers a range of circular agri-food system strategies preferable to waste disposal (Figure A3.6).148
The CE can be an important driver of growth of sustainable agri-food systems in Europe, but an integrated policy framework with clear objectives is needed to accelerate it. Reducing waste, increasing productivity, and optimizing material use is not only a good proposition for improving resource efficiency but is also economically prudent. To improve the sustainability of the agri-food system, all integrated elements of it
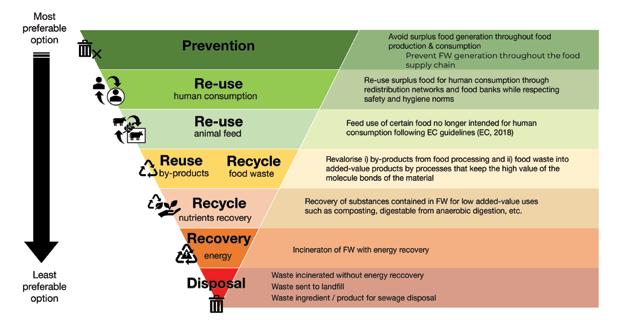
need to be considered to ensure the right incentives are put in place. An integrated policy framework with clear objectives is required, taking into account the complexity of the agri-food sector—the diversity of production environments, products, producers, processing options, length and types of value chains, and the different actors and functions within them. The CAP can play a major role in providing such a framework.
The EU’s ambition for CE is clear, but it is less so for the integration of sectoral policies underpinning. With the Bioeconomy Strategy and Action Plan (2018), the CEAP (2020), and the Farm to Fork and Biodiversity Strategies (2020) in place, the broader regulatory direction toward sustainable agri-food systems has never been clearer. Yet, circularity of agri-food systems has largely been absent from the policy discussions of the CAP reform process. While environmental conditionalities continue to be integrated into the CAP policy framework, in parallel, CAP incentive structures continue to enforce linear production processes. At the same time, there is also lack of correspondence of objectives across existent policy frameworks. For example, the Bioeconomy Strategy does not further specify the potential contributions and impacts of the bioeconomy to the existing or future CAP. Similarly, in the EU’s LongTerm Vision for Rural Areas (2021), the sustainable development of the bioeconomy is only referenced as a ‘complementary’ action for one of the proposed flagship initiatives (entrepreneurship and social economy in rural areas). Considering these disconnects between different thematic and sectorlevel policy frameworks, it is not immediately clear which policy objectives and targets would be the most relevant/applicable for guiding the transition toward a circular agri-food system.
Investments in innovation and effective coordination are key for striking a balance between resource and economic efficiency for a green, resilient, and inclusive transformation. Closing many loops along the agri-food system
requires significant investments in technology and innovation, new skills and knowledge, and the ability to measure impact. Innovation plays a critical role in linking resource and economic efficiency and the public sector is well positioned to enable this process by reducing the fixed costs of uptake of circular approaches and the provision of knowledge to address market failures associated with circular systems. Partnerships and coordination are critical factors to make circularity work at different scales to respond to policy ambitions.
Circular agri-food systems are a good business proposition for MSs, but large gaps remain. There is a divide between western and eastern EU MSs in terms of development and uptake of circular approaches and a lot more can be done to narrow this gap, in particular through improvements in the Agriculture Knowledge and Innovation System (AKIS). Within the east, advancements in private sector initiatives in agri-food circularity in four EU MSs (EU-4) are significantly ahead of national regulatory frameworks. This signals that the public sector needs to catch up and support the process of transformation toward circularity by enabling the investment climate through adequate incentives. Because of the early development of bioeconomyrelated interventions, many of the CE examples in the agri-food sector in these four countries are upstream, focusing on biomass utilization. More recently, and with the broader value chain systems approach of the CE, more initiatives are surfacing downstream. The scope of circular initiatives is also changing, from large-scale biodigesters to more and smaller initiatives along the value chain, including packaging, food reuse, and so on. However, significant investments in technology and innovation are needed to support the circular transition of these countries. And perhaps a more differentiated, regional approach to promoting CE in agriculture is required to close the gap between these countries and their western peers in terms of biomass utilization and economic returns to circularity.
The CE is critical for effective climate action and complements energy efficiency and lowcarbon energy sources in achieving global emissions reduction targets. Under the Paris Agreement, the global community has committed to limit global warming to well below 2°C, preferably to 1.5°C above pre-industrial levels. To achieve this target, the world would need to reach climate neutrality by mid-century. Energy efficiency and lowcarbon energy sources have long been the focus of climate mitigation. While energy efficiency and low-carbon energy sources are essential for climate action, they are currently unable to sufficiently address emissions from industrial or agricultural processes, which together account for some 46 percent of global GHG emissions. An increasing focus on material efficiency and circularity will help align the emissions trajectory of these sectors with the goals of the Paris Agreement. The climate relevance of circularity is increasingly recognized in
about one-third of NDCs updated and submitted in 2021 that mention the CE.149
Circularity can cost-effectively reduce GHG emissions from industry which are considered hard to abate. Emissions from the industrial sector accounted for 23 percent of global GHG emissions in 2015. These emissions are largely caused by the production of materials such as iron, steel, aluminum, cement, and plastics, which are associated with hard-to-abate emissions related to high-temperature processes, production emissions and end-of-life emissions. Cleaning up these emissions is difficult because (a) commercial low carbon technologies are still missing for hightemperature processes; (b) some emissions do not come from the combustion of fossil energy but from chemical reactions during the production of clinker and aluminum, for example; and (c) large amounts of carbon are released where materials are incinerated at the end of their life. Material efficiency and CBMs can address these emissions by eliminating waste, reusing products
and components, and recirculating materials in key sectors such as buildings and transport. As shown in Figure A4.1, there are many CBMs that can reduce emissions of the industrial sector costeffectively.150
In the food system, circularity helps sequester carbon in the soil while reducing emissions associated with food waste. Agriculture, forestry, and other land use (AFOLU) activities accounted for 23 percent of global GHG emissions between 2007 and 2016. At the same time 25–30 percent of total food produced is lost or wasted. In fact, it has been estimated that if food waste was a country (including food lost in supply chains and food wasted by retailers and consumers), it would be the thirdlargest GHG emitter in the world. Circular practices including regenerative agriculture, elimination of food waste, and composting can reduce emissions from the global food system by 49 percent in 2050 while at the same time regenerating natural systems. For example, climate benefits could be achieved in the EU-4 through increasing separate collection and higher recycling rates of biowaste, which remain considerably below the EU average.151
In addition to mitigating climate change, the CE can help in adapting to the impacts of rising temperatures. For example, the CE can help redistribute and reduce risks arising from the increasing vulnerability of global supply chains to climate change impacts. Similarly, there is evidence that regenerative practices in the agri-food sector can restore the health of soils, increasing resilience to extreme weather events such as floods, droughts, and storms.152
Quantifying the ways in which materials are used, reused, recycled, and lost is an important step to understand where a society stands in closing the material loop. Each MS has different natural endowments and economic structure, leading to its own unique material cycle. Hence, there is the need for tailored priorities and resource policies to accelerate the circular transition. Understanding resource cycles and material stocks and flows at different life cycles can better inform
150 Ellen MacArthur Foundation 2019; IRP 2020.
151 Ellen MacArthur Foundation 2019; IPCC 2019; WRI Indonesia 2018.
152 Ellen MacArthur Foundation 2019.
the development of national CE policies by revealing where material leakage happens and what kind of levers exist to close the loop. Understanding progress toward circularity requires using improved indicators. The Circular Economy Monitoring Framework proposed by the EC includes 10 indicators to measure progress toward a CE in the EU and its MSs. These indicators are structured along four areas: (a) production and consumption, (b) waste management, (c) secondary raw materials, and (d) competitiveness and innovation. The design of the monitoring framework prioritizes data that are being already collected to minimize the burden of additional data collection (PACE 2021). While these indicators provide a good macro-level overview, they are insufficient to gain full insight into how the transition progresses. Current indicators are highly aggregated and heavily based on flow account indicators. It is thus difficult for policy makers to understand the underlying causes of poor circularity in their countries and to prioritize materials and sectors. In addition, it is difficult for companies to relate their activities to these economic-wide indicators.
Improved indicators are required to measure circularity of economic sectors and refined material categories. To improve circularity, it is important to understand material cycles in different value chains. The level of circularity is subject to the fundamental limit of materials, and the lifespan of materials depends on their material properties and their application. For example, the lifespan of aluminum used in beverage cans is significantly shorter than the life-span of aluminum used in cars. Consequently, the approach to improving the circularity of the same materials used in the different sectors could be different. Better resolution of sectors and material categories can help policy makers better target focus areas (value chains and material streams) in their decision-making as well as industries to understand their contribution.
Indicators need to take into account both stocks and flows. Considering only flow variables does not provide a full picture of the dematerialization process. Buildings and infrastructure stocks play an important role in determining material inflows and outflows. Improved
characterization of material stocks and flows could inform a targeted transformation and enhance circularity by allowing for better management of existing material assets.
Measuring CE progress with policy implementation indicators. For some material streams and value chains, it is difficult to measure the circularity progress due to their long material cycle. Thus, indicators that specify the level of policy implementation could be used to provide feedback to decision-makers and citizens on the progress of the CE policy in place.
Current policies make linear economic models price competitive compared to CBMs. Except for a few examples—notably, and increasingly, carbon and other GHGs—the environmental externalities linked to linear business models are not considered in the pricing of virgin natural resources. As seen in Chapter 5, linear business models are also supported—directly through subsidies supporting the entire chain of virgin material extraction, transformation, transport, and use as well as directly and indirectly through fossil fuel subsidies. While true pricing is not reflected in linear products and services, regulatory action to support the transition to circularity will also be impaired.
Fiscal reforms offer a potent tool to level the playing field between linear and circular business models. Environmental taxes and levies are used in virtually every jurisdiction as a tool to cut pollution levels and of course raising revenues. Their rationale is grounded in the Pigouvian principle of internalizing the environmental impacts and therefore addressing market failures and their welfare implications. Although their role is increasingly catching the attention of policy makers, particularly in relation to their potential impact on decarbonization policies, they have never played a significant role in most tax systems. Indeed, in Europe, over the last two decades the share of environmental taxes in relation to GDP has decreased by 20 percent.
2.5%
2.0%
1.5%
1.0%
0.5%
0.0%
Source: Eurostat. 2020e
The use of fiscal tools is critical to advance the transition. Both the Green Deal Communication and the CEAP make reference to the relevance of fiscal instruments to promote the transition. The 2015 EU CE action plan153 states that “price is a key factor affecting purchasing decisions, both in the value chain and for final consumers. Member States are therefore encouraged to provide incentives and use economic instruments, such as taxation, to ensure that product prices better reflect environmental costs.” So far however, the main initiatives have been focusing on the energy/ climate sectors in the context of the revisions of the energy taxation directive and the introduction of the carbon adjustment border mechanism. The use of fiscal measures to promote circularity by altering relative prices and changing the behavior of firms and consumers has not yet been addressed.
Circular taxation addresses key bottlenecks affecting the transition. Circular taxation aims to change economic agents’ incentives toward circular principles rather than traditional linear models. Conventional environmental taxation targets end-oflife stages of production and consumption, leaving aside other stages of products’ life cycle. Levels of taxation are often too low to alter behaviors. Rather than a product-by-product approach, circular taxation requires rethinking critical building blocks of current taxation systems. A circular economy taxation framework includes the following building blocks:
Source: Adapted from Milos (2021).
• Introduction or strengthening of taxes on raw materials
• A general shift from labor to resource/material taxes (OECD paper)
• A reconsideration of VAT application
• Strengthening of waste management taxes, starting with stronger landfill taxes
• A general shift from taxation away from ‘services’ to ‘material intensive products’.
Stronger design and implementation of the fiscal framework supporting waste management is a critical first step. Capturing the externalities of waste disposal is critical to reduce landfilling rates and encourage circular activities, starting with recycling. A review of the waste management performance of EU MSs concluded that landfill taxes played a major role in diverting waste away from landfills and supporting the recycling sector. But several MSs still lag in the implementation of landfill taxes, either because of insufficient levels, regional variations (landfill taxes in Italy can vary from €5.2 to €25.82 per ton and from €7 to €41.19 in Spain, depending on the location, which potentially drives ‘races to the bottom’ effects), or an outright gap—Croatia still does not have any landfill tax. 154
Material taxes can achieve both environmental and revenue raising results. In addition to
154 EEA 2013.
(a) internalizing the environmental externalities arising from resource extraction and use and (b) supporting environmental regulations addressing the relevant market failure, raw material taxes address concerns of resource depletion and encourage the substitution of virgin material resources with secondary and recycled materials. From a fiscal resource point of view, the current centrality of raw materials in economic activity and its likely persistence in the future imply a low long-run price elasticity of demand. Raw material resources could thus represent a stable tax base for governments.155
FIGURE A4.4: LANDFILL TAXES ACROSS EU MSs
Source: CAWEB 2021
155 Hogg et al. 2014; Eckermann et al. 2015; Söderholm 2011; Söderholm and Tilton 2012.
In Sweden, a tax on natural gravel was introduced in 1996. The aim was to promote the use of crushed rock and recycled materials, such as concrete instead, as supplies were becoming limited in parts of the country. Although the tax encouraged substitution with other materials, it is applied uniformly across the country, even in regions where shortage in natural gravel is less of a problem and the importance of natural gravel as a groundwater reservoir material remains limited.
In Denmark, a new tax on extracted raw materials (sand, gravel, stones, peat, clay, and limestone) was introduced in 1990 in conjunction with a waste tax, to reduce the use of these natural materials and to promote the use of recycled products, such as CDW. The combined aggregate and waste taxes have produced a greater demand for recycled substitutes: in 1985 only 12 percent of CDW was recycled, compared with 94 percent in 2004. The Danish model of sorting CDW at source is an effective strategy of increasing the supply of recycled material, according to the study.
The labor and skills intensity of CBMs require shifting the tax burden away from labor. CBMs based on repair, refurbish, repurpose, reuse, and PaaS are all comparatively more labor intensive compared to their alternatives and typically require higher skill levels. In the EU-27, on average, 51.7 percent of the tax burden falls on labor (personal income tax, social security contributions, and payroll taxes)156. At the same time, as seen earlier, environmental taxes (of all types, including natural resource use and pollution) represent only 5.9 percent of total tax revenues. Shifting the tax burden from jobs to materials can foster CBMs, therefore addressing both market failures induced by linearity as well as reducing market distortions generated by labor taxation, as high labor costs reduce employment rates and encourage firms’ decisions to outsource production (often to low labor/high material intensity economies). 157 Real-life examples of circularity-oriented tax shift are scarce, although certain countries are taking steps in that direction. One example is Sweden, which since 2016 allows deductions of 50 percent (Rengöring, Underhåll och Tvätt—(RUT [Cleaning, Maintenance, and Laundry] tax deduction) on labor costs for home repairs and maintenance.158
VATs are an example of how current tax systems have evolved to support linearity. VAT applies to sequences of value addition throughout materials’ life-span until they reach disposal stage. But within systems where material and products are
156 EC 2022.
constantly looped back rather than reaching ‘waste’ status, VAT continues to apply. The end effect is to tax the preservation of materials’ residual value and the avoided environmental costs of disposing them and producing substitutes from virgin materials. The rationale for introducing VAT exemption or reduced rates for CBMs and products is clear. Some countries have started experimenting with lower VAT rates for recycled/upcycled materials and exempting secondhand goods. Few examples of circular VAT have already been applied in practice. In 2017, Sweden introduced a VAT reduction from 25 to 12 percent for repair of products such as textiles, shoes, leather products, and bicycles.159 Belgium has introduced a reduced VAT rate of 6 percent for demolition and reconstruction activities while Ireland, the Netherlands, Slovenia, Luxembourg, and Finland have introduced VAT reductions for certain repair services. VAT reforms will require a reevaluation of the EU VAT directive and adequate information on products’ embodied materials, through material passports, with a view to give them value for recovery, recycling, and reuse and secondary market utilization.
Effective circular fiscal systems are progressive fiscal systems. If the introduction of circularity objectives in fiscal framework aims at reducing environmental externalities, then economic agents (both producers and consumers) who are disproportionately responsible for those externalities should face higher tax rates. Across countries, the
157 Secretariat of the European Circular Economy Stakeholder Platform 2021.
158 Almén et al. 2020.
159 OU 2017.
poor contribute to environmental problems far less than the wealthy, mainly because of their levels of consumption. Together with relatively higher employment levels, social fairness can be a key ancillary benefit of circular taxation. And as argued in the next section, a policy package supporting a shift from labor to materials tax can enhance growth and welfare.
Industrial parks provide a cost-effective means to enhance CE synergies across industry sectors. In Europe, the term ‘industrial park’ can mean different outfits including science parks, technology parks, technopoles, research parks,
business parks, innovation centers, and technology incubators. These all share the same objectives: (a) facilitating interaction between science, technology, and business, typically through partnerships between business and research institutions and (b) facilitating upstream and downstream input-output links across business and sectors. Successful industrial parks provide high-quality, specialized services, with particular emphasis on business incubation, spin-off activities, networking, and logistics.160
Industrial agglomeration can reduce the transaction, information, and coordination costs preventing the emergence of CBMs. Governments in the EU countries have used industrial parks as a tool to accelerate national and local industry development. For example, in
FIGURE A4.5: INCREASE IN THE NUMBER OF EIPs BY REGION (1990–2020)
Number of Eco-industrial Parks (EIPs)
Source: World Bank 2021a.
160 Opinion of the European Economic and Social Committee on ’The role of technology parks in the industrial transformation of the new Member States.’ 2006/c 65/11. Office Journal of the European Union. https://eur-lex.europa.eu/legal-content/EN/TXT/ PDF/?uri=CELEX:52005IE1494&from=BG
Slovakia and Hungary, the governments’ active support for the development and expansion of industrial parks has helped create 64,500 new jobs.161 These industrial parks often host a range of industrial sectors and tenant firms, managed or regulated by national and municipal governments, and have backward and forward links with domestic industries. They consume large quantities of water and energy resources while at the same time generate waste. The agglomeration of industries, as well as the environmental and social externalities associated with industrial production, presents an ideal opportunity to introduce CE principles.
EIPs can generate material efficiencies through industrial symbiosis. EIPs can be defined as industrial areas that promote crossindustry and community collaboration for common benefits related to economic, social, and environmental performance. EIPs enhance the circularity of resources critical to industrial processes (water, energy, materials, and waste) by significantly reducing dependence on depletable resources such as fossil fuels. They promote the recycling and reuse of resources and waste as well as industrial symbiosis and renewables/biobased inputs. In the process, tenant firms can achieve more cost-efficient production that is also resilient to price fluctuations and resource scarcity.
Ultimately, EIPs can support the greening and decarbonization of value chains as well as improve resource management and conservation, through their focused CE solutions. According to estimates, scaling up EIPs could save EU businesses €1.4 billion a year and generate €1.5 billion in sales.162
Many EIPs already exist in the EU countries though the growth rate is slowing down. The EU countries alone account for 28.9 percent of 438 EIPs that were identified in the World Bank’s global survey of EIPs (World Bank 2021a). The compounded annual growth rate between 2010 and 2020 remains lower (1.8 percent) than other regions whose growth rates range between 2 and 14 percent. EIPs in the EU countries score relatively high (2.58) owing to the adoption of advanced technologies and policies (Figure A4.6). In the EU countries that were identified as having operational EIPs, approximately 280 firms existed per EIP on average. In addition, the EIPs in the EU region with high scores are associated with higher number of jobs.163
Targeting industrial parks that house multiple manufacturing units and businesses can provide the requisite push to adopt CE principles, particularly in resource-intensive sectors in the EU such as textiles, electronics, and plastics. Industrial parks can adopt a combination of different strategies, technologies,
Source: World Bank 2021a.
161
162 EC 2011; UNIDO; World Bank; and GIZ 2021.
163 World Bank 2021a.
and business models to foster the CE and reduce resource consumption and operational costs.
• Promoting higher renewable energy generation and use and achieving carbon neutrality
• Investing in common infrastructure and service provision to optimize the use of resources (for example, steam networks, CO2 recovery plants, cogeneration/trigeneration using biomass and/or biogas)
• Keeping materials and resources in use at the park level by encouraging tenant firms to create a symbiotic network and enabling their waste and by-product exchange (for example, creating a steam network between steel manufacturers and textile firms)
• Designing out waste by encouraging tenant firms to integrate circular designs and to use environment-friendly technologies in their production facilities
• Fostering the establishment of recycling enterprises and sorting facilities rendering services to tenant firms
• Rethinking business models for improved energy, water, and waste management at the park level
• Harnessing digital technologies to increase resource circularity and material exchange.
Governments in the EU countries have adopted policies to encourage adoption of EIP
programs. In the United Kingdom, the National Industrial Symbiosis Program (NISP) was launched in three regions as part of a policy initiative of the Business Council for Sustainable Development. In Italy, a national law (decree 112/98) introduced Ecologically Equipped Industrial Areas, known as APEAs in Italian, in 1998. In 2009, a new series of regional laws (Tuscan Regulation 74/2009Regione Toscana, 2009a and Resolution 1245/2009 - Regione Toscana, 2009b) were enacted in the Tuscany region to encourage industrial parks’ voluntary adoption of APEA certification. Unlike the UK, Korean, and Chinese cases where the central governments played a significant role in scaling up EIP programs/industrial symbiosis projects, the program to manage the certification process in Italy is managed at the regional level and the central government does not play an active role. These programs have been supported with other enabling policies, incentives, and market-base mechanisms. In Belgium, the ministerial decree (October 1, 2007) and the Flemish Government Decree - May 16, 2007/May 24, 2013) elaborated CO2 neutrality requirements with implications for the design and management of new and existing industrial parks. Following this decree, industrial parks in this region included carbon neutrality requirement as part of residency contract/sales conditions agreements between park operators and tenant firms.164
Table A4.1 provides a list of programs implemented in the EU to encourage development of EIPs (the list is not exhaustive).
164 Daddi et al. 2016; World Bank 2021a.
EIPs in the EU countries have adopted innovative technologies and business models that provide state-of-the-art infrastructure and services to help business achieve material efficiency gains. Together, these technologies and business models are helping to scale up the use of renewable energy, water circularity and material/ energy recovery through industrial symbiosis and other material recovery technologies. For example, in Germany, Industriepark Höchst, which has operated for more than two decades and generated 6.65 billion worth of investment and 22,000 jobs, had invested in an innovative biogas technology and business model. This integrated system recovers and reuses sludge from a wastewater treatment plant and generates biogas, which is then used to produce electricity and steam in a combined heat and power plant (Figure A4.7). Through this system, more than 310,000 tons of sewage sludge is recovered annually. And together with solar energy, this innovative system contributed to mitigating over 500,000 tCO2 emissions every year and provided additional source of revenues for the park operator.


Digital technologies can enable and accelerate many barriers. Implementing CBMs can involve trade-offs. For example, increasing products’ durability can lead to introducing materials which are more energy intensive in the production phase. Transitioning to service-based business models and increasing recycling rates call for additional investments in fixed capital to support logistics, at least in the initial stages. And highly integrated value chains may see transport costs increase due to narrowing material resource flows. Information technologies offer solutions that break these challenges and move forward the CE transition along three dimensions: (a) improving knowledge, connections, and information sharing, (b) revealing options to increase material efficiencies of products and processes, and (c) strengthening the roles of citizens and consumers.165
Digitalization is already affecting how businesses operate and the products and


Existing applications for reusing, recycling, upcycling, and minimizing waste include numerous examples, such as Upmade, an Estonian company that enables the upcycling of textiles, therefore avoiding new material production and reducing waste. The company developed a software to help brands carry out a product-based analysis on its materials and design. Meanwhile, manufacturers can create Upmade-certified garments and are connected with brands through Upmade. Another example is FoodCloud, an online app and platform that facilitates the donation of surplus food from retailers to local charities in Ireland. Charities are automatically notified about unsold food surpluses, can collect the surplus food from the retailers, and distribute it to those in need. The app is currently in use in the United Kingdom and Ireland and cooperates with 3,200 supermarkets and 9,500 charity partners. One example related to enabling tracking and tracing is TrusTrace, a blockchain-powered collaboration platform that aims to increase product traceability and transparency within the fashion industry value chain. Fashion brands, retailers, and consumers gain access to 35 product line data on the substances and materials used in the production of apparel.
WikiRate Project, the largest openly accessible database of environmental, social, and governmental data, is a collaborative platform enabling academics, investors, companies, and the general public to research, discuss, and rate company performance. Solutions enabling sustainable choices include Amazon’s Second Change web page, which provides instructions for recycling packaging, repairing equipment, and purchasing (certified) refurbished products. Another example is Bext360, which uses blockchain technology to monitor the sustainability of supply chains (for example, cotton, minerals, timber) and traces the consumer back to the producer. Examples of digital nudges for behavior change include apps such as My Little Plastic Footprint, which helps consumers reduce their personal plastic footprint by providing information about plastic waste and encourages them to reduce plastic waste; another example is Giki, a mobile app that awards badges to products on the British market based on their impact on environment and how ethically they were sourced and produced.
services they provide. Business models are increasingly shifting from producing goods to delivering services, and digitalization plays a major role in this development. Numerous examples of digitalization enabling such new business models already exist, which encourage product longevity, reusability, and sharing; reduce demand for materials and negative externalities; and ultimately support dematerialization.
Information technology informs design choices such as end-of-life management and wider environmental footprint. The design phase determines what the environmental and climate footprints of products will be across their life cycle, including during their use and end-of-life phases. In fact, it is estimated that up to 80 percent of a product’s environmental impact is determined at the design phase. Although the development of circular digital technologies is still nascent, emerging
166 EC 2012; Schweitzer 2019; Wilson 2016.
solutions are promising. For example, building information modeling is a process of designing, planning, and constructing a building using digital 3D modeling software. AI can be used to improve design processes by allowing designers to play with numerous materials and structures and test design proposals. In addition, integrating digital technologies into the design of a product can provide opportunities to enhance the tracking of materials across the value chain, such as QR codes, barcodes, watermarks, and radio-frequency identification (RFID) supported by data-sharing systems.166
Digital tools, such as AI, robotics, and IoT, are being used to optimize production processes, resulting in less waste and emissions. Europe is considered a global leader in industrial IoT (for example, machine-to-machine communication), which is used to monitor the functioning of
machines, make them operational at off-peak times, enable predictive maintenance, and so on. Further, digitally enabled solutions such as 3D printing can help cut costs and optimize production by using only the exact amount of materials needed.167
Digitalization can also support improving the reuse, repair, and remanufacturing of products. It is estimated that the European remanufacturing market (currently valued at €31 billion) could grow to 100 billion by 2030, saving 21 megatons of CO2 emissions, and create around 500,000 new jobs. Online platforms facilitate the reuse of products, components, and materials, giving them a second life. Also, digitalization can also support remanufacturing, which entails interventions at the end of a product’s life cycle (for example, dismantling, repairing or replacing parts, reassembling) to bring it back on the market, usually accompanied by a warrant. Remanufactured products are considered more valuable compared to secondary raw materials obtained through
recycling or energy recovery, and these practices reduce demand for new products, thus saving energy and materials that would have otherwise been used.168
Digitalization can both influence and empower citizens and consumers to play a crucial role in the transition to a CE. Data and digital solutions are already being deployed to inform, educate, and increase the awareness of people on sustainability issues as well as to nudge people’s behavior toward buying more durable or recyclable products.169
The EU is leveraging its digital transition in pursuit of circularity. In addition to the policy direction set by the CEAP, a range of EC instruments aim to support the deployment of digital solutions to foster circular innovations. For example, Horizon Europe aims to support the development of indicators and data, novel materials and products, substitution and elimination of hazardous substances based on ‘safe by
Shifting to a PaaS business model can help businesses benefit from stronger customer relations and generate more stable revenue streams. Digital applications are today a key enabler of PaaS CBMs. Mobility as a service is attracting growing interest, especially in cities and can be provided through apps; for example, in Helsinki, residents can use Whim to access multiple transportation models (for example, train, taxi, bicycle) and users can either opt for monthly subscriptions or the pay-as-you-go method. Another example is clothing-as-a-service online platforms, which are growing in Europe and beyond: Tale Me is a Belgian rental service for maternity and children’s clothes; the Dutch brand MUD leans rents and recycles denim clothing; and Urban Outfitters is starting a rental service, Nuuly.
Adidas and additive manufacturing company Carbon developed Futurecraft 4D, a new 3D printed shoe. These 3D printed footwear uses fewer materials and easily recyclable parts. Libelium provides farmers with sensor technology and an IoT-based platform to observe, measure, and respond to the environmental conditions, diseases, and pests that affect their agricultural production. This ‘precision agriculture’ enables growers to match farming practices to crop needs and reduces the use of pesticides, fertilizers, and water while boosting yields. Further, digitalization can help promote industrial symbiosis and the sharing of assets with other stakeholders, hence helping prevent waste. GreenLab is an industrial park developed as a public-private partnership in Denmark, which relies on the integrated intelligent infrastructure to enable energy exchanges between firms.
167 3D printing (for example, additive manufacturing) creates an object layer by layer by adding just the necessary amount of material to produce an item, rather than eliminating surplus material to get the desired product, thus minimizing waste in the production process (European Policy Center 2020). European Policy Center 2020; IoT Business News 2018.
168 Conseil Européen de Remanufacture, n.d.; European Policy Centre 2020; Jansson et al. 2017.
169 European Policy Center 2020.
design’ approach, CBMs and new production, and recycling technologies, including exploring the potential of chemical recycling, keeping in mind the role of digital tools to achieve circular objectives. In addition, the Marie Skłodowska-Curie Actions aim to support the development of skills and training and mobility of researchers in this area. Further, the European Institute of Innovation and Technology will coordinate innovation initiatives on CE in collaboration with universities, research organizations, industry, and SMEs within the knowledge and innovation communities. The current EU information and services toolbox includes a wide range of information and service instruments (for example, data analytics, cluster collaboration platforms, eco-design standards) supporting the EU industry to integrate the CE in their products and services (see Box A4.2 and Box A4.3).170
The emergence and convergence of technologies bring new opportunities to accelerate the CE transition. Technologies such as IoT, big data, blockchain, and AI are creating new sustainable business models that will accelerate not only circularity but also the dematerialization of the economy and reduce Europe’s dependence on primary materials. For instance, IoT can enable automated location tracking and monitoring of natural capital. Big data enables several aspects of circular strategies such as improving waste-toresource matching in industrial symbiosis system through real-time gathering and processing of inputoutput flows. In addition, data analytics can be used as a tool to predict product health and wear, reduce production downtime, schedule maintenance, and optimize energy consumption.171
Public procurement is an essential demandside instrument to support sustainable development. Public procurement refers to the purchase of works, goods, and services by public authorities on all levels of government. Representing
170 EIT, n.d.; EC 2020d.
some €1.8 trillion each year, it accounts for about 14 percent of the EU’s GDP. Given the sheer size of public procurement in the EU, public authorities not only play a significant role in the investment ecosystem but also have the power to shape markets and to create new ones by stimulating a critical mass of demand for innovative goods and services. Traditional valuation approaches used in public procurement provide a disincentive to the emergence of the CE. Circular goods and services may induce higher upfront costs but they reduce maintenance and end-of-life disposal costs. 172
CPP aims at increasing the resource efficiency of products and services procured by public authorities, therefore minimizing their environmental impacts and waste creation. The 2017 EC guidelines on circular procurement call for “a framework for the holistic consideration of environmental impacts and waste creation across the whole life-cycle of goods and services.” The EGD calls for public authorities to ensure that their procurement is green. However, CPP remains a voluntary instrument and has yet to become common practice across the EU public authorities on all levels.173
Full cost accounting is central to CPP implementation. Full cost accounting helps create the business case for circular good and services which would otherwise be considered disadvantageous based on traditional estimation methods. LCC considers costs related to environmental externalities, as long as they can be monetized and monitored, as well as internal costs related to research, development, production, transport, use, maintenance, and end-of-life disposal.174
Some EU MSs are spearheading
using circular procurement. The Dutch government has launched trial projects such as the N33 highway renovation by applying a circular procurement process, among others, aimed at using renewable input resources. The Danish Odense municipality constructed 40 new residences
171 Bin et al. 2015; Ellen MacArthur Foundation 2016b; Kristoffersen et al. 2020; Lacy, Long, and Spindler 2020; Low et al. 2018; Porter and Heppelmann 2014; Shrouf, Ordieres, and Miragliotta 2014.
172 Bleda and Chicot 2020; EC, n.d.-d.
173 EC, n.d.-d, n.d.-e.
174 Circular Flanders, n.d.
Found in some form in nearly every country in the region through the use of labels, ISO standards, and preferential treatment of businesses with sustainable business practices.
Promoted by the EU. Increasingly included in procurement legislation. Its application remains, however, limited.
Except for a few countries such as DK and the NL, the concept is not applied in procurement and poorly understood. Circularity is only applied incidentally when procuring renewable energies or recycled products as part of GPP.
for youths with disabilities based on green and circular procurement requirements. The Swedish Skane region purchased bioplastic aprons for its hospitals from 100 percent renewable materials. In Latvia, the Preili municipality published a tender for the renewal of its public street lightening based on, among others, the 100 percent recyclability of its components at the end of their lifetime. These and other early adopters underline the importance of:
• preexisting market conditions that allow for greater recycling
• close collaboration between stakeholders, both inside the government and outside
• a good understanding of the concept of circular procurement
• sufficient fiscal space to bear initially higher upfront costs and
• political will.175
Includes economically, socially, and environmentally sustainable procurement practices.
Includes LCC considerations in procurement, reduced GHG emissions in production both in terms of input materials as well as finalized product to be procured.
Governments procure goods that are fully recycled, containing reused or reusable resources. Works and goods procured consider the reuse of input materials in the evaluation of bids.
The adoption of circular procurement remains, however, incipient in several MSs, including the four focus countries of this report. In Romania, circular procurement is not yet being discussed at the policy or institutional level, although the Agency for Regional Development of the North East (a public entity) started educating procurement specialists on the topic. Poland has laid out broad provisions on circularity in procurement and its CE roadmap mentions the role of procurement. In Croatia, circular procurement is considered rather incidentally, and in Bulgaria there is currently no evidence of initiatives or legislation addressing the issue.176
A widespread uptake of CPP faces barriers. In the short term, procurement agencies are constrained in launching tenders with circularityoriented criteria by what the market can actually offer, given the still limited uptake of CBMs within the private sector. And yet, CPP’s promise is precisely to encourage and guide innovation in the
175 Alhola and Salmenperä 2019; North Sea Region, n.d.; SZREDA 2020.
176 Alhola and Salmenperä 2019.
private sector by signaling demand for circularity goods and services. Similarly, procurement agencies incur constraints in the limited understanding of the economic benefits of CPP across governments. Unless full cost accounting and LCC are considered and communicated, Budget Departments and other government agencies are unlikely to agree to procurement activities promising unclear long-term benefits but higher upfront costs. And last, CPP benefits need to be communicated to legislators, as public procurement legal frameworks do not yet include principles of circularity or green procurement.
The informational barriers constraining the rollout of CPP can be resolved. In the short term, current market readiness levels do not prevent procurement agencies from introducing nonbinding circularity requirements in tendering scoring systems, with a view to creating market expectations of their mandatory nature in the longer term. Procurement agencies can encourage policy coordination among central and local government authorities, leading to legal/regulatory frameworks codifying the rationale for government function.
Cities are centers of resource consumption. Seventy-five percent of the world’s natural resources, 78 percent of world energy, 60–75 percent of world’s GHG emissions, and 50 percent of world’s waste are generated in cities. At the same time, because of their remits, city governments incur many of the costs induced by economywide linearities—solid waste management, structural waste such as underutilized buildings, and congestion and pollution all fall within cities’ mandates. Managing waste costs on average 20 percent of municipal budgets in low-income countries, 10 percent in middle-income countries, and 4 percent in high-income countries.177
But cities can also be engines of circularity. They have inherent advantages such as density and proximity of producers and consumers and access to resources such as capital, technology, and skills, which can pave the way to innovative business models. City governments also have key tools
to facilitate the transition to circular economies, including the following:
• Taxing power on critical segments of product life, starting from waste. The Netherlands imposes high taxes on waste disposal and mixed waste to discourage these actions.
• Financial incentives (subsidies and so on) to local businesses to support repair and reuse shops and other CE-related initiatives and to consumers for circular practices such as purchasing EVs or trading in old cars for electric bicycles.
• Construction permits disincentivizing virgin materials and promoting recycling by mandating the amount of secondary materials required in construction projects.
• Land planning through zoning and permits, which is critical to keep cities dense and to prevent sprawl and additional soil sealing. In addition to limiting stocks accumulation, dense cities also limit resource consumption flows particularly by incentivizing public mobility modes.
• Demolition and renovation permits that regulate deconstruction and how CDW is handled, requiring circularity criteria to be inserted in ex ante auditing of deconstruction plans.
• Control over municipal solid waste management, including collection, treatment, and disposal. They can enact incentives, bans, and disincentives to make the disposal of materials into landfills undesirable while making reuse, remanufacturing, and recycling desirable.
• Direct control over municipally owned buildings and their features at construction, operations, and maintenance.
• Purchasing power to create markets for circular products through public procurement tenders, requiring specific maintenance, take-back, and reuse criteria leading to better resource management and potentially public finance savings.
• Controlling of food service/catering at public institutions such as hospitals, schools, and prisons; they can set policies to procure local
and regeneratively grown food and treat organic waste.
• Setting of policies and procedure for collection, recycling, recover, and reuse of waste through separate waste collections and treatment systems.
• Decision on whether to own or lease their own fleets for public transit and municipal agency.
• Incentivization of mobility as a service within cities limits.
• Provision of incentives for funding local food businesses to adopt CE principles.
• Collaboration with other levels of government to promote and support the sharing, swapping, leasing, and reuse of products through centers and platforms, particularly for textiles and electronics.
• Promotion and enforcement of national legislation, for instance, by making EPR a requirement for municipal procurement and for local businesses through incentives or disincentives such as taxes and fees.
• Data—cities have data from their transportation systems, building operations, permits, and sales from transportation and building sectors, among others. Cities have control over what they collect, how they manage it, what they do with it, and if/how they share it.
Cities have a lot of options when it comes to enabling their transition to a CE. However, they also face important barriers, some common to national-level governments and others specific to cities themselves. Barriers that cities face can be summarized as lack of awareness, lack of technical capacity, lack of coherent strategies, funding constraints, and regulation. Some of the challenges are compounded by cities being nested in national governments and typically within regional or subnational governments as well. Without an enabling environment across governance levels, cities’ leeway can be reduced. In countries such as the Netherlands, for instance, cities are not allowed to set local requirements for construction and demolition that exceed the national Construction Act.178
Despite these barriers, European cities are increasingly turning to circularity as a key principle of their development strategies. Amsterdam, Brussels, and Paris are the leading examples of a number of cities developing city-wide circular economy plans and strategies, developing ad hoc metrics and facilitating collaboration among agencies and private stakeholders, and empowering local communities.
178 Jonker and Navarro 2017; OECD 2020.


