02
Highlights & Accomplishments Lost-time Incidence Rate (LTI)and Challenges Opportunities
XX
%
WorkplaceNL 2. . . will continue to support injured workers and their employers . . Vfocusing V VonV by waysVto reduce injury and illness, provideIefficient . . workplace . . . V V Vto reduce services and manage policies 2 2 7 Vcosts. V
70
%
2008 2009 2010 2011 2012 2013 2014 2015 2016 2017
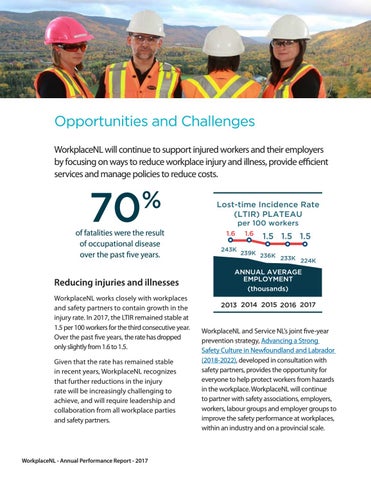
Lost-time Incidence Rate (LTIR) PLATEAU
.
per 100 workers , 1.6 1.6 , 1.5 1.5 1.5
of fatalities were the result , of occupational disease , over the. past five years. .C
243K
.C
. Reducing injuries and illnesses
.
WorkplaceNL works closely with workplaces C and safety, partners to contain growth in the . C injury rate. In 2017, the LTIR remained stable at . 1.5 per 100 workers for the third consecutive year. Over the past five years, the rate has dropped only slightly from 1.6 to 1.5.
239K 236K 233K 224K
AVERAGE , ANNUAL C EMPLOYMENT .C (thousands) . ,
. ,
2014 2015 2016 2017 2013 ,
.
WorkplaceNL and Service NL’s joint five-year prevention strategy, Advancing a Strong Safety Culture in Newfoundland and Labrador (2018-2022), developed in consultation with Given that the rate has remained stable safety partners, provides the opportunity for in recent years, WorkplaceNL recognizes everyone to help protect workers from hazards that further reductions in the injury in the workplace. WorkplaceNL will continue rate will be increasingly challenging to to partner with safety associations, employers, achieve, and will require leadership and workers, labour groups and employer groups to collaboration from all workplace parties of workplaces are decline in workplace workers injured everythe safety performance improve at workplaces, and safety partners. injury-free 201 fatality rate 2007-201 day (on average) 201 within an industry and on a provincial scale.
XX
%
WorkplaceNL - Annual Performance Report - 2017
XX
XX
%


