WK Real Estate’s Luxury Market Report is your guide to luxury real estate data and trends for Boulder and Broomfield Counties Our goal is to provide clients with the market insight, information and resources needed to make critical decisions when selling or purchasing property in the Boulder area.


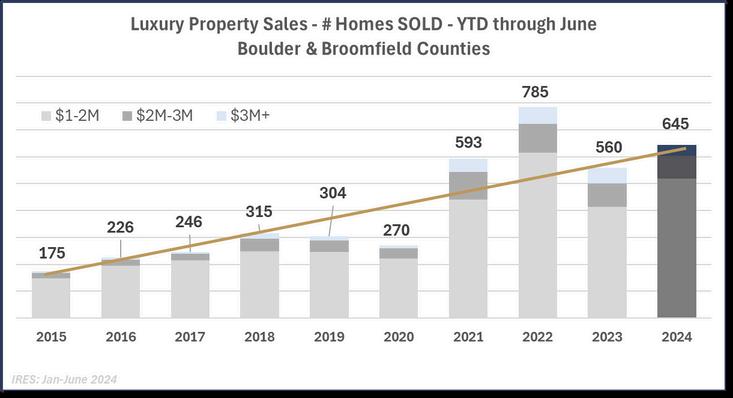
The figures above represent the total number of Residential and Attached units sold in Boulder andBroomfieldcountiescombinedforeachyearindicated. Farm&ranch,vacantland,andother propertytypesarenotincluded TheabovefiguresareYTDforthefirsthalfoftheyear,through June2024
Yearoveryeartheunitssoldinthemarketexperiencedanoverallincreaseof152%inthe#ofunits sold Thegoldlinerepresentsahypotheticaltrendline,withconstantyearlyincreasesfrom2015to 2024.Themarketiscurrentlyrunningabout8%abovethetheoreticalpaceandpredictionof1,192 units sold by year end 2024 By year end both 2021 and 2022 ended as “outlier” years, with the numberofunitssoldsignificantlyabovetrend,andthiswastruethroughJulyaswell,while2019 and2020throughthesameperiodsawmarketdips.Lookingatthetrendlinewedefinitelyseethe marketresumingmorebalancedgrowthin2024
Salesinthe$1-2Mpricebandincreasedby254%,whilesales$2-3Mdippedmodestlyby34% The pricebandthatexperiencedthemostsignificantdecreasewasthe$3M+bandwhichdipped288% yearoveryear.Ashomepriceinflationcontinuestoriseinourarea,it’snotsurprisingthatsalesin the$1-2Mpricebandcontinuetoincrease,withpropertiesmovingupfrompricepointsunder$1M
Tracking from 2015, the overall increase in $1M+ units sold was 2686%, while the $3M+ band increasedsignificantlymoreat600.0%.

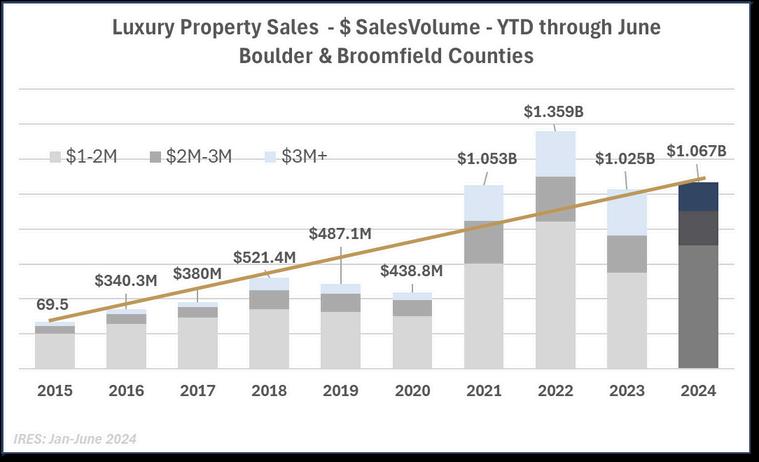
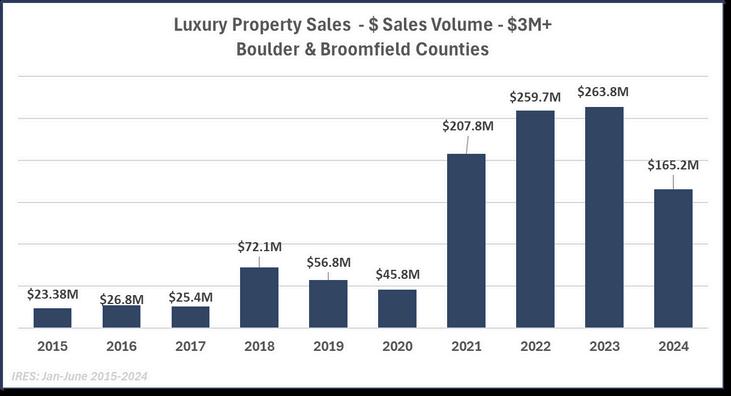
Similar to the previous chart, the figures above represent the total dollar volume of sales of Residental and Attached units sold in Boulder and Broomfield counties combined for each year indicated for the first half of the year through June 2024
Year-over-year the market experienced an overall increase of only 4.0% in the dollar volume of properties sold Again, the gold line represents a hypothetical trend line, with consistent yearly increases from 2015 to 2024, except 2019 and 2020, tracking with the sold units
Sale volume in the $1-2M price band increased by 280%, while sales at $2-3M decrease by 67% Volume in the $3M+ price band dropped more significantly by -37.4% and at $165.2M this is the lowest level we have seen since the early pandemic-affected period in 2020
This chart shows the monthly rate at which luxury properties were sold by price band - this is sometimes referred to as the “burn rate” or absorption rate. This number may relevant to sellers as it indicates how quickly or slowly the market is moving in a certain price and point in time.
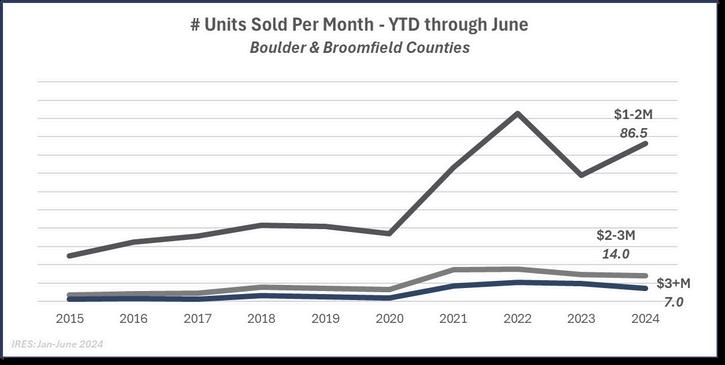
During the pandemic years of 2020-2022 we saw heightened demand for properties of all types Buyers in luxury price points especially had the freedom and inclination to move to desireable lifestyle areas, such as Colorado, and favorable interest rates made this feasible In 2022 YTD through June there were an average of 1308 properties over $1M selling each month, while only 98.8and93.3in2021and2023respectively.Thatnumberbumpedbackupto107.5propertiesper monthoverthesameperiodin2024,butiswellbelowthe2022peak
The$1-2Mpricebandwasthemostaccessible,with865propertiessoldpermonth,andatanalltimehighotherthan2022whenitwas1027 Averagedaysonmarket(DOM)was65dayswhilethe median days on market was only 40. In the $2-3M price band properties sold at a rate of 14.0 haverageDOMhigherat74andmedian over$3M,averageDOMwasonlyslightly mparativelysluggish7.0propertiesselling ngalowerturnoutofbuyersatthishigh
As of this writing there were 156 properties priced at $3M+ listed in the MLS for sale in Boulder and Broomfield Counties. 139 of these were Active (available) listings, 17 were Pending transactions. Using the YTD rate of absorption rate for this price band of 7.0 properties per month, it would take 19.9 months for all 139 of these properties to sell and close if no other properties came on the market during that time. If we used the 2023 rate of 9.8 properties per month, it would take 15.86 months for all of these currently active and pending homes to sell. The highest end of the market has definitely slowed.
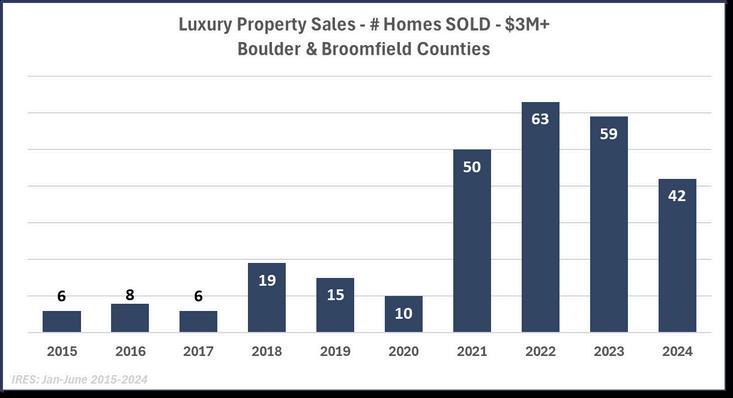
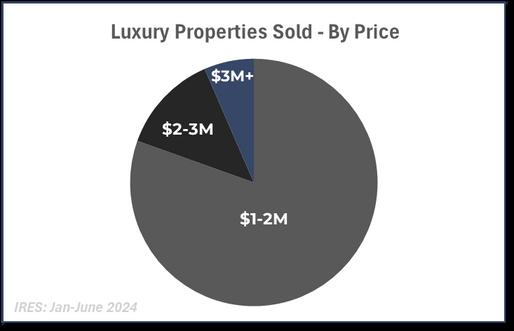
80 5% of all properties sold over $1M were sold in the $1-2M range, representing 66 1% of the total sales volume over $1M, which is much higher than the proportionate share for this price band at year end 2023 Buyers are definitely tending towards conservative spending, even in luxury The % of sales in the $2-3M range decreased from 15 5% in 2023 to 13 0% by the same period in 2024, and sales over $3M ticked down from 10 5% in 2023 to only 6 5% of total units sold in 2024
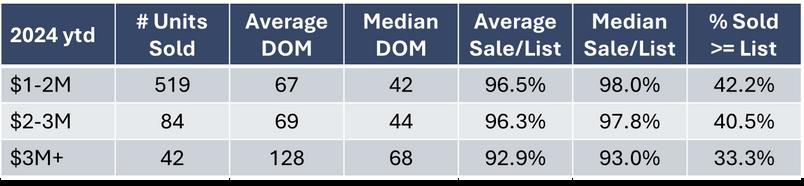
The amount of time properties remain on the market is an indicator of market pace and the strength of demand, as is the ratio of the final sale price to the list price of the property. Specific to each price band, a third or more of the properties have sold in 2024 year-to-date sold at a price equal to or greater than the listed price. The trend however, compared to the same period in 2023 is that days on market are creeping up, the sale-tolist price ratio is dropping, as is the # of properties selling at or greater than list price The market no longer feels like the feeding frenzy we experienced during the pandemic; instead perhaps trending nearer towards more normal competitive market dynamics
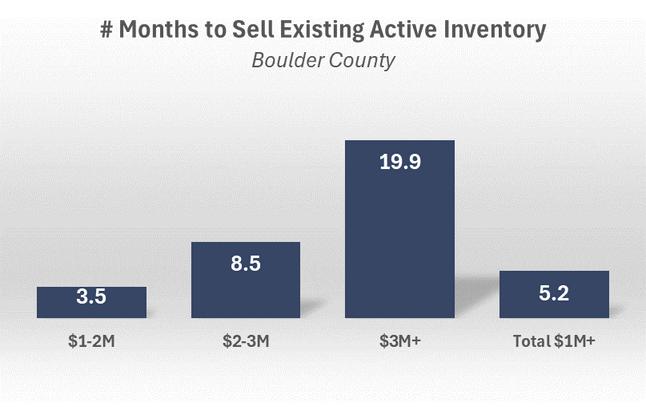
Using rate of sale numbers YTD and the inventory available at the time of this writing, we can predict that it will take over 5 months to sell all of the available inventory, in the unlikely scenario that no other inventory comes on the market during that time. The higher the property’s sale price, the longer it will take to sell because the pool of available buyers appears to now be more limited. This same time last year the conditions were more favorable for sellers. The # of months to sell the existing inventory at that time was 4.3 months overall, 3.0 months for homes priced at $1-2M, 7.3 months for those priced $23M and only 9.4 months for the highest price band of $3M+.
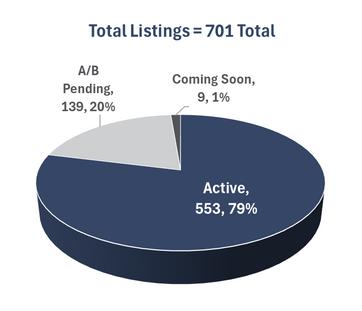
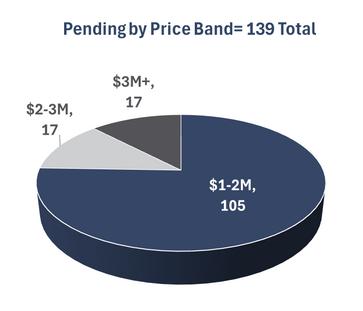
Only 20% of all active listings were in under contract / pending status and of those pending the vast majority, 105 out of 129 properties, are in the “entry-level” luxury $1-2M price band
The biggest influencers in the national real estate market today are mortgage-rates and their volatility These don’t affect the higher end segment of the market as much, even though both national and local statistics indicate about half of luxury homebuyers still finance for their home purchases with mortgages.
Cash is even more prevelant at the highest end of the market, as high net worth buyers deploy their liquid assets to their real estate purchases During the first half of 2024, over 57% of all buyers of the homes that closed at sale prices over $3M in Boulder and Broomfield Counties were cash buyers. During the same period in 2023 cash buyers comprised 61% of all buyers in this segment.
The uptick in the number of active listings and homes sitting for longer is more an indication of the market normalizing than anything of note or concern There's also mismatch of expectations between buyers and sellers While sellers hope to get top dollar for their homes, buyers expect to find better deals and updated, turn-key homes since the post-pandemic slowdown.
According to the Denver Metro Association of Realtors (DMAR) June Market Trends Report, the $1M+ segment is now a full-blown buyer’s market To avoid properties sitting idle through the rest of the season, the report recommends that sellers update their properties prior to listing, price conservatively and expect to pay a closing concession.
According to the Denver Business Journal “A $1 million home may once have been considered an informal marker of a luxury residence, but that's no longer the case in many US metro areas In fact, buyers need to shell out seven figures to buy what's considered a starter home in some markets.”
“In 237 U.S. cities, the typical starter home considered to be inventory in the lowest third of home values in a given region now costs $1 million or more, a recent analysis by Zillow Group, Inc found Five years ago, only 84 cities fit that criteria” This study listed the states represented and while Colorado had 3 cities in 2024 where “starter homes” average over $1M, compare to 117 cities in California and 31 in New York
We can speculate that those 3 seemingly affordability-challenged Colorado cities might be in areas such as Aspen, Snowmass and Vail That said, as of July 31, 2024, the median price of a single family home in the City of Boulder was over $14M and the average over $172M While this may seem outrageous, consider this... in the small Denver enclave city of Cherry Hills Village the median sale price during this same period for single family homes was over $32M and the average well over $42M Greenwood Village follows with median and average sales prices between $1-2M and Castle Pines makes the list with median and average prices in the low $1M’s.
Less is more, we’ve all heard the saying. Luxury researchers, who study everything from purses to properties, say now more than ever this concept is trending. While luxury has long been associated with extravagance, today’s affluent consumers are embracing the notion of “quiet luxury”, opting for understated elegance over flashy displays of wealth. Earlier this year Vogue named “quiet luxury” the top interior design trend for 2024, reiterating that “the worlds of interior design and fashion are more intertwined than ever.”
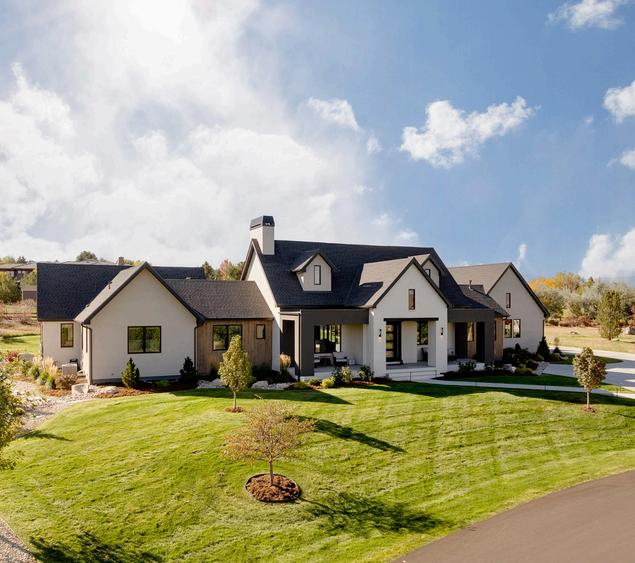
Quiet luxury is nothing new, especially in Europe, but it has gained momentum in luxury real estate markets around the world, particularly in the United States And what could be more low key and understated than Boulder, CO? Unlike Cherry Hills Village mentioned earlier in this report, or places like Westchester County, NY or Palm Beach, FL, you won’t find too many mega-mansions or grand estates in Boulder A comfortable luxury home in Boulder might be only 3,000-4,000 square feet In fact there are currently only 4 homes total on the market priced over $3M that have over 10,000 square feet, only 3% of the available inventory in that market segment
If you had to speed name words that describe Boulder one of those words would definitely be “organic”. To many, Boulder is considered the epicenter of the natural and organic foods industry. It also has the highest consumption of organic foods in North America, but the consumption of all things organic doesn’t stop at food. While the square footage home buyers seek may be shrinking, they don’t compromise on quality or amenities. Today’s luxury home buyers gravitate towards organic materials and more subtle finishes like sueded granite (as opposed to polished), and handmade features, natural sustainable materials, and choices that create environments that exude warmth and tranquility.
According to financial website SmartAsset, “many affluent young people often relocate for better jobs, lifestyle upgrades and tax advantages, as well as new experiences, friendships and relationships This can have an outsized effect on local economies and politics, specifically housing, employment and voting, among other important factors” Colorado is the #3 state after Texas and Florida on SmartAsset’s list of top states for net inflow of young and rich households, which in the case of Colorado is an average of $389,859
Earlier this year several notable organizations such as U.S. News & World Report and Move Buddha ranked Boulder one of the top places to move to in 2024. Not just for millennials, Boulder epitomizes the current trend across the top cities to move to (like also Asheville and Billings): a growing preference for smaller cities with a strong community and access to outdoor recreation
Buying real estate in Boulder allows millennials to embrace a balanced lifestyle, combining their careers with a commitment to health, community, and the environment The city's unique character and quality of life make it a compelling choice for those looking to make a home in a place that truly resonates with their values
For information on specific locations or neighborhoods, please contact a WK Real Estate Broker Associate or our office | 303-443-2240 or info@wkre com