MID-YEAR 2025 LUXURY MARKET


WK Real Estate’s Luxury Market Report is your guide to luxury real estate data and trends for Boulder and Broomfield Counties Our goal is to provide clients with the market insight, information and resources needed to make critical decisions when selling or purchasing property in the Boulder area
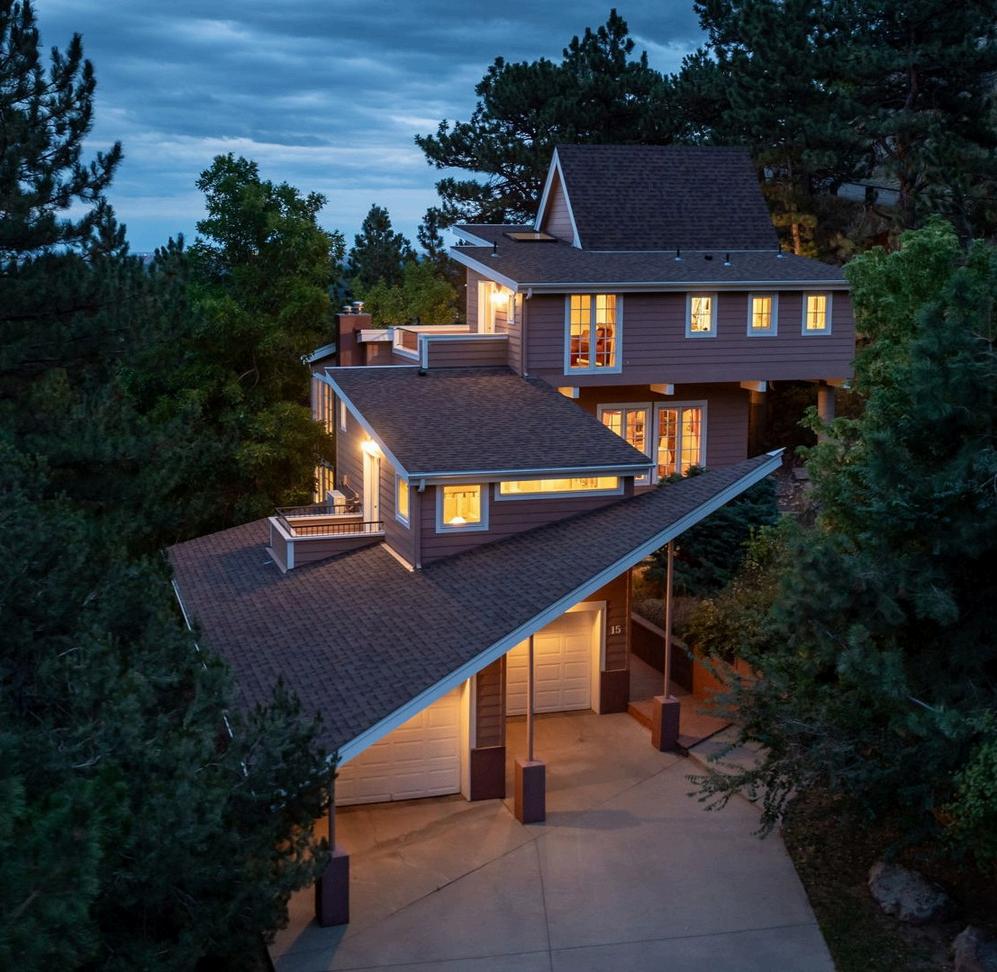
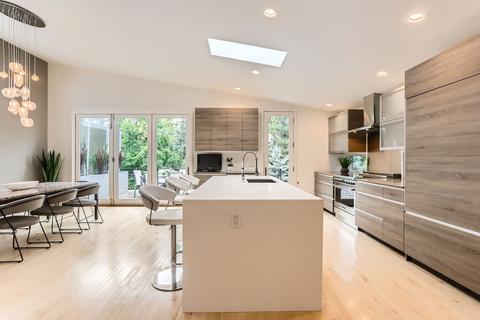
Defining “luxury” in real estate goes beyond simply attaching a high price tag it reflects a combination of exclusivity, prime location, and exceptional quality Nationally, luxury homes are generally considered the top 10% of sales by price, and more specifically, homes priced at roughly 2 to 3 times the average sales price in their local market Entry-level luxury typically starts at 1 5x the average, with ultra-luxury reserved for properties priced at 5x or more But true luxury also includes intangible factors: privacy, architectural distinction, smart and sustainable features, and proximity to lifestyle amenities
In Boulder County, current data points to an overall median sale price of approximately $739,000, with the City of Boulder’s median closer to $951,000 as of June 2025 (InfoSparks) Based on these figures and consistent with national benchmarks, the local luxury threshold for our reports now begins at $1 5 million At this level, buyers can expect more than just square footage they’re purchasing a lifestyle defined by design excellence, coveted neighborhoods, and high-performance features As the market continues to evolve mid-year, understanding where luxury begins helps both buyers and sellers position themselves confidently in one of Colorado’s most desirable regions
Core Market
Upper Mid-Market
Luxury
Upper Luxury
Ultra Luxury
Up to $745,000 Most of county-wide homes
$745,000 - $1.5M Nice neighborhoods, upgraded properties
$1 5M - $2 0 M Top ~10% across counties
$2 0M - $3 5M Top ~ 5% across counties
$3.5M + Exclusive estates, rare listings
When analyzing luxury real estate trends, the timeframe you choose can dramatically influence your perspective. A 3-year lookback (2022–2025) provides insight into current market dynamics highlighting recent price shifts, inventory changes, and buyer behavior post-COVID. This window captures the ongoing effects of low inventory, elevated construction costs, and continued demand for high-end features and lifestyleenhancing amenities. It’s particularly useful for buyers and sellers making decisions based ontoday'sconditions.
Expanding to a 5-year horizon (2020–2025) helps reveal broader market patterns, such as the pandemic-driven migration of remote workers into lifestyle-rich areas like Boulder County This period encompasses the full arc of the real estate boom, including surging demand for properties with home offices, expansive outdoor space, and privacy features now deeply embedded in luxury buyer expectations In contrast, data older than 2018–2019 often reflects outdated pricing and buyer psychology, and can skew market understanding. For clients, this means strategic decisions should lean on recent, relevant trends rather than long-term historical averages that no longer reflect the high-end market’srealities.
2019–2020 data is valuable not as a direct comparison for pricing today, but as a lens to understand how the market has evolved, the last relatively stable period before the pandemicupendedbuyerpriorities,interestrates,andmigrationpatterns.Forbuyersand sellers in 2025, it adds context what used to be considered luxury, how inventory levels havechanged,andwhichbuyerbehaviorsarenewversusenduring.,
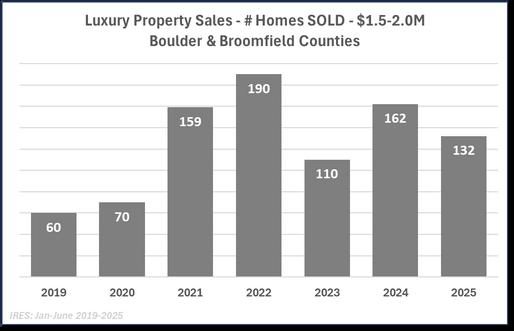
Luxury property sales between $1 5M and $2 0M surged dramatically following 2020, peaking in 2022 with 190 homes sold over three times the volume seen in pre-COVID 2019 Although sales cooled in 2023, the market rebounded in 2024 and remains elevated above prepandemic norms in 2025 with 132 homes sold year-to-date Through mid-year we’ve seen a 17 3% decrease in market activity in this price range, the only price range to dip so far in 2025
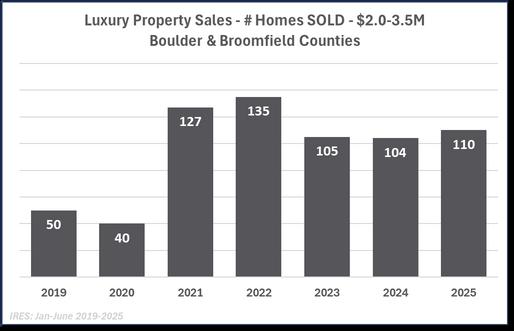
Luxury home sales in the $2 0M–$3 5M range saw explosive growth starting in 2021, more than doubling from prepandemic levels and peaking in 2022 with 135 sales While activity has moderated since then, sales volumes in 2023 through mid-2025 stabilized at well over double the 2019–2020 levels This sustained strength highlights a notable shift in buyer capacity and confidence at higher price points, even as the market adjusts to new economic conditions
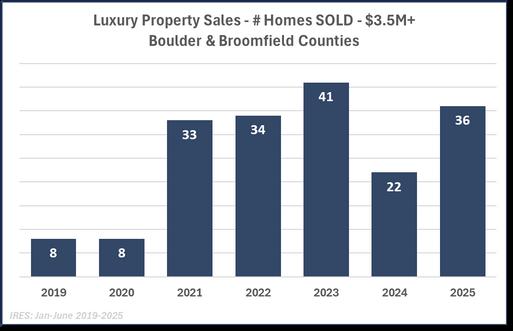
Homes priced above $3 5 million provide a striking comparison to prepandemic market norms Although 2024 experienced a sharp dip reflecting market corrections and higher borrowing costs 2025 shows a strong rebound in the first half of the year This sustained demand, even amid shifting economic conditions, underscores the depth and resilience of the ultra-luxury segment in this region
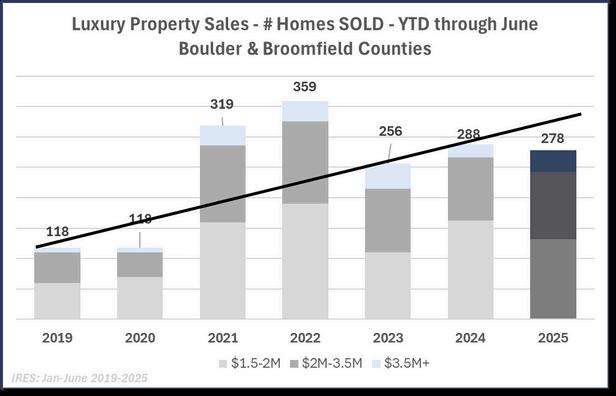
The figures here represent the total number of Residential and Attached units sold Farm & ranch, vacant land, and other property types are not included
These figures are YTD for the first half of the year, through June 2025.
Year over year the units sold in the market experienced an overall decrease of 3.5% in the # of units sold. In both charts, the black line represents a hypothetical trend line, with mostly constant yearly increases from 2019 to 2025. By year end both 2021 and 2022 ended as COVIDrelated “outlier” years, with the number of units sold and sales volume significantly above trend. We saw the market correct and return to trend and a more balanced market in 2023 and 2024. 2025 YTD is falling slightly behind that pace, behind 10 units from 2024, but ahead in volume by just over $50M, or an 8.3% increase.
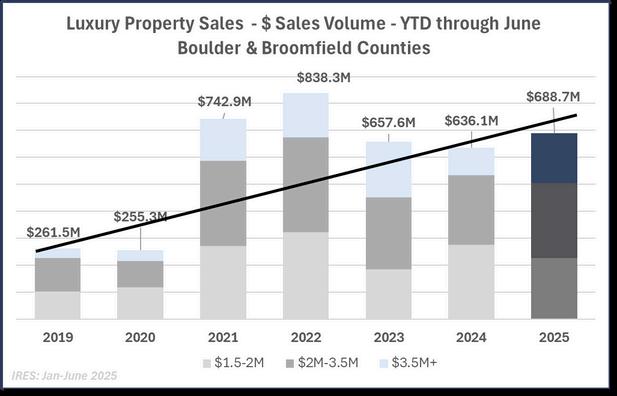
The figures here represent the combined $ sales volume for all Residential and Attached units sold Farm & ranch, vacant land, and other property types are not included
These figures are YTD for the first half of the year, through June 2025

This chart shows the monthly rate at which luxury properties were sold by price rangethis is sometimes referred to as the “burn rate” or absorption rate. This number may be relevant to sellers as it indicates how quickly or slowly the market is moving in a certain price and point in time.
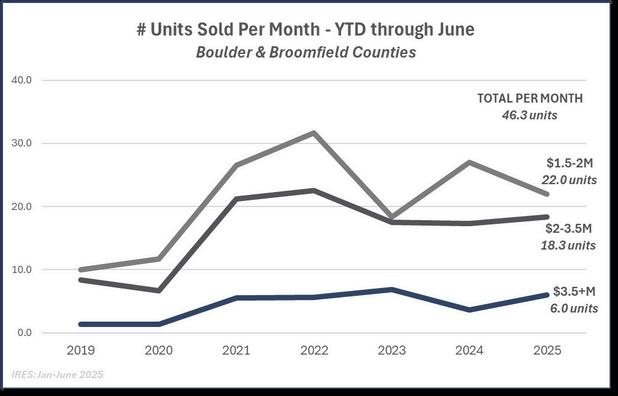
The$15-2Mpricebandhasbeenthemostaccessible,with220propertiessoldpermonth, andatanall-timehighotherthan2022whenitwas31.7. Averagedaysonmarket(DOM) was 47 days. In the $2-3.5M price band properties sold at a rate of 18.3 properties per month,up10unitslastyear,withaverageDOMhigherat74. Finallyforpropertiespriced over$3.5M,averageDOMwasactuallylowerat64,with6.0propertiessellingpermonth, the highest monthly absorption rate in this price range since 2023, indicating a strong turnoutofbuyersatthishighend
47 5% of all properties sold over $1 5M were sold in the $1 5-2M range, representing 33 0% of the total sales volume over $1 5M, which is the lowest % share for this price band since 2019 other than in 2023 Buyers tended slightly towards more conservative spending, even in luxury The % of sales in the $23 5M range stayed relatively stable at 40 2%, and sales over $3 5M ramped up from 15 9% in 2024 to 26 9% of total units sold in 2025, representing the highest % since 2019 other than in 2023
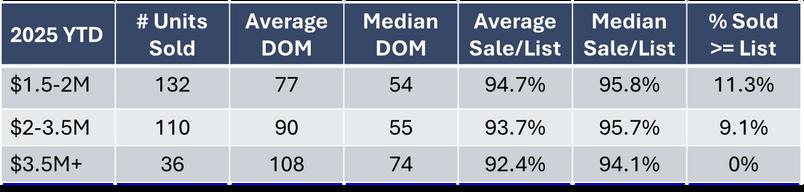
The amount of time properties remain on the market is an indicator of market pace and the strengthofdemand,asistheratioofthefinalsale pricetothelistpriceofthepropertyandthe%of properties that sell over list price In all price ranges,bothmedianandaveragesaletolistprice ratios are at the lowest levels ever since 2019 and perhapsbefore.
In2025,higher-endpropertiesaretakinglongerto sell and seeing deeper discounts from list price, with no homes over $3.5M selling above asking. Sevenofthose36homesdidhoweversellrightat the asking price. This reflects increased buyer selectivity, a narrower luxury pool, and the need for ultra-premium listings to be priced with precisionintoday’sshiftingmarket


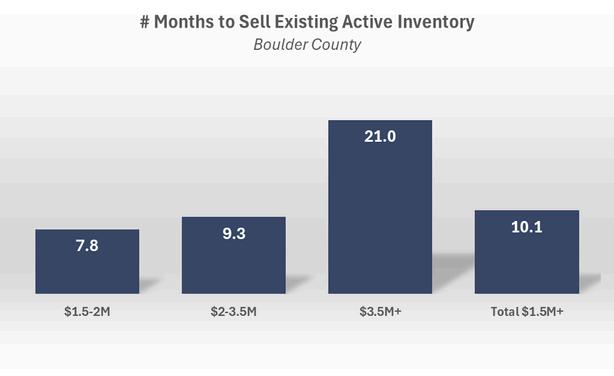
Using rate of sale numbers YTD and the inventory available at the time of this writing, we can predict that it will take over 10 months to sell all of the available inventory, in the unlikely scenario that no other inventory comes on the market during that time. The higher the property’s sale price, the longer it will take to sell because the pool of available buyers appears to now be more limited. This same time last year the conditions were more favorable for sellers. The # of months to sell the existing inventory at that time was only 5.2 months overall, 3.5 months for homes priced at $1.5-2M, 8.5 months for those priced $2-3.5M and 19.9 months for the highest price band of $3.5M+.
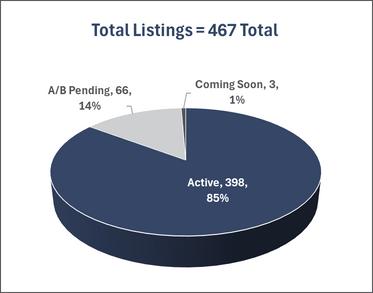
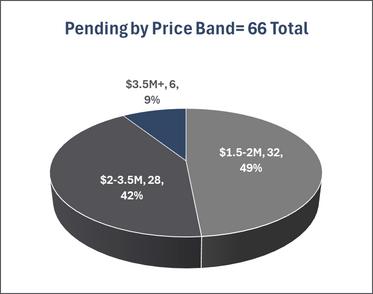
Only 14% of all active listings were in under contract / pending status and of those pending the vast majority, 60 of the 66 properties were under $3 5M and almost equally split between luxury and upper luxury
WE’RE LOCAL. WE’RE GLOBAL.
A recent Denver Business Journal article highlighted Cherry Hills Village as one of the nation’s hottest luxury housing markets; it’s zip code ranked #11 in the US for the second quarter of 2025 according to a recent weighted ranking based on listings-to-sales ratio, average list price, average sale price and how long listings sat on the market before being sold
Not nearly as high but also on the list was 80304 in North Boulder at #113 where there was a 7.32% growth in average sale price between 2024 and 2025, increasing from $1,526,189 to $1,637,969 Still the changing market dynamics felt elsewhere around the country echo strongly in Boulder County’s luxury market, where elevated inventory levels and shifting buyer behavior particularly among ultra-premium listings are prompting longer market exposure and pricing recalibrations As affluent buyers continue seeking value, lifestyle, and location, even established luxury markets like Boulder are now requiring sharperpricingstrategiesandmarketingdifferentiation.
These will shape the luxury real estate market in Boulder and Broomfield Counties for the remainder of 2025.
More listings, especially in the $2M+ and $3 5M+ ranges, will increase competition among sellers
Luxury homes may take longer to sell, particularly ultra-luxury properties, as buyer urgency softens
Tighter
Fewer homes sell at or above list price, making strategic pricing more critical.
High-end buyers will be more cautious and expect quality, location, and amenities to justify premium prices.
The $1.5–$2M segment will remain relatively active compared to higher tiers, driven by lifestyle and relocation buyers