This material is based upon work supported by the U.S. Department of Energy’s Office of Energy Efficiency and Renewable Energy (EERE) under the Hydrogen and Fuel Cell Technologies Office (HFTO), Congressionally Directed Spending Project, Award Number DE-EE0010706. The hydrogen economy has experienced rapid change in recent years, creating a growing demand for a highly skilled workforce. This effort is led by the University of Toledo, in collaboration with Case Western Reserve University, Cuyahoga Community College, Lorain County Community College, Northwest State Community College, the Ohio Aerospace Institute, Owens Community College, and the Workforce Intelligence Network.
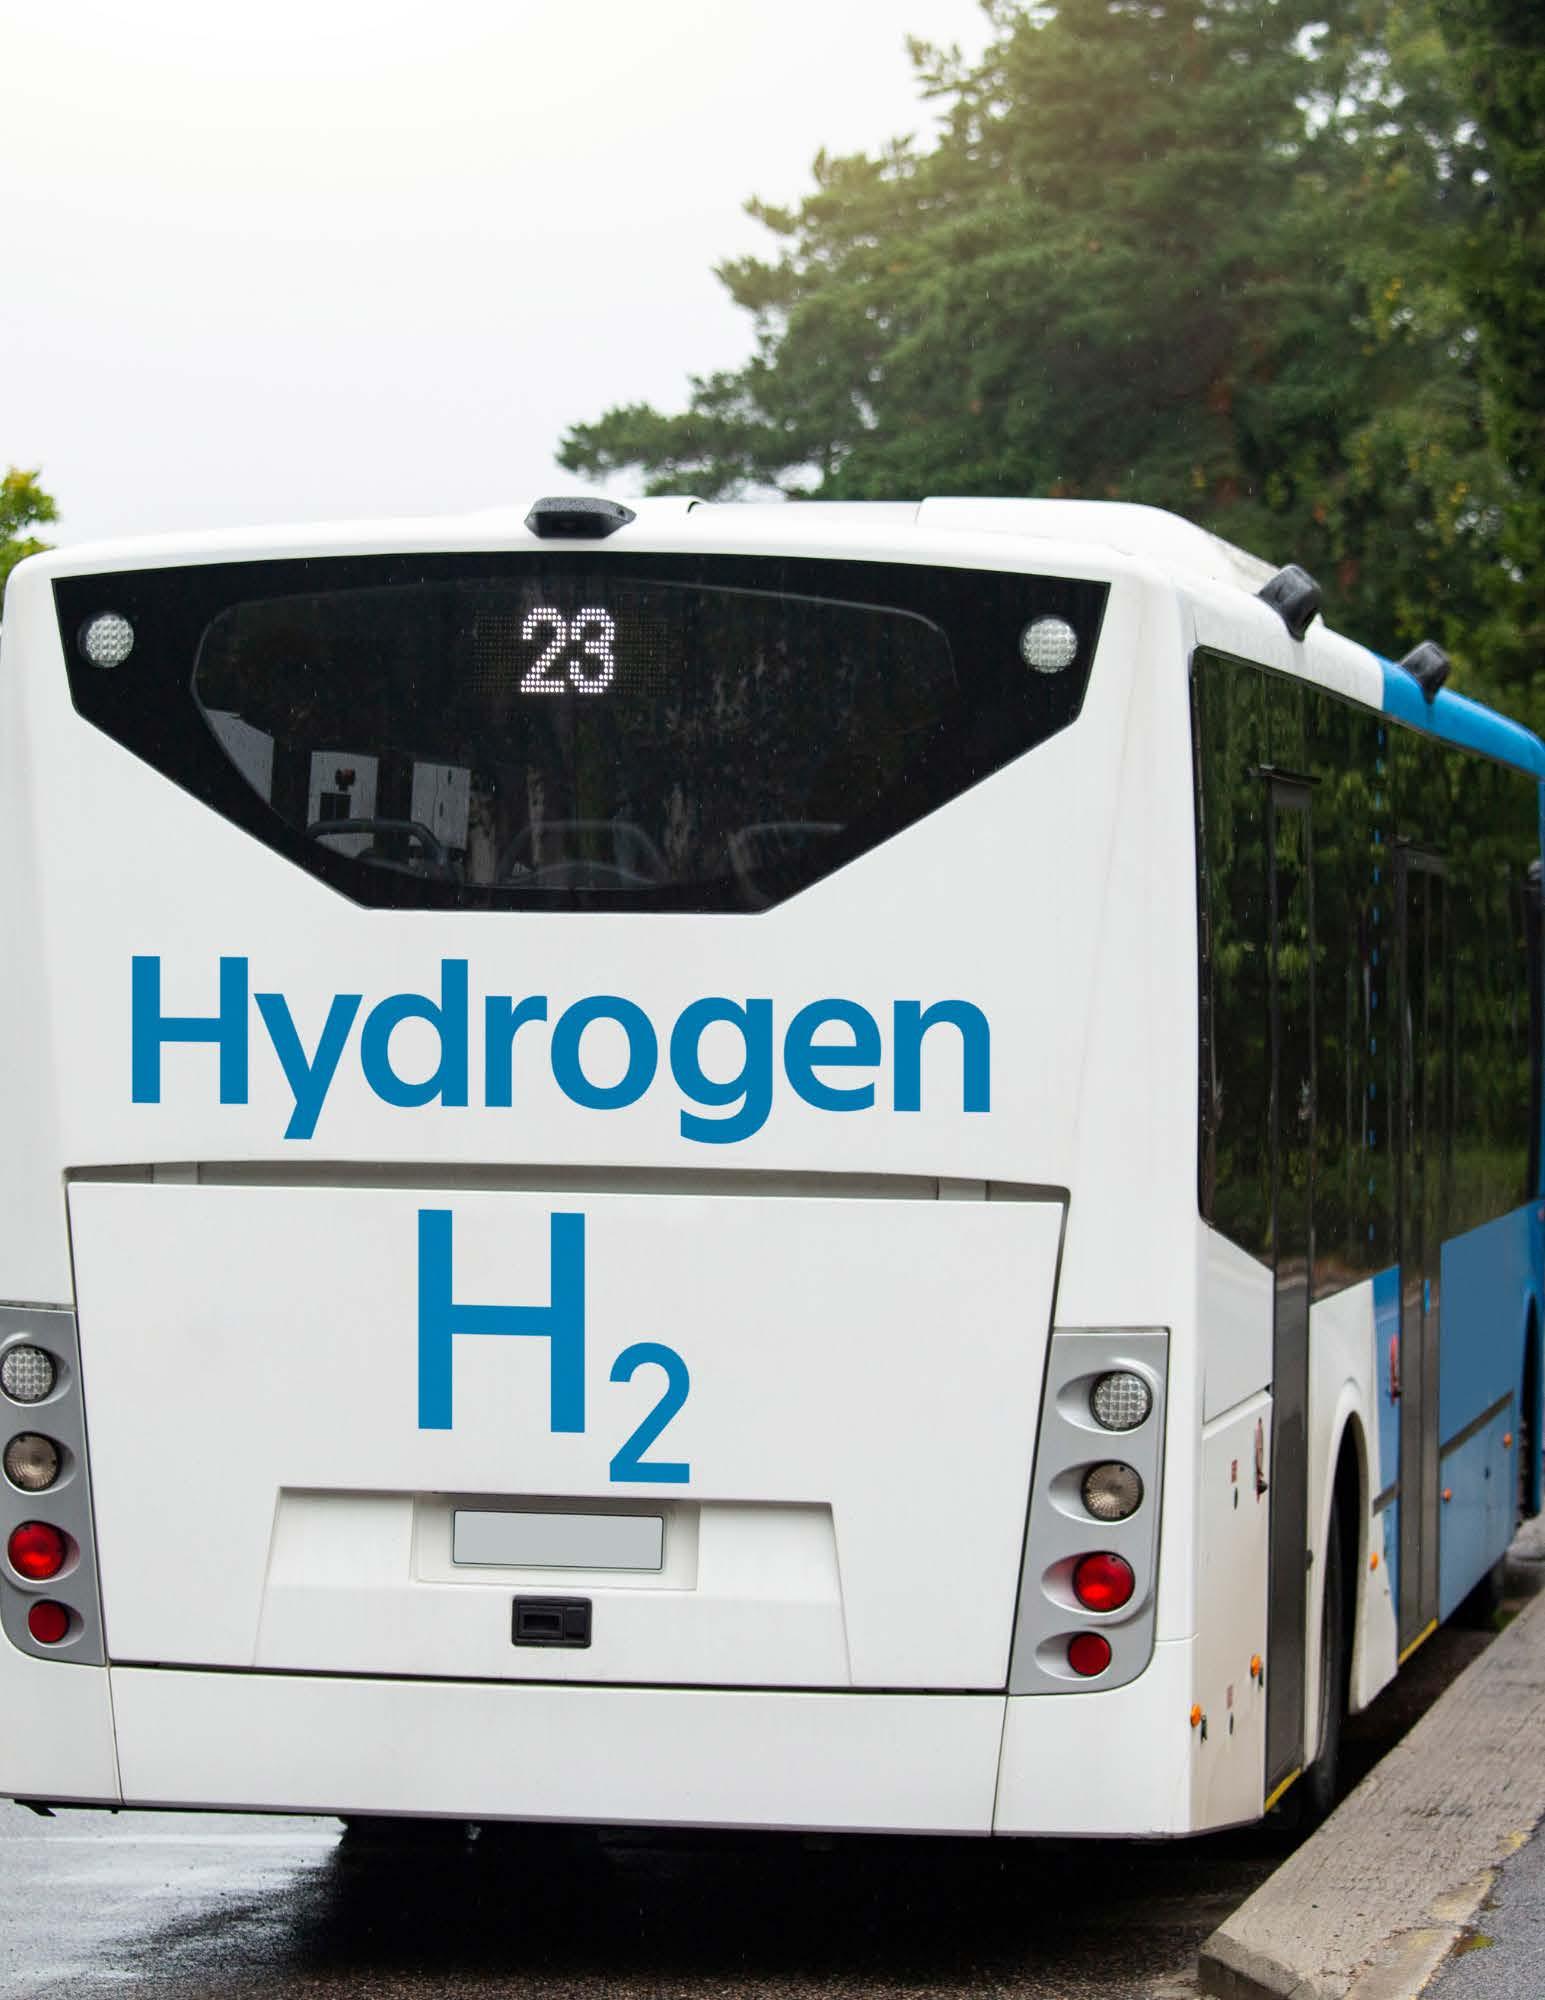
This project seeks to identify current workforce needs and gaps related to technician, skilled trades, scientist, and engineering roles within the hydrogen sector. Insights from this assessment will guide the development of training pathways and credentialing programs aligning with industry requirements for building, maintaining, and utilizing hydrogen infrastructure safely and effectively. The transition to a clean energy economy represents one of the most significant and transformative opportunities of our lifetime. At the heart of this shift lies hydrogen—a versatile energy carrier poised to decarbonize sectors ranging from heavy industry to long-haul transportation and grid-scale energy storage. For the states of Michigan and Ohio, this is not a distant vision; it is a current reality with profound implications for regional prosperity and workforce development.
This report provides a critical, comprehensive look at the diverse applications of hydrogen, spanning nearly a dozen current and potential sectors, from steel decarbonization and glass manufacturing to energy storage and transportation. Our analysis confirms the industry's significant potential to revitalize manufacturing, create new industrial ecosystems, and establish the region as a leader in clean energy technology.
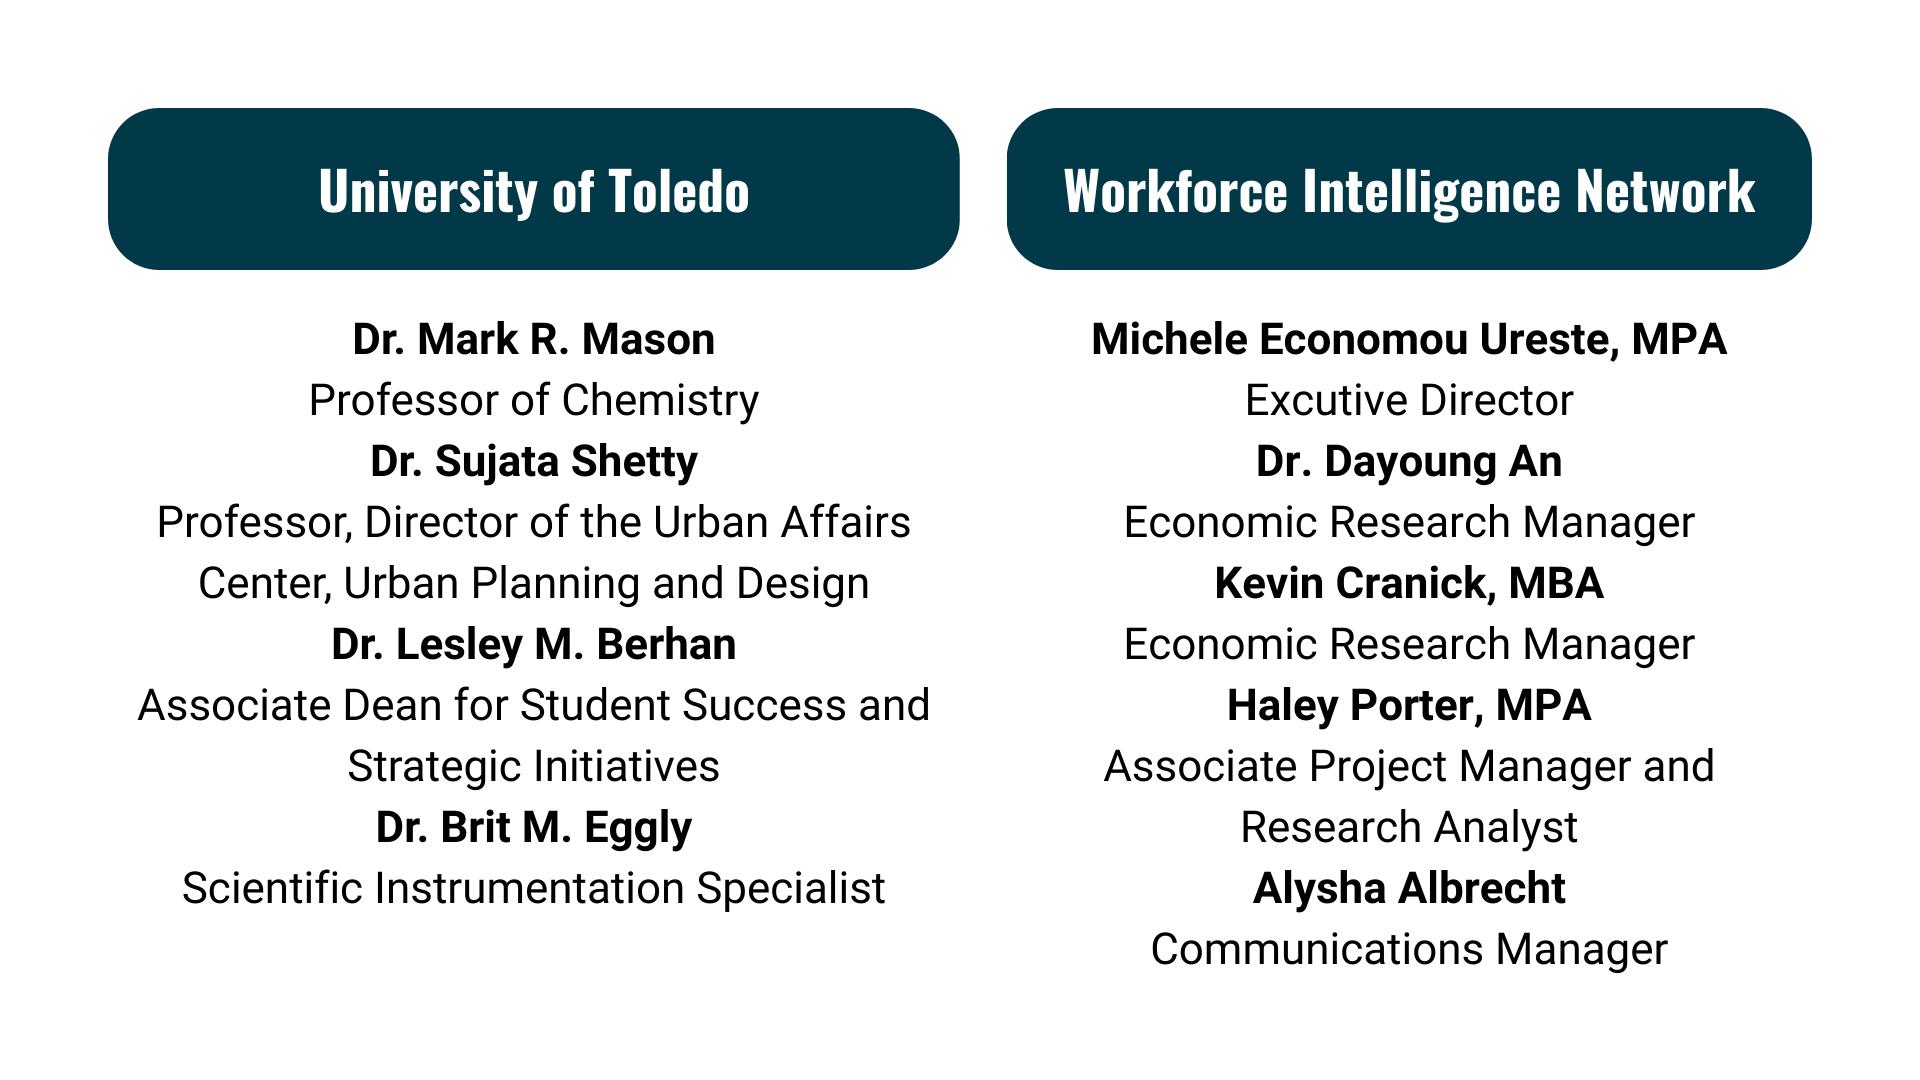
However, opportunity comes with an urgent challenge. Our research, which includes direct feedback from employers across both states, has illuminated a growing concern: the talent gap. While the technical applications for hydrogen are diverse and rapidly expanding, the current talent pool is not yet equipped with the specialized skills needed for this evolving industry. This significant achievement is a direct result of the inter-team coordination and invaluable contributions made by both the University of Toldo and the Workforce Intelligence Network (WIN), whose project contributors are listed below.
Executive Summary
Social network analysis (SNA) is a visual and mathematical analysis of how people interact, exchange information, learn, and influence each other. A successful, regional industry ecosystem depends on a strong network of engaged and aligned partners. A mature, thriving sector will often bring firms and institutions together to coordinate information sharing, seek collaborative opportunities, and maximize and expand the workforce.
Social network analysis shows how a group of businesses and organizations work and influence each other, rather than showing the way people think they relate. SNA can show key organizations that are "core influencers" or those with less connectivity. It shows the human system and actual process. SNA is a mirror rather than a report card that can help identify where bridges should be built.
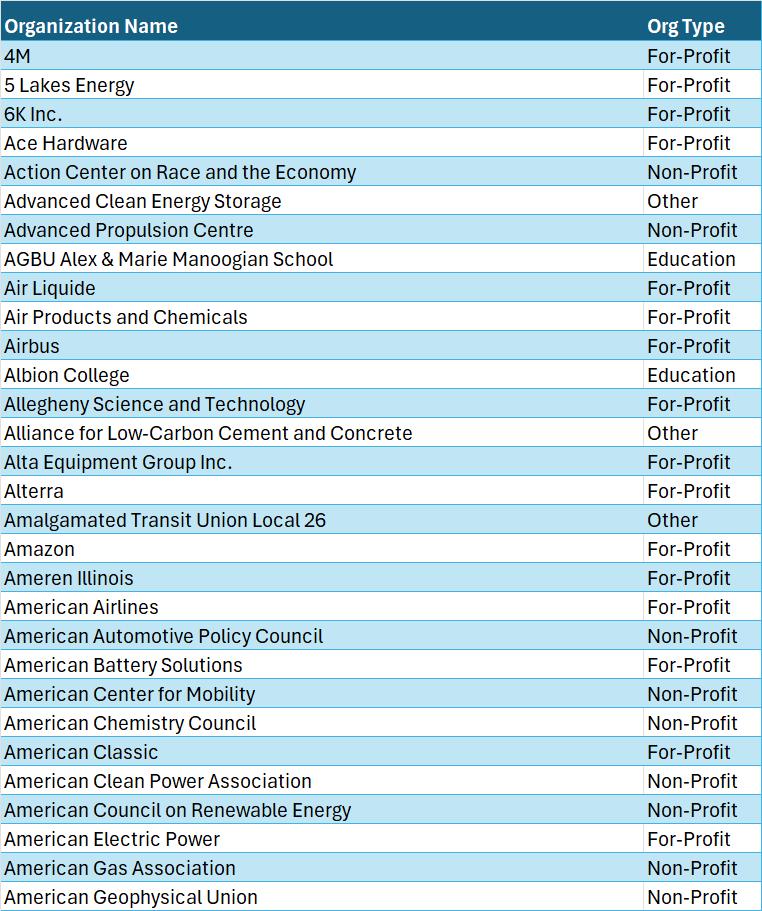
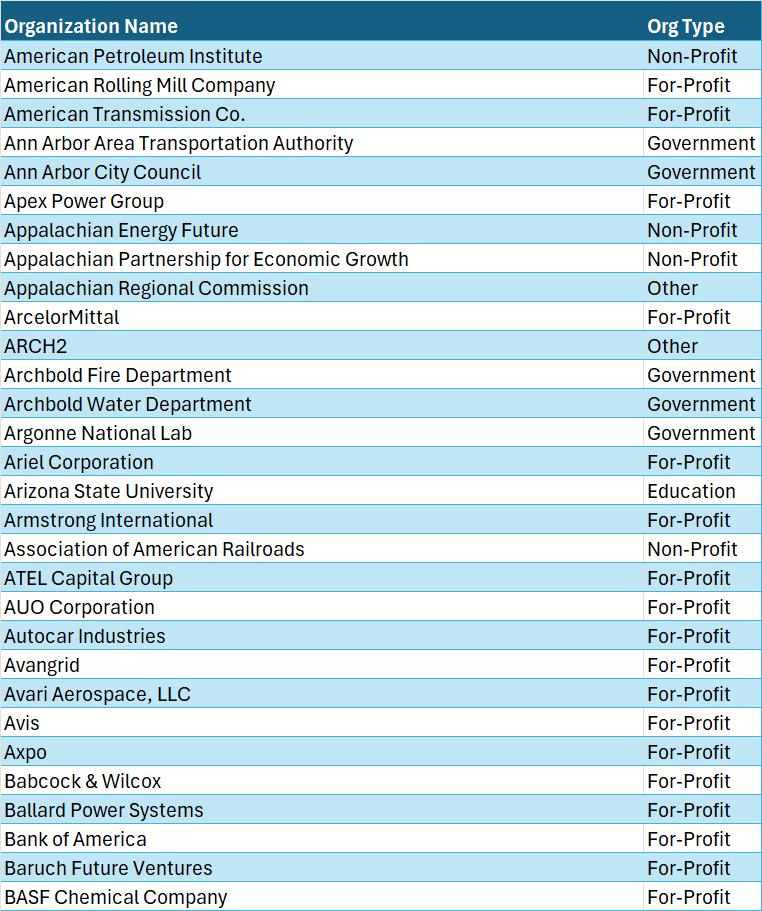
By applying the "snowball sampling" method, WIN identified publicly available data sources related to the hydrogen economy, such as media articles, newsletters, meeting rosters, and websites. The Workforce Intelligence Network identified a total of 739 nodes (organizations) within the Michigan and Ohio hydrogen ecosystem. These nodes resulted in 2,317 total connections--public business ties between the identified organizations.
The top five most influential organizations within the Hydrogen ecosystem are the U.S. Department of Energy, Midwest Alliance for Clean Hydrogen (MachH2), State of Michigan, Michigan Economic Development Corporation (MEDC), and ClevelandCliffs.
The U.S. Department of Energy is the most connected organization within the Michigan and Ohio ecosystem. Other strongly connected organizations include General Motors, ARCH2, the University of Michigan, the University of Toledo, and Honda.
A social network analysis ecosystem mapping survey was conducted among hydrogen stakeholders in Michigan and Ohio. The survey yielded 51 responses from 38 unique organizations. The survey results provided another layer of depth and understanding of the ecosystem, with respondents indicating the degree of interactions with other organizations.
This work supports research for curriculum development efforts by the University of Toledo and partners. It is also an opportunity for Michigan and Ohio to establish a leadership role in the hydrogen space through more relationship-building and networking opportunities. Developing these meaningful relationships could connect start-ups with larger companies.
The need for hydrogen mapping and collaboration extends beyond innovation, supply chain, and marketing purposes, to a need for trained and capable talent for the hydrogen sector. A recent literature review and analysis conducted by WIN, identified 26 unique occupation codes linked to hydrogen-specific projects. Due to the need for talent in hydrogen-related occupations, there is an opportunity for collaboration around the creation of a common set of workforce requirements. Funding could support development of publicprivate partnerships to create innovative opportunities in hydrogen. Collaboration within the network on training initiatives can set standards for workers across the industry and region and can prove cost effective for the companies involved.
Project Overview
Social network analysis (SNA is a visual and mathematical analysis of how people interact, exchange information, learn, and influence each other. A successful, regional industry ecosystem is dependent on a strong network of engaged and aligned partners. A mature, thriving sector will often bring firms and institutions together to coordinate information sharing, seek collaborative opportunities and maximize and expand the workforce. However, there are serious challenges to achieving this.
Collaboration can be challenging across large geographies or among partners with distinct industrial histories. Today, the hydrogen ecosystem is characterized by the continued strength of legacy industries. This includes petroleum refining, petrochemicals production, and ammonia production, which have long served as the backbone of hydrogen utility. However, the landscape is expanding as hydrogen increasingly serves as a vital energy storage material and carrier for emerging sectors. This includes its integration into automotive, heavy trucking, aviation, and marine transport, as well as its role in decarbonizing heavy industries like steel production and potentially glass manufacturing.
To help the industry address these challenges, WIN, on behalf of the University of Toledo, has undertaken a social network analysis of regional hydrogen and hydrogen adjacent stakeholders, broadly defined across industry sectors, to identify where leadership, partnerships, innovative thinking, and collaboration are already occurring. This information will be used to examine preexisting partnerships, bringing in new leaders who can help improve the health of the regional
hydrogen industry network and various nodes of economic activity (e.g., fueling, manufacturing, decarbonization, etc.) that are essential to it. This overview, methodology, and social network map addresses the ecosystem related to the hydrogen ecosystem.
Goal
The goal of this analysis is to reveal key leaders who are missing from “the table,” and others who might provide critical thinking or serve as points of intersection across key initiatives. The intent is to establish a baseline understanding of the health of the regional hydrogen ecosystem, with a deliberate focus on improving the health of that ecosystem over time. Well-connected ecosystems have a history of learning and innovation that outperform poorly connected regions with poorlyconnected participants.
What is social network analysis?
Social Network Analysis (SNA) turns information about relationships into visual maps that reveal the dimensions of those relationships (shape, depth, concentration, etc.). Differently organized networks benefit or hinder communities in different ways. Research shows that “smart networks” are the most adept at sharing exemplary practices, spreading new innovations, exchanging information, undertaking new projects, maximizing resources, and generally collaborating.
SNA can be used to identify gaps, holes, redundancies, or barriers in communication or engagement of key partners and stakeholders; identify potential new stakeholders; develop a strategy to improve the depth and breadth of networks where needed; and improve collaboration across the region and within sub-regions or issue-/ organization-specific communities.
SNA has been applied successfully in numerous communities undergoing structural economic transformation and in businesses seeking to improve processes or other outcomes. SNA will allow the region to identify and track the following metrics:
• Awareness: Who knows what is happening in the network? How likely is it that information will spread throughout the network?
• Influence: Who are the major influencers in a specific community or region? To whom are people looking for information and insight? How likely are people to positively influence others?
• Connectors: Who links people who would not otherwise be connected? How connected are parts of the network?
• Integration: What is the overall network health? Who are the network leaders?
• Resilience: How dependent is the network on a few individuals?
The mapping process
Network maps were created using publicly available data and a simple software program.
Each node represents an organization that was identified as having a role in Michigan or Ohio's hydrogen ecosystem, whether this role is as a business developing hydrogen vehicles, an electrolyzer business providing components to support these products, an association, a membership organization, an educational institution training the needed talent, or a nonprofit convening stakeholders of this industry.
The power of network mapping comes from the ways communities use the information after it is collected. It can be used to convene interested individuals in solution-based activities and foster a more effective referral-based system.
Increased communication and collaboration can:
• Decrease the number of steps needed to distribute information to everyone in the network.
• Improve programs, projects, and services because of more and better information. This is particularly important in a referral network, where resource providers should know each other’s strengths and services so that they can point clients in the right direction for assistance.
• Identify opportunities for joint action.
• Create momentum around collaboration.
• Spread innovation and new ideas throughout the network to address common challenges.
The mapping software helps illustrate organizations that have an increasing presence (more ties to others in the space) on a sliding scale. The outer zones of the map typically have 1 or 2 connections to others in the space while the inner core holds multiple redundant connections to other wellconnected players in the space. Most business ecosystems function as a core-periphery network, with strong redundant connections in the core and more diverse radial connections at the periphery. It is through peripheries that new knowledge and information flow from one cluster to another.
Findings and Analysis:
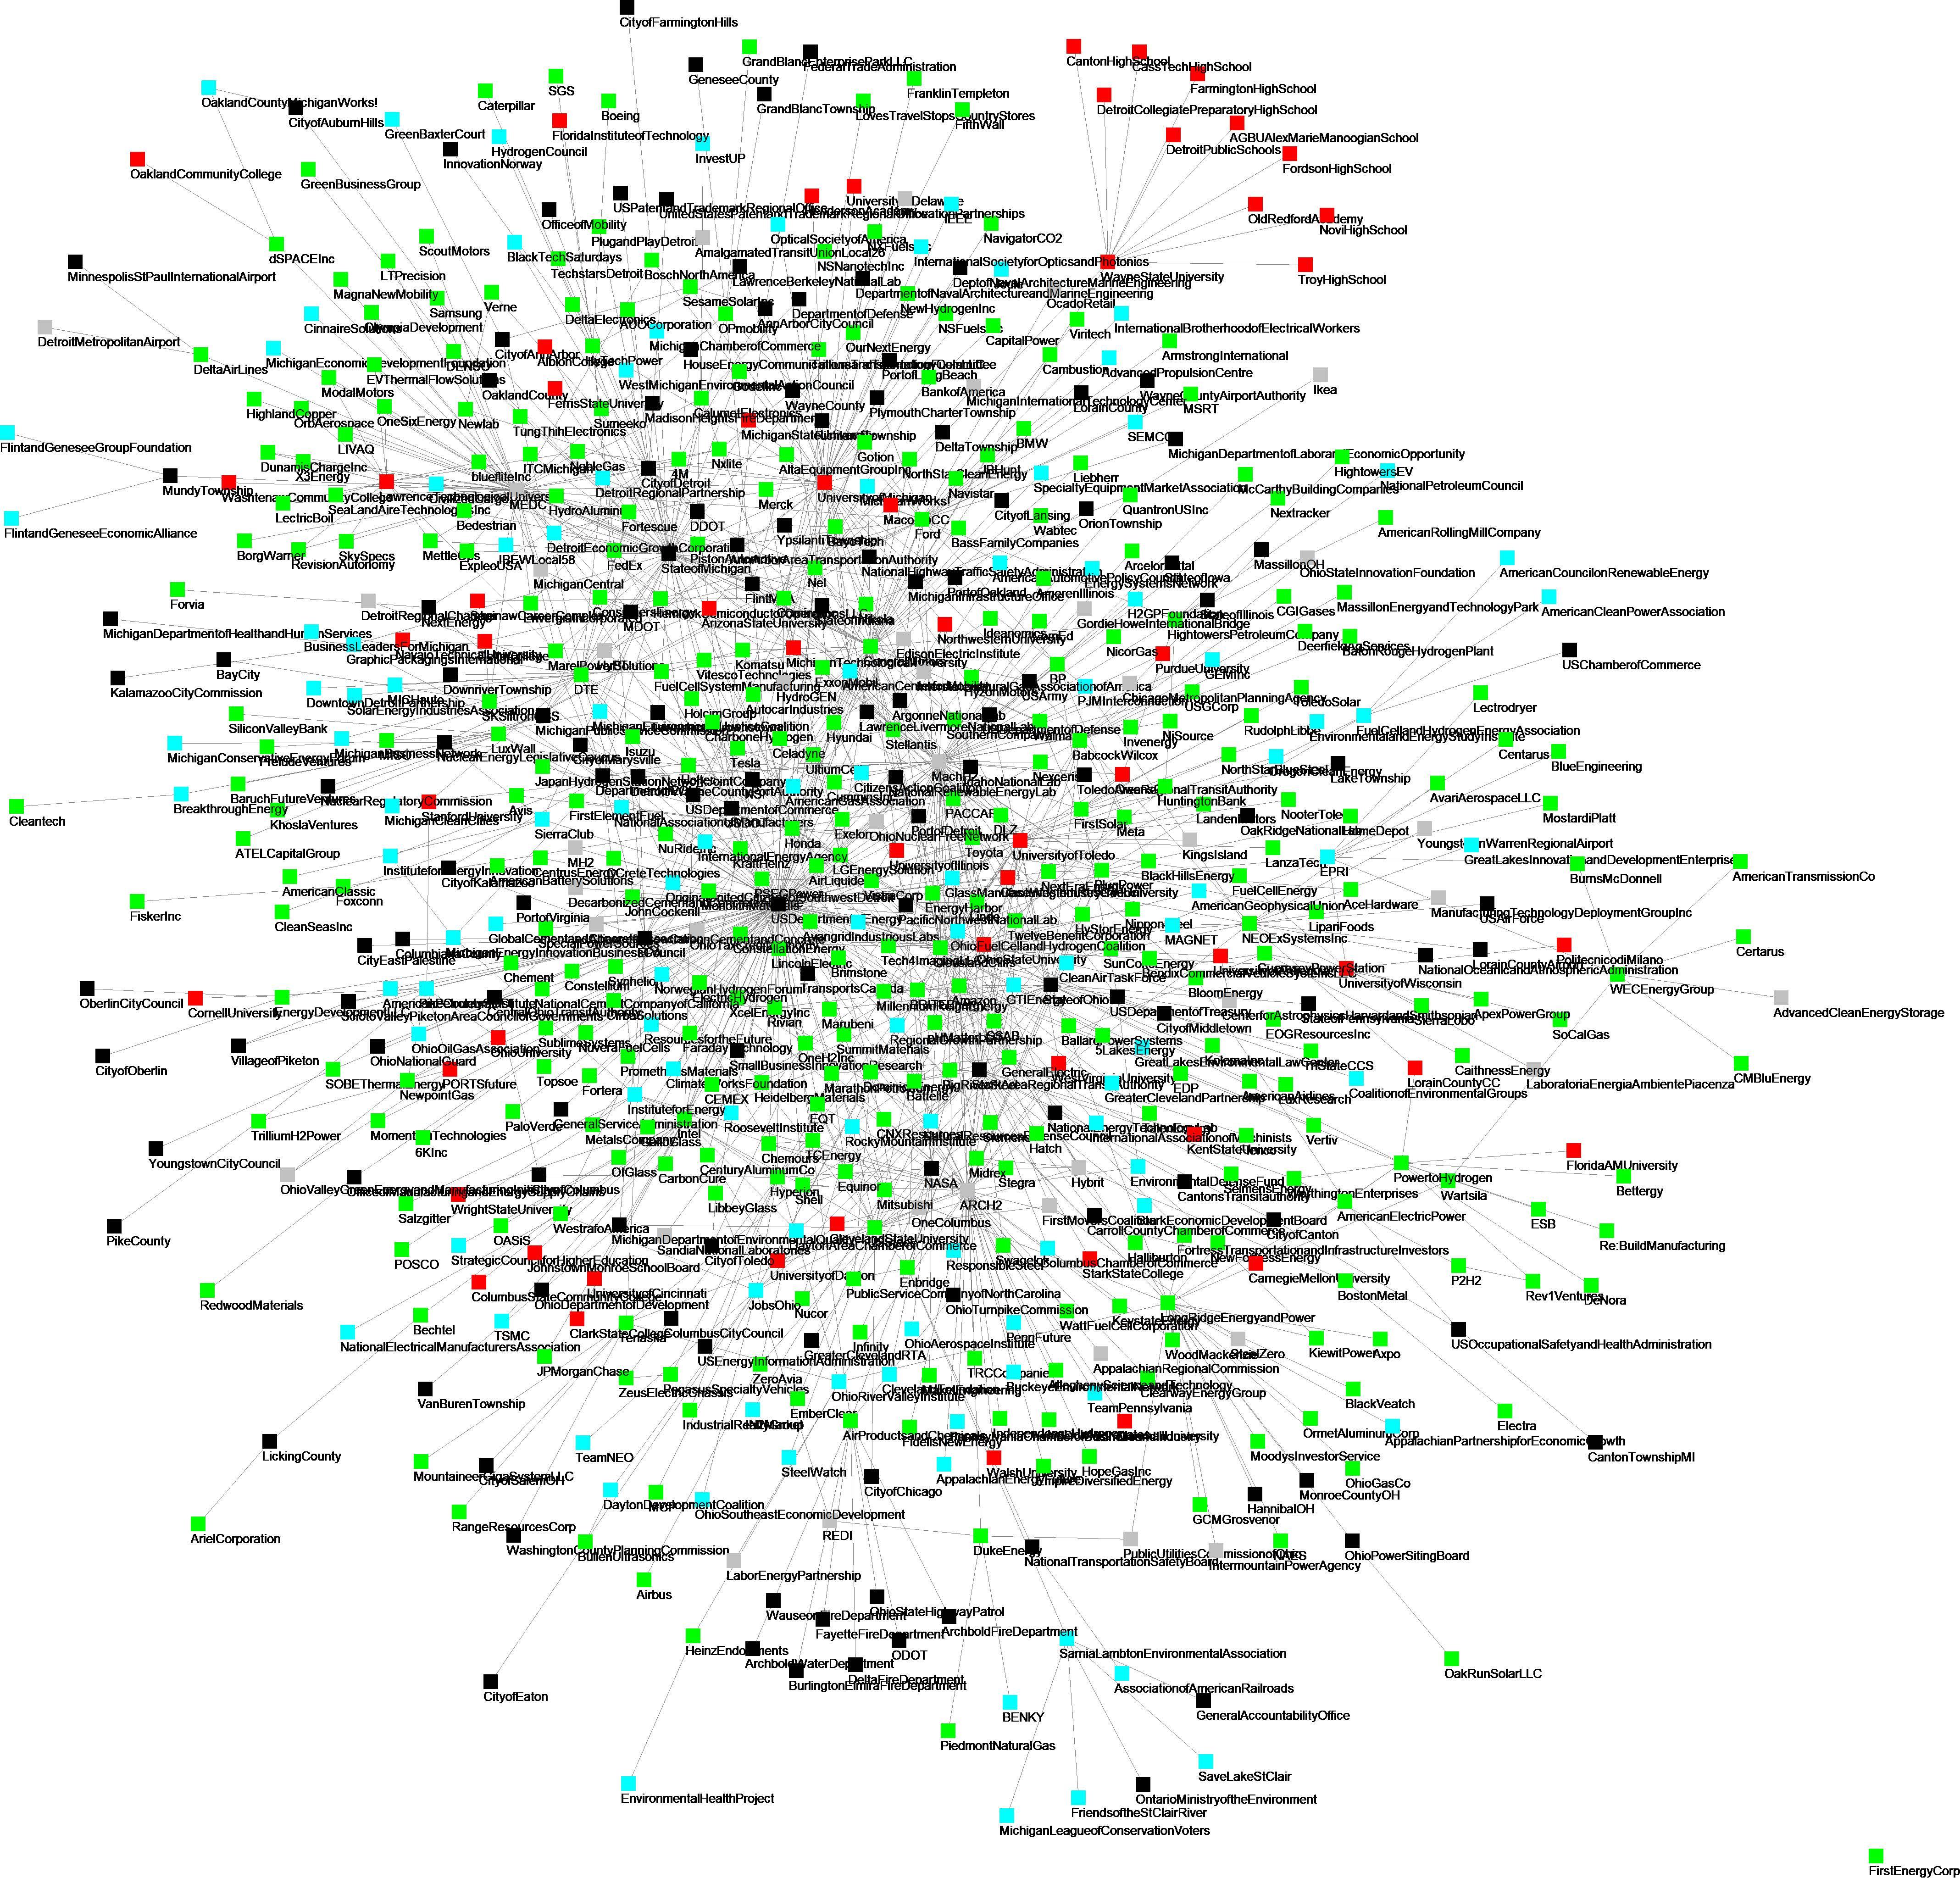
By conducting the Hydrogen Social Network Analysis, WIN researchers revealed a total of 739 nodes within the Michigan-Ohio ecosystem. These nodes demonstrated 2,317 total connections.
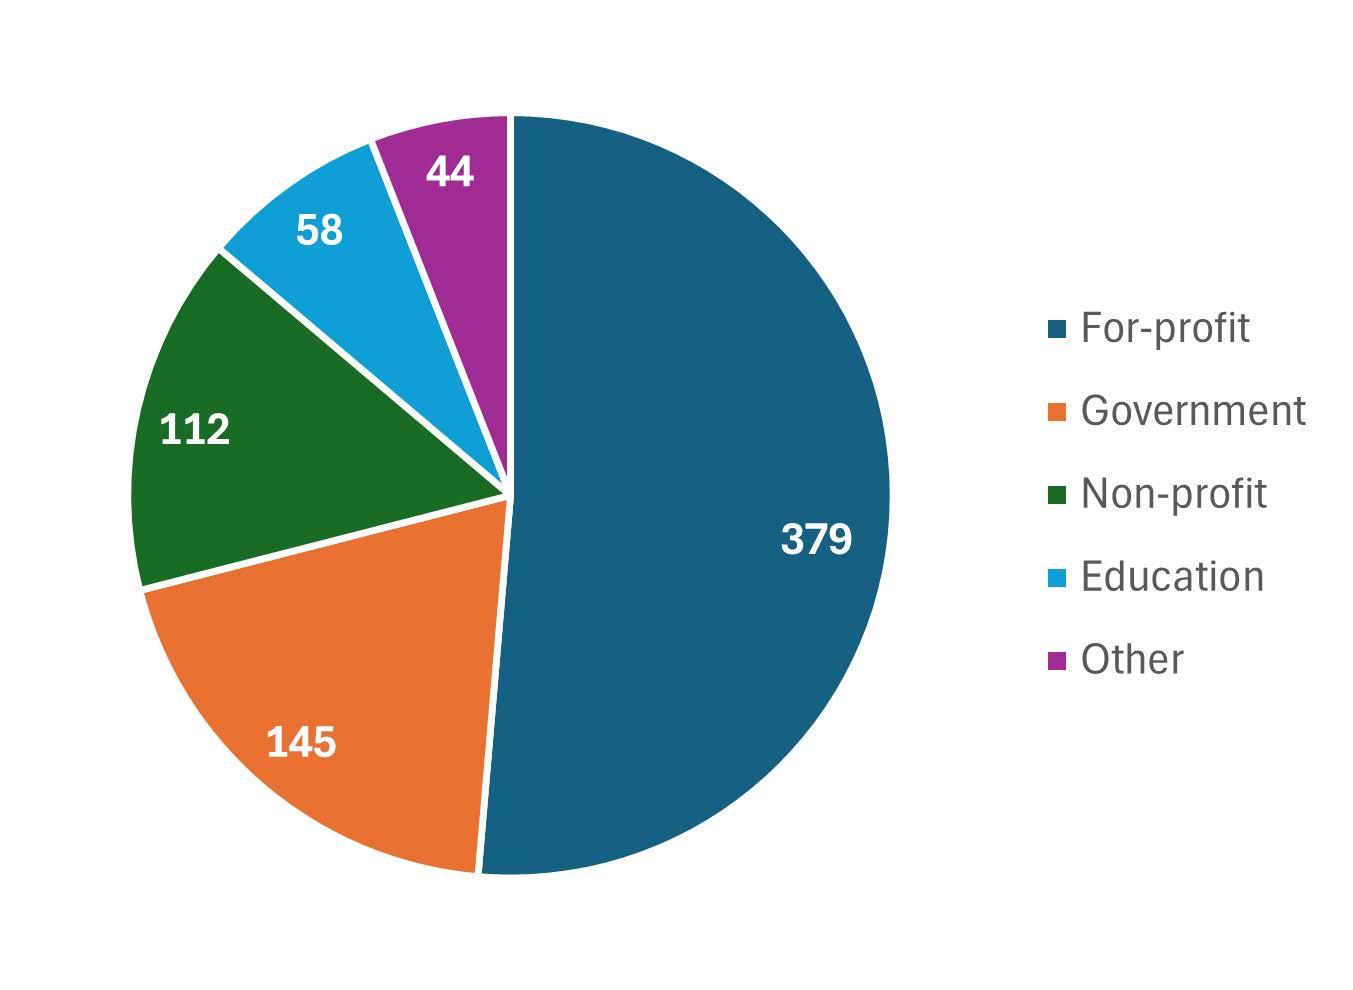
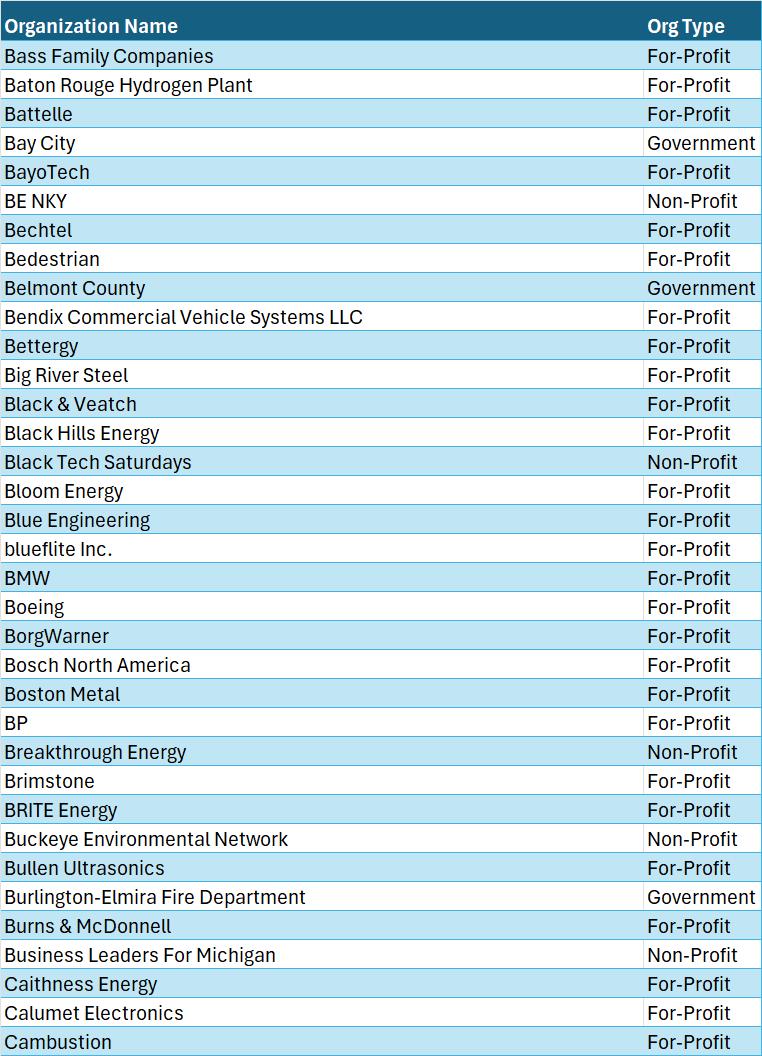
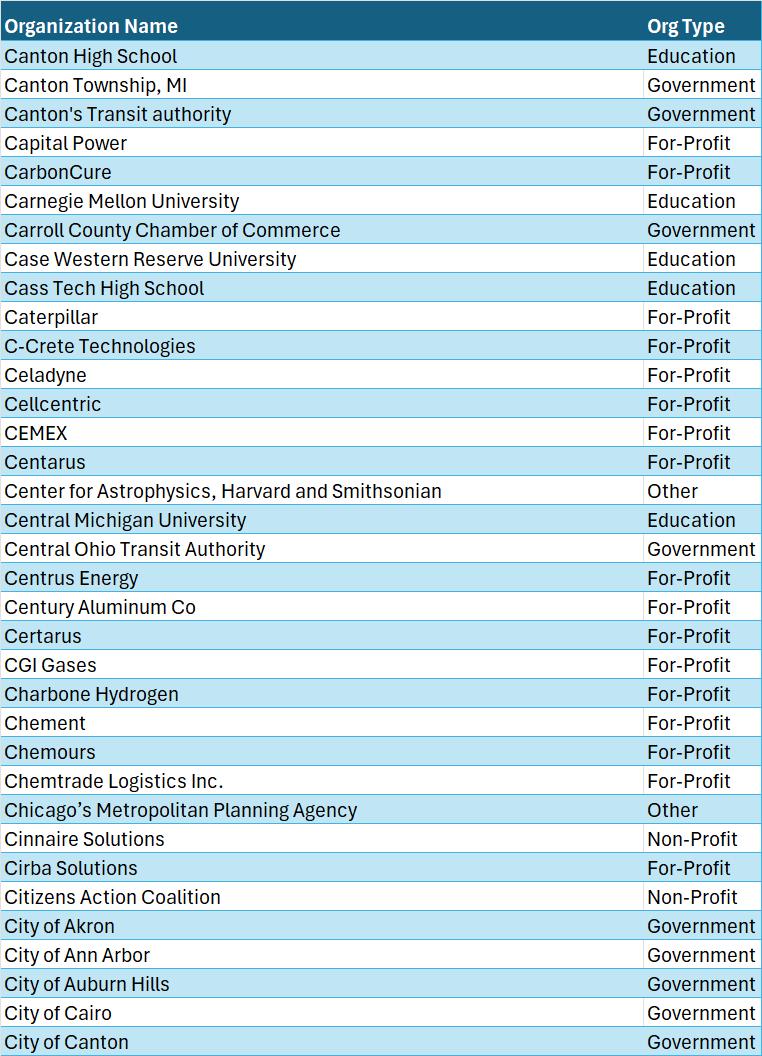
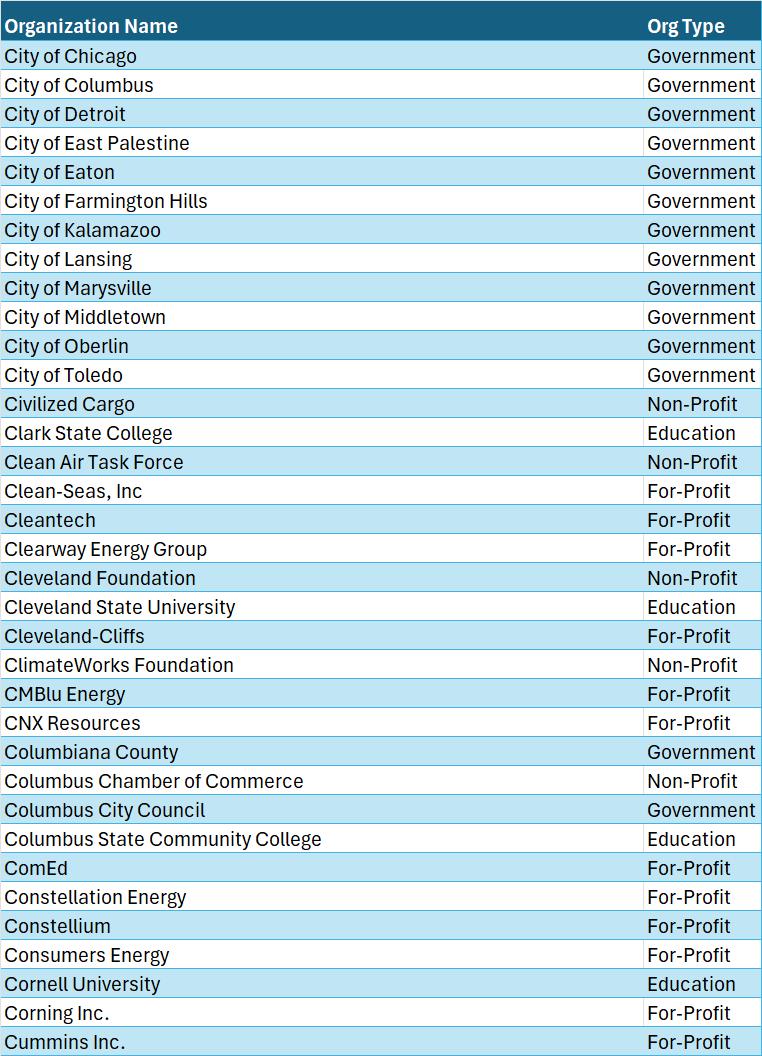
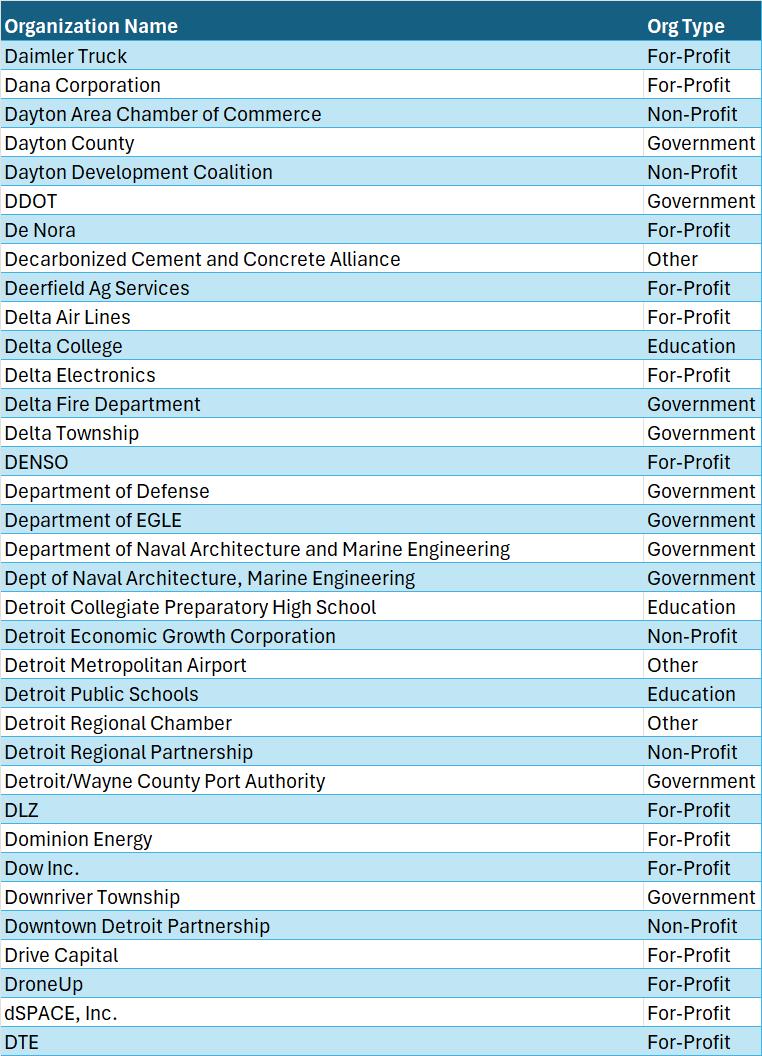
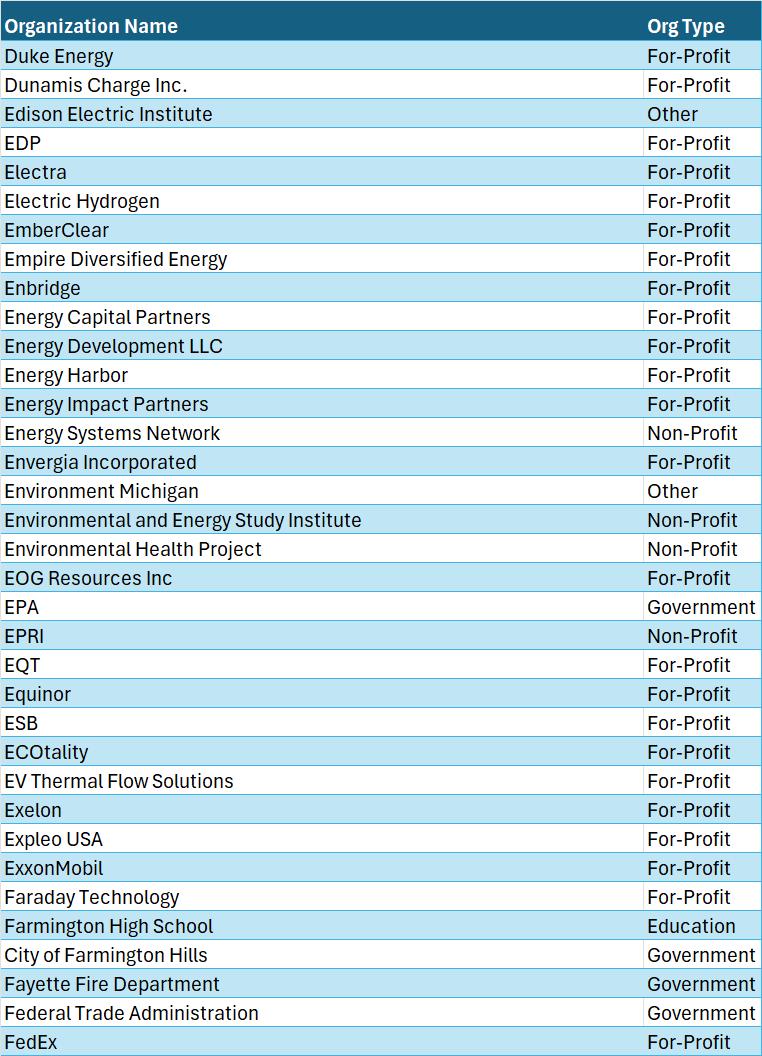
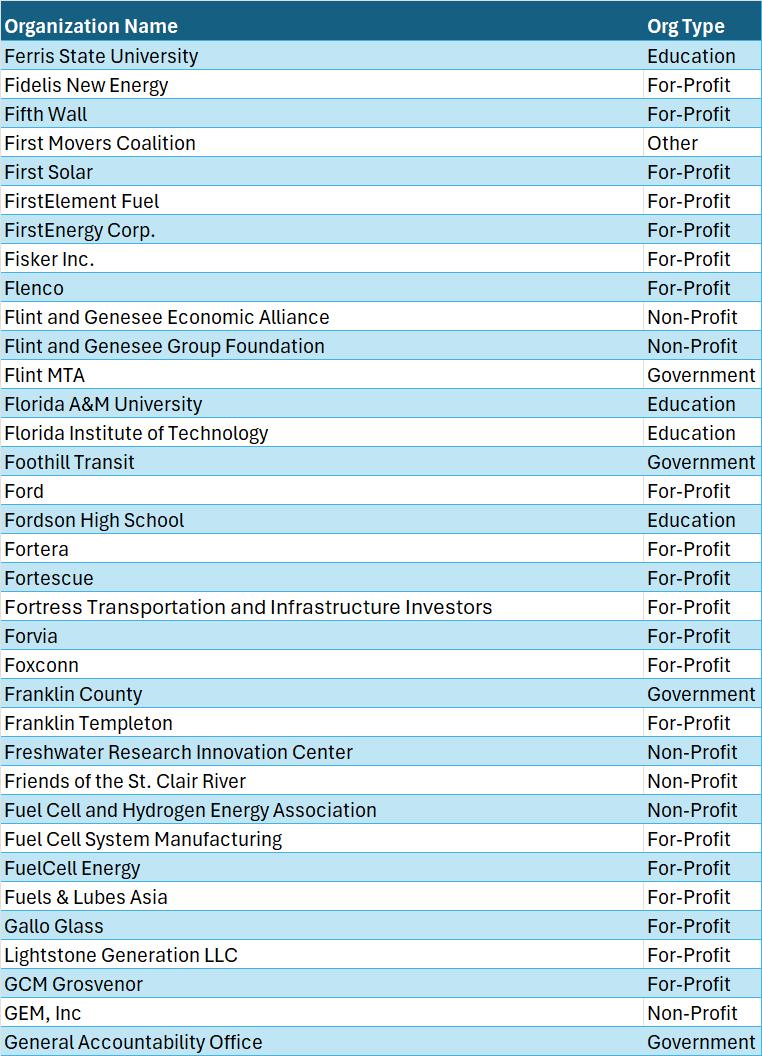
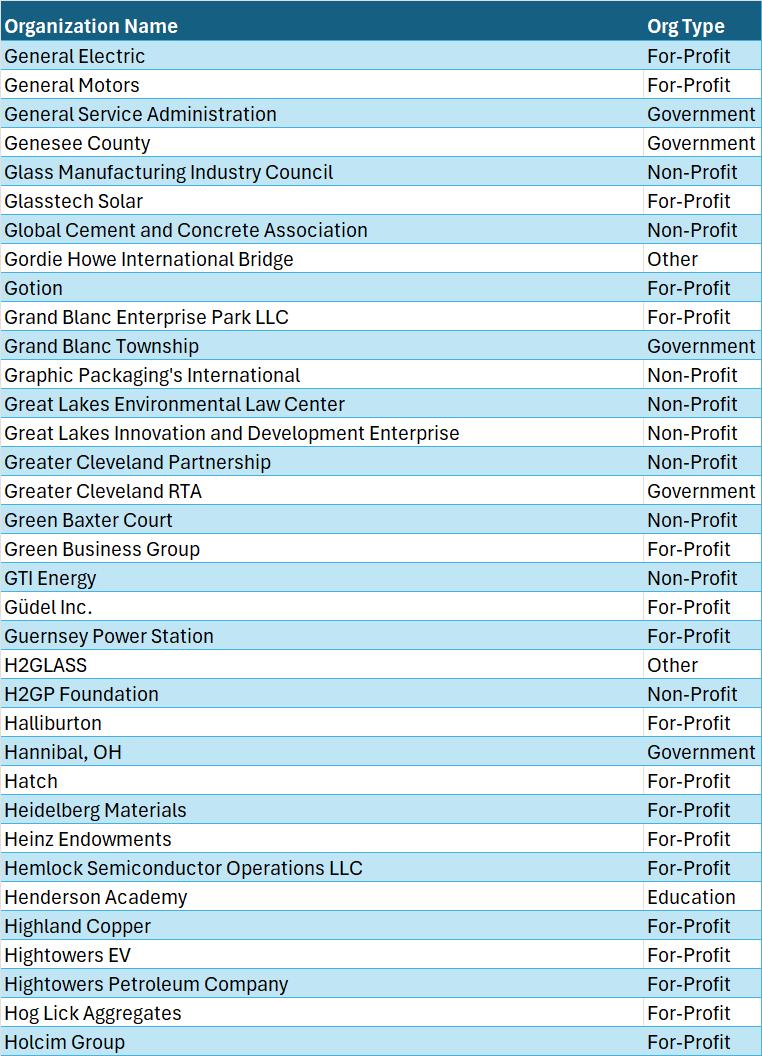
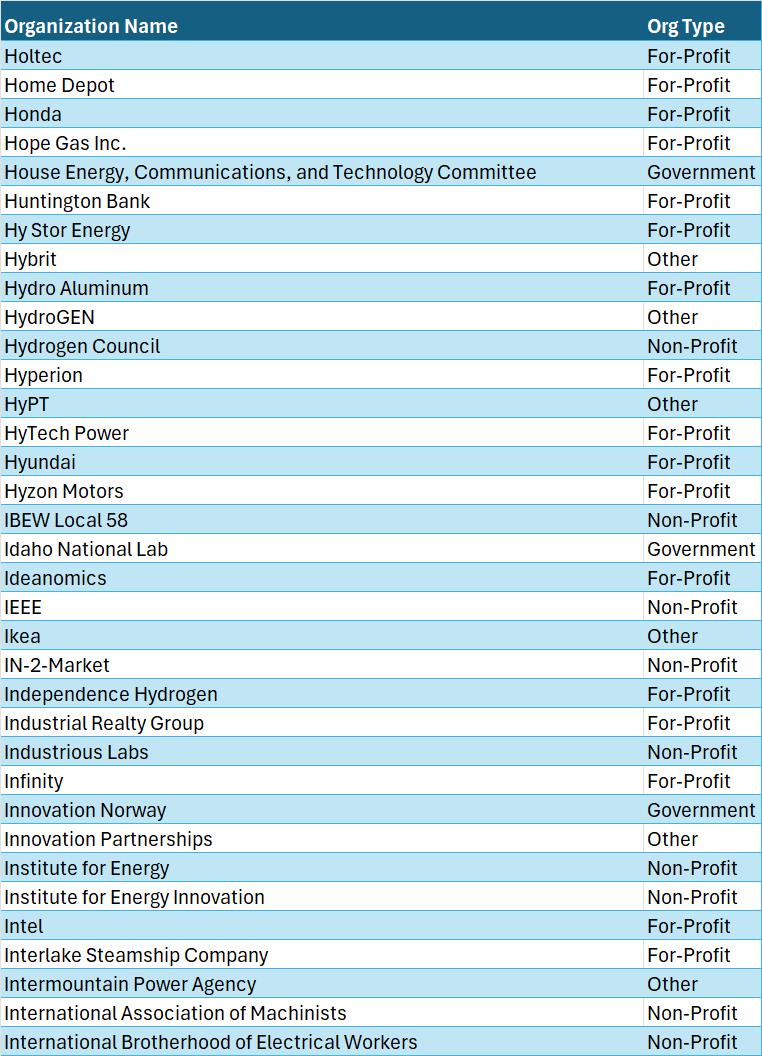
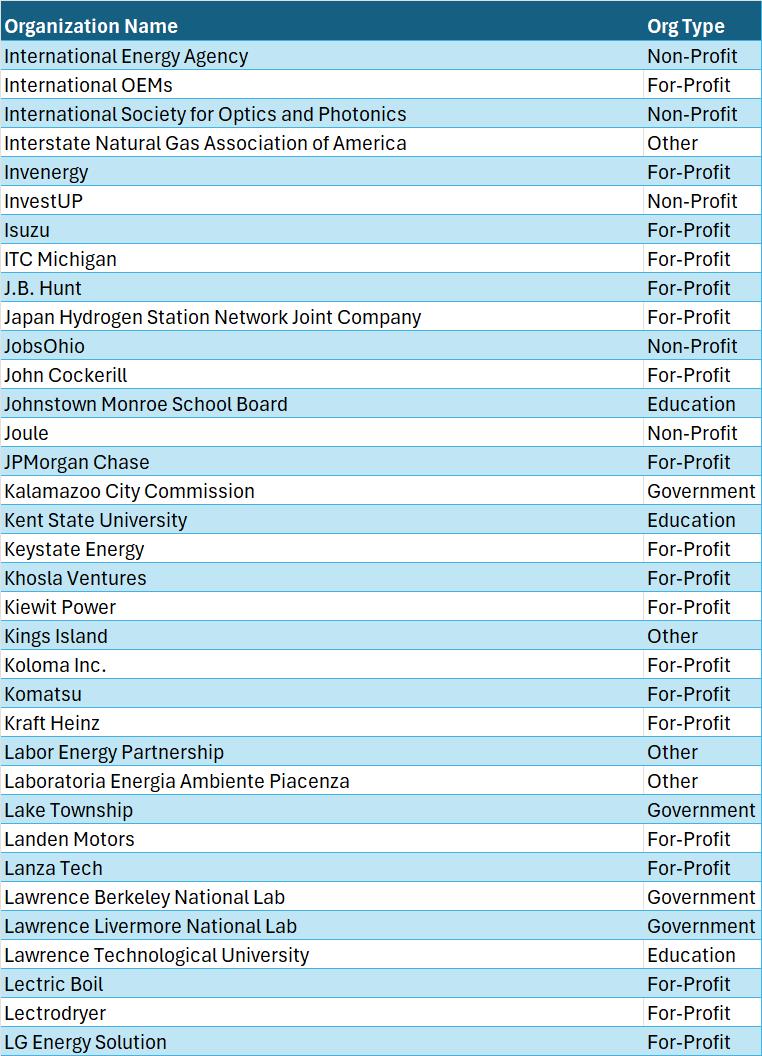
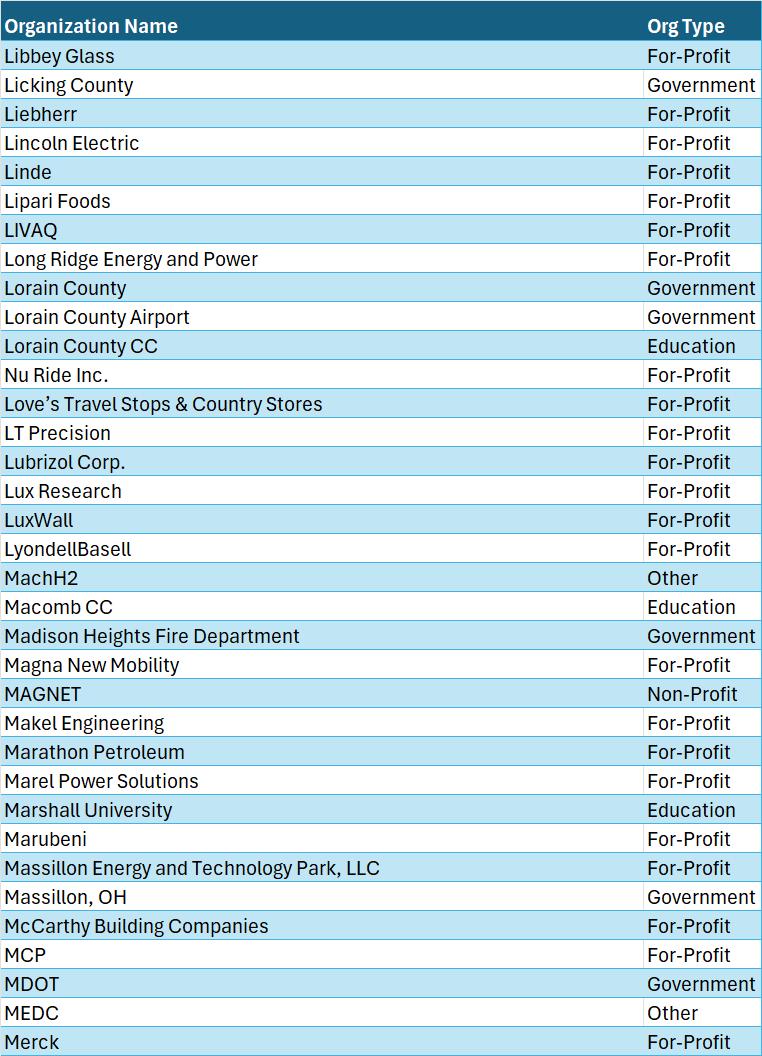
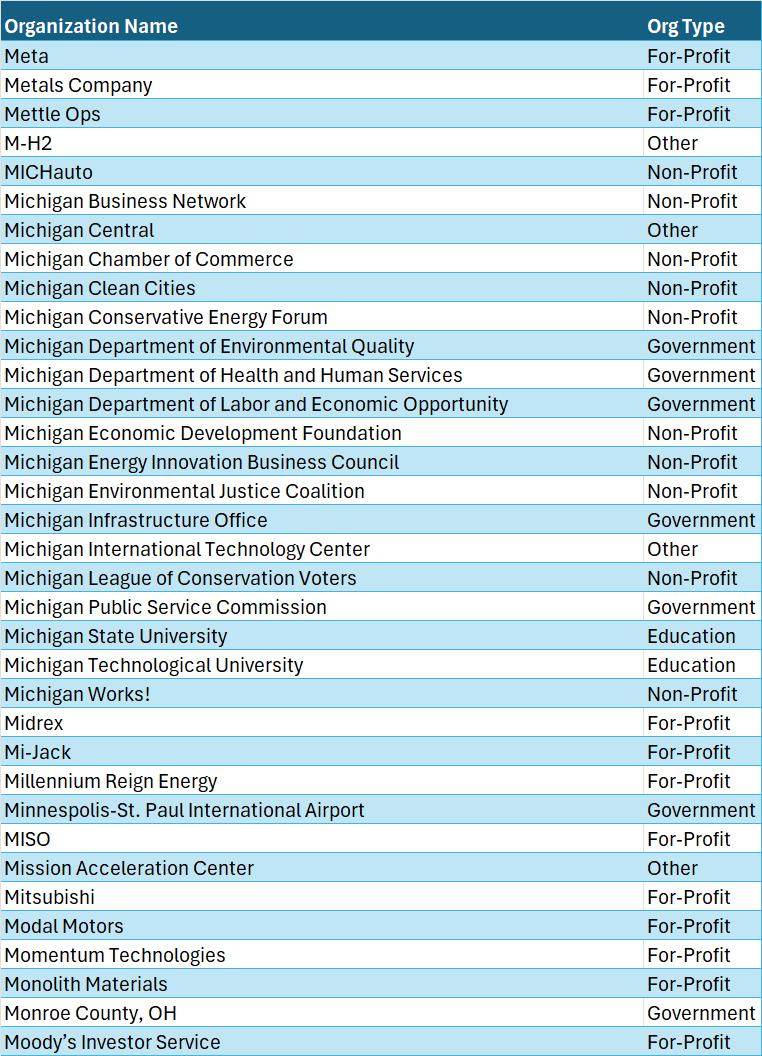
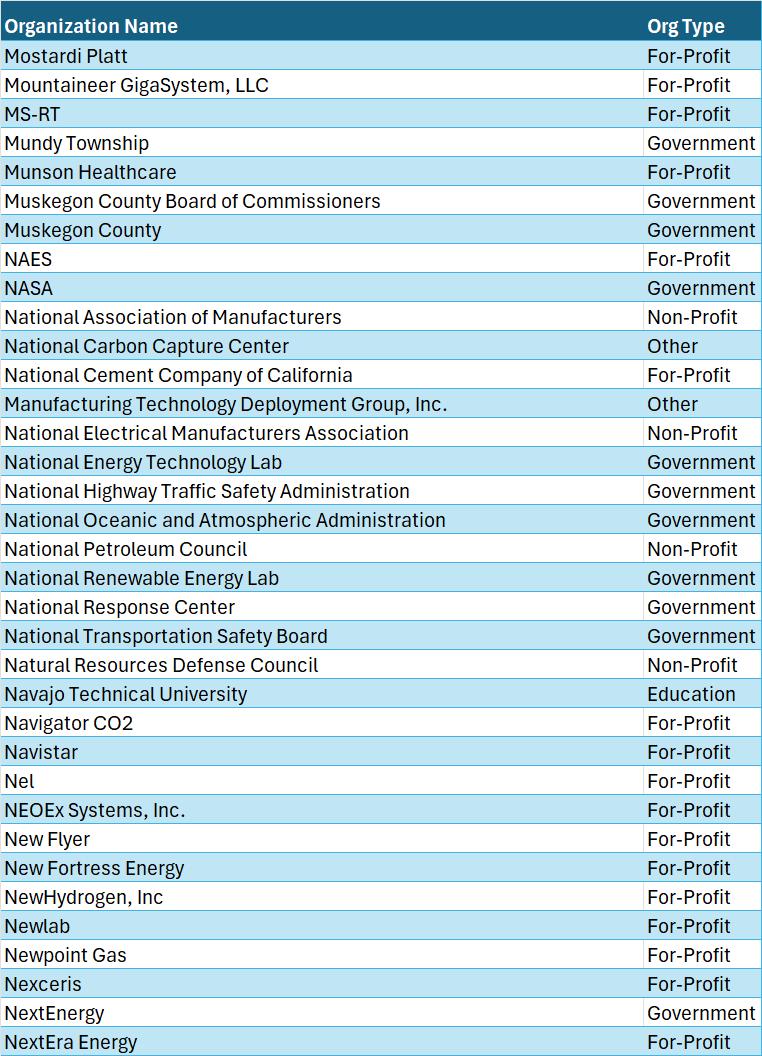
The snowball sampling methodology (see Appendix A) was utilized between September 2024 and February 2025*. This approach yielded insightful findings related to the hydrogen network for Michigan and Ohio. Over half (51.3%) of the organizations identified were structured as for-profit or private entities. An additional 145 organizations (19.6%) were identified as Government entities, as well as 112 (15.2%) which were identified as non-profit. results of that effort will not accurately reflect recent changes to federal funding priorities regarding hydrogen and the current uncertainties in the hydrogen-related markets in the US.
*Results of the snowball sampling effort may not accurately capture recent changes to federal funding priorities regarding hydrogen and the current uncertainties in the hydrogen-related markets in the US.
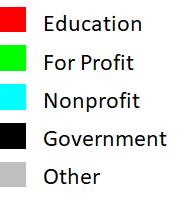
Ecosystem: Core Influencers
The golden rule of networks is the same as the golden rule of real estate: location, location, location. Where organizations or individuals are identified in the map matters. Organizations that are centrally located on the map are more likely to be able to influence the ecosystem. High level influencers are often well connected in their own community or “cluster” but also have connections to other clusters. Influencers are identified using a mathematical formula within the mapping software, which identifies connections with nodes
and clusters to assess the value of those relationships and ability to influence all other nodes within the ecosystem. The U.S. Department of Energy is the best connected and most influential in the ecosystem.
This map identifies the core members of the Hydrogen ecosystem in Michigan and Ohio. This group has the most influence on the entire ecosystem. Activities and changes at these organizations can have a drastic influence on the entire community.
NOTE: Colors indicate a type of organization based on their role within the ecosystem. Nodes with like colors may work together more closely and are considered a cluster within the ecosystem.
The top 15 influencers in the Michigan-Ohio hydrogen ecosystem are:
• U.S. Department of Energy (U.S. DOE)
• Midwest Alliance for Clean Hydrogen (MachH2)
• Michigan Economic Development Corporation (MEDC)
• State of Michigan
• Cleveland-Cliffs
• General Motors
• University of Michigan
• Environmental Protection Agency (EPA)
• Nel
• Ford
• Appalachian Regional Clean Hydrogen (ARCH2)
• University of Toledo
• Honda
• Stark Area Regional Transit Authority (SARTA)
• State of Ohio
*Note, certain nodes, such as those for government entities or educational institutions, may include multiple departments. These nodes include any reference to internal departments of that entity and do not specify an office, department, or institute (e.g. MI Hydrogen initiative was included in the count for the University of Michigan.)
Breakdown of top 5 influencer
clusters:
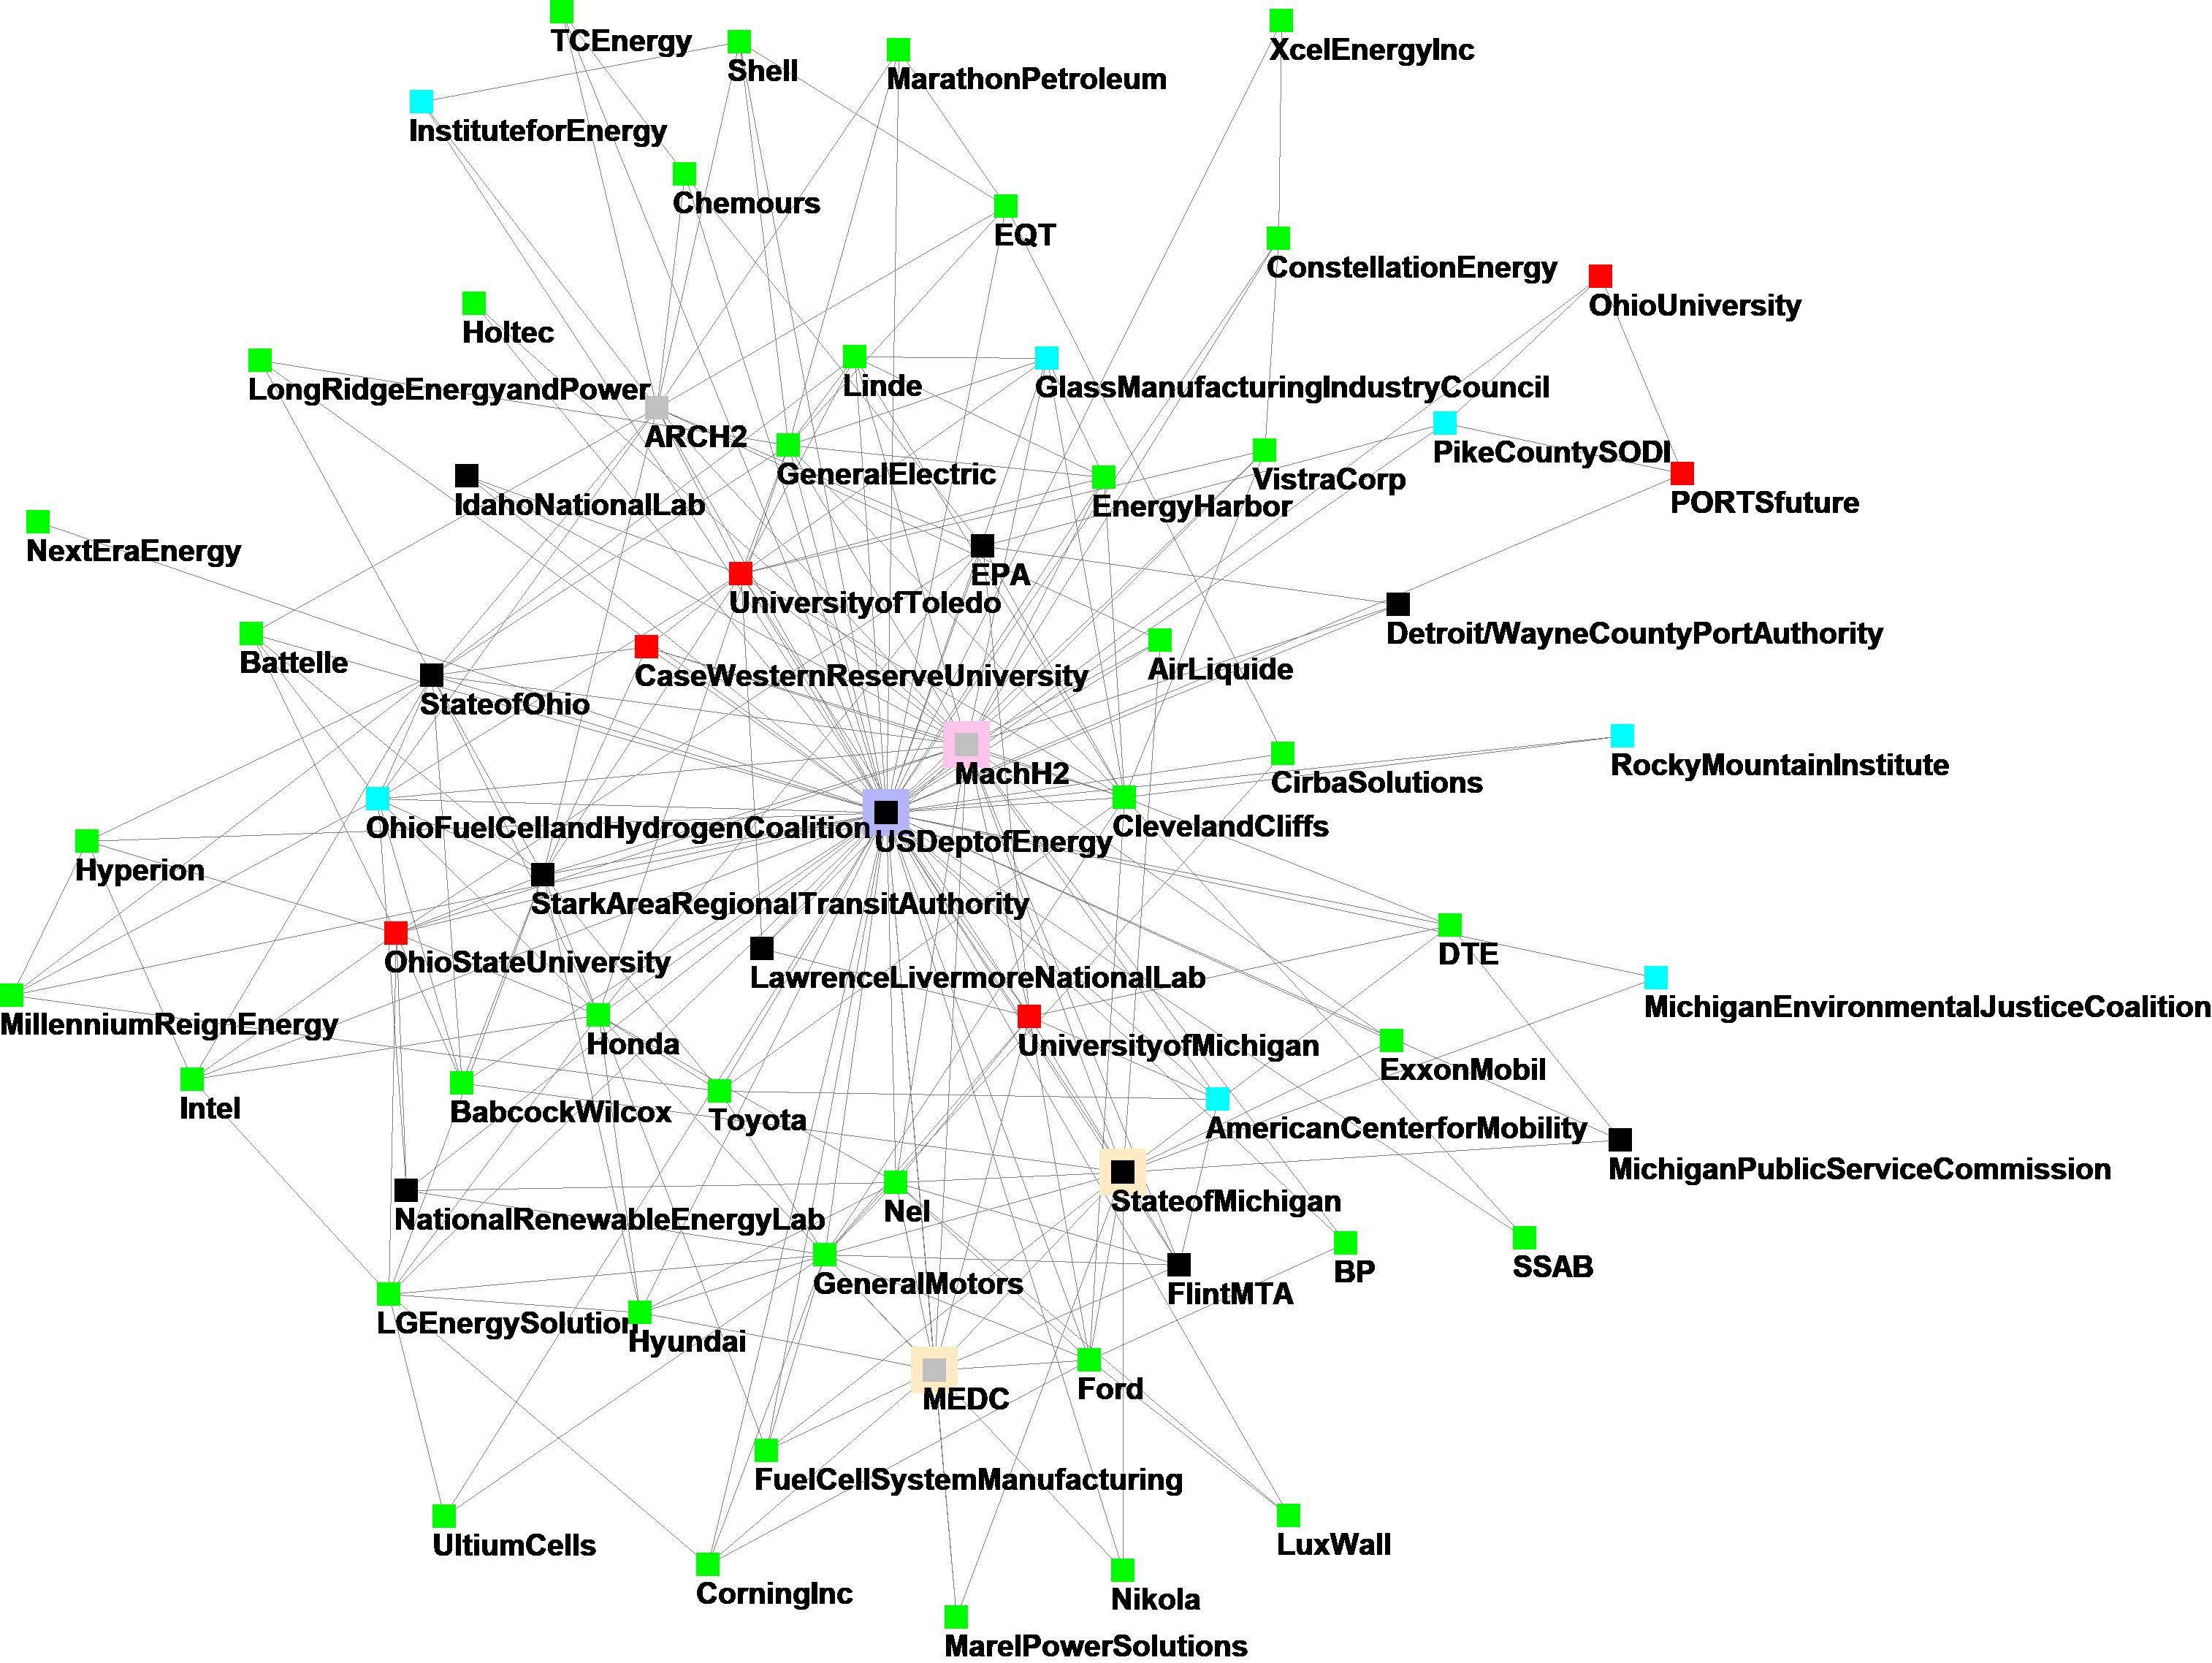
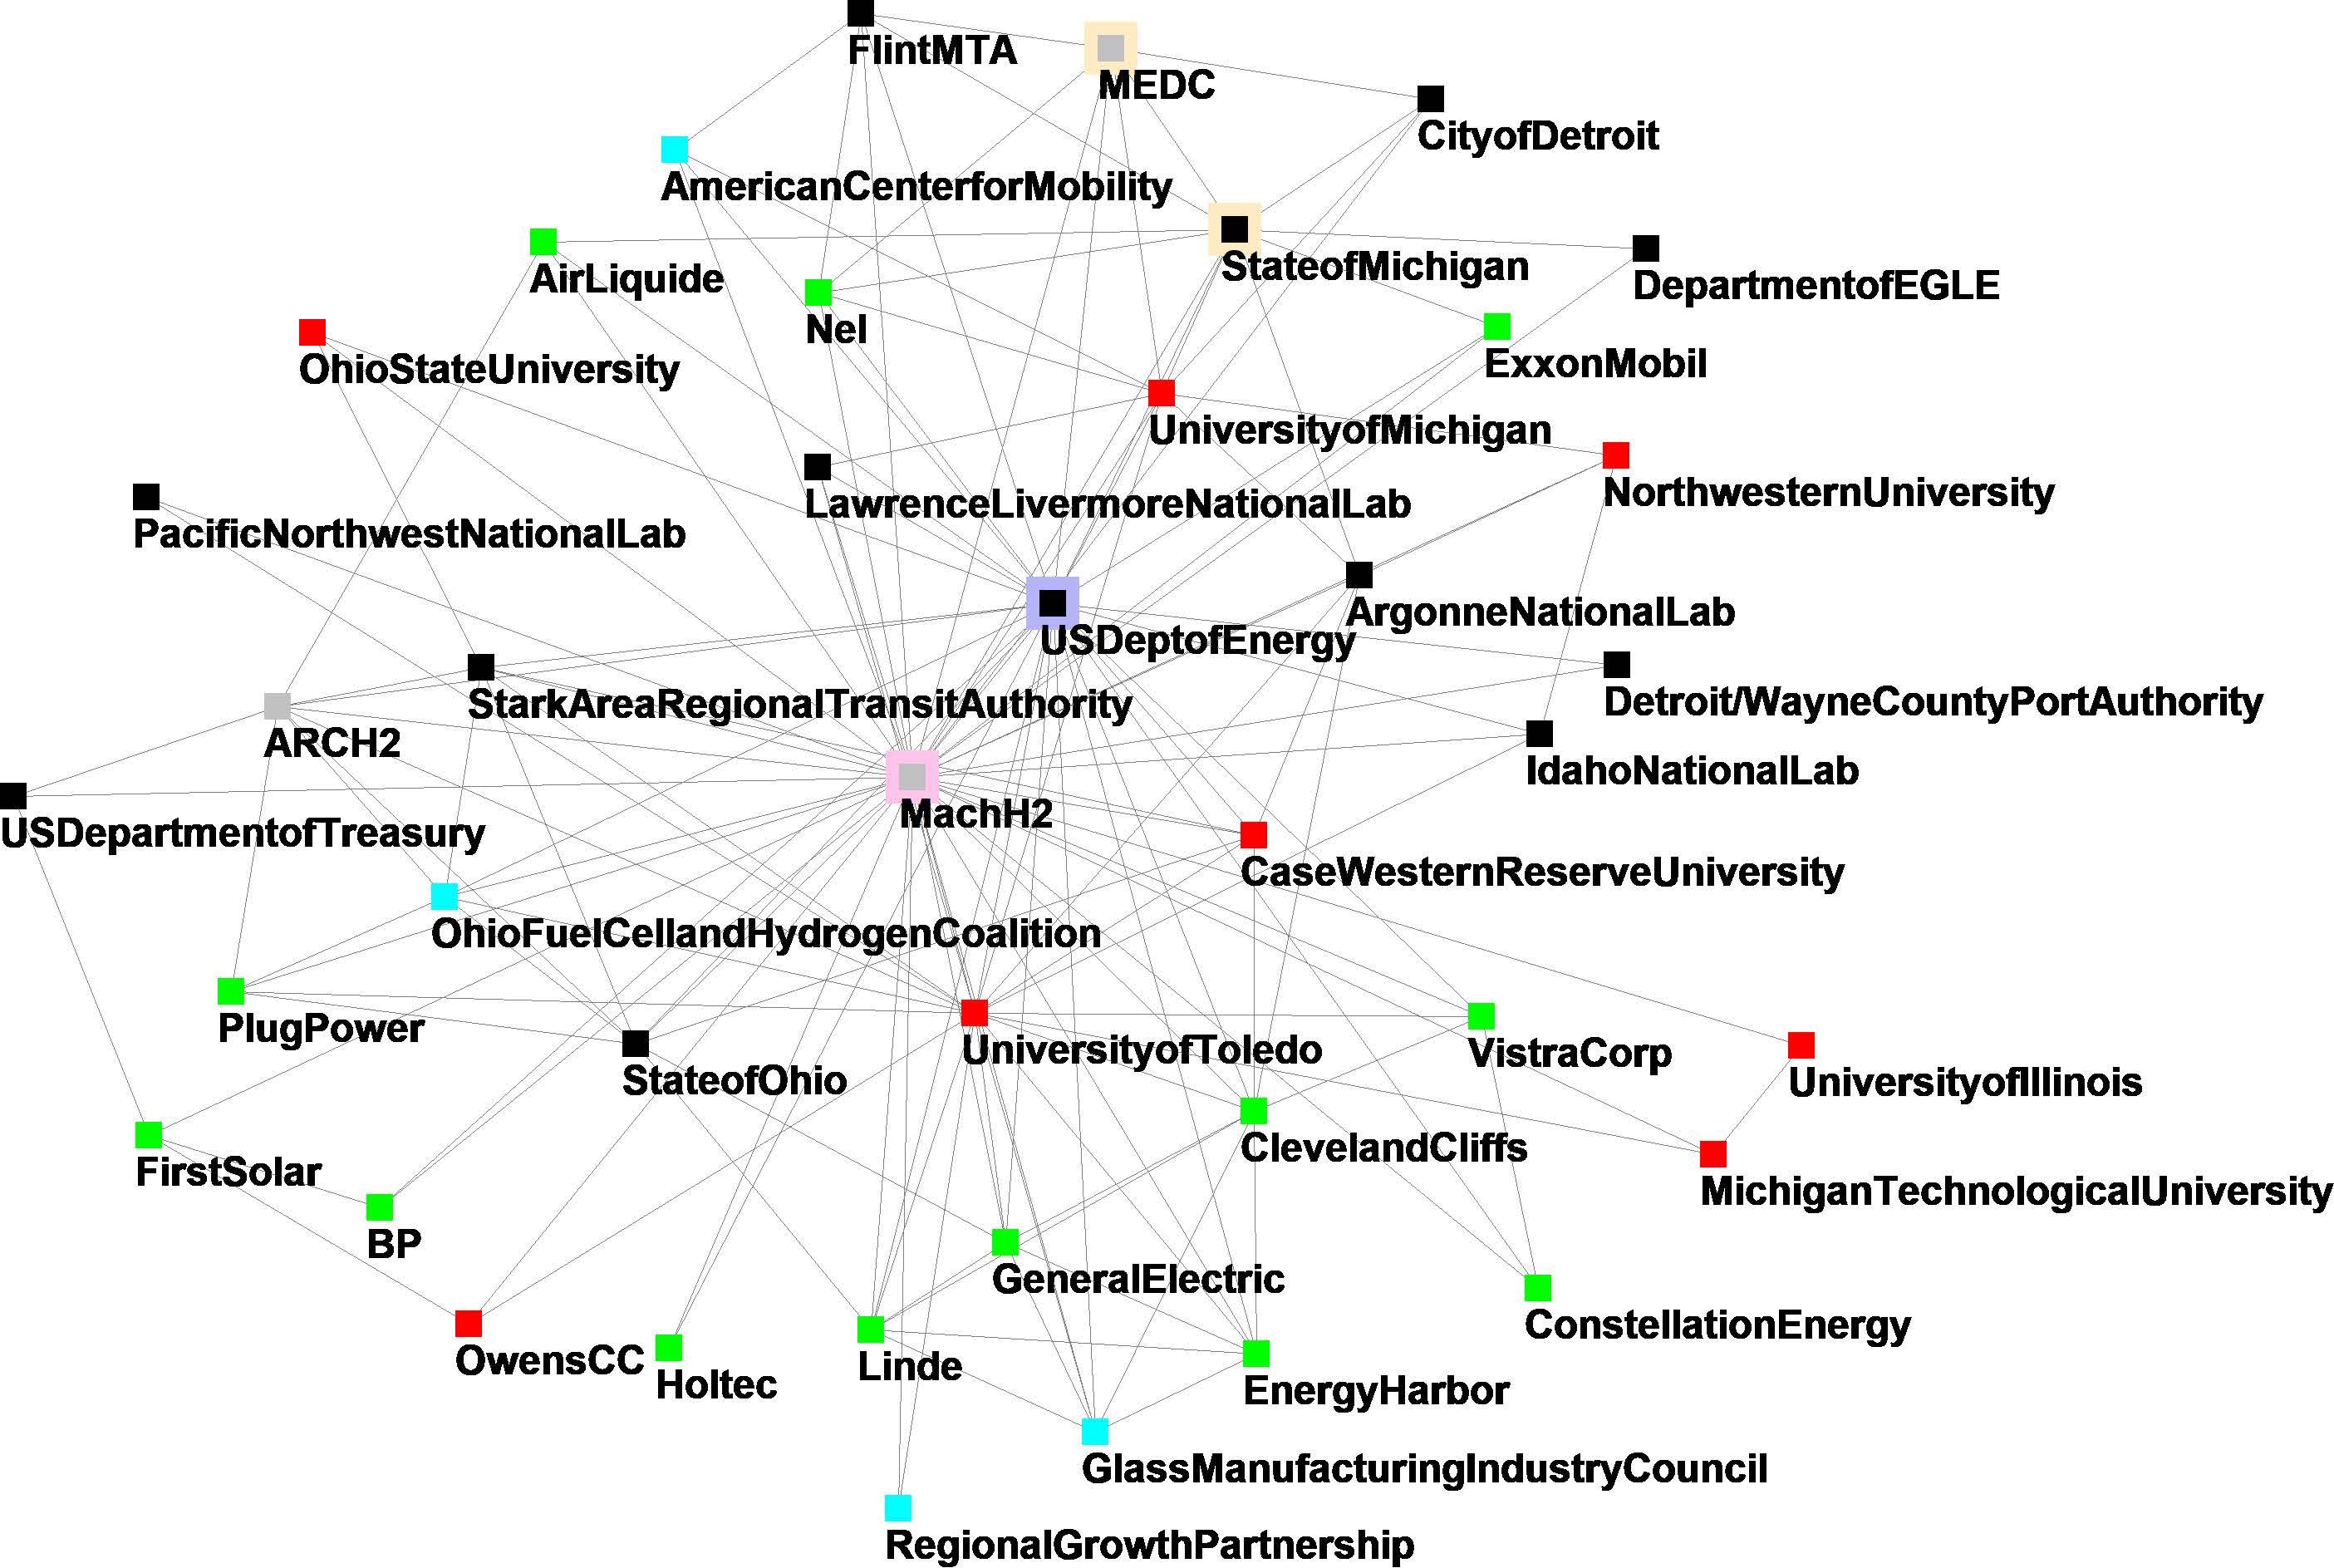
The following maps show the one step connections of the top five influencers.
U.S.
DEPARTMENT OF ENERGY MACH H2
*Note, certain nodes, such as those for government entities or educational institutions, may include multiple departments. These nodes include any reference to internal departments of that entity and do not specify an office, department, or institute (e.g. MI Hydrogen initiative was included in the count for the University of Michigan.)
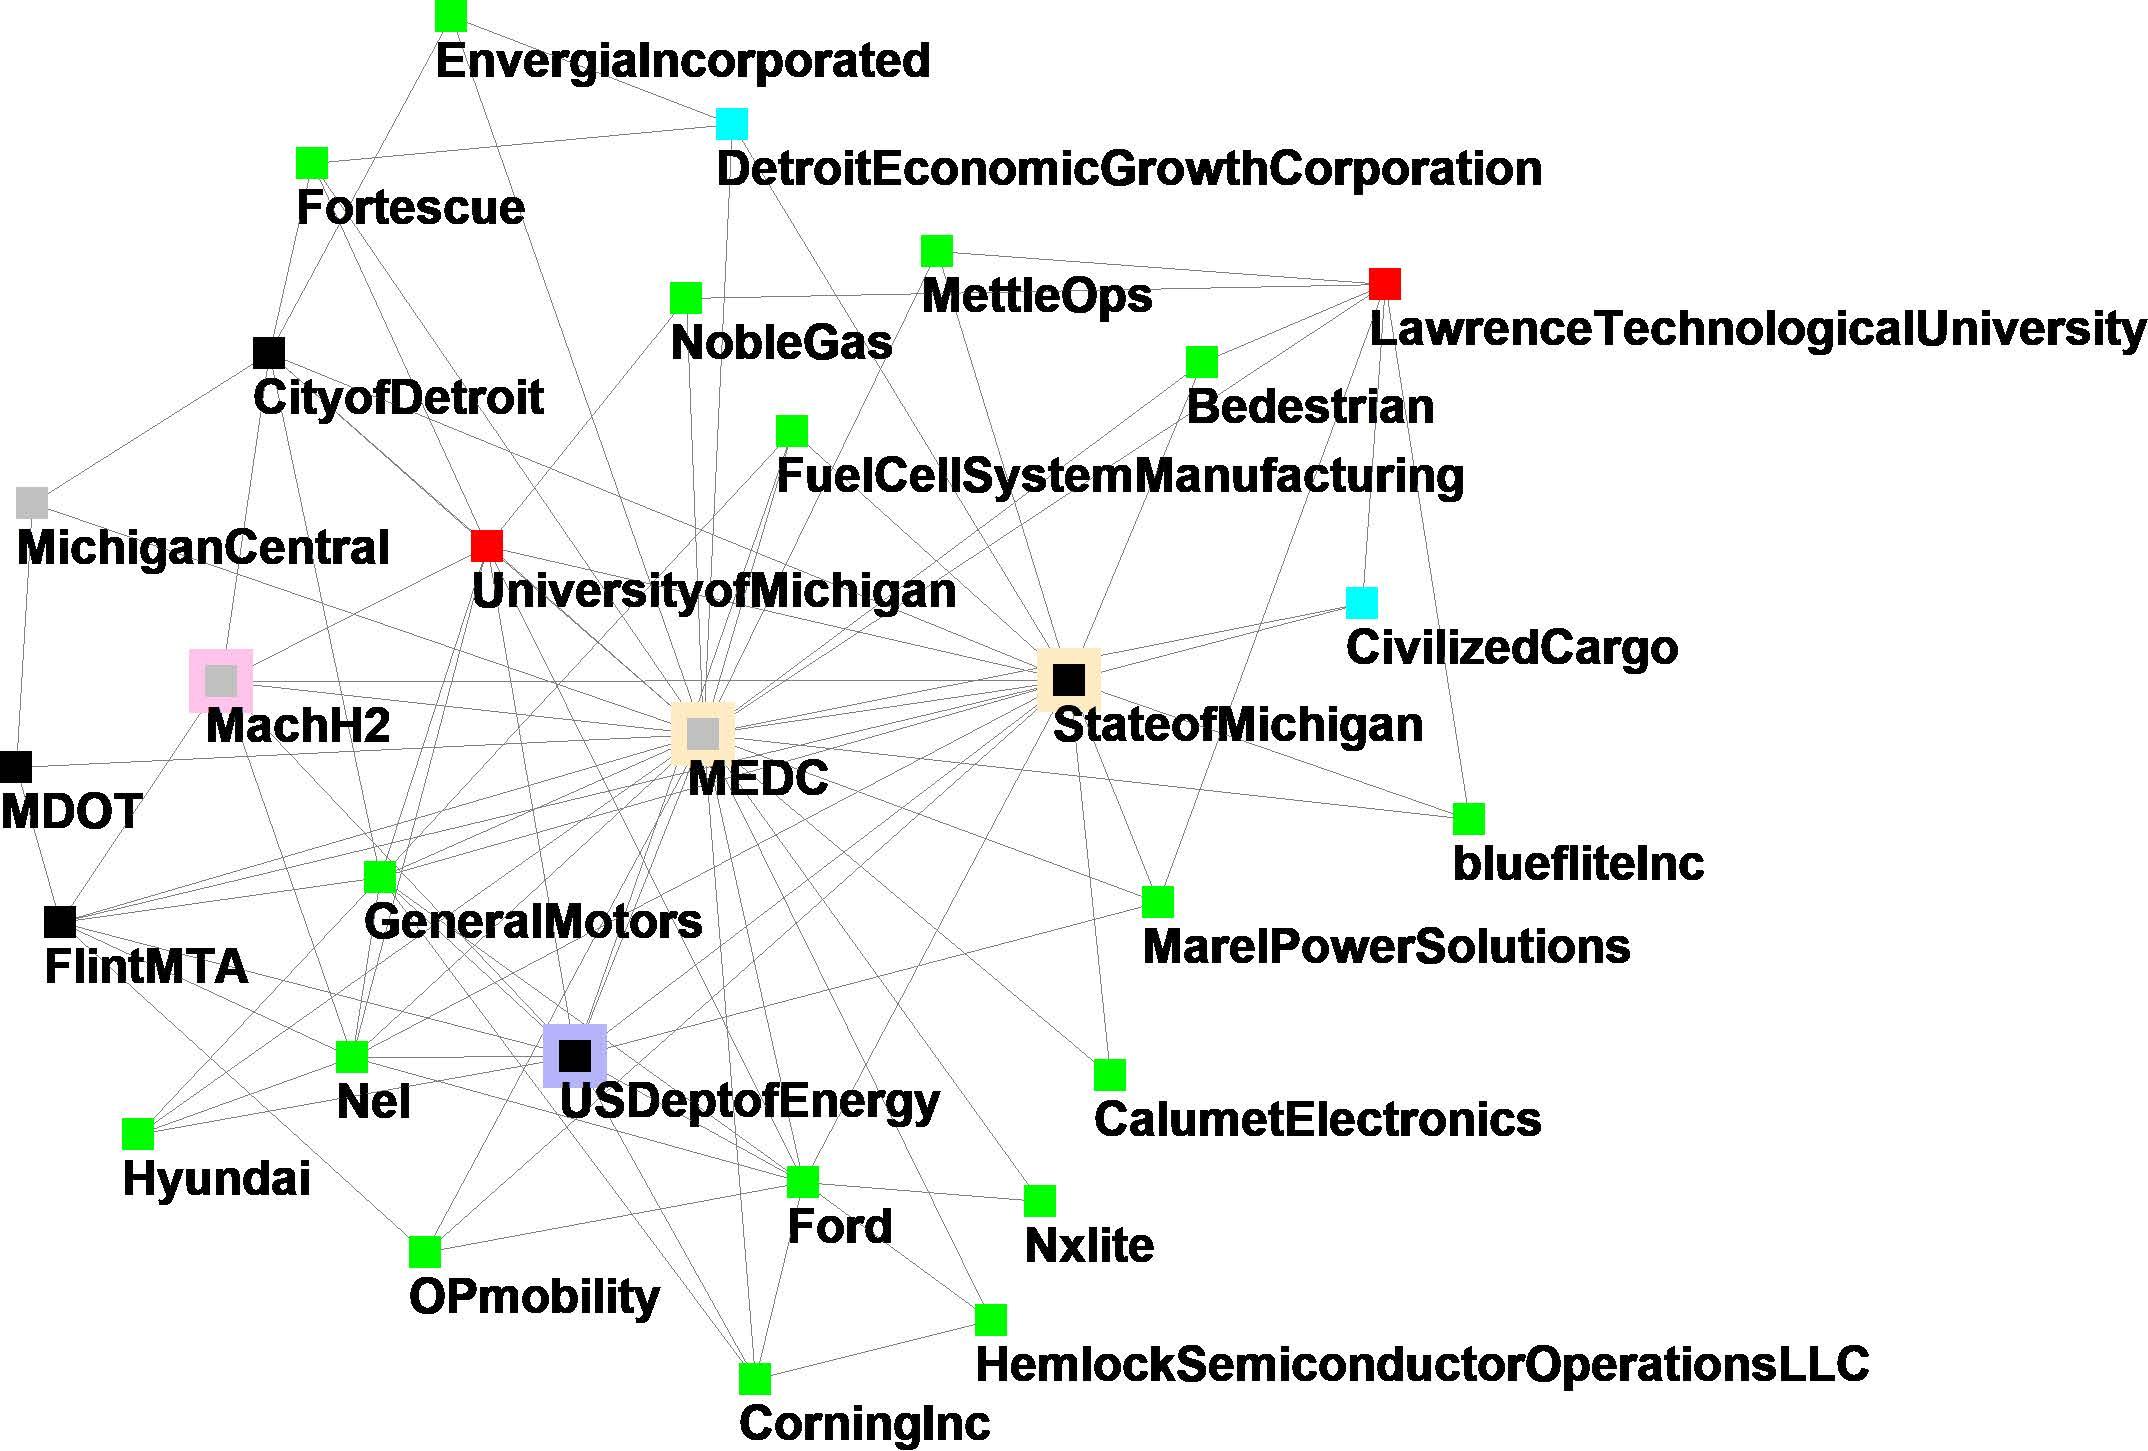
STATE OF MICHIGAN
MICHIGAN ECONOMIC DEVELOPMENT CORPORATION (MEDC)
*Note, certain nodes, such as those for government entities or educational institutions, may include multiple departments. These nodes include any reference to internal departments of that entity and do not specify an office, department, or institute (e.g. MI Hydrogen initiative was included in the count for the University of Michigan.)
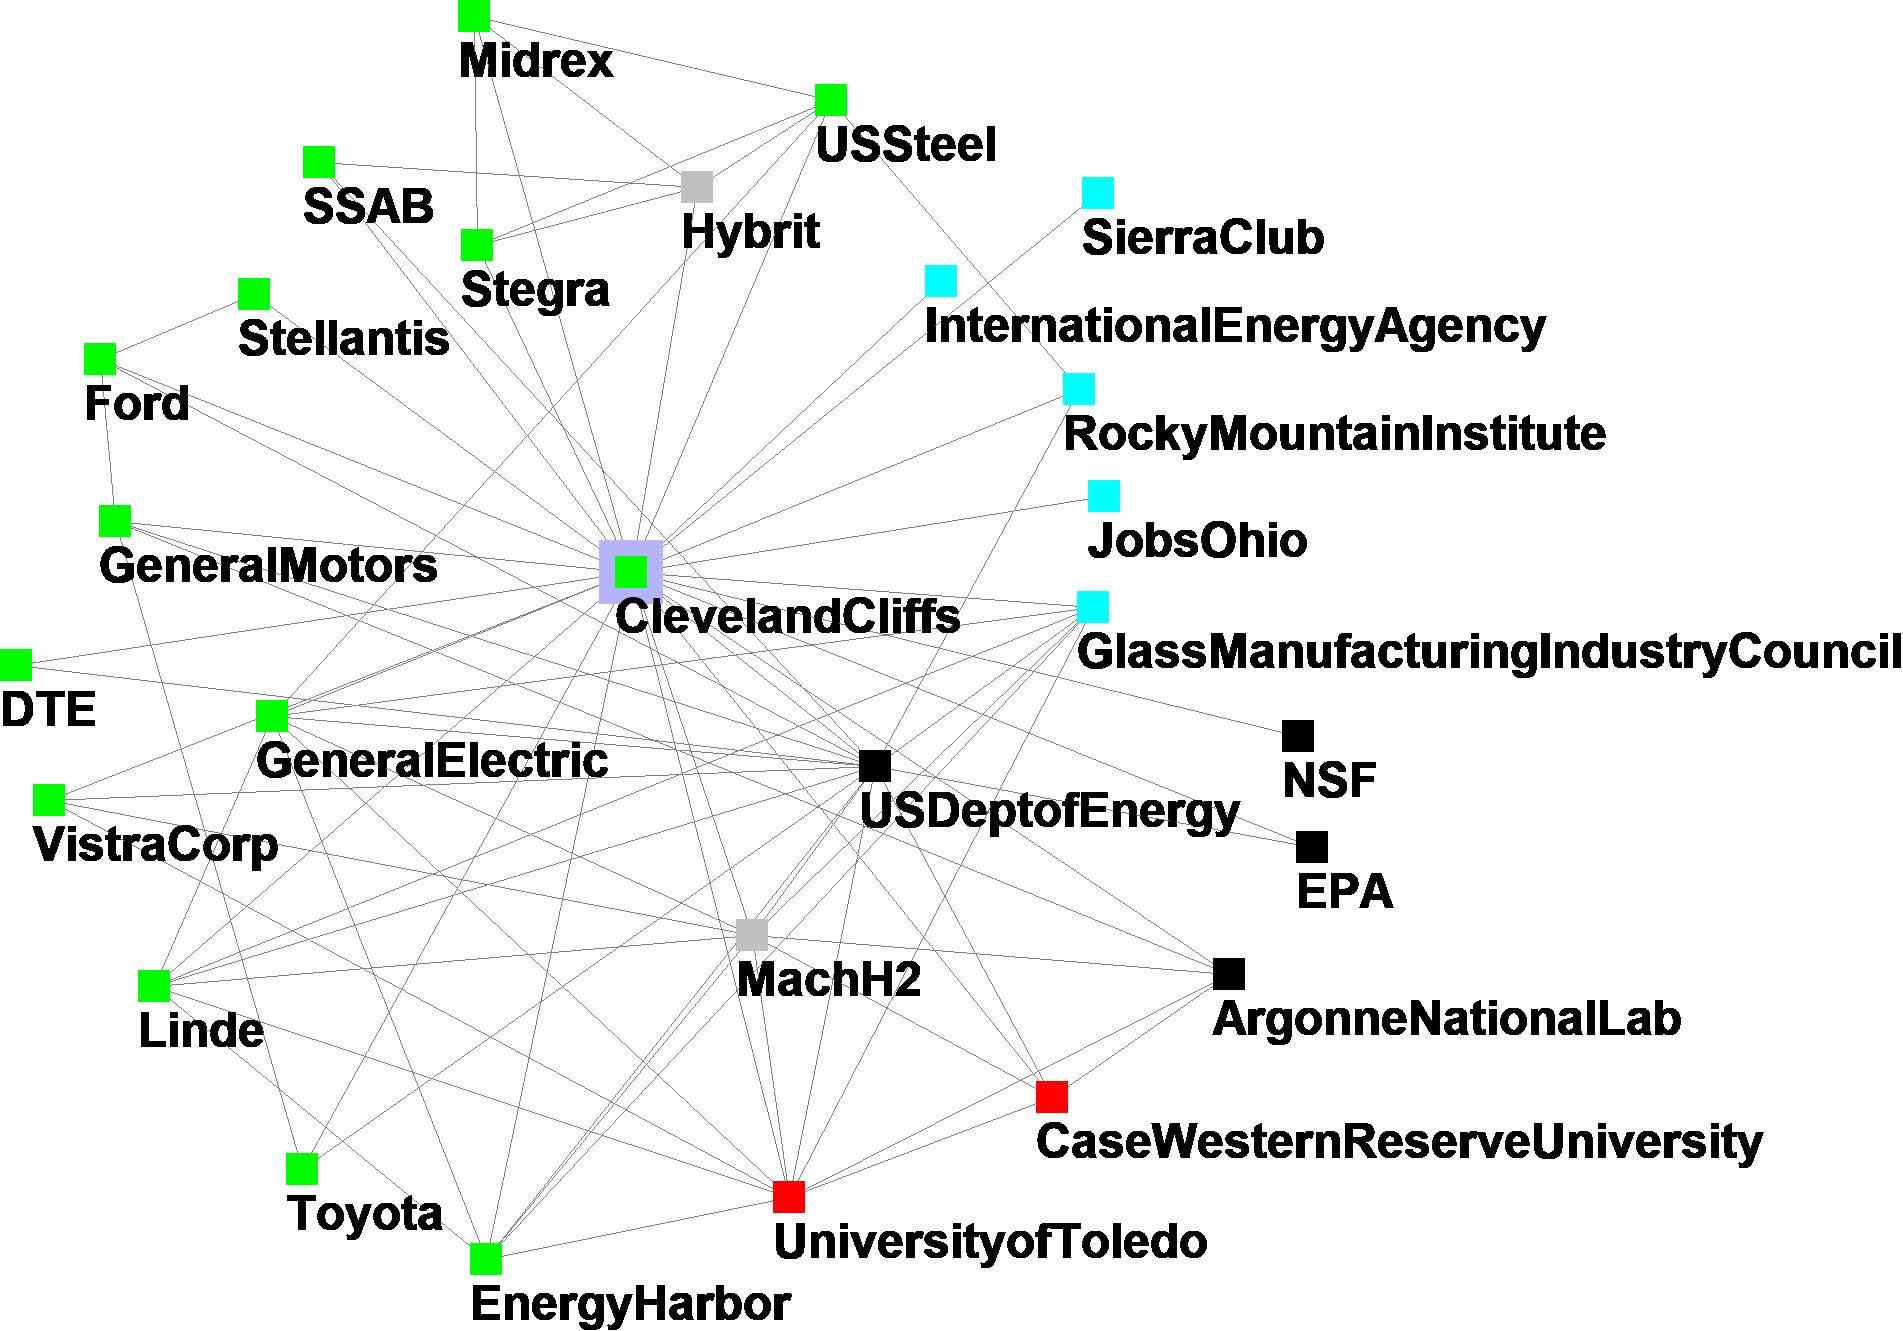
CLEVELAND-CLIFFS
Singular connectors
The organizations identified below are connected to nodes that are not connected to any other organization identified in the ecosystem. This is like living in a cul-de-sac, with the routes (information flows and knowledge exchanges) being limited and often focused on only one path. Reaching out to these entities and creating additional collaboration with singular nodes may create a healthier ecosystem. To reach more of the hydrogen industry in Michigan and Ohio, these organizations serve as the gatekeepers to organizations that are not highly involved. Isolated nodes also existed in the research but were eliminated from the map and report, as the isolation of these nodes may indicate that they are either not participating in the hydrogen ecosystem, are outside of the Michigan-Ohio hydrogen ecosystem or do not play an active role.
An entity in control of structural social voids is in a good position. A person or organization with many singular nodes is highly valuable within a network, and can often exercise leverage that lesserconnected people or organizations do not have.
Several organizations (nodes) have connections with organizations that are not replicated by other nodes. These include:
• U.S. Department of Energy
• Midwest Alliance for Clean Hydrogen (MachH2)
• Michigan Economic Development Corporation (MEDC)
• State of Michigan
• Cleveland-Cliffs
• University of Michigan
• Environmental Protection Agency (EPA)
• General Motors (GM)
• Appalachian Regional Clean Hydrogen Hub (ARCH2)
• Nel
• Ford
• Honda
• Stark Area Regional Transit Authority (SARTA)
• University of Toledo
• State of Ohio
*Note, certain nodes, such as those for government entities or educational institutions, may include multiple departments. These nodes include any reference to internal departments of that entity and do not specify an office, department, or institute (e.g. MI Hydrogen initiative was included in the count for the University of Michigan.)
Highly connected
Highly-connected nodes are those organizations that have identified relationships with many other nodes specified in the research. These organizations, associations, or private businesses are considered well connected and either work or collaborate with many other players in the hydrogen ecosystem While these organizations may not have the highest level of influence in the ecosystem, they tend to be well-informed about the ecosystem and may serve as gateways to reach out to other players.
The Top 15 most connected organizations:
• U S Department of Energy (U.S. DOE)
• Midwest Alliance for Clean Hydrogen (MachH2)
• State of Michigan
• Michigan Economic Development Corporation (MEDC)
• Cleveland-Cliffs
• General Motors
• Appalachian Regional Clean Hydrogen (ARCH2)
• University of Michigan
• University of Toledo
• Honda
• Stark Area Regional Transit Authority (SARTA)
• State of Ohio
• Environmental Protection Agency (EPA)
• Ford
• General Electric
*Note, certain nodes, such as those for government entities or educational institutions, may include multiple departments. These nodes include any reference to internal departments of that entity and do not specify an office, department, or institute (e.g. MI Hydrogen initiative was included in the count for the University of Michigan.)
The quantity of connections does not necessarily reflect the quality of the relationships. However, organizations with more connections may find it easier to foster collaboration with many players and cross industry divides. A node with many connections is often a sign that the overall network finds it beneficial to participate with that organization, which serve as a key player that attracts partners.
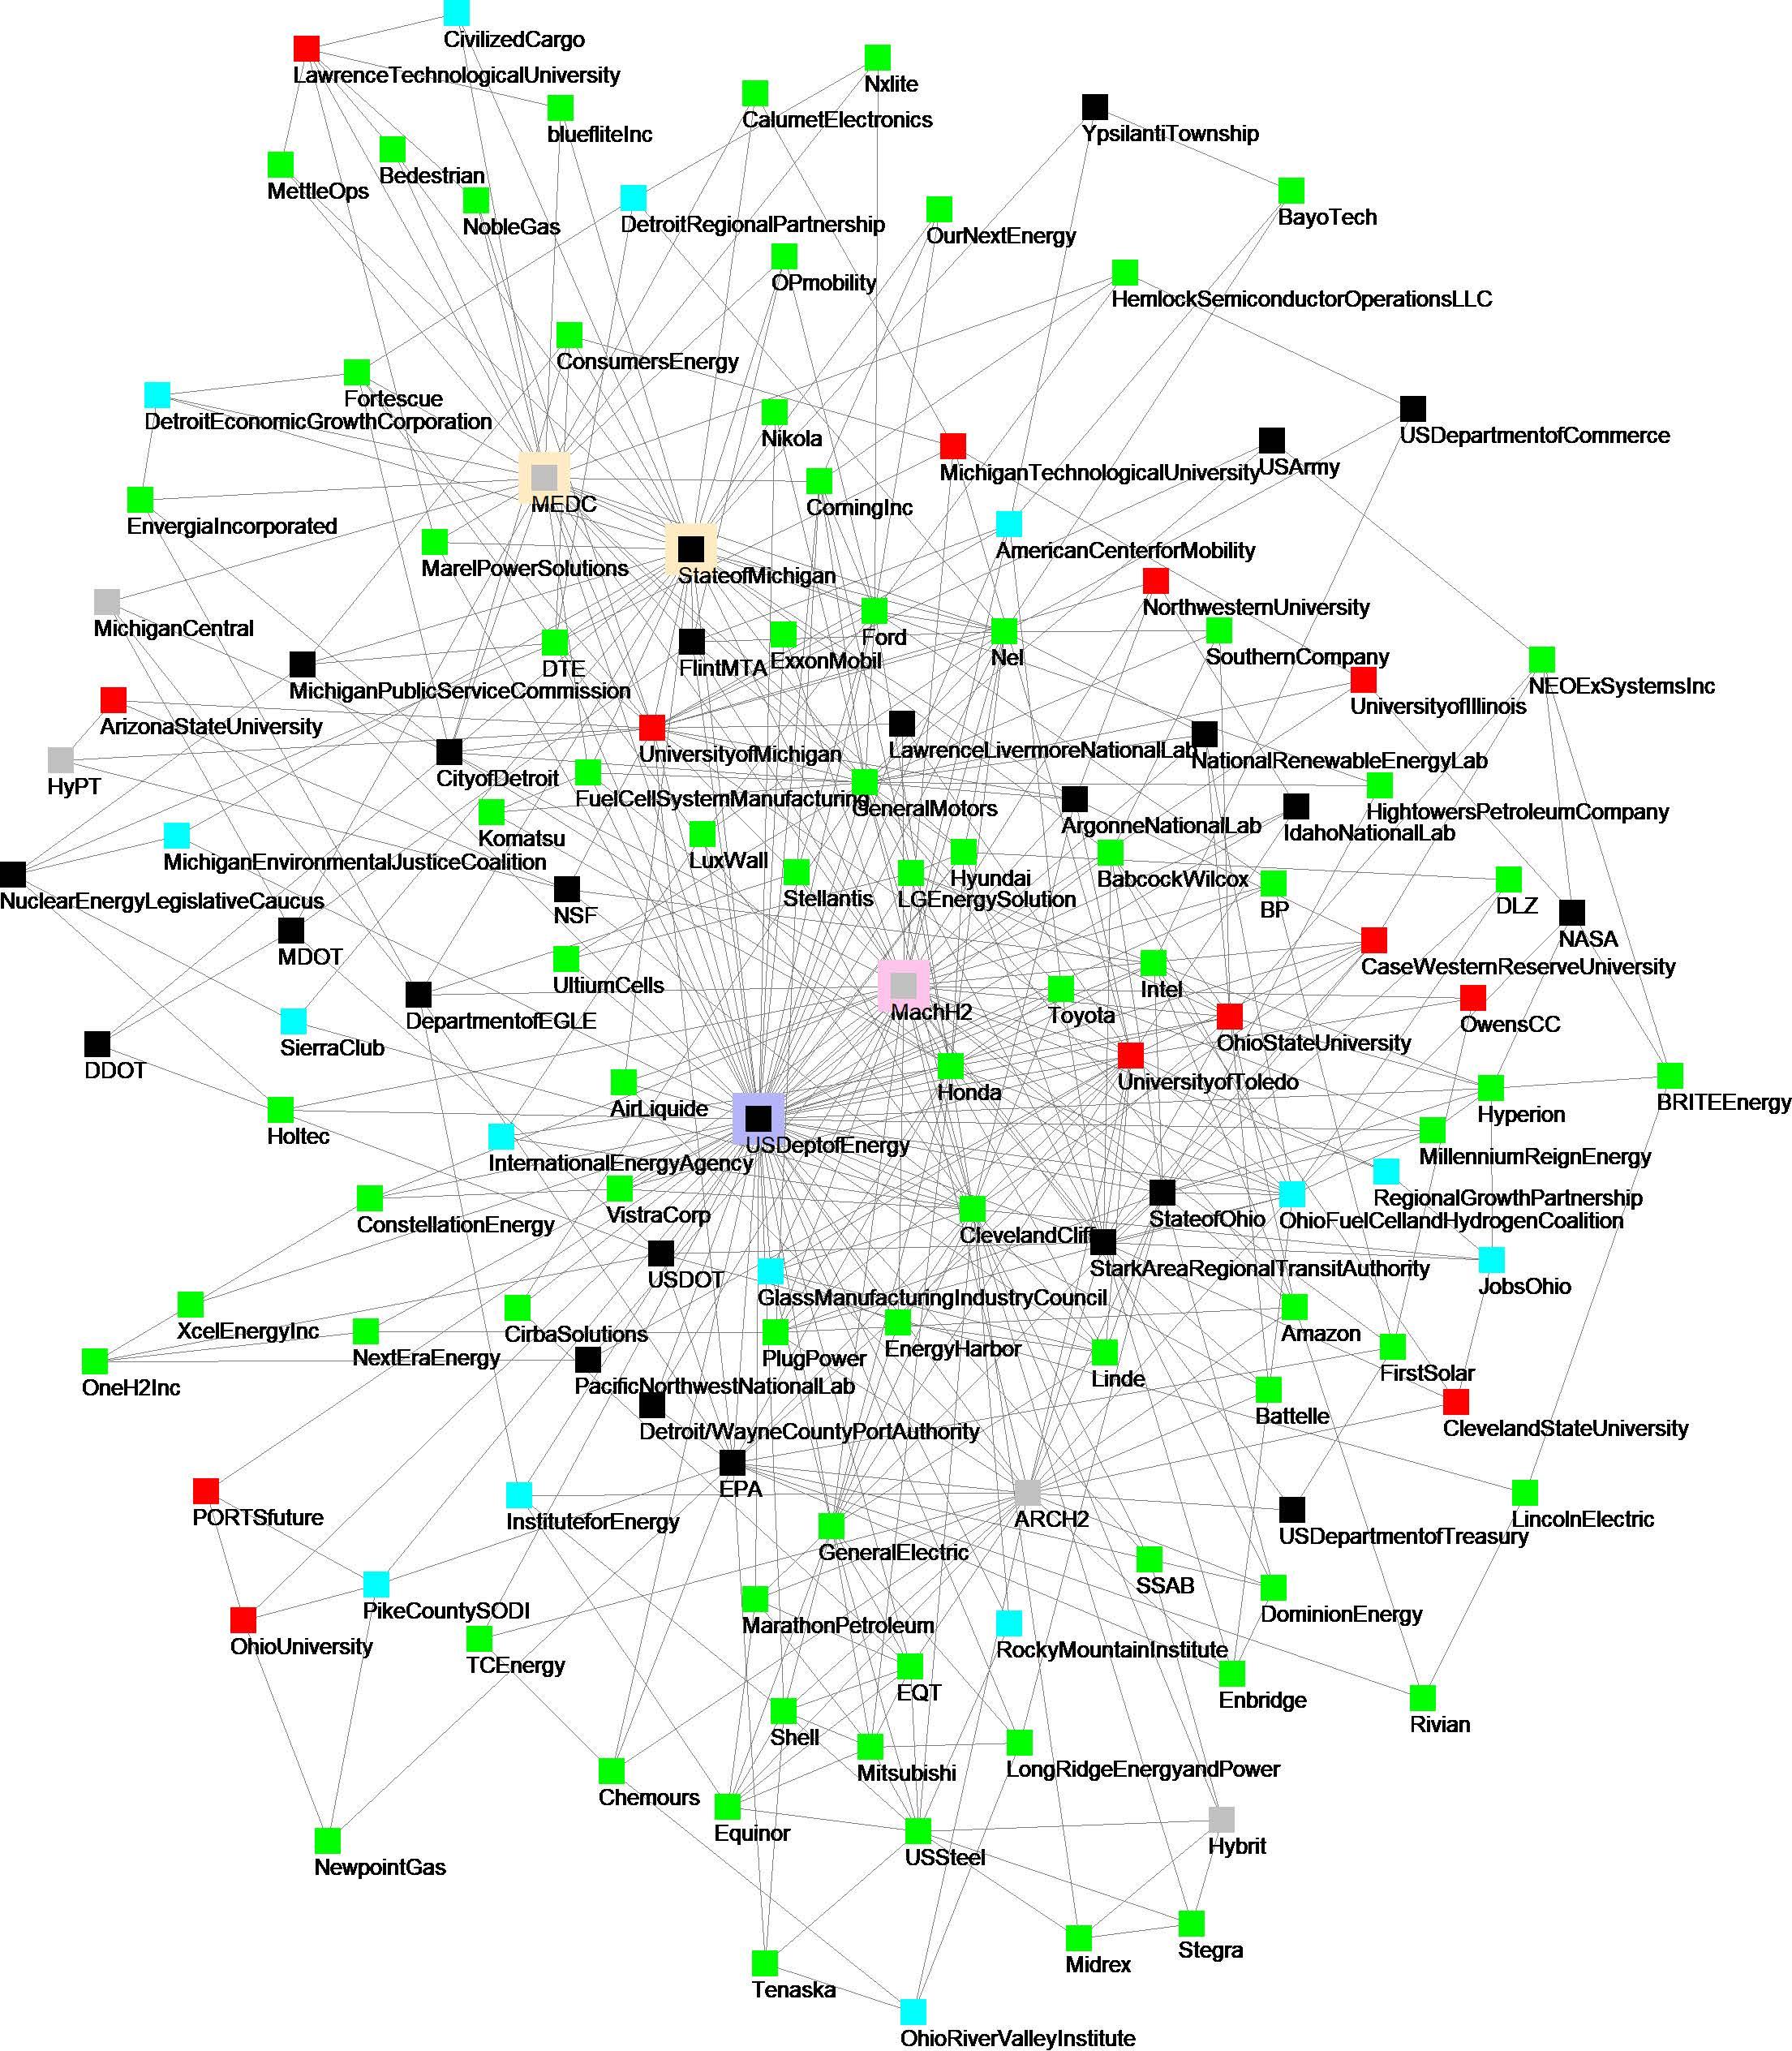
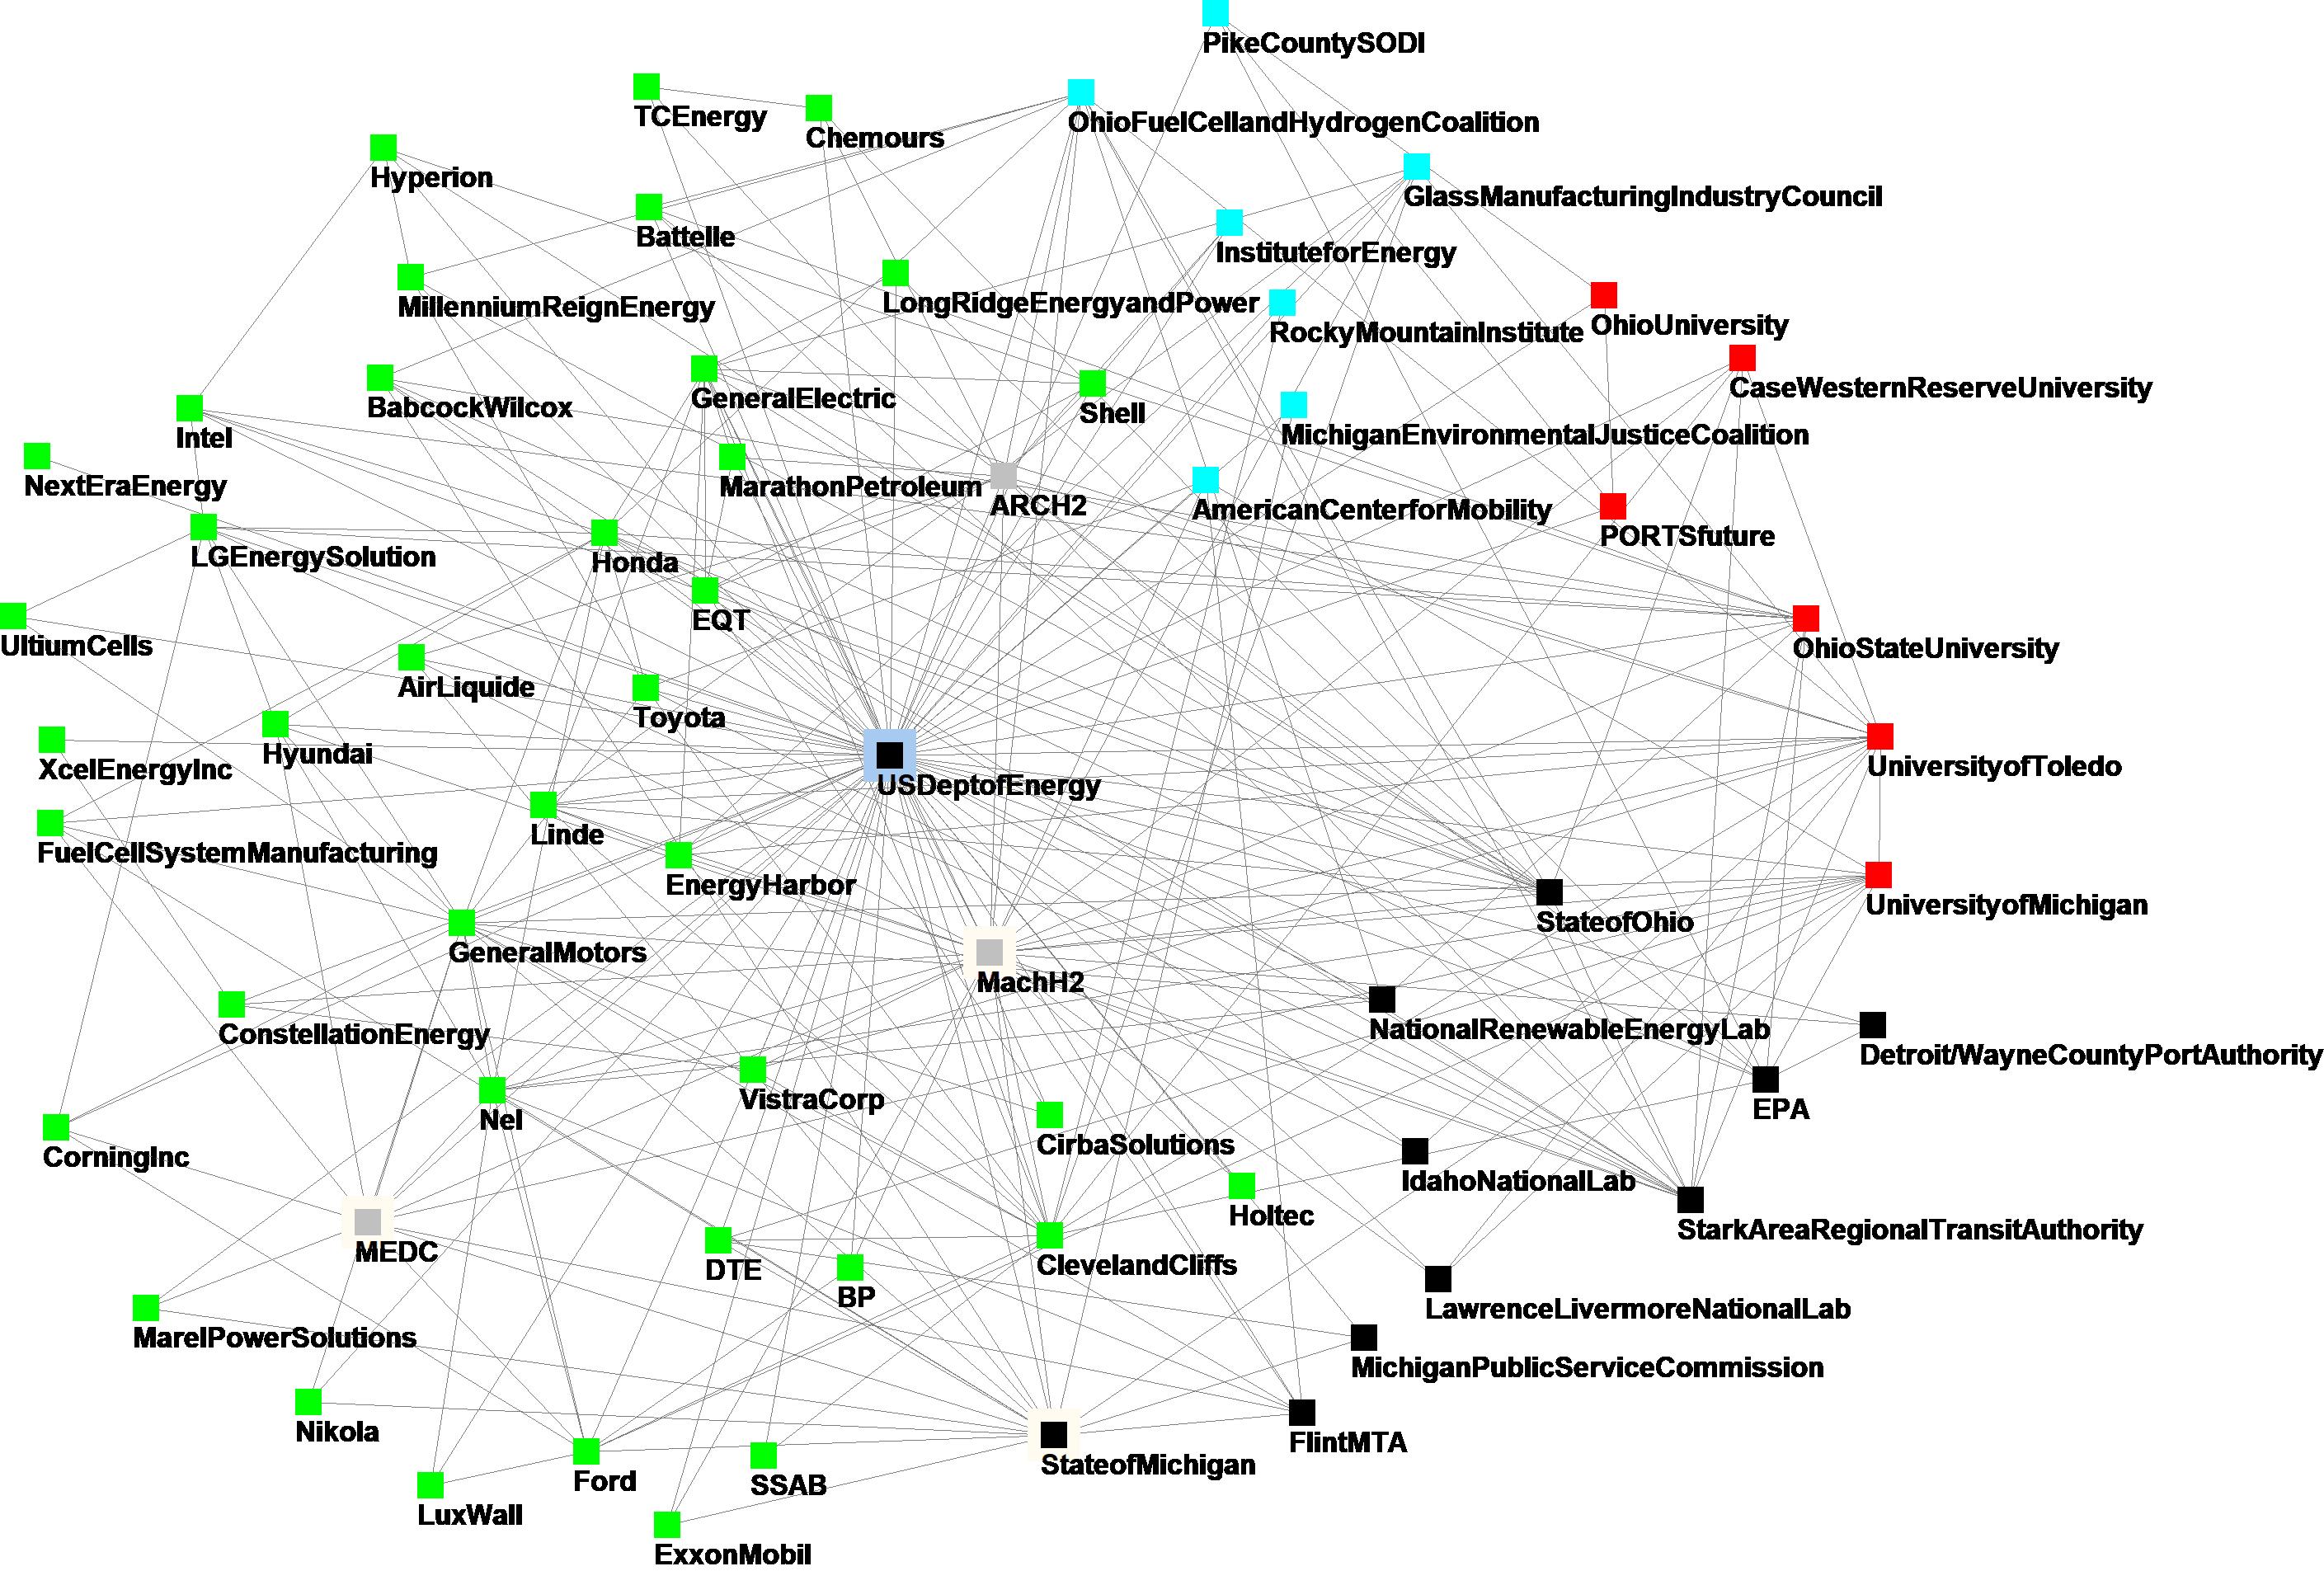
U.S. Department of Energy
The map below shows the one-step connections to the U.S. Department of Energy (U.S. DOE) and relationships between those companies and organizations. This map also shows the organizations grouped by type, indicating the strength and depth of U.S. DOE involvement across various facets of industry.
Social network analysis: Survey
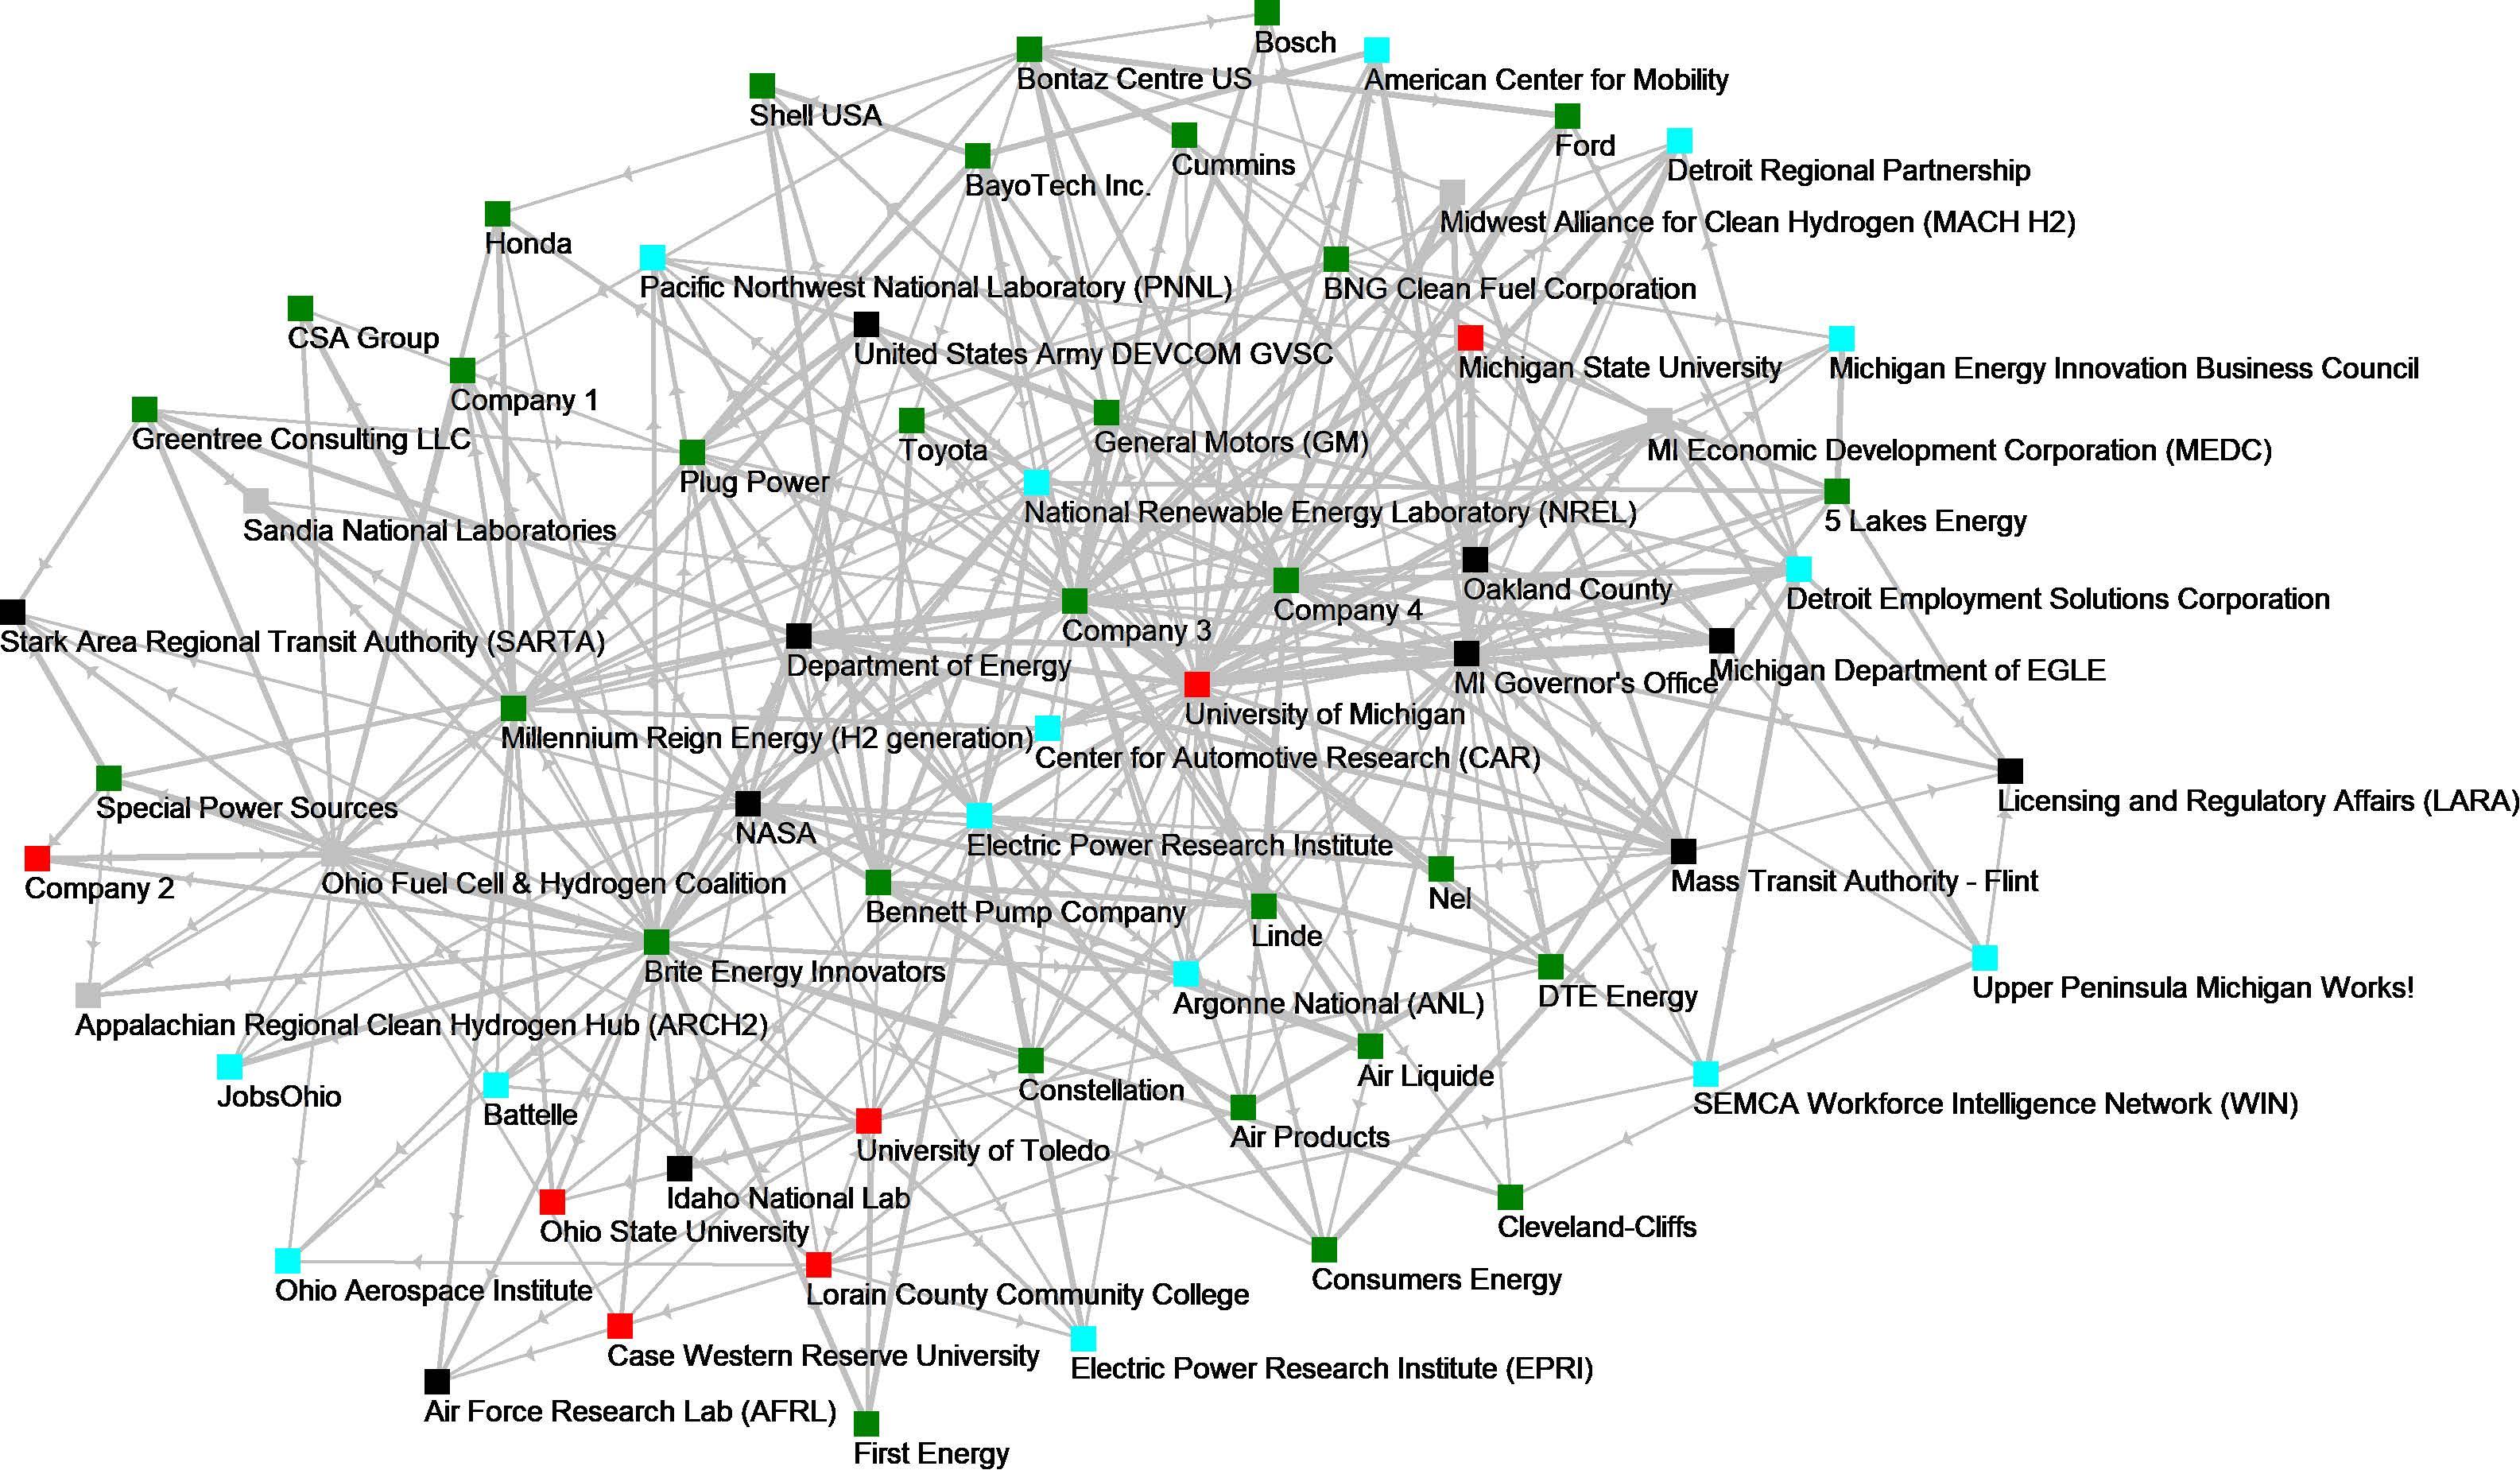
To better understand the collaborative landscape of the hydrogen ecosystem in Michigan and Ohio, our team conducted a social network analysis (SNA) survey targeting organizations and stakeholders actively engaged in the sector. This analysis provides insight into how entities are connected, where information and resources flow, and which actors serve as key bridges or influencers. By visualizing and quantifying these relationships, the SNA helps identify strengths, gaps, and opportunities for greater regional alignment in advancing hydrogen development. A total of 51 respondents completed the survey, representing 38 distinct organizations actively involved in the hydrogen ecosystem across Michigan and Ohio.
These participants spanned a range of sectors— including industry, government, research, and workforce development—offering a broad view of the region’s collaborative landscape. The responses provided valuable data on existing relationships, frequency of interaction, and areas of shared focus. By analyzing these connections, the SNA offers a clearer picture of how regional coordination is unfolding and where strategic investments in relationship-building may yield the greatest impact. Strength of relationship between organizations is measured on a scale of 1-5, with a response of 5 indicating an ongoing business relationship, perhaps formal or contractual in nature. The stronger a relationship, the more dense the connecting line is shown. Some organizations are anonymized, including core influencers three and four.
* Note, certain nodes, such as those for government entities or educational institutions, may include multiple departments. These nodes include any reference to internal departments of that entity and do not specify an office, department, or institute (e.g. MI Hydrogen initiative was included in the count for the University of Michigan.)
NOTE: Colors indicate a type of organization based on their role within the ecosystem. Nodes with like colors may work together more closely and are considered a cluster within the ecosystem.
The top 10 influencers based on a survey of the hydrogen ecosystem are:
• University of Michigan
• MI Governor’s Office
• Company 4 (Anonymous)
• Company 3 (Anonymous)
• Ohio Fuel Cell & Hydrogen Coalition (OFCHC)
• University of Toledo
• NASA
• United States Army DEVCOM GVSC
• Electric Power Research Institute (EPRI)
• Bright Energy Innovators
Occupational skills and labor analysis
This project seeks to identify current workforce needs and gaps related to technician, skilled trades, scientists, and engineering roles within the hydrogen sector. To better understand the needs of industry employers and stakeholders, a survey was launched to measure several key metrics. Insights from this assessment will guide the development of training pathways and credentialing programs aligning with industry requirements for building and maintaining hydrogen infrastructure safely and effectively.
Our survey targets employers and industry stakeholders with expertise in workforce needs, skills development, and training design. Key survey focus areas include:
•Identifying critical skill sets and job roles
•Highlighting training format preferences
•Informing curriculum and credential development
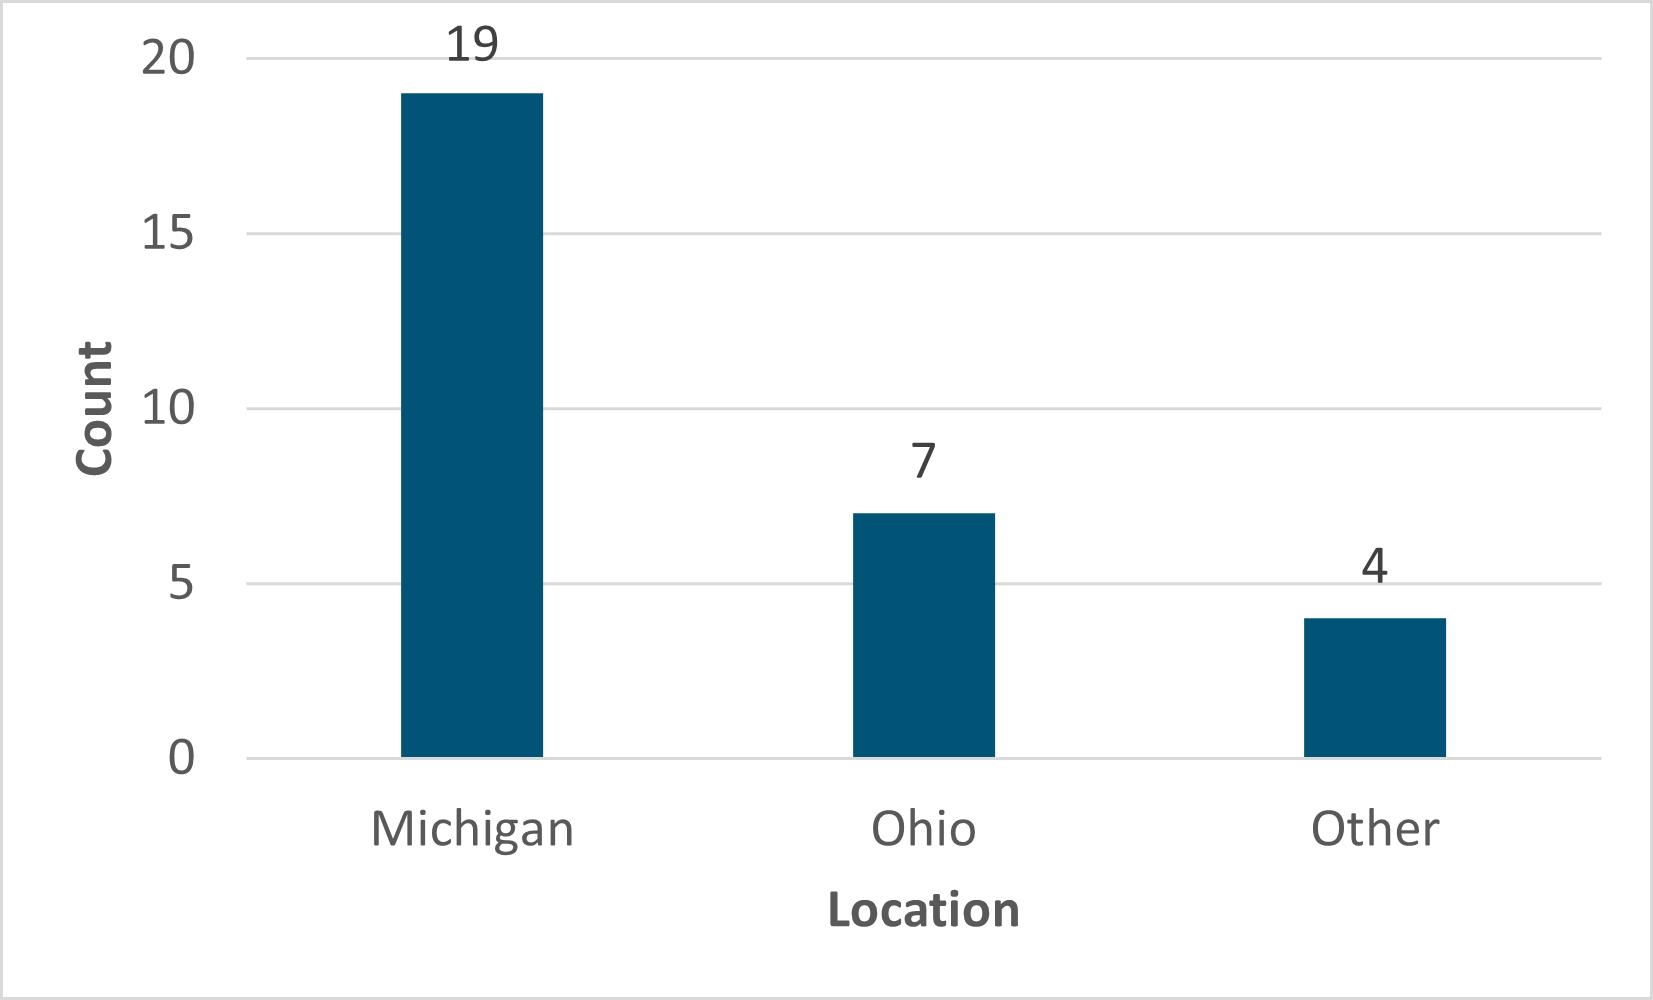
As shown in Figure 1, a total of 31 responses were submitted, representing 30 unique organizations. Among all respondents, 61.2% indicated their employer is based in Michigan, while 22.6% are in Ohio and 12.9% from a different state. This cross-section of industry and academic representation helps provide a clear view of the current skills needs and training for the future.
Figure 1: Employer Location
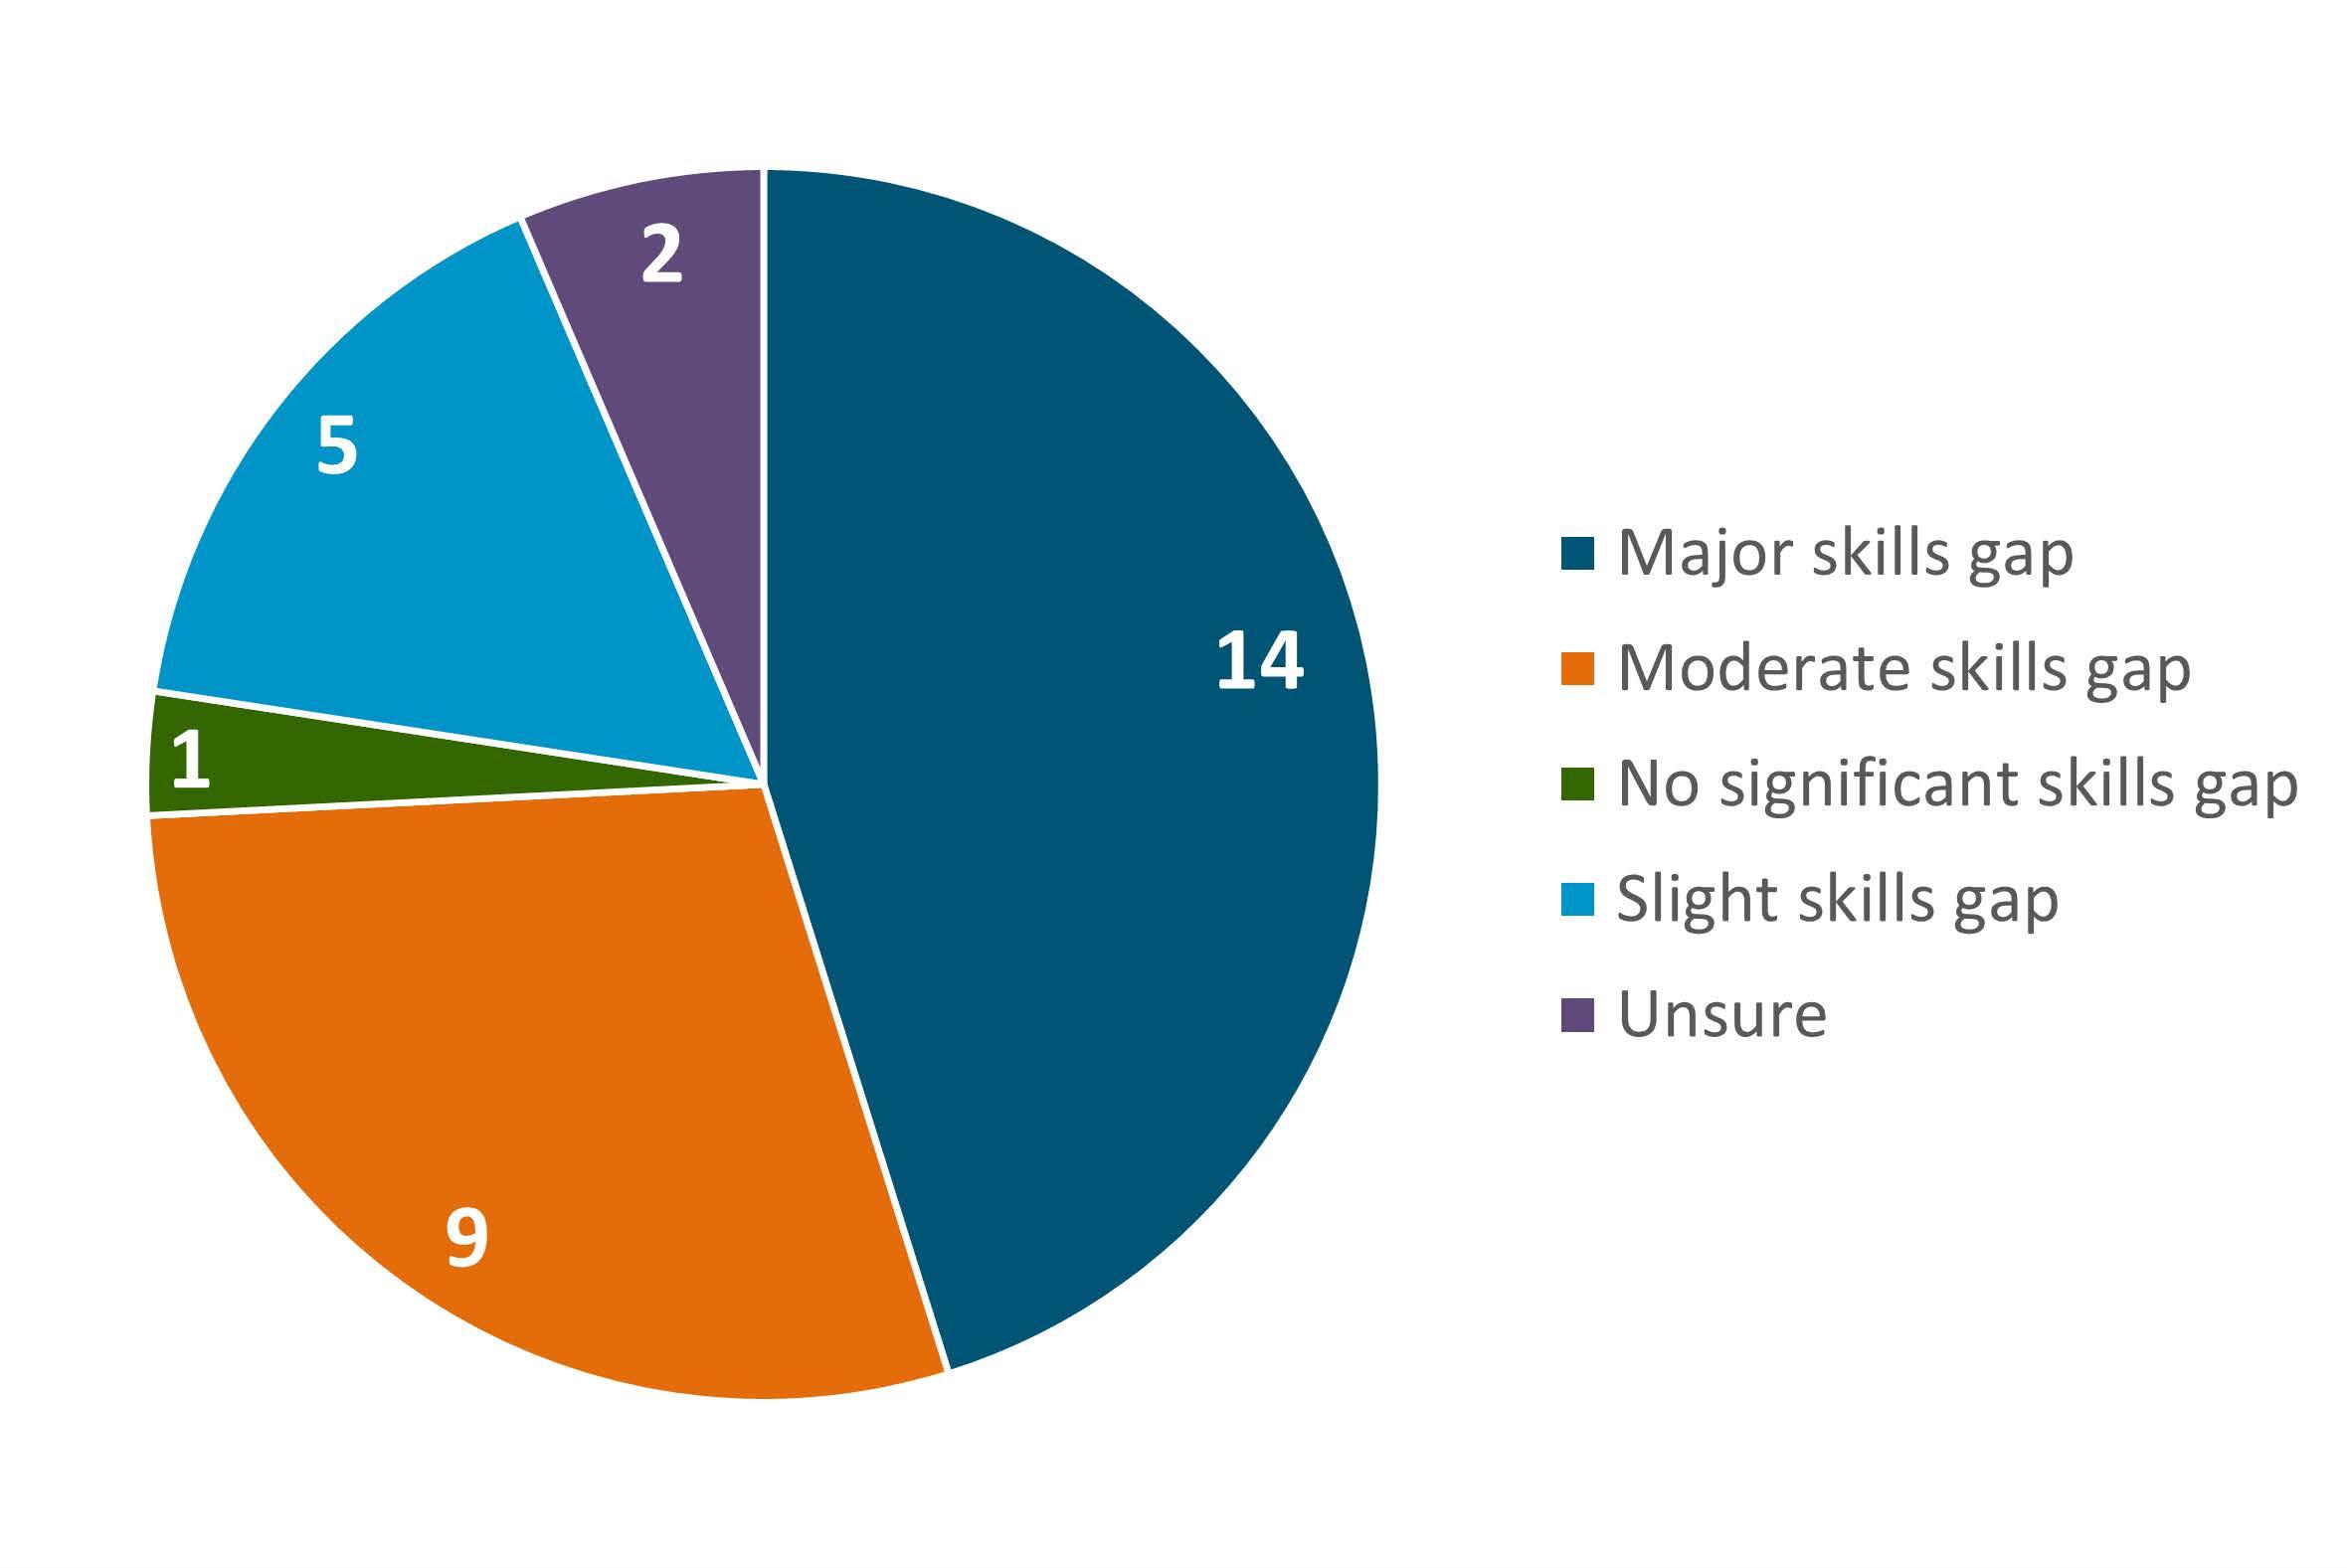
The majority of participants indicated a perception of either a moderate or major skills gap. This group comprised 23 of the 31 responses, highlighting the need for additional training and educational opportunities. A full breakdown of responses is shown in Figure 2 below.
Figure 2: To what extent do you feel there is a skills gap in the current workforce for your hydrogen-related operations?
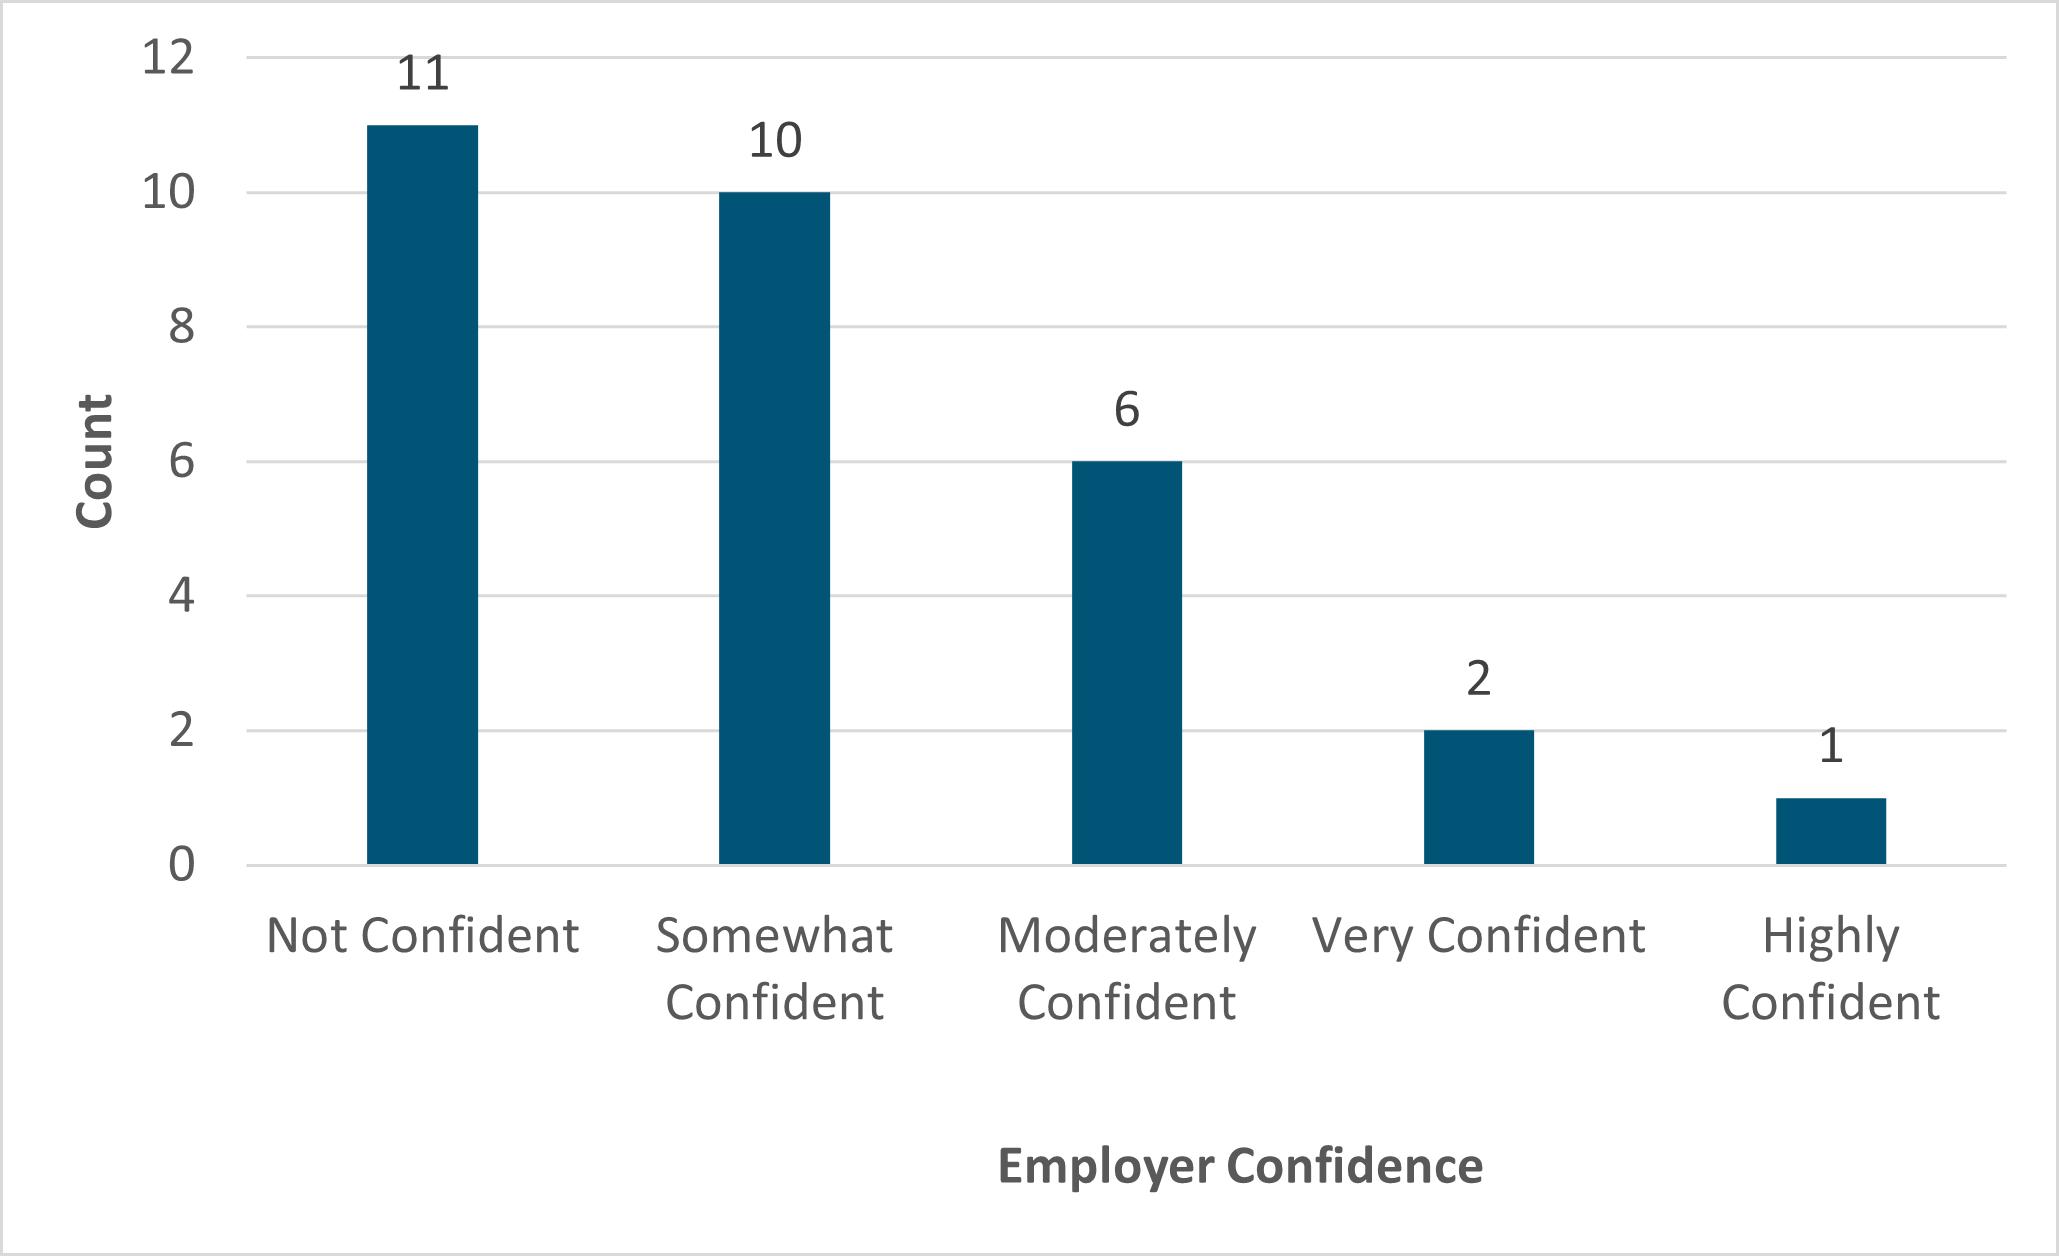
Figure 3: Are current educational programs preparing workers with the skills needed for key hydrogen roles? Please rate your confidence level. (Scale: 1 = Not confident, 5 = Very confident)
As shown in Figure 3, the majority of participants (70.0%) indicated little or no confidence that current educational programs are adequately preparing workers for roles in hydrogen. This finding suggests an opportunity to review existing programs and better align their outcomes with industry needs. Employer feedback will be vital to adequately inform new curriculum to address these needs.
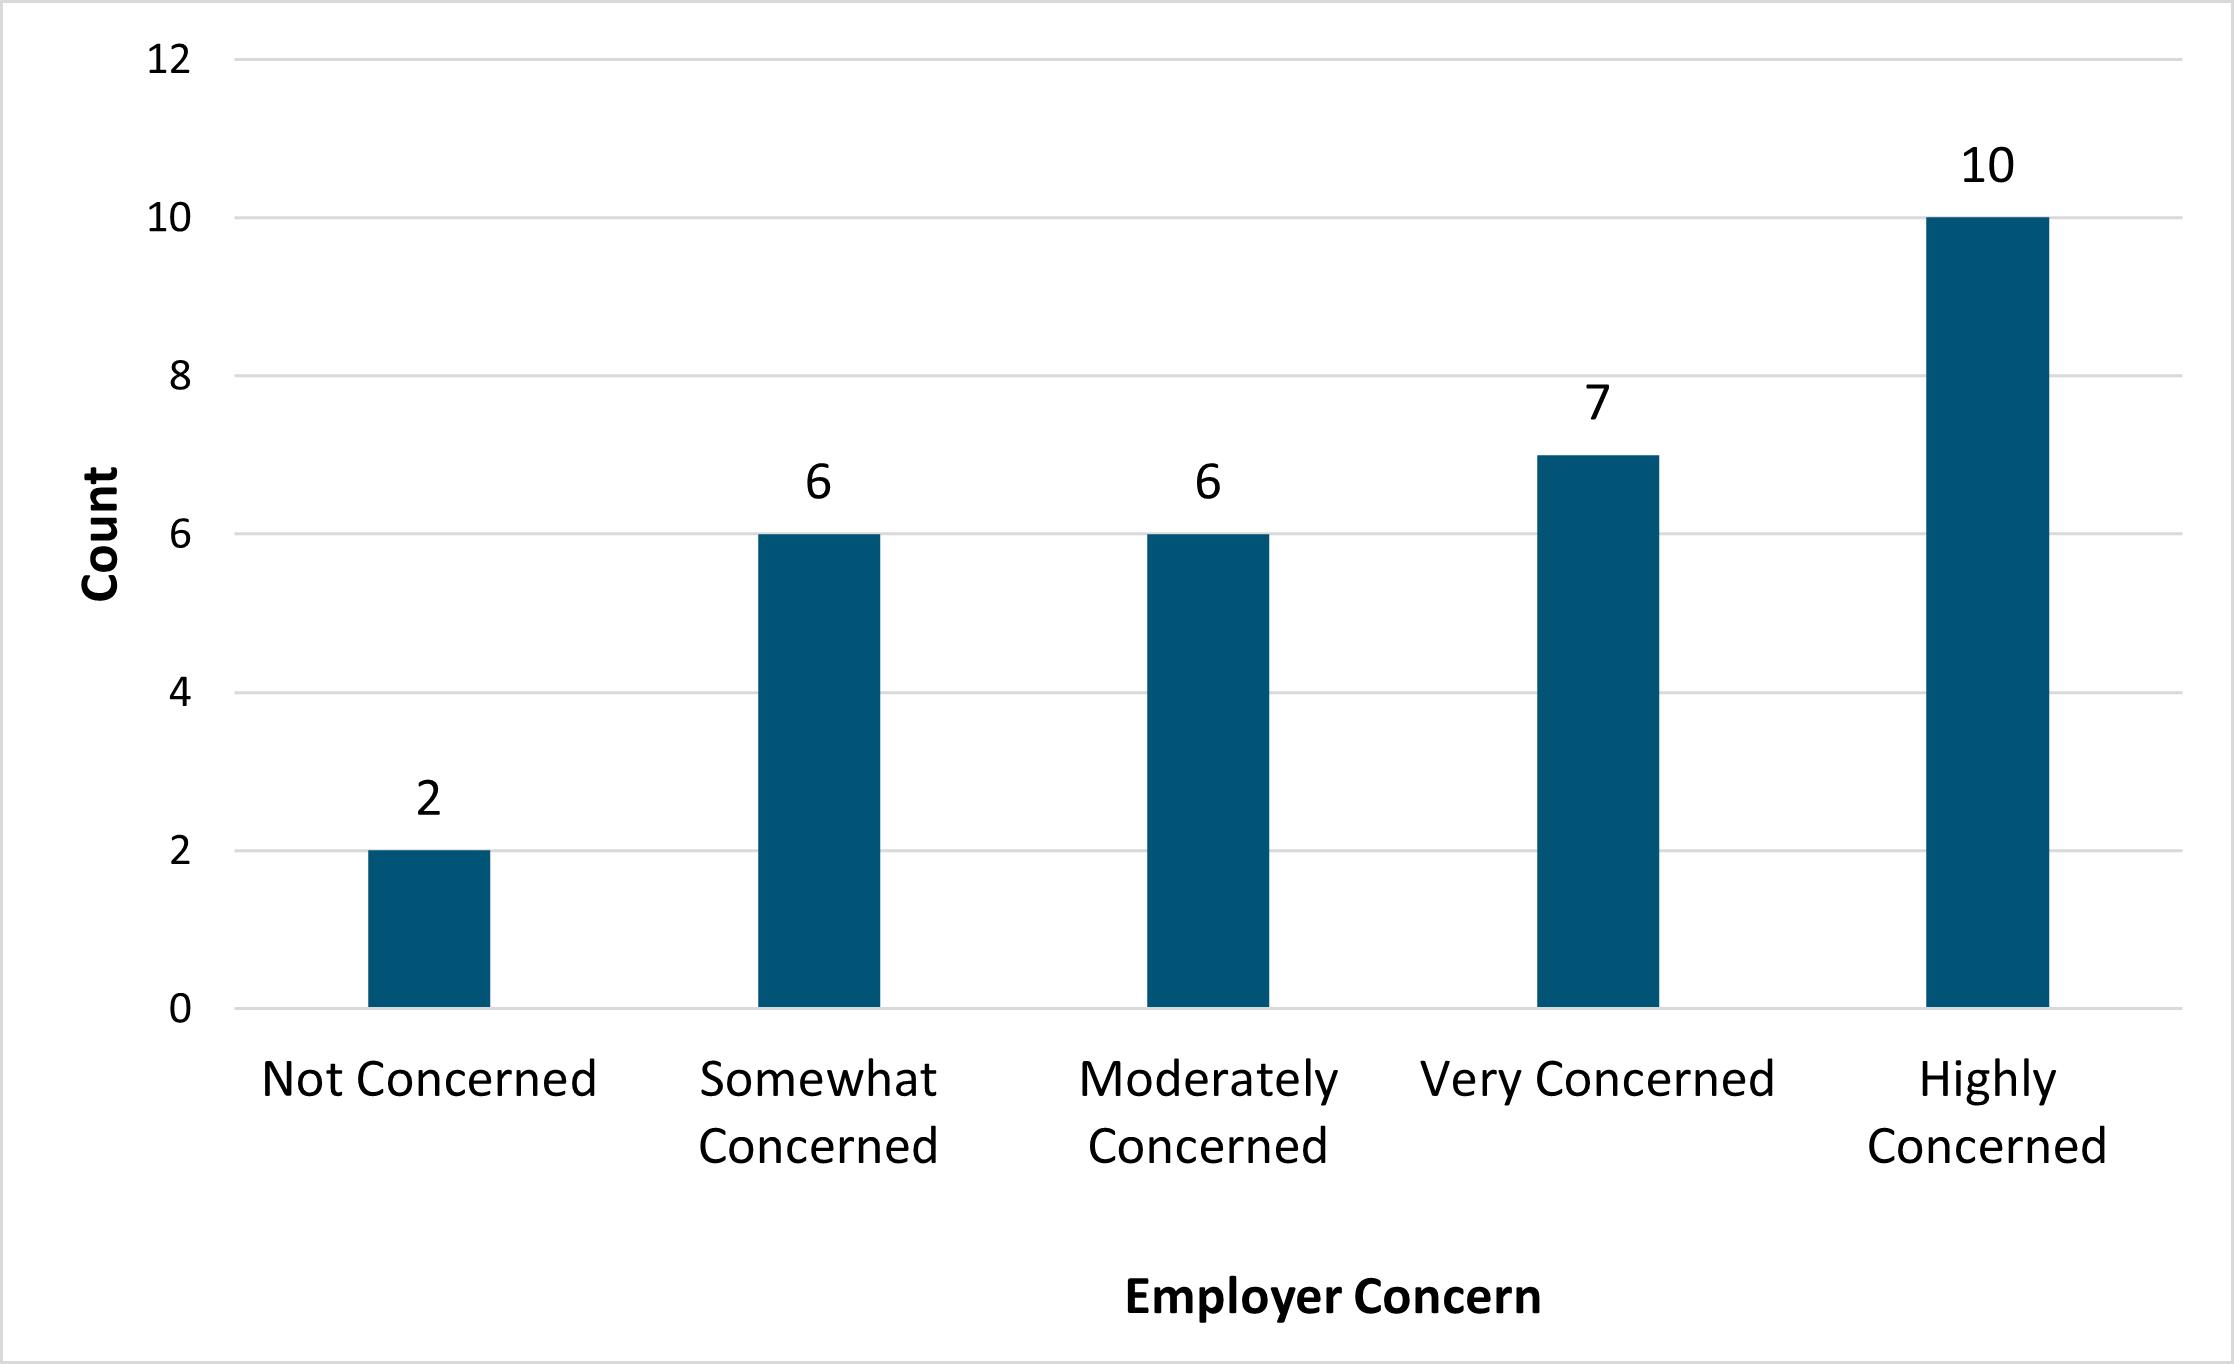
Figure 4 highlights that most participants (74.2%) indicated moderate to high levels of concern regarding a potential shortage of qualified workers in the next five years. In conjunction with the findings on the previous page, it is reasonable to conclude that industry representatives perceive a need for change. One approach that has been successfully replicated in workforce development initiatives is the use of up-skilling or re-skilling of the existing labor force to develop in-demand skills as occupations change.
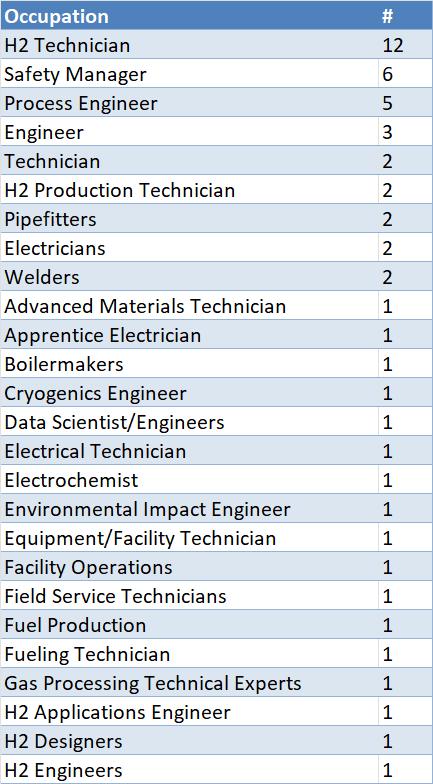
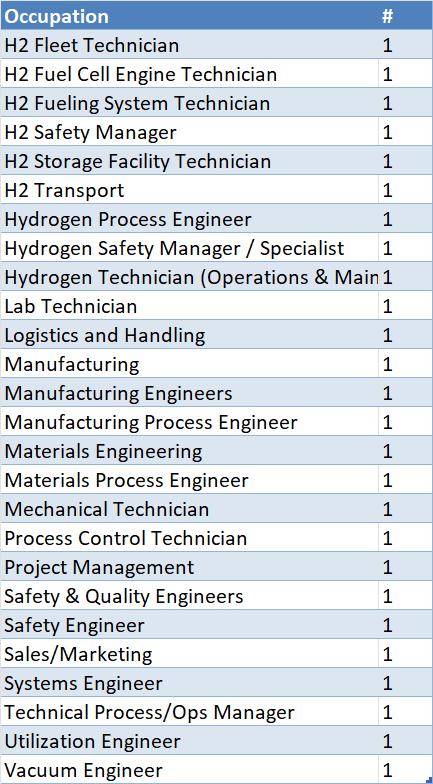
Among the top roles identified as having the greatest need for new or up-skilled talent in the next 3-5 years were H2 Technicians, Safety Managers and Process Engineers. While several organizations identified similar needs in the top three roles, there was considerable variety in the remainder of responses. A total of 56 unique job titles were provided from respondents, indicating a diverse range of needs. Many of these titles can be characterized as either engineering or technician-related in nature. The full responses are shown in Table 1.
Figure 4: To what extent do you anticipate a shortage of qualified workers over the next five years? Please rate your level of concern. (Scale: 1 = Not concerned, 5 = Highly concerned)
Table 1
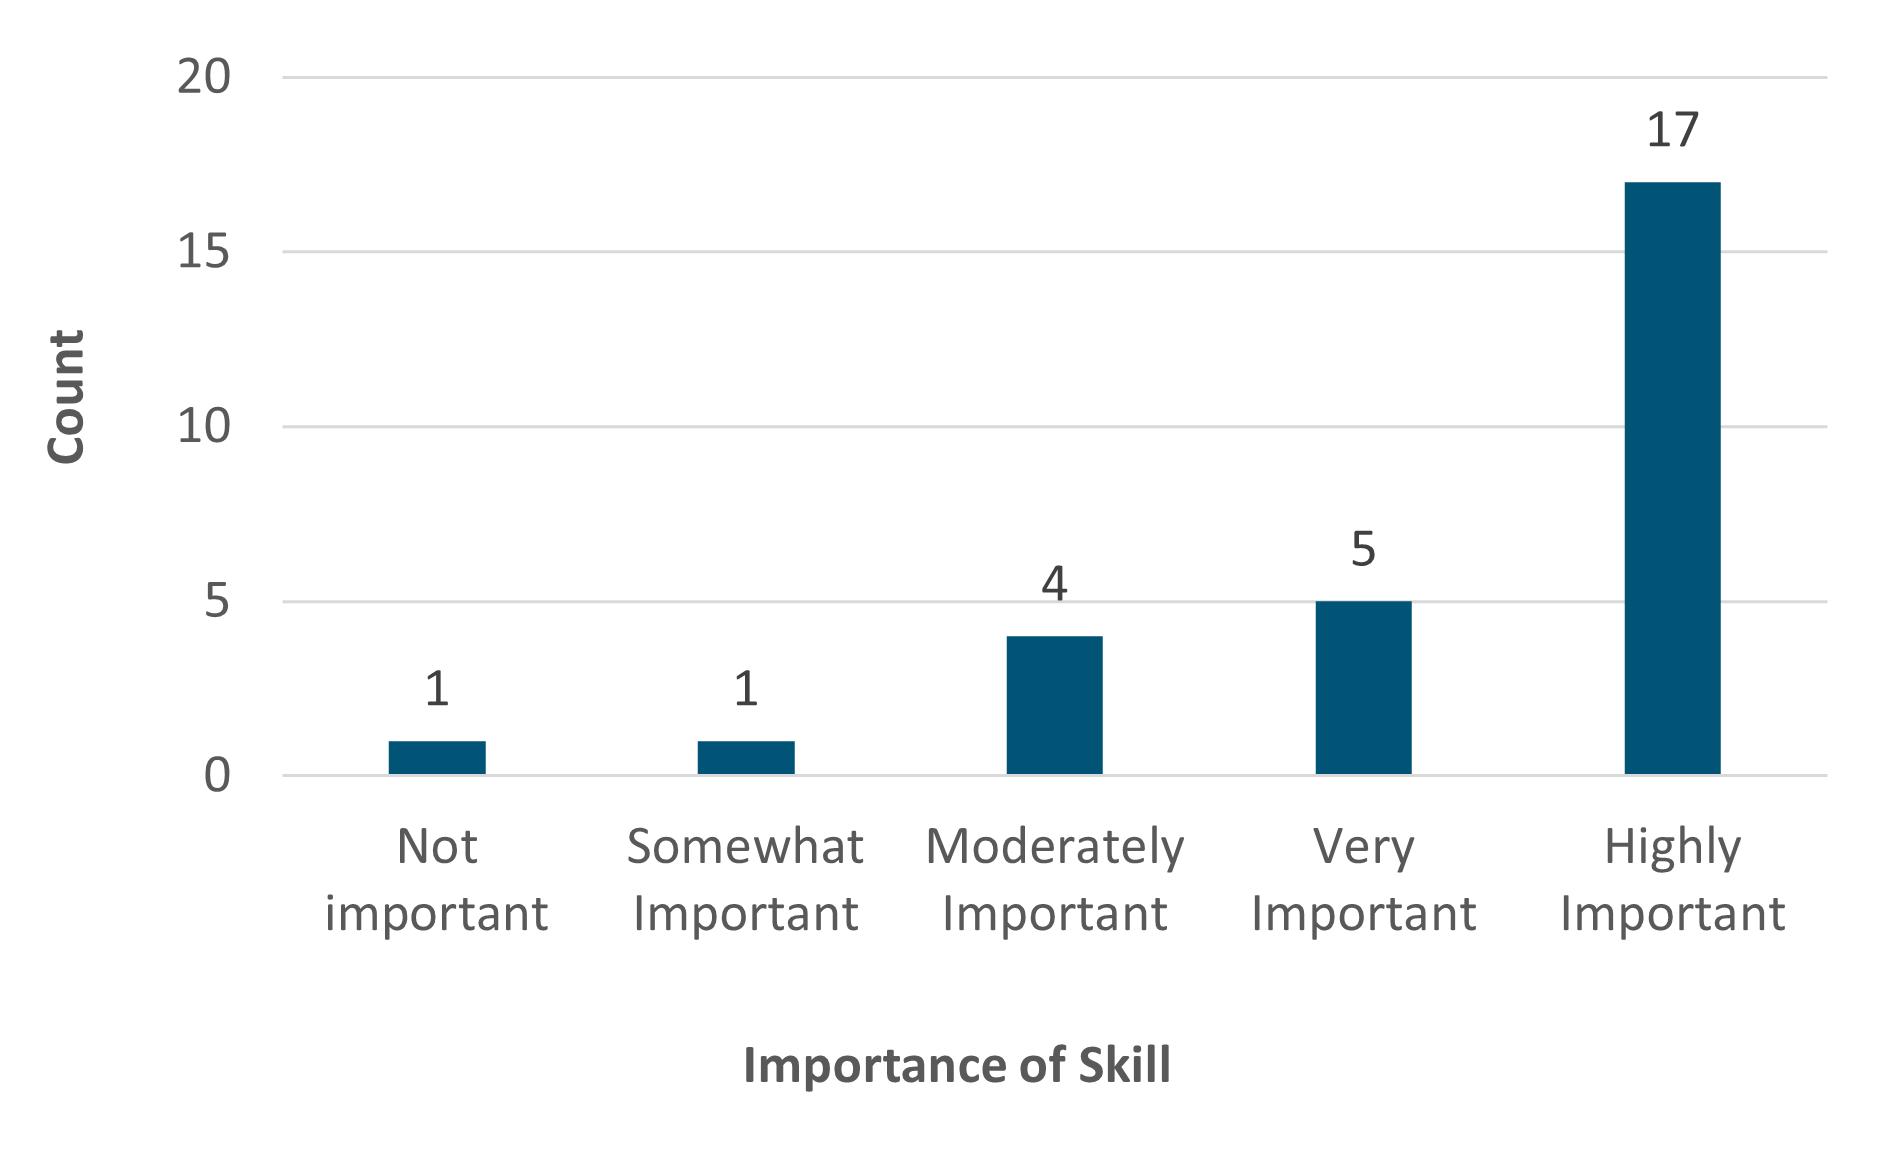
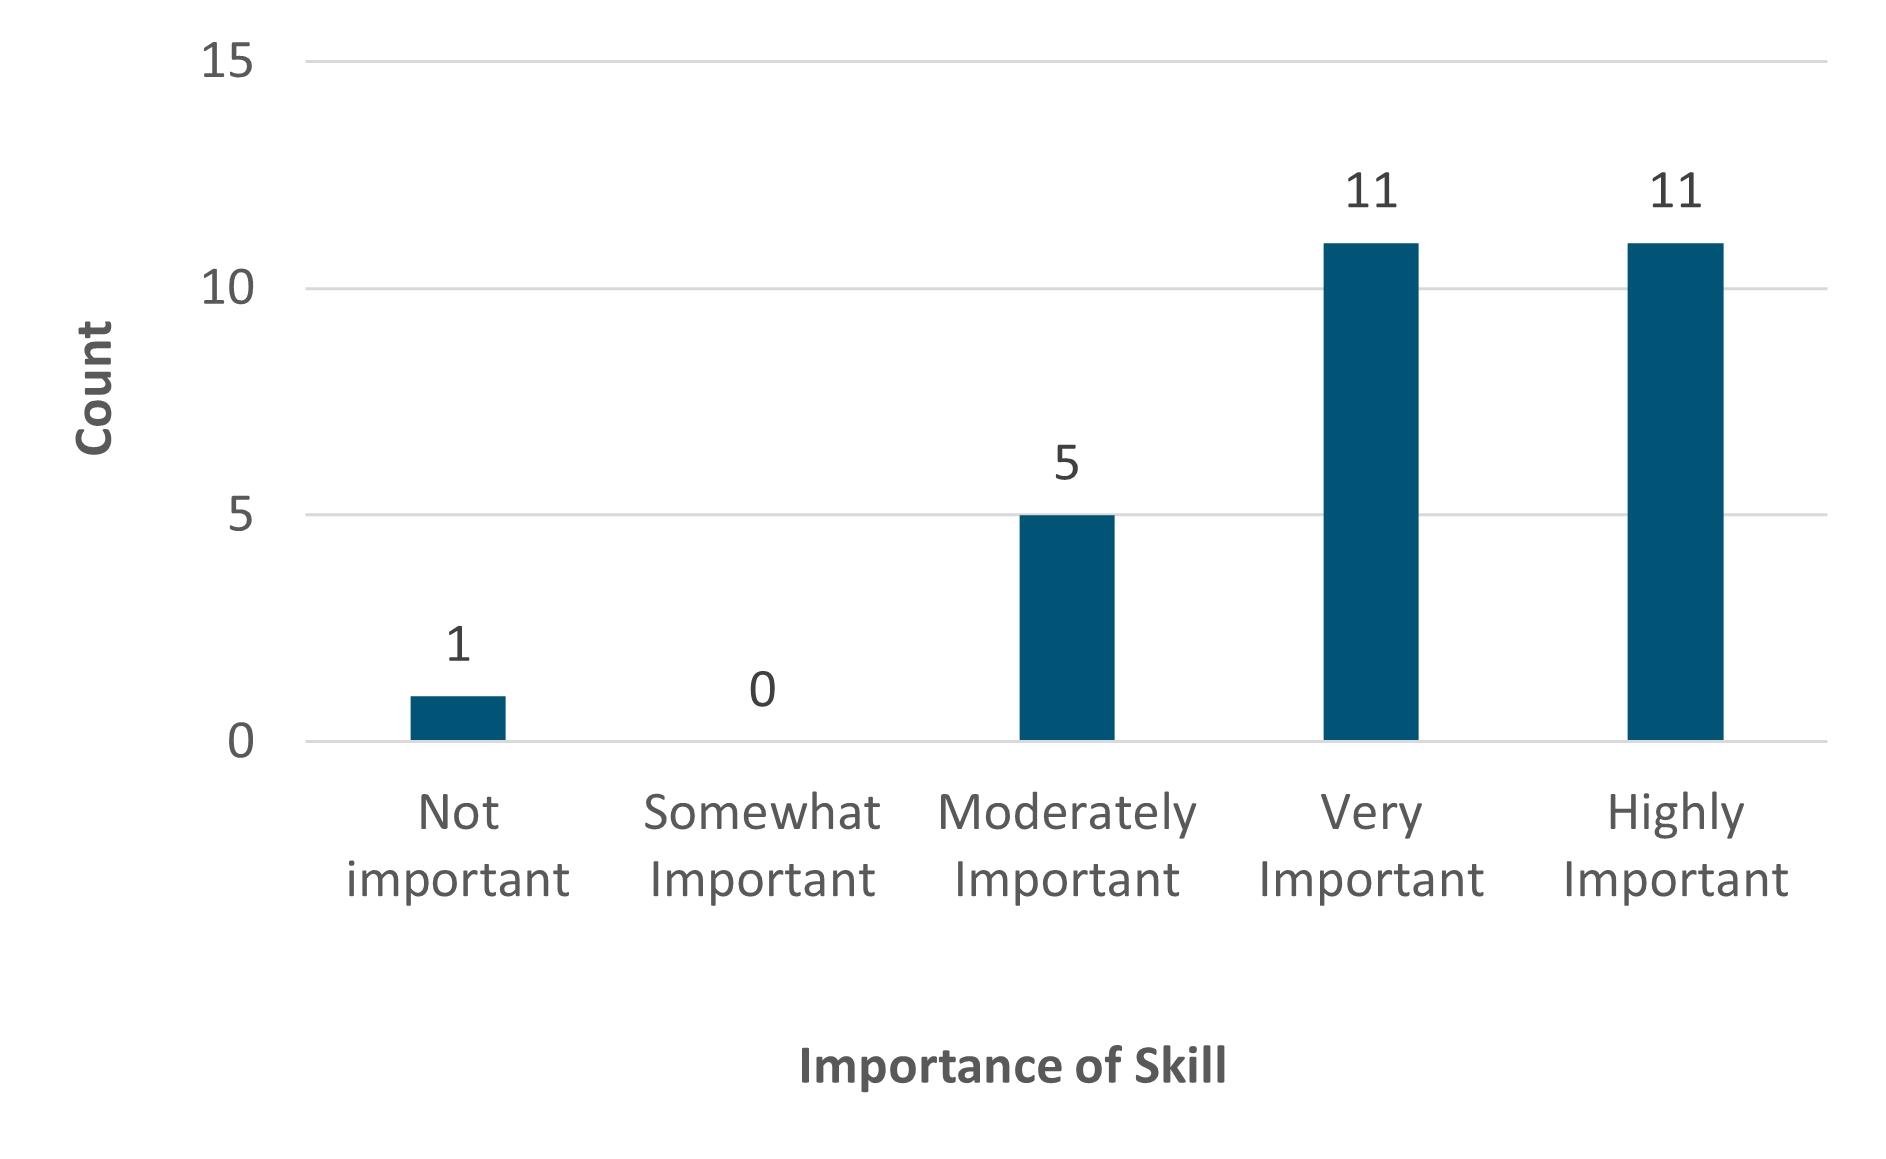
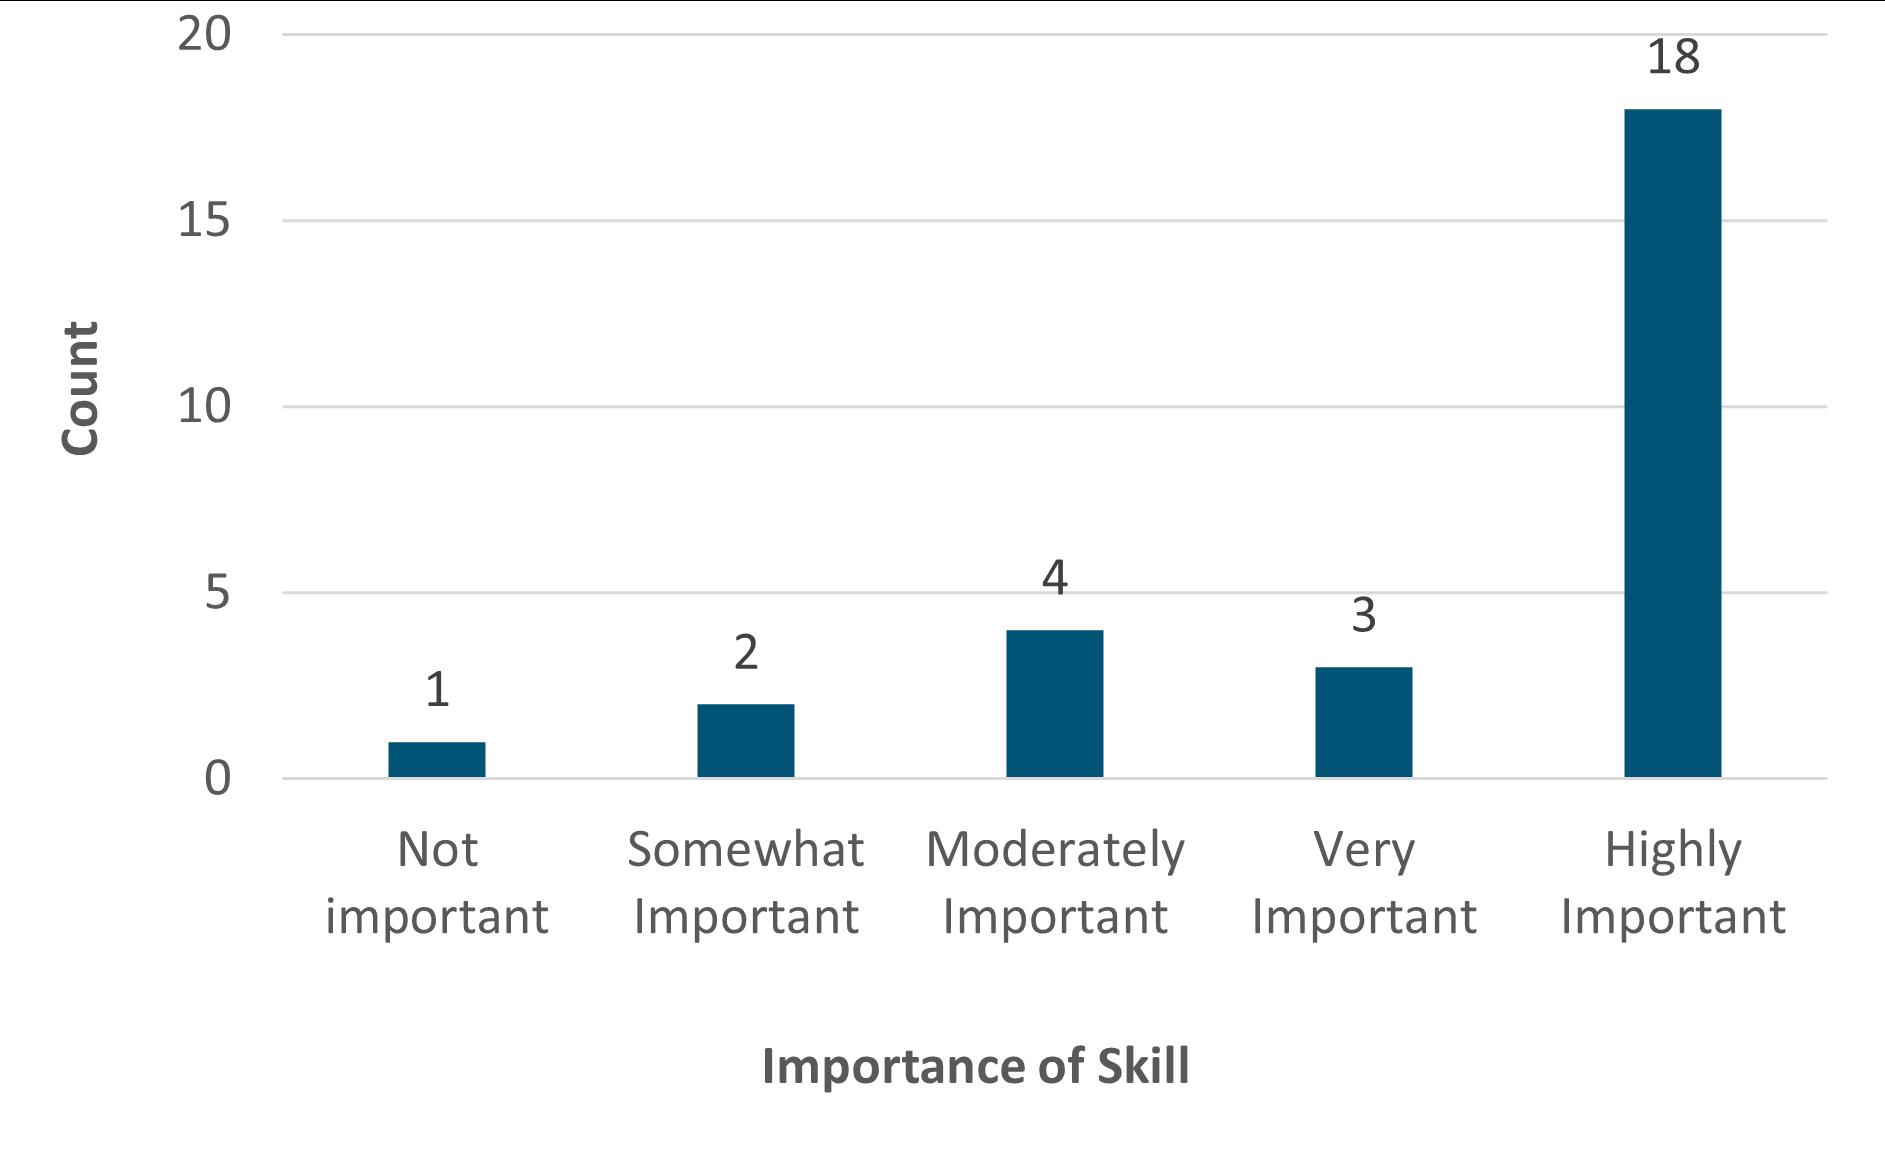
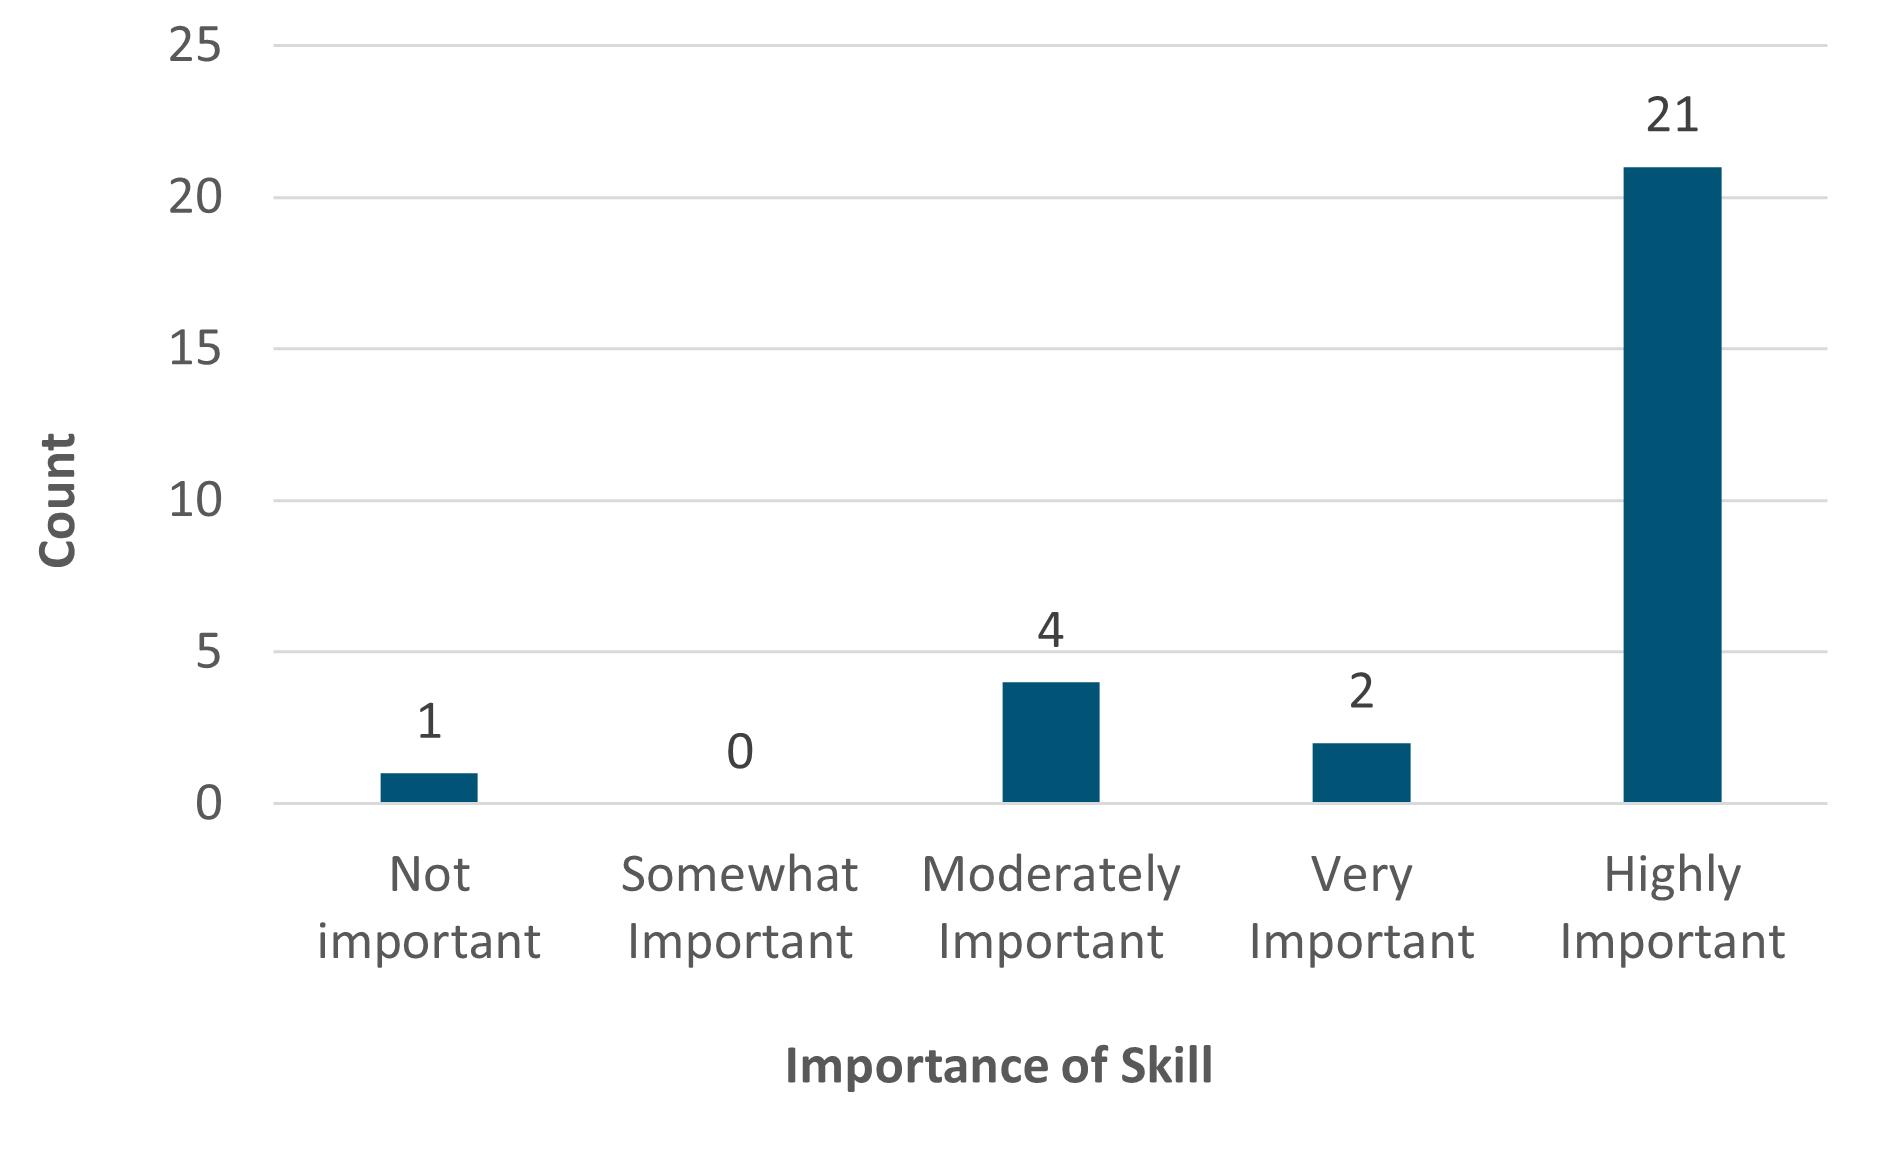
Understanding where talent originates and where skills can be obtained is a critical first step to supporting the hydrogen workforce of the future. Knowing what skills are most important to employers is the next step in this progression. When respondents were asked "Based on your organization's current and future needs, please rate the importance of the following technical skills for your workforce: (Scale: 1 = Not important, 5 = Essential)", the following four metrics (shown in Figures 5.1 - 5.4) emerged as the most important.
Figure 5.1: Knowledge of regulatory compliance issues
Figure 5.3: Fuel cell system integration and operation
Figure 5.4: Hydrogen safety protocols and risk analysis
Figure 5.2: Hydrogen storage and handling
Despite the challenges identified in other areas of the survey, there is a high level of willingness from industry employers to collaborate with institutions for higher education. These proposed efforts will serve to identify skill gaps, develop curriculum, and better prepare employees in the hydrogen sector to meet the current or future demands of employers.
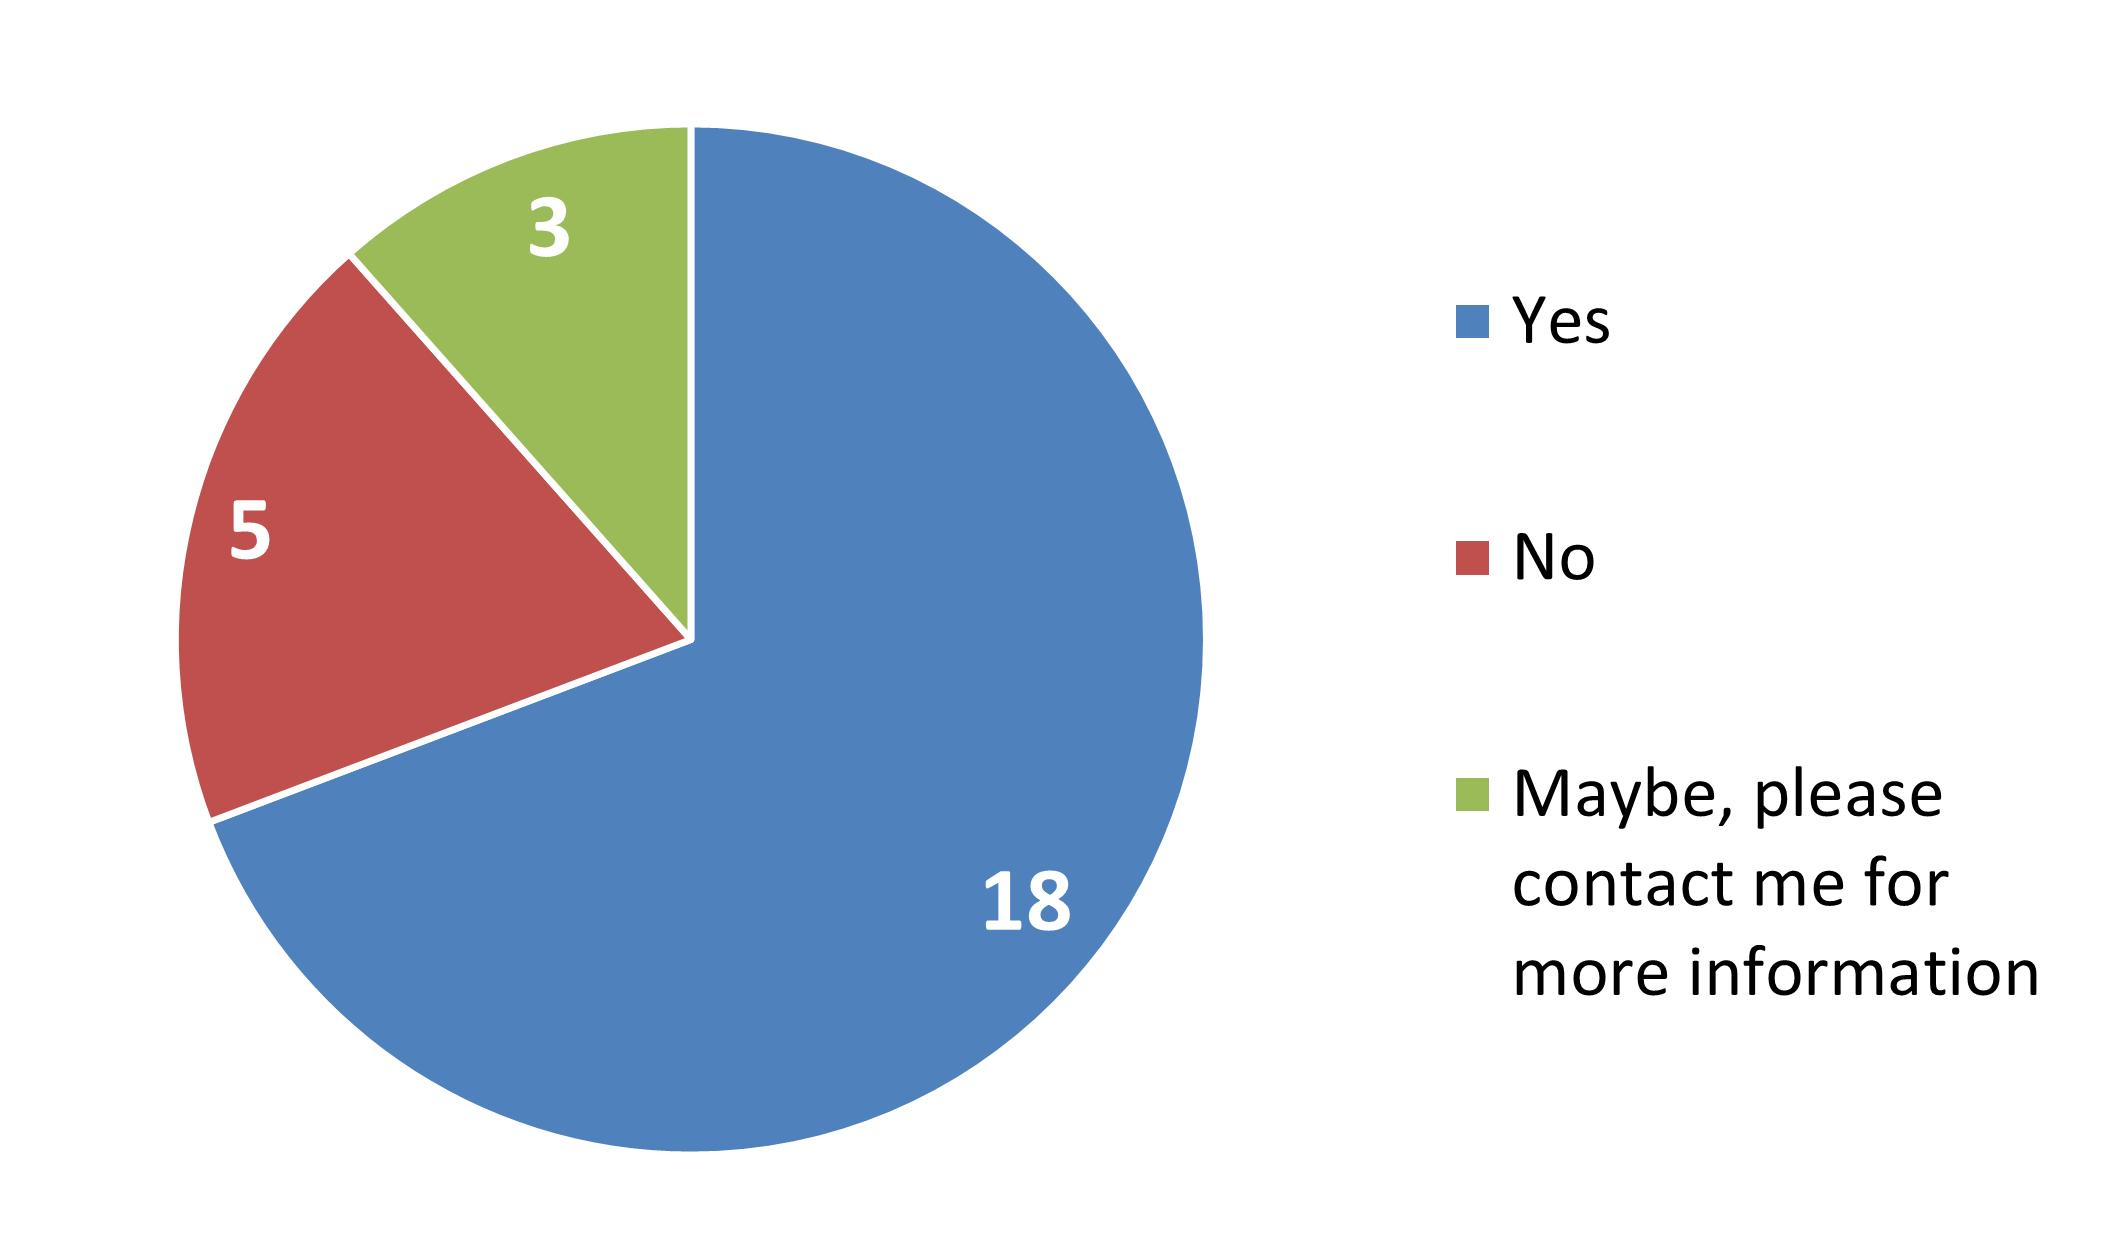
When asked about organizational partnerships as a means to inform curriculum development, the response was very positive, with 69.2% of respondents indicating support. Three more respondents indicated the possibility of a partnership, as shown
Figure 6: Would your organization be interested in partnering with an educational institution to help develop a curriculum for hydrogen-related jobs?
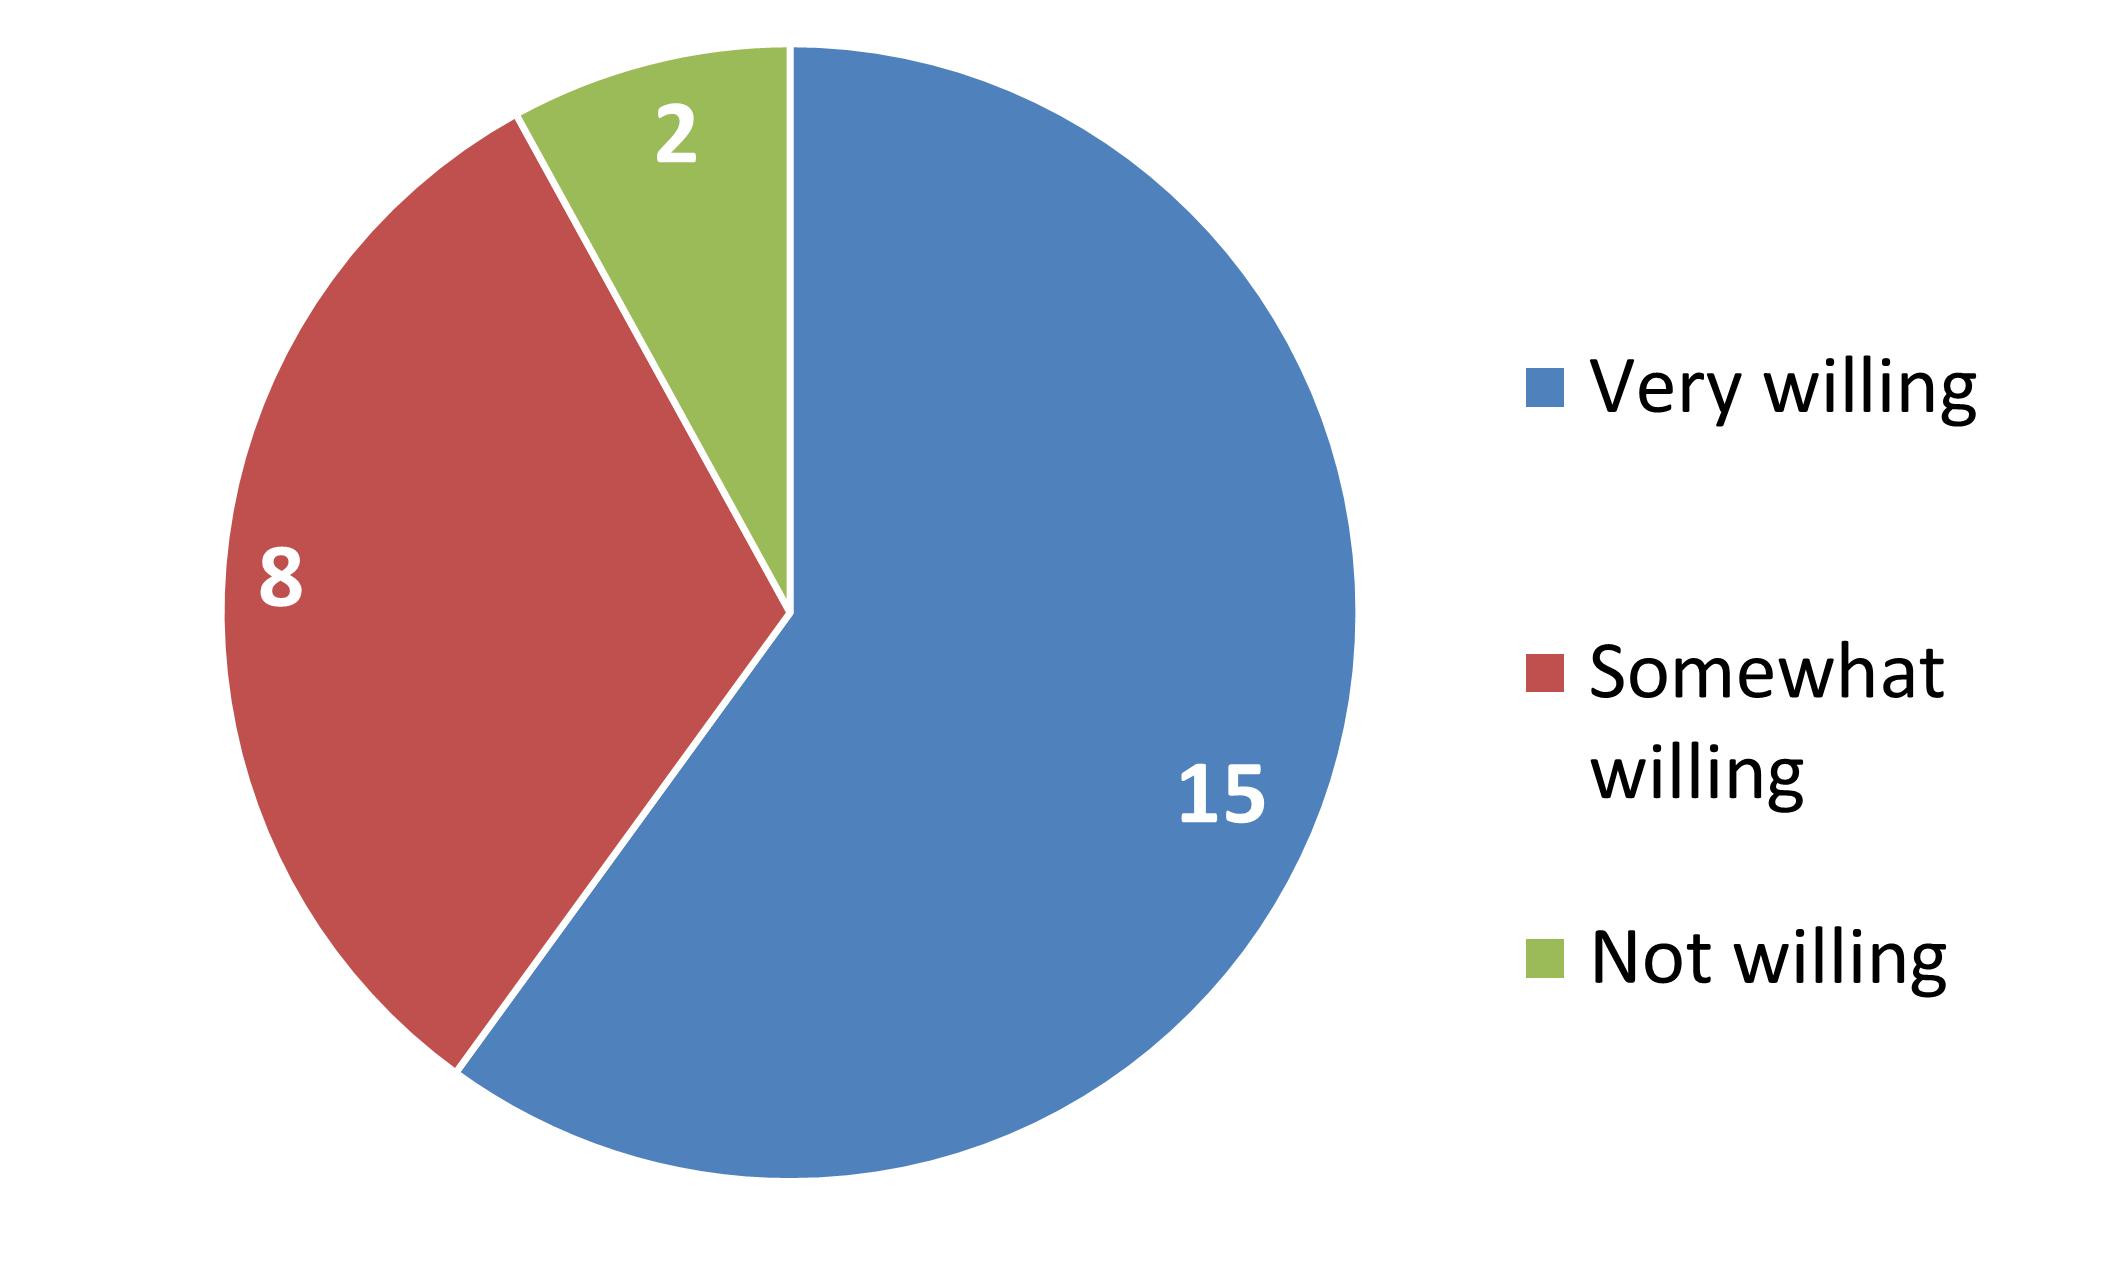
Figure 7: How willing is your organization to partner with an educational institution to develop and implement new re-skilling or up-skilling programs for the hydrogen workforce?
As shown in Figure 7, the majority of participants (60.0%) indicated a strong willingness to support partnerships. This finding suggests an opportunity to review existing programs and better align their outcomes with industry needs. Employer feedback will be vital to adequately inform new curriculum to address these needs.
Key Takeaways
1. Network Composition and Influence
The Social Network Analysis (SNA) revealed a large and interconnected ecosystem consisting of 739 nodes and 2,317 connections. The landscape is primarily driven by the private sector, but anchored by federal funding and regional conveners.
• Sector Breakdown: The majority of the network (51.3%) is comprised of for-profit or private entities, followed by Government (19.6%) and Non-profit (15.2%) organizations.
• Primary Influencers: The U.S. Department of Energy (DOE) was identified as having the strongest influence in the network, most likely due to it's role in project funding.
1. Regional Conveners: The Midwest Alliance for Clean Hydrogen (MACH H2) and the Michigan Economic Development Corporation (MEDC) emerged as top influencers, driving network activity through stakeholder engagement and coordination.
2. Workforce Readiness and the "Skills Gap"
Data from the occupational skills survey indicates significant industry anxiety regarding the current talent pipeline, particularly in the Great Lakes region (Michigan and Ohio).
• Extensive Skills Gap: 74.2% of respondents perceive a moderate to major skills gap in hydrogenrelated training.
• Low Educational Confidence: A significant majority (70.0%) lack confidence that existing educational programs are sufficient to prepare the future workforce.
• Imminent Labor Shortage: 74.2% of participants expressed moderate to high concern regarding a shortage of qualified workers within the next five years.
3. Priority Roles and Technical Competencies
The research identified specific "high-demand" areas where upskilling and reskilling efforts should be concentrated over the next 3–5 years.
Top Priority Roles:
•Hydrogen Technicians
•Safety Managers
•Process Engineers
Critical Technical Skills:
1. Regulatory Compliance: Understanding the evolving legal and safety framework.
2. Fuel Cell Integration: System operation and technical assembly.
3. Storage & Handling: Specialized knowledge in high-pressure or cryogenic hydrogen management
4. Safety Protocols: Risk analysis and emergency response specific to hydrogen.
4. Collaborative Opportunities
There is a clear mandate for workforce development organizations to act as intermediaries between industry and academia.
• Curriculum Development: There is robust support (69.2% of respondents) for organizational partnerships to help shape training curricula.
• Institutional Partnership: Engagement levels are moderate, with 60.0% of respondents (15 of 25) expressing a strong willingness to partner with educational institutions on upskilling and reskilling initiatives.
Appendix A: Methodology
Based on training with Orgnet, LLC, a contractor procured to assist with social network analysis, WIN researchers chose to focus social network analysis research efforts on open source data with a focus on media articles, company sponsored websites, and available meeting information from known conveners of hydrogen stakeholders. Staff attained articles between September 2024 and February 2025. WIN researchers saved articles, sources and searches of additional articles using applicable keywords in the news “app” of search engines such as Google and Yahoo to ensure data was attained from a broad range of sources. The team used a wide range of methods to gather articles, including those received directly from media through regularly received email updates, newsletters from organizations known to provide this type of material, and keyword searches.
The sampling method, commonly known as snowball sampling, is a technique which starts with a focus node. WIN researchers identified multiple levels of connections with this additional research. Researchers used the following keywords to search for applicable articles:
• Hydrogen Energy
• Hydrogen Production
• Hydrogen Industry
• Hydrogen Economy
• Hydrogen Emissions
• Hydrogen Fuel Cell
• Hydrogen
• Hydrogen Research
• Clean Hydrogen
• Hydrogen College Programs
• Hydrogen Distribution
• Hydrogen Hub
• Hydrogen Delivery
• Hydrogen Storage
• Hydrogen Transportation
• Hydrogen Chemical industry
• Hydrogen Cement Production
• Hydrogen Glass Making
• Hydrogen Semiconductor Manufacturing
• Hydrogen Safety
• Michigan*
• Ohio*
*Researchers combined the keywords with an asterisk with the rest of the search terms to create a list related to the region. For example, “Ohio” would have been added to the “Hydrogen Storage” search to obtain articles related to hydrogen storage in Ohio.
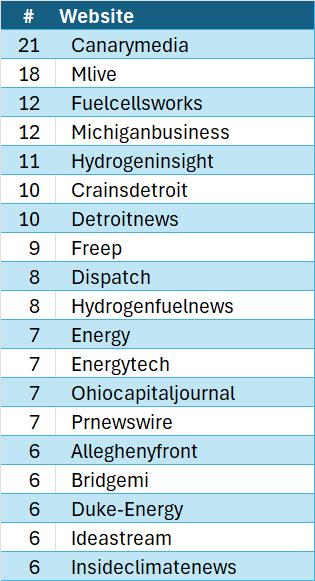
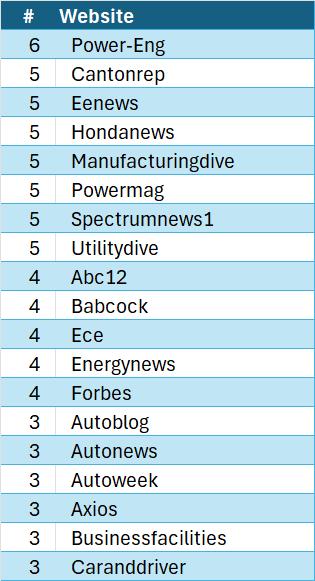
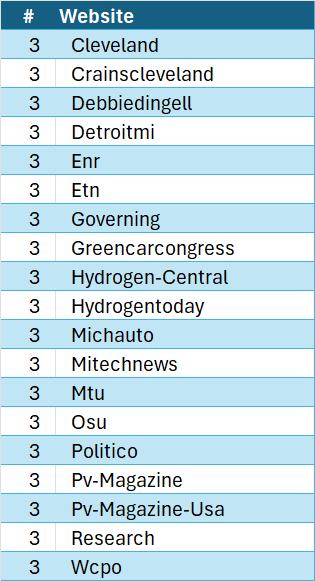
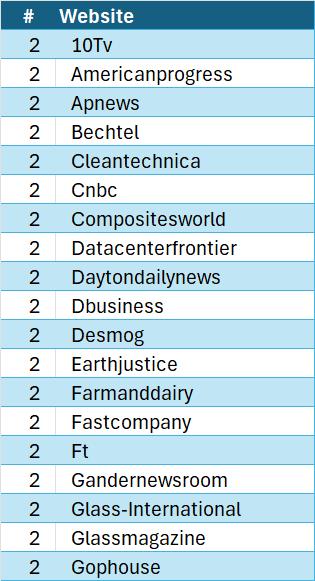
The tables below contain a list of the news sources and the number of articles from each news source.
Bylines of news articles were used to determine the originator of each article.
WIN chose to focus on the connections between organizations rather than connections between individuals. Public sources were less likely to discuss individuals and it was more difficult to determine if individuals were working directly with one another. Articles were most likely to address organizational relationships, partnerships, etc. Each article was treated with the same process for determining the links.
Links identified within the map will only be presented once within the map, regardless of the number of times this link was identified within the articles and materials analyzed. This was determined to be the best process as a higher profile story that may have been covered by multiple stories does not indicate additional strength in the connection, nor does this necessarily indicate a stronger relationship between nodes. Creating network maps is an iterative process. With multiple sources of data, conflicting information can be seen and explored and alternate spellings and acronyms can be found. This results in input and correlation activities related to the social network map. Data was de-duplicated manually using Excel formatting by the WIN research team. A series of maps were created and revised for minor errors and accuracy (duplicate organization names, spelling errors, etc).
Reading the map and explanation of connections
The research team revised its approach to focus on the “central hubs,” eliminating organizations with one or fewer connections (the outliers). Included in the list were organizations with two or more connections on the maps.
Methodology and standardization: Company specific webpage research
The following parameters were used to decide whether to include an organization in the SNA:
1. For membership organizations (ex: Ohio Fuel Cell & Hydrogen Coalition), all members were included in the list if the membership organizations were actively working in the hydrogen space.
2. For general partnerships, researchers required that there be a hydrogen component as part of the relationship. Example: OFCHC lists all its partners on their website. These partners were included if there is a hydrogen component to their relationship.
3. Meeting attendees were included if they were linked to the meeting host, but not necessarily to each other. If an organization representative attends a meeting, it can be assumed that a relationship exists between the meeting holder and the attendee, but this does not guarantee that interaction or a relationship was developed between meeting attendees. Example: WIN Hydrogen Research Team can be linked to University of Toledo, but not necessarily to other University of Toledo partners (one assumes they are working with WIN, but attending a meeting does not mean they are working with each other)
Limitations:
Link Strength
The current maps reflect connections that have been established using our described methodology. While the strength of these connections is relevant, it was concluded that an assignment of strength between nodes is not able to be determined using the existing public data sources. The recurrence of connections in news articles, on website pages, and in meeting notes may only represent that a story is of a higher profile and therefore received more coverage than other stories. For example, when NEL announced their electrolyser factory in Michigan, the coverage of this story dominated all other hydrogen and industry news reports. Thus, the strength of these ties would be inaccurately magnified.
Elimination of Single Nodes
WIN’s elimination of organizations with a single connection before the website research phase did not eliminate single nodes from the final map. The organizations on the current map with only one connection are those that were discovered because of the website research of the betterconnected organizations. For example, on WIN’s map, the National Science Foundation (NSF) is only connected to Cleveland-Cliffs. This connection was discovered while doing research on ClevelandCliffs. WIN did not encounter other connections to NSF in its initial research.
The single connection nodes could be further developed in a future stage of the project, as they may be connected to several different organizations in the hydrogen space.
Additional Limitations
1. Strength of connections is not accurately determinable using existing data sources.
2. The variety of news sources is limited based on what WIN staff members encountered and could attain through searches.
3. Hydrogen research and development is considered proprietary information by many organizations. Proprietary information is not shared with the public and, thus, many existing relationships may not be included in this analysis.
4. Due to the competitive nature of the current hydrogen industry, many organizations have kept their relationships and partnerships with others confidential.
5. Networks change, and change is more likely to occur early in the life of the sector. This sector, while tied to a mature energy industry, is likely to shift drastically in the next few years. Consistency will develop over time.