

A Message from the President
As Wilson Community College closes out its 65th year, it is especially important that we honor the achievements of our predecessors by charting new directions and setting goals to serve the college and the great Wilson County community.
This document will outline the college’s 2023-28 strategic plan, a plan developed through feedback from the college’s constituents—students, employees, and community members. Campus members also had the opportunity to review relevant data as they determined areas of potential growth and improvement.
One thing we know for certain—we must be adaptive and responsive to thrive in the new era of higher education. We must anticipate—to the best of our ability—educational and economic disrupters so that we can respond with the programs and services our students and partners need. And we must respond more rapidly than ever before.
We must be willing to address gaps in student performance and strive to provide not just access but also success for every single student. We must establish our value proposition to a steadily decreasing pool of high school graduates who have 10 higher education providers within 50 miles of Wilson Community College, many more when online options are taken into consideration.
While these challenges can seem daunting, Wilson Community College has the employee dedication and drive to turn these challenges into opportunities. Working together, we will create the future that our students and citizens deserve.
Invest and elevate,

Jami L. Woods, Ph.D. President
Purpose & Need
Strategic planning provides organizations with an opportunity to analyze their strengths, weaknesses, opportunities, and threats, while also taking a close look at metrics that indicate successes and areas for improvement. Done correctly, it is a true learning opportunity—one that allows everyone to deepen their knowledge of the organization. It also provides the road map forward, and with a five-year plan, it should include the more audacious goals that need carefully phased steps and resource allocation. Strategic planning—at its best—puts thoughts into action and provides the best kind of accountability.
Wilson Community College’s current strategic plan expired in 2022. In September 2022, the Strategic Plan Ad Hoc Committee was formed to document the 2017-22 plan results and to use the 2017-2022 plan as a starting point for crafting the new strategic plan.
During this transition phase in the strategic planning process, the college’s president, Dr. Tim Wright, retired and Dr. Jami Woods assumed the presidency on June 1, 2023. The outgoing president delayed launching a new plan, as it was determined that a new president would want to finalize the strategic plan that would provide the college’s direction for the next five years. The new president, in consultation with the Board of Trustees, the President’s Cabinet, and the newly formed Planning Committee, determined that a project relaunch would lead to a more robust plan with greater buy-in from a broader group of constituents. This approach also included data analysis that was not considered during the pause between the previous strategic plan and the new one.
Working from the foundation provided by the prior ad hoc planning committee, the newly created, permanent Planning Committee revisited key data points and identified student, college, and community-focused goals with clear benchmarks for success. The plan was presented to the Board of Trustees in September 2023 for their approval, and these goals will drive annual planning for the next five years, with adaptations and revisions occurring as needed based on a yearly review of outcomes.
College Mission, Vision, & Values
Mission
The mission of Wilson Community College was revised in January 2023 to reflect the college’s renewed focus on student success and the reduced emphasis on environmental sustainability: Wilson Community College provides opportunities for academic excellence, student success, workforce development, and community partnerships. The college had not reviewed its values since 2017, and the Planning Committee led a review and revision of the values consistent with the manner in which the college community will pursue its strategic plan and the principles that ground our work.
Values
Values are the characteristics we believe are important in how we do our work.
SUCCESS: Commit to continuous improvement and innovation in support of student-centered teaching and learning.
PARTNERSHIPS: Work together to achieve common goals and expand partnerships that meet the needs of students, employees, and the community we serve.
INTEGRITY: Operate with honesty, fairness, and transparency.
COMPASSION: Understand that we all face challenges and respond with empathy and a desire to help.
BELONGING: Promote a culture that is welcoming and supportive of students, employees, and the broader community.
COMMUNICATION: Strive to listen actively and to communicate clearly, accurately, and effectively.
RESILIENCE: Embrace change with a spirit of resiliency and adaptability.
Goals
Overarching, presented broadly:
• Access and Success
• Excellence in Teaching and Learning
• Workforce Development and Community Partnerships
• Employee Engagement and Development
• College Environment and Resources
• Campus Culture
Data

Scan
A scan was conducted of both Wilson County and the state of North Carolina using Jobs EQ. The information gathered is presented below in various categories and based on demographic data. Please note there is no way to determine if these populations are students at Wilson Community College, but the information can provide great insights into our potential student body and how to better serve them moving forward.
Demographics
AGE AND GENDER: Females account for 53% and males account for 47% of Wilson County’s population. The largest group based on age is under 18 years old with 18,749 persons or 23%. This group is followed by those ages 55 to 64 at 14% with 11,360 persons. Age groups 45 to 54 and 25 to 34 follow very closely with roughly 12% each.
Source: JobsEQ®

FIGURE 1. WILSON COUNTY POPULATION BY AGE GROUP.
TABLE 1. WILSON COUNTY POPULATION BY AGE GROUP
RACE AND ETHNICITY: Wilson County is predominately composed of people who identify as either White or Black or African American, according to JobsEQ data. Those who identify as White make up almost 50%, while those who identify as Black or African American represent approximately 40%. Other races represented within Wilson County include Asian, American Indian and Alaska Native, two or more races, and some other race.
Source: JobsEQ®

FIGURE 2. WILSON COUNTY POPULATION BY RACE.
TABLE 2. WILSON COUNTY POPULATION BY RACE.
EDUCATION: The education data provided by JobsEQ is relevant to those ages 25 to 64. Wilson County’s highest group is high school graduates, with 13,249 people. Those who have some college, no degree, make up 21% of our population. The next largest group is those with no high school diploma at 6,519, or almost 16%.
Source: JobsEQ®

FIGURE 3. WILSON COUNTY RESIDENTS’ EDUCATIONAL ATTAINMENT LEVEL.
TABLE 3. WILSON COUNTY EDUCATION DATA FOR THOSE AGES 25-64
HOUSING: Wilson County has 36,332 housing units. Of those, 12,646 are renter-occupied units. There are currently 1,194 vacancies, with almost 850 of those being rentals. Occupied housing units with no vehicle available are measured at 2,962.
2 Median values for certain aggregate regions (such as MSAs) may be estimated as the weighted averages of the median values from the composing counties.
Source: JobsEQ®

SOCIAL: The poverty level for Wilson County is 15,965 which is almost 20% of our population. There are currently 6,049 households receiving food stamps/SNAP, which is almost 19%. Forty-seven percent of our residents are children in single parent families (% of all children). Wilson County also includes 9,562 people, or 12%, who are uninsured.
TABLE 4. HOUSING INFORMATION FOR WILSON COUNTY RESIDENTS
FIGURE 4. HOUSING INFORMATION FOR WILSON COUNTY RESIDENTS
As for those who indicated they have a disability between ages 18-64, there are over six thousand. Of those that participate in our labor force within the same range, there are 2,101. Residents who were foreign born account for almost 6%, at 4,786. Of those who are age 5 years and over, 4% consider themselves to speak English ‘less than very well’.
SOCIAL CATEGORY
3 Disconnected Youth are 16-19-year-olds who are (1) not in school, (2) not high school graduates, and (3) either unemployed or not in the labor force. Source: JobsEQ®

TABLE 5. WILSON COUNTY SOCIAL CATEGORIES
FIGURE 5. WILSON COUNTY SOCIAL CATEGORIES
Industry
Total employment for all industries in Wilson County totals 35,088. New hires account for 8,225 per quarter on average. Turnover rates per quarter are approximately 9%. The average annual salaries are as follows: stable jobs $54,554, new stable jobs $34,977.
1 Total industry figures do not reflect employment in unclassified industries (NAICS 9999).
Source: JobsEQ®

FIGURE 6. INDUSTRY DATA FOR WILSON COUNTY
TABLE 6. INDUSTRY DATA FOR WILSON COUNTY
Occupation
AGE: The majority of those working in Wilson County are from the 45- to 54-year-old age group. This group consists of almost 8,000 people. The following two groups that are roughly 7,000 are those 25- to 34-years old and 35- to 44-years old. The lowest employed are those aged 16 to 19 with under 1,500 people.
Source: JobsEQ®

FIGURE 7. NUMBER OF EMPLOYED PERSONS IN WILSON COUNTY BY AGE GROUP
TABLE 7. NUMBER OF EMPLOYED PERSONS IN WILSON COUNTY BY AGE GROUP
EDUCATIONAL ATTAINMENT: Of those who live in Wilson County, over 11,000 have a high school diploma. The next largest group is those with a four-year degree at over 6,000. Following closely behind, at over 5,000, are those who only have some college. Just over 4,000 people have less than a high school diploma.
Source: JobsEQ®

FIGURE 8. WILSON COUNTY RESIDENTS’ EDUCATIONAL ATTAINMENT
TABLE 8. WILSON COUNTY RESIDENTS’ EDUCATIONAL ATTAINMENT
RACE: Wilson County’s largest employed races are white (19,513) and black (13,223).
TABLE 9. NUMBER OF WILSON COUNTY RESIDENTS BY RACE
Source: JobsEQ®
9. NUMBER OF WILSON COUNTY RESIDENTS BY RACE

FIGURE
ETHNICITY: Non-Hispanic/Latino ethnicities comprise over 30,000 of Wilson County’s workers.
TABLE
Source: JobsEQ®

FIGURE 10. ETHNICITY OF WILSON COUNTY RESIDENTS
10. ETHNICITY OF WILSON COUNTY RESIDENTS
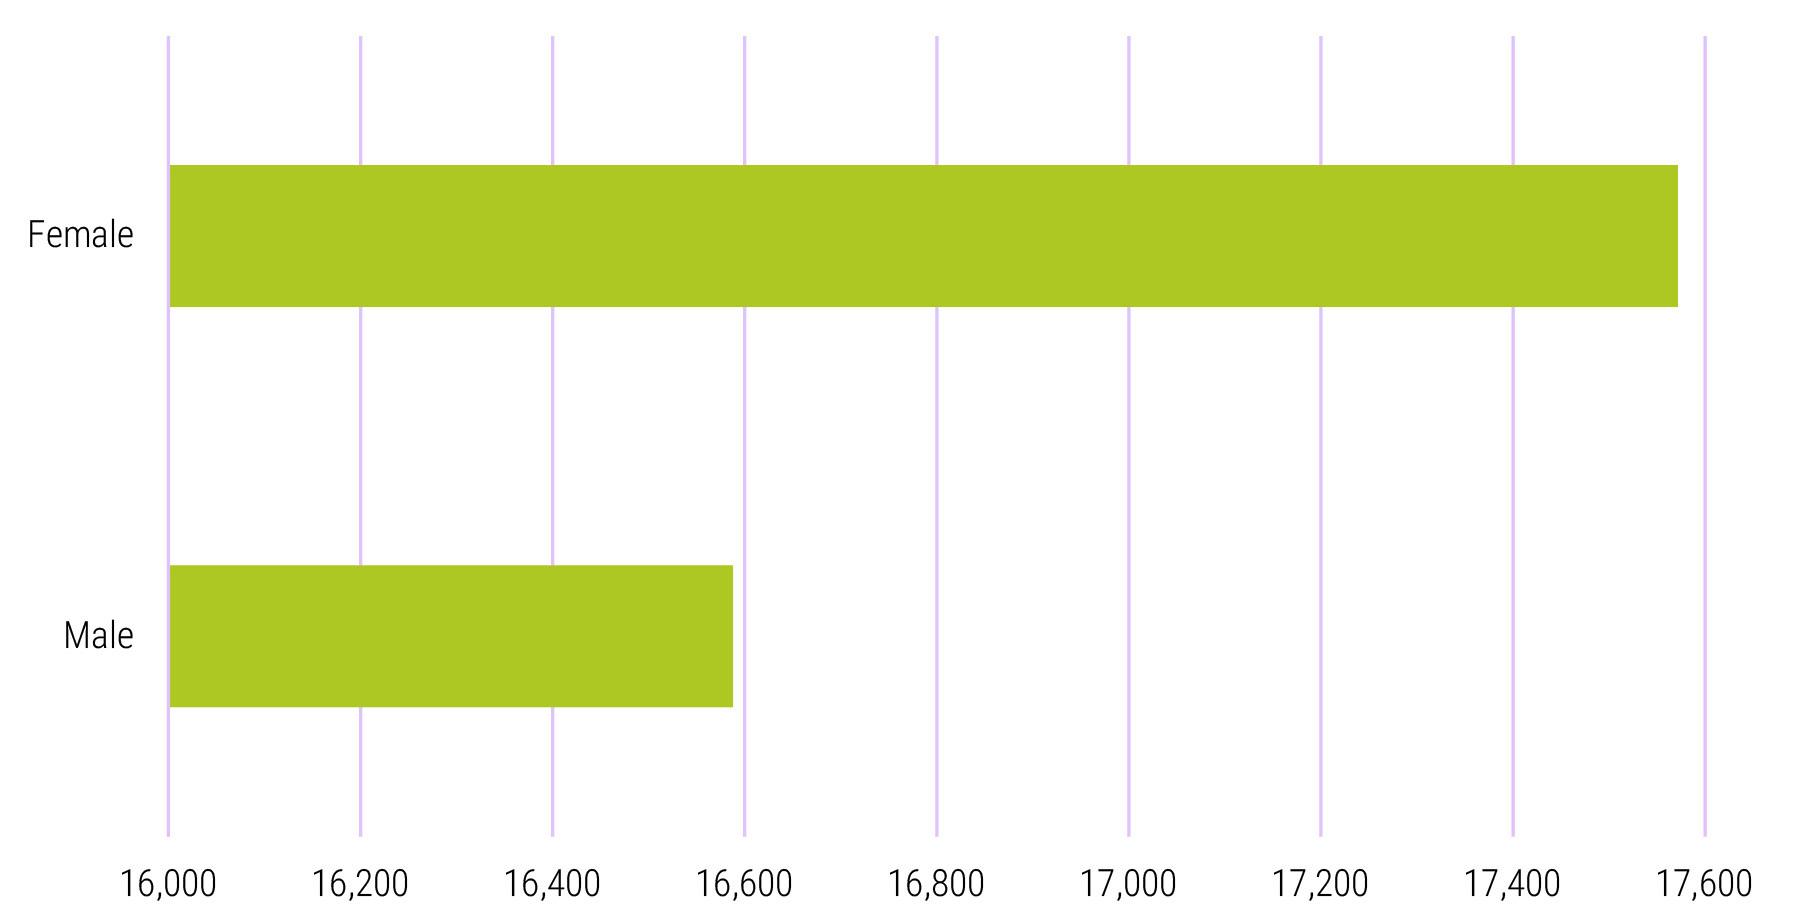
GENDER: Wilson County’s employed population is relatively evenly split between males and females; however, females do account for about 1,000 more employees than males.
TABLE 11. WILSON COUNTY RESIDENTS BY GENDER
Source: JobsEQ®
FIGURE 11. WILSON COUNTY RESIDENTS BY GENDER
EDUCATION AND TRAINING REQUIREMENTS: According to JobsEQ, nearly 38% of Wilson County’s 35,088 jobs are considered short-term on the job training with no experience necessary and no award, at just over 14,000. The second most popular are those that require a bachelor’s degree at 20%,or a little over 7,000. For jobs requiring a 2-year degree or certificate, there are approximately 3,200 (9%). Jobs that require moderateterm on the job training with no experience necessary and no award come in third with almost 7,000 (20%).
TABLE 12. JOB REQUIREMENTS IN WILSON COUNTY
Source: JobsEQ®

FIGURE 12. JOB REQUIREMENTS IN WILSON COUNTY
DATA TABLES FOR COURSE SUCCESS
These tables provide the counts to calculate the success of students by gender and race. Enrollments include the total number of students and classes with status of A, N, or W. The number of successful students is identified as those with a grade of either A, B, or C.
TABLE 13. COUNTS BY RACE/ETHNICITY: ALL GENDERS
TABLE 14. COUNTS BY RACE/ETHNICITY: MALES
TABLE 15. COUNTS BY RACE/ETHNICITY: FEMALES
TABLE 16. COUNTS BY RACE/ETHNICITY: GENDER UNKNOWN
*Disclaimer: Results with less than 5 students were suppressed
Additional Data Sources
The Planning Committee also considered the following information and data in devising the plan:
• Ad hoc planning committee original goals
• Enrollment and completers
• QEP Committee reports
• North Carolina Community College System (NCCCS) Performance Measures
• Course success rates, disaggregated by course modality
• Success rates disaggregated by gender, race, age
• Annual student satisfaction survey
• Student interest survey
• Comparative Full Time Equivalency (FTE) report
Goals, Strategies & Benchmarks for Success
Goal 1: Student Access & Success
Students are able to enter Wilson Community College and achieve success regardless of their race, gender, or socioeconomic status.
Goal 2: Excellence in Teaching & Learning
Classes—regardless of delivery method—will engage learners and provide the skills, knowledge and abilities students need for success.
Goal 3: Workforce Development & Community Partnerships
The college will increase workforce partnerships and ensure that more students complete short-term training and credentials that provide living wages and that meet workforce demand.
Goal
4: Employee Engagement & Development
College employees will have opportunities to enhance their professional development and growth.
Goal 5: College Environment & Resources
Employees and students will experience a safe, well-maintained environment that is supported through multiple funding sources.
Goal 6: Campus Culture
Develop a campus culture that reflects our values.
GOAL 1: STUDENT ACCESS & SUCCESS
a. Increase the number of students enrolled from previously underserved segments of the service area.
b. Implement a strategic enrollment plan.
c. Close performance gaps among males and females and demographic groups.
d. Increase the number of students successfully completing college-level English and math within 12 months of enrollment.
GOAL 2: EXCELLENCE IN TEACHING & LEARNING
a. Increase student engagement in the classroom and online environment.
b. Identify courses with low success rates in all delivery methods and devise strategies for improvements.
GOAL 3: WORKFORCE DEVELOPMENT & COMMUNITY PARTNERSHIPS
a. Evaluate and improve the current system for identifying short-term workforce training and ensure that it results in relevant training with living wages.
b. Increase enrollment in workforce development programs and the number of credentials earned.
c. Develop more apprenticeships and connect students to employers at the front and back end of enrollment.
GOAL 4: EMPLOYEE ENGAGEMENT & DEVELOPMENT
a. Provide employees access to key data points and opportunities for data analysis to foster a data-driven inquiry and decision-making culture.
b. Provide employees with professional development to support college-wide initiatives.
c. Provide employees with a robust orientation specific to their role (faculty or staff).
d. Enhance employees’ knowledge of fiscal management and accountability.
GOAL 5: COLLEGE ENVIRONMENT & RESOURCES
a. Expand facilities as needed to support high demand, high wage programs and to optimize the student experience.
b. Provide a safe and secure environment.
c. Acquire additional funding streams to support college growth and expansion.
GOAL 6: CAMPUS CULTURE
a. Foster a campus culture that emphasizes good communication, teamwork, and efficiency.
b. Build an employee base that reflects the demographics of our community.
Data Indicators, Baselines, & Benchmarks
GOAL
1a. Increase the number of students enrolled from previously underserved segments of the service area.
DATA INDICATOR BASELINE BENCHMARKS
NCCCS Dashboard –Curriculum Headcount
1b. Implement a strategic enrollment plan.
1c. Close performance gaps among males and females and demographic groups.
1d. Increase the number of students successfully completing college-level English and math within 12 months of enrollment.
Completer data on Institutional Research (IR) web page
3-year Average:
• White - 1,054
• Black - 897
• Hispanic - 317
• Male - 758
• Female - 1,762
NCCCS Dashboard
3-year Average Completion:
• Males - 35%
• Females - 65%
Non-completers
2020-2022
• ENG - 891
• MAT - 466
2a. Increase student engagement in the classroom and in the online environment.
• Community College Survey of Student Engagement (CCSSE)
• Tutoring Logs (NetTutor & Tutoring Lab)
• DL Course Reviews
• Faculty Evaluation
• WolfTracks Alerts
Tutoring Sessions
• NetTutor: 2018-2022
average hours: 267
• Tutoring Lab
• 2021-2022: 15 visits
• 2022-2023: 41 visits
• Increase Hispanic students by 15% (48) per year.
• Increase Black students by 5% (45) per year.
• Increase males (all racial/ethnic groups) by 10% (76) per year.
Completed Plan
Increase male completion rates by 15%.
Decrease noncompleters per year:
• ENG by 6%
• MAT by 3%
Classroom Engagements
• Instructors will implement at least two engagement strategies per class.
Tutoring Sessions
• Increase NetTutor hours by 5% (13 hours)
• Increase Tutoring Lab visits to 60
DL Course Reviews
• 100% of DL courses will meet regular and substantive interaction (RSI) requirement
Wolf Tracks Alerts
• Outreach efforts of 3 per semester per faculty and staff
GOAL
2b. Identify courses with low success rates in all delivery methods and devise strategies for improvements.
3a. Create a responsive system for identifying short-term workforce training and ensure that it is resulting in relevant training with living wages.
DATA INDICATOR BASELINE
Course Success Rate
3b. Increase enrollment in workforce development programs and number of credentials earned.
3c. Develop more apprenticeships and connect students to employers at the front and back end of enrollment.
• NCCCS Dashboard
• NCCCS Power BI (Performance Measure 6)
3-year Average:
• Seated 78%
• Online 71%
• Hybrid 64%
• Blended 75%
Apprenticeship Report
Enrollment:
• 2019: 120
• 2020: 104
• 2021: 105
• 2022: 117
Credentials Earned:
• 2019: 101
• 2020: 85
• 2021: 77
• 2022: 98
Companies participating: 2020-2021:
• Bridgestone Americas 2021-2022:
• Bridgestone Americas
• GSK 2022-2023:
• Bridgestone Americas
• GSK
Number of students participating:
• 2020-2021: 4
• 2021-2022: 2
• 2022-2023: 2
4a. Provide employees access to key data points and opportunity for data analysis to foster a data-driven inquiry and decision-making culture.
Increase to:
• Seated 82%
• Online 75%
• Hybrid 68%
• Blended 79%
A new system will be developed by fall 2024.
• Increase yearly enrollment by 10%
• Increase credentials earned by 10%
• Increase the number of companies participating by 2 per year.
• Increase the number of students participating by 2 per year.
1. WolfTracks data reports
2. Two annual data analysis trainings per year
3. Develop Internal Data Dashboard
GOAL
4b. Provide employees with professional development to support college-wide initiatives.
4c. Provide employees with a robust orientation specific to their role (faculty or staff).
• Go2Knowledge Training
• Professional Development Report
Participants:
• 2020 - 10
• 2021 - 25
• 2022 - 22
4d. Enhance employees’ knowledge of fiscal management and accountability.
5a. Expand facilities as needed to support program growth and to optimize the student experience.
• Master Facilities Plan (2021-2031)
• Student Satisfaction Survey N/A
5b. Provide a safe and secure environment.
• Safety & Security Committee Minutes
• Cybersecurity Training
Drills Per Year
• Tornado Drills - 1
• Evacuation/Bomb Threat - 1
• Lockdown - 1
Safety & Security Meetings
• 1 per semester
CIS Control Manual
Employees will complete at least two related professional development sessions per year.
100% of new employees will complete orientation within two months of hire.
• Offer training once per year and/or as needed basis.
• Provide access to budgets in Self Service for directors, deans, and vice presidents.
• Complete at least one priority from the Master Plan
• 90% of students will indicate satisfaction with campus facilities
Drills
• 4 per year
Safety & Security Meetings
• 4 per year minimum
Campus Safety & Security Measures Report Completions
• 6/12
• Evaluate and improve traffic/parking
CARES Team Reports
• 20 per year
Information Technology
• Develop Incident Response Plan by end of Q1 2024
• One cybersecurity training per semester via KnowBe4
• Cybersecurity professional development once per year in person
5c. Acquire additional funding streams to support college growth and expansion.
• Internal Campaign Report
• Capital Campaign Report
• Foundation Gift Summary Report
• Internal campaign 10% contribution
• N/A
• 3-year average donation amount: $254,621
6a. Foster a campus culture that emphasizes good communication, teamwork, and efficiency.
6b. Build an employee base that reflects the demographics of our community.
• Student Satisfaction Survey
• Employee Survey
• County/Employee Demographics
• Wilson County Race and Ethnicity, 2022 Census
N/A
• 100% employee contribution rate
• Apply for at least one grant
• Increase donations by 8%
• Add an alumni campaign
• Encourage partnership between divisions.
• Improve efficiency in workflows.
Faculty (July 2023)
• African American Female - 9%
• African American Male - 6%
• White Female - 51%
• White Male - 34%
Staff
• Asian Female - 1%
• African American Female - 27%
• African American Male - 11%
• Hispanic Female - 4%
• White Female - 38%
• White Male - 19%
Increase faculty to reflect Wilson County demographics:
• 40.4% African American
• 45.6% White
• 11.9% Hispanic Maintain staff members on trend with county statistics.