
ADOPTED BUDGET FY 2026
ADOPTED BUDGET FY 2026


Douglas G. Pons MAYOR
Andrew O. Trivette
CITY MANAGER
Michele Mixner DeWitt
ASSISTANT CITY MANAGER
Christina Shelton CITY ATTORNEY
W. Pat Dent VICE MAYOR
Barbara L. Ramsey MEMBER
Stacy Kern-Scheerer MEMBER
Ayanna T. Williams MEMBER
Dustie McCay CLERK OF COUNCIL
Mark A. Barham CHIEF INFORMATION OFFICER
Barbara Dameron DIRECTOR OF FINANCE
Sean Dunn POLICE CHIEF
Wendy Evans DIRECTOR OF HUMAN SERVICES
Tevya Griffin DIRECTOR OF PLANNING & CODES COMPLIANCE
Robbi Hutton DIRECTOR OF PARKS & RECREATION
Yuri Matsumoto DIRECTOR OF ECONOMIC DEVELOPMENT & TOURISM
R. Jackson Reed
DIRECTOR OF PUBLIC WORKS & UTILITIES
Larry W. Snyder Jr. FIRE CHIEF

OUTSIDE AGENCIES
Finance Director, Tourism and Human Services send outside agency notices.
BUDGET GUIDANCE
Finance Director and Manager provide budget guidance to staff.
PUBLIC REVIEW
City Council holds public hearings on budget proposal and advertises planned tax rate.
FISCAL YEAR BEGINS
City fiscal year begins July 1 and runs through June 30.
BUDGET RETREAT
City Council holds Budget Retreat
AUDIT
An independent auditor conducts onsite review of financial reporting and compliance. The audit is reviewed with the Finance and Audit Committee.
CITY MANAGER’S BUDGET
After input from Planning Commission and Econ. Development Authority, the City Manager delivers a proposed budget.
MAY
BUDGET ADOPTION
City Council adopts the budget in May of each year, setting the tax rate. WATCH HERE
AUGUST
MID-YEAR ADJUSTMENTS
Staff presents the current budget forecasts for FY end and recommends any adjustments through June 30.
ACFR
The Annual Comprehensive Financial Report relates the actual performance of the City’s budget plan. VIEW HERE


July 1, 2025
Mayor and Members of Council,
Since February, we have worked together to consider internal and external influences on the City’s finances, developed strategies to address those influences, and reached consensus on a Fiscal Year 2026 (FY26) budget that meets the needs of both our organization and our community. I am pleased to presented the adopted FY26 budget and the associated fiveyear Capital Improvement Plan (CIP).
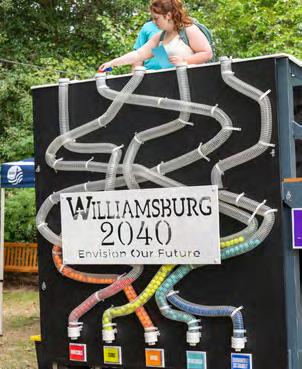
Over the last few years, we have compared our budgeting process and its outcomes to running a marathon. Our finish line is a Williamsburg 2040 that we can all be proud to share. Our route is guided by our biennial strategic planning process, the Goals, Initiatives, and Outcomes (GIOs). This past year, we renewed our focus on 2040 by again conducting the GIO process, and this budget reflects those priorities. Like the GIOs, marathons often have waystations, providing course announcements that can require a runner to adjust strategy to finish in the best position.
The FY25-26 GIOs continue the emphasis on major public infrastructure renewal projects. Reaching the 2040 finish line with significant projects addressed or completed requires proper trajectory and pacing. We must align our spending plan with the priorities set by our community while ensuring that we have sufficient resources to deploy at the right time to finish the course in a position that satisfies our community vision. That vision includes milestone construction projects like the library, police station, and fire station; programming objectives like growing our youth achievement programs, participating in regional solutions to homelessness, and addressing affordable housing; and intermediate targets, such as taking advantage of the 250th commemoration of the nation in 2026, which coincides with the 100th anniversary of Colonial Williamsburg.
Over the years, we worked to advance at a pace that maintains the lowest real estate tax rate of the 38 cities in Virginia and lower than 65% of the 95 counties. We achieve this low rate while simultaneously providing a high level
of service without adding fees for services such as stormwater management and garbage and recycling collection. In the past, our strong tourism economy has offset the natural growth in the expense of providing services. Experts are unsure how the world and the domestic economy will react to recent changes in federal policy. However, Greater Williamsburg has been fortunate that our tourism economy has shown resilience when, in similar periods of uncertainty, travel trends shift from international visits to regional drive markets.
The adopted budget realigns our approach with past trajectory and pace in mind. It reduces spending, wisely applies one-time funds, and increases revenue to meet needs consistent with our community’s values by:
• eliminating 34 capital projects, or $22.8M, in FY26.
• reducing departmental operating costs by $725K or 2%.
• instituting a funding freeze that saves $207K by holding nine positions vacant through June 2025.
• reassigning $5.5M in COVID relief funds and $1M in reserve funds to the CIP.
• adjusting the water rate by $1.59/1,000 gallons for necessary infrastructure upgrades, effective July 1, 2025.
• increasing meals and lodging tax rates by 1.5% and 2%, respectively, and adding a new 10% admissions tax, all to become effective in January 2026.
Together, these strategies for FY26 allow us to directly address aging water utility infrastructure, slowed revenue growth, and a structural imbalance in the CIP. We find ourselves at a waystation moment in the marathon to the Williamsburg of 2040. The adopted FY26 budget represents a corrected trajectory and pace to ensure a strong finish.
The City of Williamsburg's Fiscal Year 2026 Proposed Budget was published on March 31, 2025, and presented at the April 7, 2025, City Council Work Session. Following public input at three City Council meetings, Council directed changes to the budget prior to adoption at its regularly scheduled business meeting May 8, 2025, satisfying the City's Charter requirement. This Reconciliation page reviews these changes, which have been incorporated into the Fiscal Year 2026 Adopted Budget.
6,400,000
QUARTERPATH CDA FUND: NO CHANGES
$10,319
The City’s participation in the joint school system is predicated on a five-year contract. FY26 will be Year 4 of the newest version of that contract. During this school year, the City has 1,134 students enrolled. The cost to the City per student for the operation of the school system is $10,319.
The City’s role as the minority funding partner in the WilliamsburgJames City County School System requires that the City contribute a percentage of WJCC OPERATING AND CAPITAL COSTS that is based on City student enrollment and state funding each year. The adopted FY26 budget includes the calculated percentage increase, 11.6%, of the initial school request total. During the budget process, the school board considers proposed budgets from the superintendent for both operating and capital expenses anticipated for the coming fiscal year. These initial budgets are based on estimated state and federal funding, resulting in a gap that local funding partners must address. The school board-approved budgets are then considered as part of the James City County budget. Ultimately, the local funding is determined by the JCC Board of Supervisors, and the City decides whether to adjust its provided funds based on that approval. Typically, the City’s adopted budget meets the needs represented in the school board’s approved budget. The FY26 Adopted Budget honors this tradition with a contribution of $12.7 million in annual operating funds, a $1.4 million increase or 12.4%, and capital funds totaling $1.4 million. In total, the school system represents 13.6% of this year’s total budget.
Each year, as the budget is assembled, we estimate revenues, compile a list of mandatory and discretionary changes to the operating budget, and adjust the capital plan to include new projects along with revised schedules and costs for planned projects. To MANAGE
17.4%
This budget implements significant reductions in planned and requested spending to offset the impact of mandatory expenses in service costs for outside agencies, such as participation in the regional jail, regional transportation, and the joint school system.
in the FY26 budget, we reduced the planned total expenditure by lowering costs in the operating budget by $725K; eliminating 29 projects from the capital plan, including $15 million proposed and $7.8 million previously planned projects that totaled $22.8 million in FY26 reductions and $14.1 million over the next four years; and making available $5.5 million in ARPA funds and $1 million in reserve funds. These reductions mean stretching the lifespan of major equipment, eliminating new projects and ideas proposed by departments, and reducing operating expenses, all of which will constrain services and employees.
$1.59
The adopted FY26 budget includes an increase in the utility rate from $5.30 to $6.89 per 1,000 gallons consumed — a 30% increase. This change is expected to raise the average residential utility bill by approximately $6.36 per month and the median commercial utility bill by $28.62 per month.
For many years, we have planned for INVESTMENT IN OUR WATER UTILITY and have studied the necessary upgrades to both the water treatment facility and the distribution network — upgrades that can no longer be postponed. We aim to implement a 10-year work plan that will require $27.1 million to complete. To fund this work as we progress through the work plan, we need to raise the utility rate. Starting in at least 2000, the City increased utility rates annually to keep up with rising service costs and reduced consumption with the introduction of higher efficiency fixtures. That practice was suspended in 2018, and the rate has not increased from $5.30 since. From 2000 to 2017, the average increase per year was 6%. If that trend had continued, the rate in FY26 would be nearly $8 per 1,000 gallons consumed. The adopted budget increases the utility rate from $5.30 to $6.89 per 1,000 gallons.

$3.0M
Adopted adjustments of 1.5% and 2% to meals and lodging tax rates, respectively, along with the introduction of a 10% admissions tax, are expected to increase revenue by $1.4M from meals, $775K from lodging, and at least $793K in admissions collections.
Implementing a modest increase in excise taxes, such as those on meals and lodging, along with the introduction of an admissions tax, can improve our city’s fiscal health. Since 2017, we have been cautiously monitoring the growth of revenue from excise taxes, including meals, lodging, and sales. Our concern has been that these revenues play a crucial role in funding our operations and capital expenses. SLOW GROWTH TRENDS led to a requested real estate tax increase of $0.08 in 2022 to help balance the capital plan amidst planned expenses for the joint school system. That need was postponed by a smaller increase of $0.04, which was reduced in the following year to $0.02 by deploying reserve funds, tourism funds, and COVID relief funds as a stabilization strategy. With those committed stabilization funds depleted, now is the time to improve recurring revenue. Increasing the meals tax by 1.5%, the lodging tax by 2%, and instituting an admissions tax of 10% with an effective date in January increases a proven recurring revenue stream that addresses the long-term needs of our capital plan.

The Capital Improvement Plan (CIP) Fund is a five-year plan for major infrastructure projects. The adopted FY26 CIP has projects totaling $33.2 million – $28.8 million in City projects, $1.4 million for the City’s share of school projects, and $3 million in debt service – for an increase of $5.7 million since last year. The FY26 projects are funded by $7.5 million in sales tax and interest income, $11.2 million in grants, $7.5 million in regional contributions, $2.5 million in private donations, $1.6 million in Budget Stabilization funds, $2.0 million transfer from the General Fund, $850K from CIP Reserves, and $40K in Courthouse maintenance funds.
The FY26 budget provides for the next steps in the generational replacement of critical municipal structures through a financing plan that extends over years, such as the new downtown Williamsburg Regional Library ($20 million) and the new home of the Williamsburg Police Department along Lafayette Street ($22 million). It also includes funding necessary to implement projects included in the City’s Goals, Initiatives, and Outcomes (GIOs), such as improving Williamsburg Area Transit Authority bus stops ($400K) and completing the African American Heritage Trail ($1,088,100).
A project’s inclusion in the CIP does not always indicate that it will proceed. Projects are often included in the CIP but depend on outside financing, such as grants or fundraising. If grants or donations are not received or enough to satisfy targets, the City Council may delay or cancel the project. Projects included in the CIP with an expense of more than $100,000 require additional review and approval by the City Council before implementation despite their inclusion in that year’s budget.
The City’s CIP includes a stabilization fund added in FY23 to provide needed one-time funding that reduced the real estate tax rate and prevented an increase for several years. In the FY26 budget, that stabilization fund is exhausted, and new revenues in the form of increased excise taxes fully fund the plan for the next five years, reducing the pressure on local real estate taxes. The City will debt fund many of the larger building projects, spreading the cost over the generations benefitting from the facilities. Leveraging debt to fund generational projects – while increasing revenues from meals, lodging, and admissions taxes paid by millions of our visitors who help cover the cost of services –enables the full five-year CIP to be funded without placing the burden solely on property owners.


The FY26 Adopted Budget adds $26.8 million to our outstanding debt. This total includes debt funding projects like the new downtown Williamsburg Library. While the City Council has not given final approval, the City must plan for any potential project’s financing to allow the work to occur if the decision is to move forward. Budgeting for projects does not mean the City will ultimately bear the entire cost. We can and will aggressively seek grants and private donations to offset City expenses and debt when possible. Budgeting provides a vehicle to proceed if the City Council elects to do so within FY26.
The budget puts the City’s outstanding debt total at $72.8 million as of June 30, 2026. The current and proposed debt meets or exceeds all of the City’s debt policies to ensure the wise and limited use of debt. A portion of the outstanding debt includes the FY25 refunding of bond Series 2023 and past refunding of the Series 2010 and 2012 debt. The debt service, or annual debt payment, totals $3.35 million during FY26, of which $653K is funded from the Utility Fund, with the remaining $2.7 million funded from the general government Capital Improvement Fund.
The City uses debt as a tool to make money go further. By bonding expensive projects such as fire stations, police stations, libraries, parks, and schools, our annual commitments to these projects are less, and we can accomplish more in a truncated timeline. However, like any wise account holder, we must monitor the amount of debt and the associated debt payment to not overburden the available revenue for other projects to proceed.
The Tourism Fund was adopted in 2017 to improve transparency regarding the City’s total expenses for tourism-related activities. The Tourism Fund’s estimated total revenues in Fiscal Year 2026 are $7.2 million. Revenue estimates from sales tax have increased by approximately 0.8% compared with FY25, while the $2 lodging tax estimate has risen by 27%. Revenues for the fund include $1.2 million from the $2 per night per room tax, $2.62 million from the City’s half of the 1% Historic Triangle Region Sales Tax, and a state-mandated transfer from the General Fund totaling 2.2 million, interest income of 100K, and a transfer from fund balance reserves of 1.1 million.
The fund is intended to provide opportunity for investment in new or expanded tourism offerings to drive overnight stays in Williamsburg. The primary tools to accomplish this goal are the Tourism Development Fund Grant Program (TDF) and the Tourism Promotion Contingency Fund (TCPF). The Tourism Development Grant Review Committee (TDGRC) guides any TDF expenses, evaluating the applications and recommending projects for funding to the City Council. The last grant cycle in 2023 included 11 applications, representing $35.8 million in total requested funds. After review, the TDGRC recommended, and the City Council approved, $1.6 million in grant awards for FY24, $900K in FY25 and additional funding in future years. The FY26 budget considers these funds committed. A grant cycle will not open this year as committed funds are disbursed to past grant recipients for projects such as the Greater Williamsburg Sports and Events Center and a new arrival center along Lafayette Street, among others.
The TPCF process uses a staff committee to review rolling applications throughout the year. The committee presents recommendations for City Council consideration and funding. In 2015, the City created the grant, which has provided $556,970 in funding to 15 applicants since Fiscal Year 2016. The funds have assisted in opening and promoting new events like art exhibits at the Musacrelle Museum of Art and recruited conferences like A Common Cause to All, which has attracted thousands of attendees from across the country in Williamsburg over the past three years.
Additional FY26 Tourism Fund expenses are the tourism-oriented outside agency funds totaling $7.2 million, an increase of 27.6% from FY25, some of which are mandated by the Code of Virginia, and the Tourism Fund’s administration totaling $328K, an increase of $7.8%.

The federal and state governments provided the City of Williamsburg with pandemic relief funds between 2020 and 2022 that totaled $21,419,663. The City used these funds to provide immediate relief and aid programs to businesses and residents, deployed $8.0M to reduce costs associated with the CIP, and designated $13.4M for new projects designed to generate revenue and meet social needs. A public survey and a steering committee guided this final funding category of investments, which City Council ultimately approved.
The FY25 Adopted Budget designated these relief funds for affordable housing projects and programs, initial infrastructure for a research village for data science businesses, and seed money for the redevelopment of the Blayton Building as continued public housing. Instead of those designations, the FY26 budget makes this $5.5 million in funding available for use to reduce the immediate need for new revenues. The increased revenues realized from increased excise taxes provide the opportunity to leave these funds unused or restore funding to these planned projects in future budgets.
Since 1927, the City has operated a well-respected water utility. Today, the enterprise Utility Fund is an independent fund of the City that supports itself through the water rate, paying for infrastructure and operations.
For years, we have watched the margin between revenue and expense shrink, with customer growth inherently limited and demand decreasing as higher-efficiency fixtures replace legacy items. At the same time, the cost of manufacturing water, distributing water, and collecting sewage has increased.
However, the City needs to make legacy improvements to the manufacturing and distribution of our potable water now. A review of our system shows that modernization of the utility system requires an investment of $27.6 million over the next 10 years. Modernization includes work at the Water Treatment Plant to repair structural flaws and replace the hardware and software that handles settling sediment and adding treatments. We will also invest in upgrades to a well-aged distribution system, including replacing four of 15 pump stations, and replacing clay and other substandard pipe throughout the city. These investments can no longer be delayed as they will guard against system failure in future years.
Monthly Cost
5,000 Gallons
To fund this 10-year work plan, we will use revenue bonds specific to the Utility Fund. These bonds will be issued as needed to make progress on the work plan using a combination of our small utility workforce and contractors. Financing the bonds includes raising the water rate in FY26 from $5.30 to $6.89, an increase of 30%. The last rate increase occurred in 2017. Until Fiscal Year 2018, the water rate increased every year since 2000 with an average rate increase of 6%. If that trend had continued, today’s rate would be over $8 per 1,000 gallons consumed. Increasing the rate by $1.59 generates $1.5 million in revenues for the fund. Despite this increase in our rate, we will maintain one of the lowest rates of any full-service water utility in Hampton Roads.
The Fiscal Year 2026 budget process began and ended with efforts to manage government costs. Estimated new revenue of $2.4 million was quickly consumed by $2.4 million in mandatory spending. Mandatory expenses include the rising costs of the City’s membership in regional organizations, personnel costs for existing employees, contractual service agreements, state-required funding arrangements, and the general increase in costs such as fuel, energy, and telecommunications. The only discretionary expense funded in this budget is a Cost-of-Living Adjustment (COLA) to salaries for City employees.
Given the lack of strong revenue growth anticipated in FY26, none of the new 21.5 requested FTE positions are funded, and one position is eliminated. One position was eliminated to help reduce expenses. The Utility Fund adds a new engineer to assist in the planned upgrades to the City’s water system and a FOG (Fats, Oils, and Grease) Inspector to ensure food service establishments comply with regulations required for all Hampton Roads localities under a consent order.
$1.7M
Every year, personnel costs increase. The FY26 budget provides $19.2 million for personnel-related expenses; $582K is directed to compensate for increased taxes, insurance, and benefit coverages associated with current employees. Additionally, the budget provides $564K for a 3% cost-ofliving adjustment.
$1.4M
The FY26 budget fully funds the WJCC schools funding request. Public education faces the same salary and staffing challenges as the City. This budget provides $12.7 million, the City’s share (10.53%) of the school’s initial requested budget of $114 million, which includes 62.85 new positions, a 3% increase for systemwide salary adjustments based on recent benchmarking, and efforts to remain competitive in hiring and incentivize retention.
$809K
The City's cost to provide the same services increases year over year. The FY26 Adopted Budget provides $809K to accommodate this increase, which includes $303K for increased contractual services, $209K for increased maintenance, and $297K for general service increases.
$525K
City services are augmented through the 70 outside agencies and regional joint service providers, which also receive funding through the budget. This adopted budget provides $525K to meet outside agency requests including the recommended and mandatory increases. The largest increases include Virginia Peninsula Regional Jail ($226K), Williamsburg Area Transit Authority ($97K), and Williamsburg Regional Library ($56K).

The budget process includes receiving budgetary requests from outside agencies, City departments, constitutional officers, and jointly funded offices. However, this year, mandatory increases exhausted anticipated new revenues, leaving no room to accommodate new budget requests in Fiscal Year 2026. More than $6.5 million in new requests were received, and only a cost-of-living increase for full-time equivalent employees, totaling $564,000, is funded, leaving $2.8 million in unmet needs.
Williamsburg Redevelopment & Housing Authority - $721K
Several years ago, the City Council established a budget priority of funding the Williamsburg Redevelopment and Housing Authority (WRHA) without federal assistance to complete the merger of WRHA with the City government. This change would reduce reliance on the federal government for funding, limitations on improving public housing, and operational costs. This priority is unfunded in the FY26 budget.
In October each year, the City opens applications for outside agency funding. Associated staff, committees, and the City Council consider these applications. This year, the City received five new applications from previously unfunded agencies. These requests totaled $175,000; none are funded in the FY26 budget.
The adopted budget includes estimates for state funding revenue streams. Adjustments may need to be made once there is clarity regarding the continued availability of federal assistance programs.
The primary request of each department included new employees to assist with meeting increased workloads, improve staff coverage, and provide redundancy of coverage. The total number of unfunded but requested FTE positions for the FY26 budget is 21.5, which would have added $1.9 million in new personnel costs to the operating budget. Positions requested but unfunded include:
POLICE
6 FTEs ($475K)
• Patrol Officers
PUBLIC WORKS & UTILITIES
6 FTEs ($439K)
• Landscaping, general management and oversight, and facilities maintenance
FIRE
5 FTEs ($658K)
• 3 Firefighters, 1 Captain, 1 Community Risk Reduction
WILLIAMSBURG REDEVELOPMENT & HOUSING AUTHORITY
1 FTE ($83K)
• Neighborhood Revitalization Coordinator
PARKS & RECREATION
1 FTE ($84K)
• Farmers Market administration
PLANNING & CODES COMPLIANCE
1 FTE ($74K)
• Administrative support
VOTER REGISTRAR
0.5 FTE ($15K)
• Election support staff
ECONOMIC DEVELOPMENT & TOURISM
0.5 FTE ($21K)
• Existing business service and administrative support
CITY MANAGER’S OFFICE
0.5 FTE ($21K)
• Communications support
The Fiscal Year 2026 Adopted Budget includes two significant impacts on our community: addressing the needed upgrades to our public utility, which manufactures and distributes potable water while collecting and transferring wastewater for treatment, and increasing revenues to address the structural imbalance in our capital plan.
As we move through FY26 and the nine years that follow, we must closely monitor our progress on utility upgrades. Recent events in Virginia underscore the importance of maintaining a resilient water utility. Our position along Virginia’s coast makes us vulnerable to many threats to service. By implementing the warranted and necessary improvements through a long-standing financing strategy of phased revenue bonds over the next 10 years, the City will be well-positioned to respond to any emergency without worrying about our water manufacturing and distribution system. Additionally, we are switching from quarterly to monthly billing to lessen the financial impact on our customers. We are also adopting the standard practice of having Hampton Roads Sanitation District (HRSD) directly bill for sanitary sewer services. We hope these changes to our billing will make it easier for residents to manage these expenses month to month.
At the same time, we will examine the increased revenue from meals, lodging, and admissions excise taxes. Raising these rates closer to, and in some cases exceeding, those of other cities in the region and state is likely a long-term solution to the structural imbalance in the capital plan as we try to meet the demands of our joint school system and community. While our tourism economy has shielded the City from recent economic challenges, we remain vulnerable to fluctuations in consumer confidence.
In light of national and international events, Virginia’s economy, and that of Greater Williamsburg is uncertain. However, recent investments in sports tourism, which tends to be a recession-resistant travel demand among families, are likely to generate significant new revenues. Annually, meeting the needs of our community will get more expensive, and more revenue is needed to meet the current and future demands of our locality despite substantial constraints on planned and requested spending. By increasing the excise tax rates, we can spread the cost of services across not only our thousands of residents but also our millions of visitors as well. The improved revenue likely meets the known needs of our community for many years.

Improved revenue should not also mean increased spending. The FY26 Adopted Budget reduces the requested expenditures of the Williamsburg government by $23.4 million in FY26 and $14 million over the next five years. As we watch the impacts of raising excise taxes and utility rates on our budget after Jan. 1, 2026, we will not rush to reinstate or expand projects. These changes are intended to preserve our low real estate tax rate and reduce the impact of revenue adjustments to meet the community’s needs and values. If we act too quickly to restore projects, programs, and staffing, we may erode the positive effects of prudent action.
We should also modernize the joint school contract with James City County. We have made significant progress over many months of discussion and negotiation. Now that the hiring process for a new superintendent has concluded, we can work more expeditiously to identify ways the funding partners and the School Board can collaborate to improve available funding in a dependable and dedicated way to address student outcomes. Community wealth building begins with a strong education system, and investing in education will pay dividends in future years.
When we look at financial news from around the world, the word we hear most often is “uncertainty.” We can and have taken the steps to be ready for whatever “uncertainty” might mean as we move into the next fiscal year. If the worst occurs, we will be grateful for actions taken that shore up revenues and trim expenses. However, we have faced challenges in the past, and the City of Williamsburg has emerged from such periods stronger.
Looking around at our community, I know you are as proud as I am of what we have accomplished in a few short years. We have not shied away from the tough challenges like improving our education system, addressing generational needs in public safety, and launching new programs to meet the needs of the most vulnerable in our community – and our community is better for it. Williamsburg has nearly 16,000 residents from all walks of life who welcome millions more visitors each year to share in the community we love. We are all working to preserve and grow what makes Williamsburg special. While it is easy to become mired in our own thoughts and ideas about what preservation or growth means, Williamsburg has consistently evolved to meet the needs of the many since 1699. Our community has served as a beacon for this nation’s founding, and continuing to be that model remains our aspiration.
As I consider the whole of Williamsburg, I see that my friends, neighbors, and colleagues are helping us earn that reputation anew every day. Thank you for the continued honor of serving as your city manager. I am privileged to offer the City of Williamsburg’s Fiscal Year 2026 Adoption Budget in the pages that follow.
Andrew Omer Trivette

PREPARED BY
Andrew O. Trivette, AICP, ICMA-CM
Andrew Trivette was appointed to the role of City Manager in 2018 after joining the City team as Assistant City Manager in 2016. He has 25 years of experience in local government.
Barbara Dameron has served as the City’s Finance Director since 2018. She has 26 years of governmental finance experience, 14 years of private sector accounting experience, and is a CPA. Currently, she is a member of the GFOA’s Accounting, Auditing, and Financial Reporting Committee and is a past president of the Virginia Government Finance Officers Association.
Davin Diesburg was hired as a budget analyst in the summer of 2023. He is a Spring 2023 Graduate from Old Dominion University with a bachelor’s degree in Business Administration Finance.


Williamsburg was founded as the capital of the Virginia Colony in 1699 and celebrated its 300th anniversary in 1999. Founded in 1607, Jamestown was the original capital and first permanent Englishspeaking settlement in the New World. Colonial leaders petitioned the Virginia Assembly to relocate the capital from Jamestown to Middle Plantation, 5 miles inland between the James and the York Rivers. The new city was renamed Williamsburg in honor of England’s reigning monarch, King William III. From 1699 to 1780 Williamsburg was the political, cultural, and educational center where the dream of American freedom, independence, and self-government was nurtured by the leadership of historical figures such as George Washington, Thomas Jefferson, George Mason, and Peyton Randolph.¹
Williamsburg was one of America’s first planned cities. Laid out in 1699 under the supervision of Gov. Francis Nicholson, it was to be a “new and well-ordered city” suitable for the capital of the largest and most populous of the British colonies in America. A succession of beautiful capitol buildings became home to the oldest legislative assembly in the New World. The young city grew quickly into the center of political, religious, economic, and social life in Virginia.²
Williamsburg also became a center of learning. Famous political leaders emerged from the College of William & Mary, founded in 1693, such as Presidents Thomas Jefferson, James Monroe, and John Tyler. Today, William & Mary is the second-oldest higher learning institution in the U.S.
In 2025, the university ranked No. 54 in National Universities and No. 6 in Best Undergraduate Teaching.³ Although William & Mary has a 332-year history, it remains a cutting-edge research university that is innovative, vibrant, and engaged. As a public university, William & Mary is an important partner in the region’s economic success, both in terms of local and regional impact, as it collaborates with businesses, nonprofits, and the public sector to strengthen the economic core.
Eastern State Hospital, the first hospital established in America for the care and treatment of mental illness, was founded in Williamsburg in 1773. The public hospital was built near the College of William & Mary in what is now known as Colonial Williamsburg. While the hospital remains in operation today, it has since moved from the original restored building to a new location on the outskirts of Williamsburg.
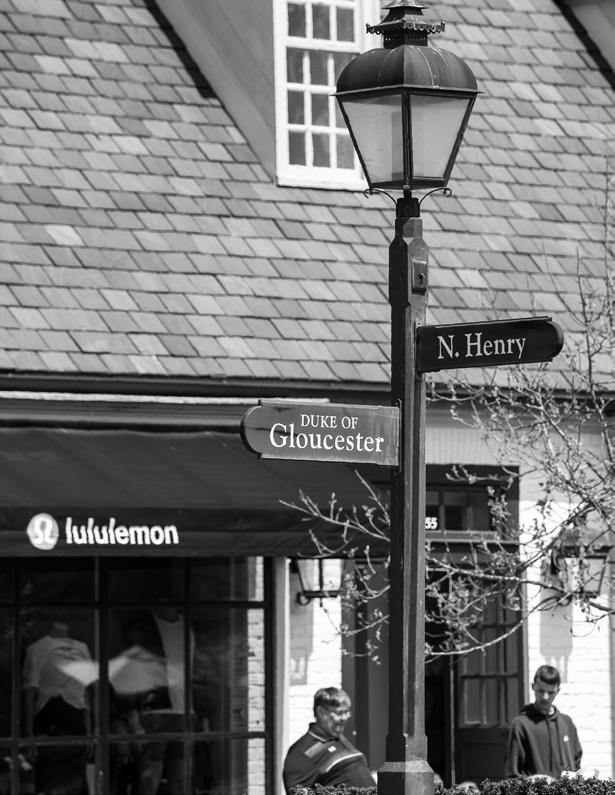
In 1780, the capital was again moved, this time up the James River to Richmond, where it remains today. Williamsburg reverted to a quiet college town and rural county seat. In retrospect, Williamsburg’s loss of capital city status was its salvation, as many 18th-century buildings survived into the early 20th century. The restoration of Williamsburg began in 1926, after the Rector of Bruton Parish Church, the Rev. W.A.R. Goodwin, brought the city’s importance to the attention of John D. Rockefeller Jr., who then funded and led the massive reconstruction of the 18th-century city we see today. National attention soon focused on the restoration effort. During a landmark visit in 1934, Franklin D. Roosevelt proclaimed its main thoroughfare, Duke of Gloucester Street, “the most historic avenue in America.”
Today, Colonial Williamsburg is still the only place that takes you back to a time when our country was being born, and the ideals that established the United States of America were being defined. In the Historic Area of the City, the 18th century is happening right now. You can step back in time and experience the people who made America.3
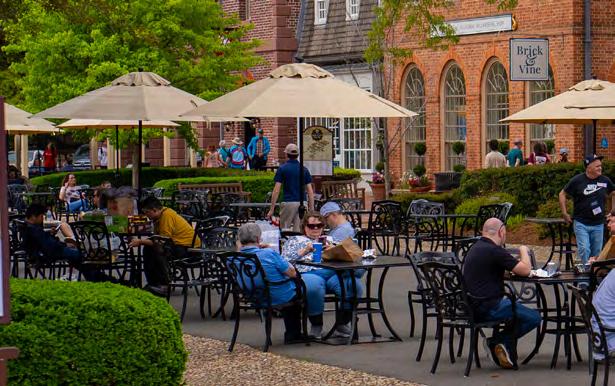
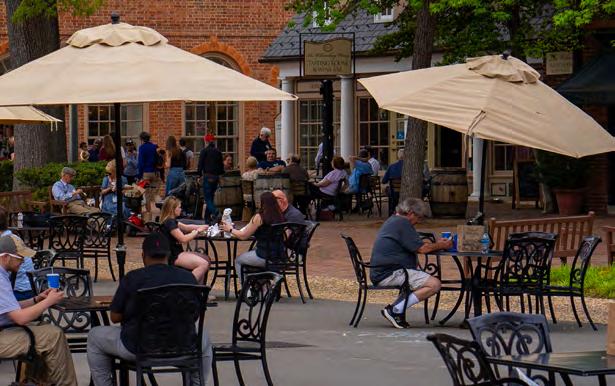
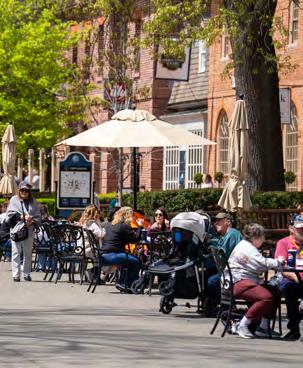
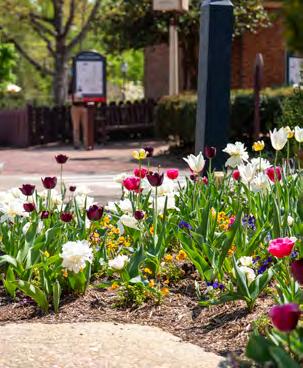
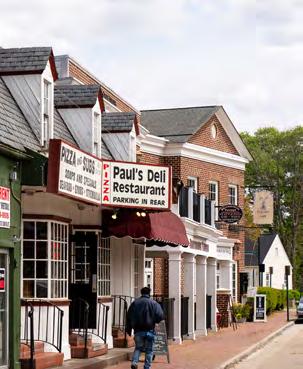
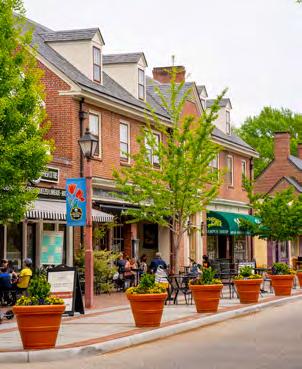
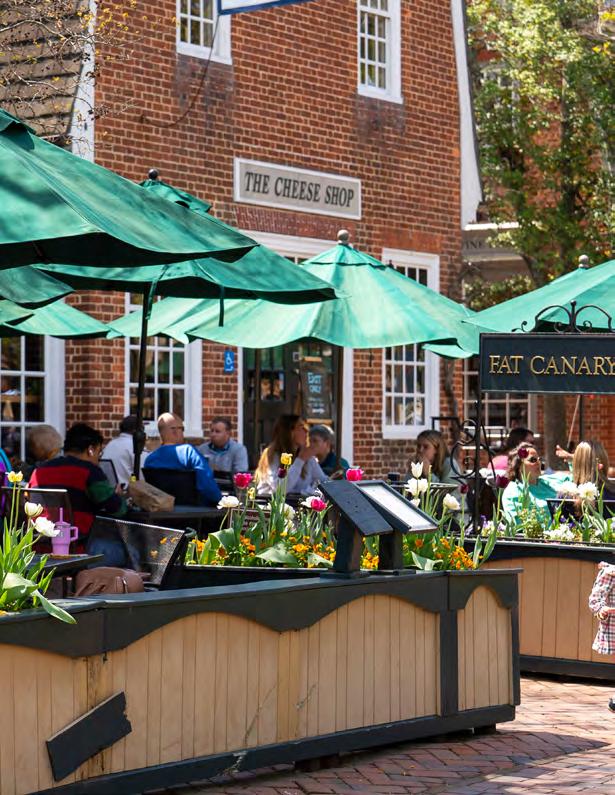
Downtown Williamsburg is adjacent to the Historic Area and offers 21st-century shopping and dining experiences – both indoors and outdoors. From April through November, you can enjoy a Saturday morning at THE WILLIAMSBURG FARMERS MARKET. Flowerbeds and benches offer a tranquil setting for market shopping while listening to live music. This award-winning produce-only market offers vegetables, fruit, fish, meats (including free-range chickens, beef, lamb, and pork), artisan cheese, honey, peanuts, baked goods, pasta, handmade soap, potted plants, cut flowers, and many other offerings.
The SHOPS AT HIGH STREET offer the perfect combination of dining, entertainment, and shopping. This area also offers a special community of luxurious condominiums, townhomes, and apartments – a vibrant downtown within a neighborly embrace.
MIDTOWN ROW, opened in 2021 in the heart of Williamsburg. This unique experience-based retail, entertainment, and residential district is adjacent to the campus of William & Mary, less than a mile from Colonial Williamsburg, and near Jamestown, Yorktown, Busch Gardens, and Water Country USA. The development is designed as a pedestrian- and bicycle-friendly community with a village green, where outdoor programming and community events are hosted. Midtown Row includes restaurants, 233,047 square feet of retail space, 6,219 square feet of premium office space, entertainment, and new residential apartments that accommodate up to 628 residents.
QUARTERPATH AT WILLIAMSBURG is a community designed to support a life of wellness. The neighborhood has walking trails, greenspaces, and world-class healthcare, anchored by Riverside Doctors' Hospital Williamsburg. This mixed-use village also features shops, restaurants, and office space.
One Williamsburg that is courageously leading, innovating a modern city, prioritizing safety and wellness, engaging with our partners, while connecting with the world.
WILLIAMSBURG-JAMES CITY COUNTY PUBLIC SCHOOLS (WJCC) serves the students of the City of Williamsburg and James City County. There are 16 schools: nine elementary, four middle, and three high schools. Of the 11,900 students served, about 10.4% are City residents.
All WJCC schools have earned full accreditation for the 18th year in a row. WJCC ranked 9th out of 130 Virginia school divisions in Niche’s 2025 Best School Districts rankings, scoring an overall A grade in this rigorous assessment of academic and student-life data.4
Tourism has historically been the economic backbone of this region. The area’s rich history provides a journey into the battles and sacrifices that secured the nation’s liberty and independence. Sharing this history requires both marketing and infrastructure. Legislation passed by the General Assembly of Virginia (Senate Bill 942) on April 18, 2018, created a revenue stream to assist with promoting the region’s many attractions. The bill established a 1% sales tax for the Historic Triangle (City of Williamsburg, James City County, and York County). Fifty percent of this tax fund goes to the Williamsburg Tourism Council (Visit Williamsburg) for the marketing, advertising, and promoting of the Historic Triangle as a tourism destination. The other half of this tax is distributed to the locality in which the tax was collected. The City of Williamsburg contributes its share of the tax to fund the Tourism Development Fund (TDF).
The purpose of the TDF is to increase patronage to restaurants, attractions, hotels, and events in the City of Williamsburg through financial assistance and reinvestment in tourism products, place-making projects, and public-private partnerships. Through an application process, the first series of grants were awarded in 2019. The TDF paused in Fiscal Year 2020 due to the pandemic and relaunched for its second full award cycle in February 2023. The
TDF also contributes to annual tourism-related outside agencies and has an annual grant program for events.
The City of Williamsburg operates under the Council-Manager form of government. The members of City Council are elected at- large and consist of a mayor, vice mayor, and three other members. City Council members serve four-year staggered terms, with the mayor selected from among City Council members every two years. The mayor serves as chair of City Council and the official head of City government.
City Council performs the legislative function (establishes laws and sets policy) and appoints a city manager to administer the day-to-day operations of the City and to serve as the chief advisor to City Council.
Williamsburg is in the northern part of the Hampton Roads metropolitan area, located on the Virginia Peninsula and bordered by the counties of James City and York. The City is located along Interstate 64, with easy access to Richmond, Virginia Beach, and the East Coast. The City has a unique blend of history, tourism, college, and a small-town feel with the benefit of access to big-city amenities.

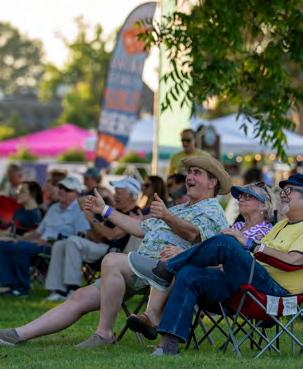
The City offers numerous festivals and special events throughout the year, including:
• An Occasion for the Arts – an arts and music festival, complete with food vendors
• Williamsburg Christmas Market – on select days in November and December, enjoy craft vendors, Santa visits, live entertainment, and gluhwein in a European-style village
• Winter Blues Jazz Festival – a fourday jazz festival
• Ampersand International Arts Festival (formerly William & Mary Global Film Festival) – an annual celebration of film and live performances
• Grand Illumination – Colonial Williamsburg’s annual winter holiday celebration with unique decorations, musical performances, and fireworks
There is no better way to celebrate our nation’s birth than spending July 4th in Williamsburg. Activities stretch from morning until after sundown. There are historic reenactments to enjoy as well as concerts, recreational activities, and a variety of foods –everything from hot dogs to gourmet dining. At nightfall, the historic area adds the finishing touch to the celebration with an amazing firework display.
The City of Williamsburg has a strong commitment to providing quality parks, recreation programs, and facilities that make Williamsburg a premier community in which to discover, imagine, and grow. Williamsburg maintains 12 parks that provide residents with varied uses, from passive activities to structured play. Park amenities include playground equipment, sand volleyball, tennis, basketball, picnic pavilions, athletic fields, and outdoor fitness equipment. Nestled among the trees is the scenic 2,705-acre WALLER MILL PARK. Featured at the park is a 360-acre reservoir that is open for fishing, boating, pedal boating, canoeing, and kayaking. There are over 7 miles of hiking trails with water and wooded views. Additional park features include an 18-hole disc golf course, playground structures, picnic shelters, grills, wheelchair-accessible docks, watercraft rentals, and a 1.5-acre fenced dog park with agility equipment.
The QUARTERPATH RECREATION CENTER is a 35,000-square-foot facility that offers a wide array of activities and amenities. Various instructional classes, athletic programs for youth and adults, sports camps, open gym time, and special events are held throughout the year at this facility. There are four rooms available for rent that are ideal for meetings, sports banquets, birthday celebrations, and other special events.
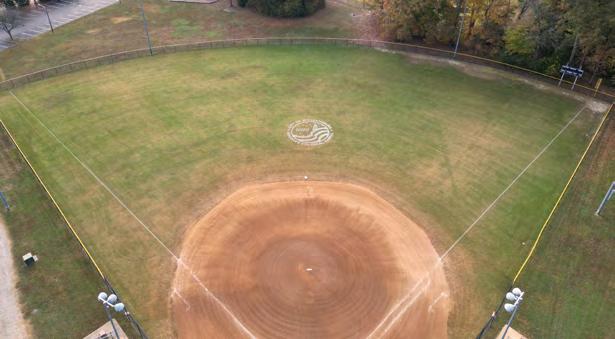
The PARKS & RECREATION DEPARTMENT is proud to host a variety of special events throughout the year that contribute to the individual, social, economic, and environmental health and well-being of our community. You can learn to play pickleball at a clinic or participate in a pickleball tournament. Bring Fido to Pups in Pastels, our dog Easter egg hunt, or our Canine Carnival. Let your kids drop a line at our Kids Fishing Derby or go dip netting for the invertebrates that call the reservoir their home in our Water Exploration Program. There are endless opportunities to get outside and get active with Williamsburg Parks & Recreation.
The WILLIAMSBURG
(WRL) enriches lives, opens doors to new learning experiences, and welcomes everyone. Named the 2023 Virginia Library of the Year by the Virginia Library Association, WRL is a key part of our vibrant community, offering collections, programs, and services for all ages. Residents can watch and listen to thousands of streaming movies, music, and audiobooks as well as read ebooks and magazines at wrl.org.
People interested in learning a new life skill such as crocheting, using a green screen, or speaking a new language can access thousands of online instructional videos on the library website.
Visitors to our library buildings can explore new book displays and discover copies of the hottest bestsellers as well as audiobooks and DVDs, pursue in-depth reading and research, consult expert staff, and experience the visual arts, multi-media presentations, and interactive learning. The library offers a wide range of film series, talks, book groups, concerts, and performances for all ages. Residents can be part of a local community of readers and learners, make new friends, bring their families to take part in a hands-on learning activity, or just sit back and enjoy a great read.
The Regional Library serves Williamsburg, James City County, and York County with two locations: one in downtown Williamsburg and one in James City County. Also available is a mobile library, which has scheduled stops in neighborhoods, adult care facilities, camps, preschools, and schools.
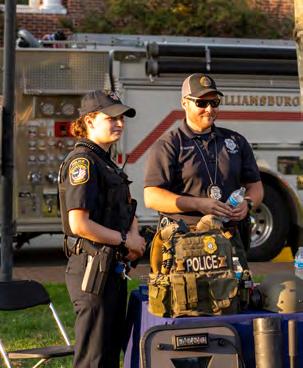
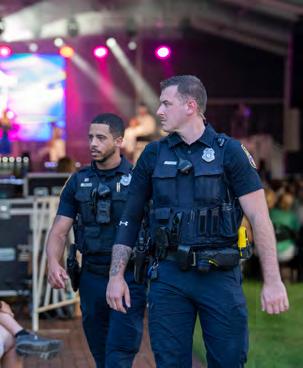
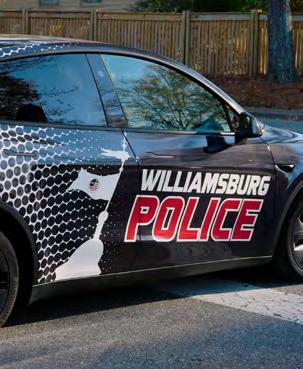
The Williamsburg Police Department (WPD) is celebrating its 37th anniversary as a CALEAaccredited agency, the gold standard in policing. The WPD is committed to ensuring the safety and security of all residents and visitors to the city through community engagement in all areas of service, including the Neighborhood Resource Officer Program that assigns a dedicated police officer to each neighborhood in the city.
WPD is currently staffed with 52 career personnel who manage approximately 41,000 calls per year. All officers are required to attend Crisis Intervention Training as well as verbal de-escalation training to ensure an officer’s presence creates the opportunity to manage situations without the need for higher levels of force whenever possible.
The WPD is committed to technology as a force multiplier. The department has implemented
a citywide license plate reader program to quickly identify wanted vehicles that enter our community. In addition, officers are required to use body-worn and in-car cameras during police incidents. At the same time, WPD maintains best practice policies to purge data to best protect the rights of residents. This technology aids with training, record-keeping, accountability, transparency, and overall efficiency of the agency. A Citizen Advisory Committee works to ensure the WPD is doing its very best every shift.
In addition to traditional law enforcement services like prevention, education and responding to police emergencies, officers are equipped with medical supplies, including Narcan, and are often the first on the scene for life-threatening medical emergencies.
In partnership with our public schools, WPD has assigned an officer to every City school. Events like Coffee with a Cop, Skate with a Cop, and Cone with a Cop offer a casual setting for the community to interact with officers of all ranks.

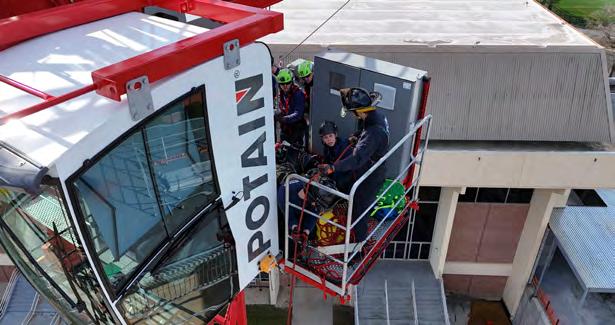
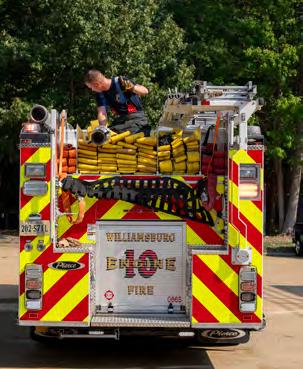
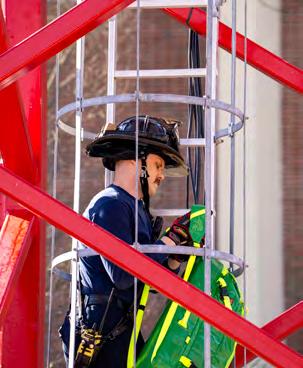
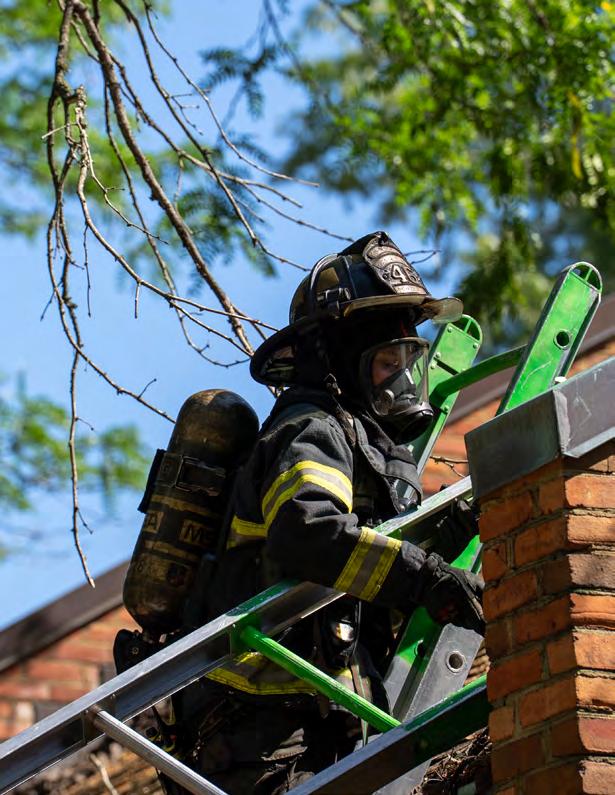
For more than 270 years, the Williamsburg Fire Department has protected our nation’s Colonial Capital and stands ever ready to serve all those who visit or call Williamsburg home. Through comprehensive emergency response to all hazard types and community-focused programs, the department strives to ensure the safety and well-being of all.
The Fire Department is currently staffed with 46 career personnel. Personnel are cross-trained to handle both fire and emergency medical services (EMS). In 2024 the department responded to 4,729 calls for service, a decrease of approximately 5.65% compared to in 2023.
The department’s Community Risk Reduction Division works to identify and prioritize local risks and to strategically invest resources to reduce their occurrence and impact. This comprehensive approach has several supporting programs like smoke alarm checks and installations, child safety seat education, fire inspections, home safety surveys, and public education events.
The department reached more than 3,373 people members through its community risk reduction programs in 2024.
The City’s Mobile Integrated Healthcare (MIH) program supported more than 76 clients and community members through a total of 2,085 interactions in 2024.
The Community Emergency Response Team (CERT) is also a vital outreach program that utilizes community members to assist with the safety and well-being of our neighborhoods and serves as an integral part of the City’s emergency management and preparedness efforts.
Since 1754, the Williamsburg Volunteer Fire Department has supported the community. The organization is made up of 23 local and collegiate members. In 2024, members of the program provided more than 3,413 service hours to the community. The volunteer organization is a 501(c)(3) and assists with purchasing supplies and equipment needed to support Williamsburg’s career staff.
1,095,969
Circulated Items in FY24
*as of June 1, 2025
A Population of 15,564 in 2023
Age* Gender*
8,225 FEMALE
7,339 MALE 1-17 18-24 25-34
*per U.S. Census 2023
CURRENT & NINE YEARS AGO
EMPLOYER
1 Includes part-time and seasonal employees
Source: Virginia Employment Commission; https://virginiaworks.com/
1 Weldon Copper Center for Public Service - Demographics Research Group, demographics.coopercenter.org ² U.S. Dept of Commerce, Bureau of Economic Analysis, Regional Economic Data—Statistical Areas/Metropolitan Counties by State income & area population figures based on figures for the City of Williamsburg and neighboring James City County combined ³ Williamsburg-James City County Public Schools 4 Virginia Employment Commission; https://virginiaworks.com/
1 “Brief History.” City of Williamsburg, williamsburgva.gov/490/History-of-City-Government. Accessed April 7, 2021.
2 “College of William & Mary.” U.S. News, usnews.com/best-colleges/william-andMary-3705. Accessed April 7, 2021.
3 “Explore Colonial Williamsburg.” Colonial Williamsburg, colonialwilliamsburg.com/explore Accessed Aug. 20, 2018.
4 Williamsburg-James City County Public Schools, wjccschools.org. April 2024

To advance our City’s vision, every two years the Williamsburg City Council identifies new strategic initiatives for our city government. The Williamsburg City Council and staff presented the 2025/2026 Goals, Initiatives, and Outcomes in the Fall of 2024.
In 2020, the City of Williamsburg launched a new vision statement that is meant to carry us through the next two decades. It is our vision for the Williamsburg of 2040, and we will fulfill that vision with a strategic approach.
Goals, Initiatives, and Outcomes (GIOs) provide an expression of priorities, as specific and measurable as possible, and cover a twoyear period. They are not intended to be a comprehensive list of all city services and activities. Instead, GIOs are a concrete, coordinated expression of the City Council’s direction and focus. City Council will adopt new GIOs for 2027/2028 in the Fall of 2026.
The City of Williamsburg has a highly interactive strategic plan that links the GIOs to the City’s strategic plan, performance measures and budget. In the Budget Guide section of this document, there are details on the goal-setting process.
To obtain more information about the plan and to follow along with the progress, please visit williamsburgva.gov/GIO.
One Williamsburg that is courageously leading, innovating a modern city, prioritizing safety and wellness, engaging with our partners, while connecting with the world.
A welcoming city where all people who live, work, and visit have the opportunity to thrive, regardless of age, race, ethnicity, income, sexual orientation, religion, or gender identity. The culture of our city will promote a variety of housing and employment options that welcome a diversity of backgrounds and opinions.
Evaluate the establishment of a City of Williamsburg first-time homebuyers program, including consideration of lower down payments, better interest rates, closing costs assistance, grants, tax credits, and education.
Investigate the expansion of the City’s workforce housing program to include the development of lowdensity, low-impact housing on the City’s surplus properties.
Propose zoning amendments to enable additional detached accessory dwelling units for owneroccupied homes as a vehicle to make the home more affordable and facilitate aging in place.
Assess neighborhood support for a Highland Park CDBG Housing Rehabilitation Program as a tool to slow gentrification and enable generational home improvement.
Continue to preserve downtown neighborhoods and community character by considering the impact of a Preservation Assistance Program for those with income-based restrictions or first-time homebuyer status to make historic properties more accessible by defraying the costs of Architectural Review Boardcompliant renovations in historic neighborhoods.
Analyze the potential impact of a Contingent Interest Mortgage Program by identifying a lending partner or partners.
Continue to advance Truth & Reconciliation by issuing a Request for Proposals for the redevelopment of the Blayton and Triangle buildings that encourages minority respondents and provides for minority commercial tenants post-redevelopment.
Secure funding for Phase 2 of the African American Heritage Trail and substantially complete its construction by July 4, 2026, to include a trailhead at the corner of Virginia and Lafayette streets, offering an appropriate space for reflecting and gathering.
A commitment to leadership that is willing to embrace change with compassion, innovation, and aspiration to serve and engage the community. Our creativity, professionalism, and ability to deliver results will be recognized as a national governance model.
Carbon Emission Reduction
Formally establish the 40-By-40 Plan – the City Council’s desire to reduce the City’s carbon emission footprint 40% by the year 2040 – and identify reduction strategies.
Quantify the City resident student pre-K demand and identify strategies to supplement early childhood education inside the City, focusing on affordability and opportunity.
Review existing equity in education standards within the joint school division and research methods of pairing innovative curricula with the City of Williamsburg assets, such as William & Mary and Colonial Williamsburg Foundation, to improve opportunities for all children.
Modernize the joint operating contract for the public school division to identify existing models that have successfully differentiated and targeted resources to address specific challenges; facilitate improved student performance; streamline the education-to-career pipeline; and allow for smallerscale additive programs within the larger public school division.
Smart City Initiatives
Consider the deployment of Smart City infrastructure to enable better data collection and policy development in service areas such as parking, downtown trash collection, visitation, air quality, lighting, road conditions, and code enforcement.
Consolidate existing transitional and emergency housing programs in a new responsive housing model that is less reliant on grant funding.
The equitable enhancement and protection of our entire city’s natural beauty by respecting our past and building our tomorrow. Our modern city will include attractive streetscapes, diverse housing and employment options, inviting public spaces, appropriately located infill redevelopment, and modern connectivity — all to position our city so it can attract the next big opportunity.
Complete utility relocation and roadway improvements for the Capitol Landing Road Corridor and intersection of Capitol Landing and Bypass roads.
Identify a funding strategy for and work toward completing the construction of a downtown children’s park that complements the design requirements of the Historic Area and facilitates interactive history.
Commission the completion of a Comprehensive Plan that, when complete, recommends a Complete Streets Policy; considers the appropriateness of existing Architectural Review Board District boundaries; reviews opportunities for additional housing downtown, infill development, and two-story development requirements; identifies school planning concerns; includes a citywide pedestrian/bike plan that considers existing facility improvements, expansion of assets, and trail connectivity; and a revised economic development strategic plan that emphasizes economic diversification, including opportunities for a Research Village as part of the megaregion that satisfies requirements of the Virginia Business Ready Sites Program.
Following public input on the building’s design, select a general contractor, approve a finance plan, and begin construction for the replacement of the downtown library.
Placemaking
Continue to support existing special events inside the City and identify opportunities to further diversify the type and location of events offered.
Facilitate the expansion of public art by developing approved art installation locations, evaluating a temporary or rotating exhibit approach, and completing the installation of the first gateway lantern feature.
Initiate design and secure funding for additional access to the regional indoor sports center such that completion of the work coincides with the improvement of the Bypass-Capitol Landing Road intersection.
Focus economic development recruitment efforts on the redevelopment of existing hotel properties and consider highest and best use of City-owned properties along Capitol Landing Road.
Targeted services that support, improve, and sustain individual health and community safety. Our city will proactively address public safety and social health by daring to be creative in our practices as we address homelessness and racial equity, as well as pursue a robust parks and recreation system that reimagines the use of green space.
Continue implementation of the comprehensive enhancements plan for the City’s Parks & Recreation facilities to boost visitation through the reconstruction of the Kiwanis Park tennis courts, completion of a new Wales neighborhood playground and fence, and redevelopment of the Strawberry Plains neighborhood playground.
Identify locations for public restrooms and construct two public restroom sites.
Replace the stationary canoe/kayak launch at College Landing Park with a structured shoreline ADAcompliant launch that includes an accessible pathway.
Complete the utilities master planning process, establish a funding plan, and initiate two identified infrastructure improvements for the City’s system.
Consider opportunities for increased usage of the existing Waller Mill Park, reservoir, and surrounding City-owned land through the development of a Waller Mill Usage Plan.
Complete the improvement of Waller Mill Dam fortification to comply with the Department of Conservation and Recreation to secure against failure in the result of a worst-case rainfall event.
Collaborations that re-energize and reimagine relationships with our partners that result in mutual success. The city will leverage our position in the middle of the evolving Hampton Roads / Richmond Mega Region, establish future priorities with William & Mary and Colonial Williamsburg Foundation, and explore other partnership opportunities. The city will maximize strategic partnerships with James City and York counties, as well as expand our partner base to reinforce our national prominence and top-tier brand.
Research and deploy local government best practices for employment of or contracting for grant writing and management services as well as private fundraising for municipal projects.
Complete initial design of the Williamsburg live performance venue, determine regional support, and evaluate facility completion by July 4, 2026.
Continue to evaluate consistent parking hardware, software, and pricing models that emphasize convenience, ease of use, and turnover while implementing a new parking solution in the Prince George Parking Garage.
Regional Homelessness Strategy
Consider the findings of the regional Virginia Peninsula Homelessness Study and work to identify two regionally supported strategies.
Complete public review of the Williamsburg Rent Ready Program and consider adoption while planning for staffing needs.
Evaluate the cost, economic impact, and local need of additional sports tourism facilities associated with the regional indoor sports center, including aquatic and ice sports.
Leverage our strategic location on the Interstate 64 corridor to our economic advantage by expanding technology and infrastructure and ensuring the daily mobility of our residents and visitors.
15-Minute City
Expand Williamsburg Area Transit Authority Route 15 to connect the Colonial Williamsburg Historic Area and Transportation Center with the Monticello commercial corridor, including pharmacies, grocery stores, and general shopping areas using a 15-minute frequency and electric bus infrastructure.
250th Commemoration
Facilitate the work of the Williamsburg 250th Committee, with particular focus placed on completing the identified 250th legacy projects and measuring tourism impacts of 250th-related travel.
Identify the needed improvements to provide each City bus stop with a defined standard level of service, including a shelter and trash can, and then improve five stops to the new standard of service.
Support the continued expansion of broadband providers to improve pricing, availability, and speed while seeking an appropriate solution to provide internet connectivity as a next-generation public utility.
Revised Communication Strategy
Evaluate current public outreach tools for effectiveness; identify new approaches aligned with community input; and redesign communication approaches for greater engagement.
Trail757
Establish the Williamsburg portions of Trail757, including connection to the expanded Capital Trail by obtaining funding for Phase 3 of the College Woods Circuit and planning for the trail’s continued routing through the City.

The preceding section on the biennial Goals, Initiatives, and Outcomes links the City Council's six broad goals to 35 specific initiatives. Further, the preceding section identifies desired community outcomes that relate to each goal.
This next section aligns budget and performance data to the City’s operating departments. For each department, a summary page includes the department mission, expenditures, and staffing, covering four years. Importantly, desired community outcomes related to each department and observed outcomes are shown. Many of these measures parallel the measures arrayed under the six goals in the preceding section, including the National Community Survey™ (NCS) results and ratings. Comparisons of Williamsburg resident ratings with the national benchmark from the latest 2024 NCS results are shown for service areas.
Finally, under each department are the budgetary Cost Centers that comprise that department. Detailed information is presented, including four years of expenditures and staffing, as well as performance trends, projections, and targets. Performance metrics – including workload measures, efficiency measures, and other useful indicators of performance – are shown with operating data for the last two fiscal years, the projected number for the current year, and the target or expected number for next year.
To provide leadership, strategic direction, and administrative oversight to all aspects of City operations.
& STAFFING
CITY MANAGER
• Administration
• Clerk of Council
• Communications
• Human Resources
Receive improving National Community Survey ratings for indicators of overall community well-being and value of City services “higher” than the national benchmark.
Residents rated value of services for the taxes paid and quality of life “higher” than the national benchmark comparison, with all other results shown as “similar” to benchmark for 2024.
Percent Rating “Good” or “Excellent”
Overall quality of life in Williamsburg
Williamsburg as a place to live
Services provided by City
Value of services for the taxes paid
*Comparison to the national benchmark
Percent Rating “Good” or “Excellent”
Overall appearance of Williamsburg
Cleanliness of Williamsburg
Overall quality of new development
Quality of overall natural environment
Receive improving National Community Survey ratings for Overall Appearance, Natural Environment and Built Environment “higher” than the national benchmark.
The overall appearance and cleanliness and overall quality of new development and natural environment were all ranked “higher” than the national benchmark. The quality of overall natural environment ranked “similar” to the national benchmark for 2024.
*Comparison to the national benchmark
Receive improving National Community Survey ratings for Overall Image, Direction, Opportunities for Participation in Community Matters and Public Information Services “higher” than the national benchmark.
Overall image of Williamsburg rated “higher,” with all other responses “similar” to the national benchmark for 2024.
Percent Rating “Good” or “Excellent”
Overall image or reputation of Williamsburg
Overall direction that Williamsburg is taking
Opportunities to participate in community matters
Public information services
*Comparison to the national benchmark

Percent Rating “Good” or “Excellent”
Generally acting in the best interest of the community
Overall confidence in Williamsburg government
Overall customer service by employees
Receive improving National Community Survey ratings for other Governance survey responses “higher” than the national benchmark.
Overall confidence in Williamsburg and Generally acting in the best interest of the community ranked “higher” in 2024 in comparison to the 2022 NCS. All categories ranked similar to the national benchmark for 2024.
*Comparison to the national benchmark
Exceed budget expectations by having operating revenues exceed operating expenditures each year.
Operating revenues surpassed budgeted expectations and mirror pre-pandemic percentage variances.
Maintain sound fiscal health by exceeding City Council’s reserve policy of a minimum 35% of operating revenues each year.
Shown is year-end unassigned fund balance. Prior to July 1, 2019, the General Fund and the Capital Improvement Fund were combined for reporting purposes. Effective July 1, 2019, the General Fund was reported separately for transparency. The year-end fund balance for FY18 has been restated.
*Unaudited
Maintain annual employee turnover rate of 10% or less of the permanent workforce.
This is an indicator of retention of employees who resign, retire, or otherwise terminate employment. The Covid-19 pandemic skewed the FY21, FY22, and FY23 results. The 2024 average annual turnover rate for surrounding localities is 15.2%.
To drive economic growth in Williamsburg through business support, strategic recruitment, tourism development, and public art – fostering a vibrant, diverse, and resilient local economy.
Receive improving National Community Survey responses for metrics related to business climate and economic vitality, with ratings “higher” than the national benchmark.
Received improved ratings related to Economic Development and Williamsburg as a place to work, though ratings for both, with the addition of employment opportunities, remain “similar” to the national benchmark for 2024.
Percent Rating “Good” or “Excellent”
Economic development
Employment opportunities
Williamsburg as a place to work
*Comparison to the national benchmark
Percent Rating “Good” or “Excellent”
Variety of business and service establishments
Overall quality of business and service establishments Shopping opportunities
Receive improving National Community Survey responses for the quality, variety, and availability of business and shopping opportunities, with ratings “higher” than the national benchmark.
Shopping opportunities were rated “higher,” while variety and quality of business and service establishments were rated “similar” to the national benchmark.
*Comparison to the national benchmark
Receive improving National Community Survey responses for Williamsburg as a place to visit, vibrancy of the downtown commercial area, and availability of inviting public spaces, with ratings “higher” than the national benchmark.
Residents rated public spaces and vibrancy of the downtown commercial area as “higher,” with Williamsburg as a place to visit rated “much higher” than the national benchmark.
Percent Rating “Good” or “Excellent”
*Comparison to the
To provide exceptional stewardship and safeguarding of City assets by maintaining financial management, reporting and internal control systems, with accountability to the public in a responsible and timely manner.
Maintain real estate property tax collections of at least 98% annually.
Finance collects all City revenues, with Real Estate Taxes being the single highest revenue source. Collections rates consistently fall between 97% and 99% each year. Staff follow-up on delinquent accounts raises collections close to 100% in subsequent years.
Maintain Personal Property tax collections of at least 97% each fiscal year.
Personal property tax collections include the State’s $773K Personal Property Tax Relief Act program each year. Follow-up action on delinquent accounts includes state programs with debt set-off and DMV matching to increase collections in subsequent years.
Maximize yield on investments while maintaining stringent City policy requirements of safety and liquidity.
City’s investment portfolio diversified earning average yield of 1.08% fully insured by FDIC, with balances in State Local Government Investment Pool (LGIP), bond proceeds in State Non-arbitrage Investment pool, SNAP, and interest-bearing checking accounts.
Maintain residential property assessments at 99.5% of market value.
The City Assessor closely tracks all property sales. Assessments are based on the latest market sales of properties with similar characteristics, including neighborhoods.
Residential Properties
To provide exceptional information technology systems and services to our customers, both internal and external, that support the mission of the City of Williamsburg in an efficient and cost-effective manner.
& STAFFING
Respond to all IT Helpdesk service calls in less than two hours.
Helpdesk response time achieved the goal of being less than two hours in FY 2024. The average response time for all Helpdesk service calls since FY 2015 is 2.57 hours.
Increase website visitors by 10% annually.
Overall website traffic decreased in FY 2024 compared to FY 2023. Alternatively, website traffic has increased since pre-pandemic levels. This can be attributed to improved interconnectivity with social media sites.
Expand the use of the City’s website to conduct City business by increasing eGov transactions at least 10% annually.
The total number of eGov transactions increased significantly from FY15 through FY24. Transactions have steadily increased since FY22.
Increase total dollar amount of online transactions received from residents by 10% annually.
$4,000,000
$3,500,000
$3,000,000
Financial transactions over the City's website totaled $22.2 million from FY15 through FY24. The average increase in receipts over the 10 fiscal years was 13.6%.
$2,000,000
$1,500,000 $2,500,000
$1,000,000
To work in partnership with the residents of Williamsburg, providing a safe and secure environment consistent with community values, with an emphasis on responsive community-based policing, integrity, fairness and professionalism.
LAW ENFORCEMENT OPERATIONS
• Support Services
• Uniformed Bureau
• Investigative Bureau PUBLIC SAFETY COMMUNICATIONS PARKING GARAGE
*City is part of consolidated E-911 operations with neighboring James City County and York County.
Receive improving National Community Survey ratings for all services provided by the Police Department “higher” than the national benchmark.
The percentage of Williamsburg citizens’ ratings of “good” or “excellent” were “higher” for crime prevention, with police services and traffic enforcement “similar” compared to the national benchmark for 2024.
Percent Rating “Good” or “Excellent”
*Comparison to the national benchmark

Percent Rating “Good” or “Excellent”
Safety in your neighborhood
Safety in downtown/ commercial area
Overall feeling of safety in Williamsburg
Receive improving National Community Survey responses “higher” than the national benchmark for resident ratings when asked if they feel safe in the City.
Overall safety is “higher” than national benchmark. Other responses for FY 2024 were “similar” to the national benchmark for the other categories.
*Comparison to the national benchmark
Maintain an average response time of three minutes or less for service calls. Response time is measured from the time the call is received by a regional dispatcher to arrival at the scene.
Police response time target of three minutes or less has been met from FY 2014 through FY 2018 and in FY 2024.
Clear Part I crimes at a rate above the national average. Part I crimes are major crimes such as murder, rape, robbery, aggravated assault, burglary, larceny, and auto theft.
Williamsburg’s Police Department clearance rates for Part I crimes averaged 42% in FY 2024. This is 66.3% higher than the national rate.
To ensure a prompt, safe and timely response to emergencies of an all-hazards nature. To diligently enforce all life safety measures to ensure a safe and livable community for residents and visitors.
FIRE SUPPRESSION
FIRE PREVENTION & EDUCATION
EMERGENCY MEDICAL SERVICES
EMERGENCY MANAGEMENT/ DISASTER PREPAREDNESS
Note: Emergency Management staffing provided by the Fire Department included above.
Receive improving National Community Survey ratings for all services provided by the Fire Department “higher” than the national benchmark.
Residents rated “similar” to the national benchmarks in all survey categories for 2024.

Percent Rating “Good” or “Excellent”
Fire services
Emergency medical services (EMS)
Fire prevention & education
Emergency preparedness
*Comparison to the national benchmark
Maintain an average fire response time of five minutes or less, from the time calls are received to arrival of first apparatus on the scene.
Average response times have increased gradually since FY15, driven by rising call volumes. In FY23, moving to temporary facilities and higher demand contributed to a further increase. While response times stabilized since moving into the new station, they remain above the target due to increased call volume, population growth, and traffic congestion.
Maintain an average Emergency Medical (EMS) response time of five minutes or less, from the time calls are received to arrival of first apparatus on the scene.
Average response times have increased gradually since FY15, driven by rising call volumes. In FY23, moving to temporary facilities and higher demand contributed to a further increase. While response times stabilized since moving into the new station, they remain above the target due to increased call volume, population growth, and traffic congestion.
To provide a safe and efficient transportation system, including effective signage, beautiful landscaping of City-owned properties, and maintenance of Cedar Grove Cemetery.
ENGINEERING, STREETS, STORMWATER OPERATIONS
REFUSE & RECYCLING COLLECTION
BUILDINGS & FACILITIES MAINTENANCE LANDSCAPING CEMETERY
Percent Rating “Good” or “Excellent”
Receive improving National Community Survey ratings for street services provided “higher” than the national benchmark.
Street repair and street cleaning were rated “higher” than national benchmark with all other categories rated “similar” to the national benchmark for 2024.
*Comparison to the national benchmark
Increase residential participation in the citywide recycling program.
Target set-out rate for recycling material is 65%. Recycling information is available to residents in a variety of ways, including the City’s website, the Williamsburg Farmers Market during summer months, and the Neighborhood Council of Williamsburg.
To meet the state goal of recycling 25% of the City’s solid waste stream each year.
Since 2015 the City has exceeded the State’s 25% goal. For 2024, the recycling rate was 25%.
Percent Rating “Good” or “Excellent”
Receive improving National Community Survey ratings for essential services provided by the Public Works department “higher” than the national benchmark.
Garbage collection and recycling are contracted services. All survey responses were “similar” to the national benchmark for 2022.
*Comparison to the national benchmark
To provide quality recreational facilities, parks and programs that are safe, diverse, affordable and enriching to the community through our commitment to public service.
& STAFFING
Percent Rating “Good” or “Excellent”
Recreational opportunities
City parks
Recreation programs or classes
Recreation centers or facilities
Receive improving National Community Survey ratings for Recreation services and facilities “higher” than the national benchmark.
All survey responses were “similar” to the national benchmark for 2024.
*Comparison to the national benchmark
Increase the number of City residents using the Recreation Center, visiting parks, and participating in recreation programs or activities.
Fitness opportunities responses were rated “similar“ to the national benchmark for 2024.

Availability
*Comparison to the national benchmark

Guide the physical development of the City as recommended by the Comprehensive Plan, and protect the health, safety, and welfare of residents and businesses through the enforcement of land development ordinances and building and property maintenance codes.
Receive improving National Community Survey ratings for Land Use & Zoning services provided by the City’s Code Compliance department “higher” than the national benchmark.
All categories are “similar” to the national benchmark in the 2024 survey. Overall quality of new development was “higher” in 2024 compared to 2022.
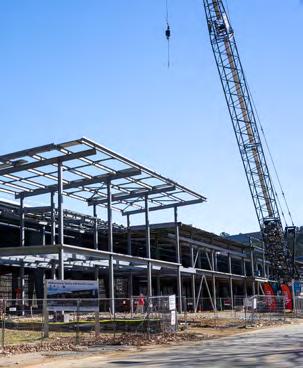
Percent Rating “Good” or “Excellent”
Overall quality of new development
Land use, planning & zoning Code enforcement
*Comparison to the national benchmark
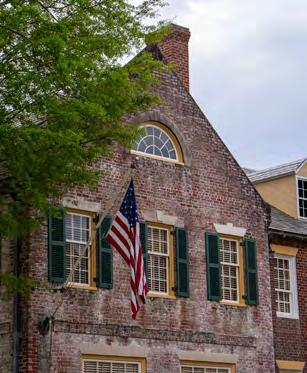
Protect the visual and historic character of the City through an effective architectural review program.
Forty-eight percent of City land is subject to review by the Architectural Review Board. ARB reviewed 144 cases in FY24, approving 85%.
Protect the environmental character and quality of the City through enforcement of city and state environmental regulations (Chesapeake Bay Preservation and Erosion & Sediment Control regulations).
Sixty percent of the City is subject to Chesapeake Bay protection regulations. In FY24, 556 inspections were performed to ensure compliance with Erosion & Sediment Control regulations.
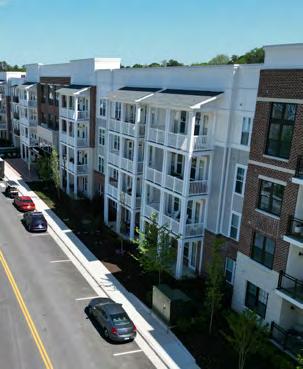
Protect the character and quality of the City’s residential neighborhoods through proactive enforcement of the property maintenance code and Rental Inspection Program.
In FY 2024 there were 1,300 property maintenance code inspections, and 109 rental inspections performed. Of those, 59% were brought into voluntary compliance.
To respond to the physical, emotional, and general human service needs of children, adults, and families in crisis, and to provide stabilization for program participants.
& STAFFING
Process expedited food stamps (SNAP) within seven days.
Over the past 10 years, on average 95.3% of expedited food stamp applications have been processed in seven days.

*Numbers are not unduplicated and may reflect multiple interactions with a single client.

To provide a safe, efficient, and cost-effective waterworks and sewage conveyance system throughout the City.
*Administration includes Newport News water agreement charges and debt service costs ***Water/Sewer Systems separated from HRSD starting FY 2026
Receive improving National Community Survey ratings for water and sewer services “higher” than the national benchmark.
The National Community Survey shows 79% of respondents rated the City’s drinking water “good” or “excellent,” with both drinking water and sewer services “similar” to the national benchmark. The sewer services ranked “higher” in 2024 compared to 2022.
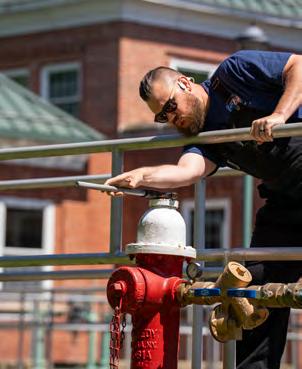
Percent Rating “Good or Excellent”
Drinking water
Sewer services
*Comparison to the national benchmark

Continue water conservation measures to target water consumption under 3.4 million gallons per day.
Water consumption remains below 3.4 million gallons per day, with the 10-year average in the City at 2.56 million gallons per day.
AVERAGE WATER CONSUMPTION PER DAY IN MILLIONS OF
To provide water with a quality that exceeds minimum regulatory standards (i.e. as perfect as possible) and to operate the Water Plant in an exemplary manner within the provisions of the Virginia Optimization Program (VOP) of the Virginia Department of Health.
The Water Plant has increased its percentage of Class 1 operators by nearly 30% over the last two fiscal years. With highly credentialed staff, the City continues to exceed minimum regulatory standards as established by the VOP.
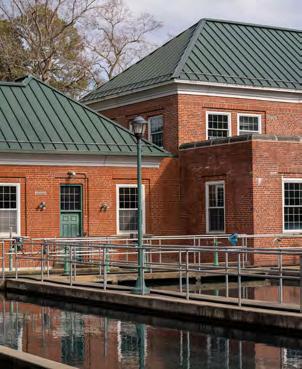

Minimize sewer back-ups using a preventive maintenance schedule.
Preventive maintenance at key locations around the city have decreased the number of backups since FY 2015. Average annual reduction since FY 2015 is 31.2%.
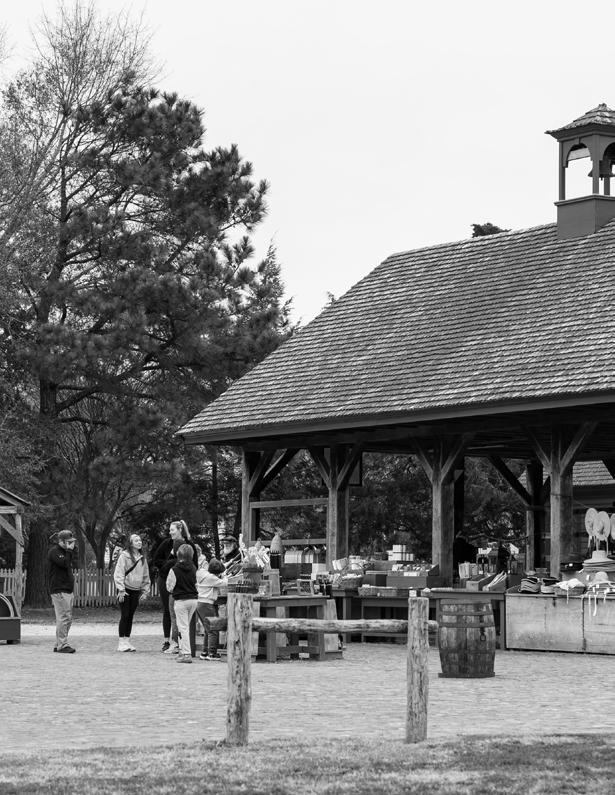

The City of Williamsburg has formalized a five-year plan for the General Fund to provide a framework for forecasting the City’s financial outlook. In conjunction with the five-year Capital Improvement Plan, this forecast will enable the City to establish and track progress toward City Council’s strategic Goals, Initiatives and Objectives (GIOs). This multi-year planning process will allow new or large initiatives, as identified in the GIOs, to be planned, funded, and phased in over time.
This forecast is based on historical data, trends, and assumptions derived from various sources. As with all forecasts, many unpredictable economic factors affect the projection of revenue and expenditures, particularly employment factors and rising interest rates. The assumptions within this forecast are based on the most recent information available. As expected, projections may lose some of their validity as the forecast moves further into the future.

Real estate tax revenue accounts for approximately 35% to 40% of General Fund revenues, making it a significant budget driver for the City. Real estate assessments typically grow between 3% and 5% annually in stable economic times. Assessments are affected by many factors, including the type, condition, and location of specific properties. For certain commercial-type properties, income and expenses for the property factor into the assessed value of the property.
For the five-year forecast, current economic conditions are volatile, so predictions for the future are highly uncertain. On average, assessments for FY26, not including new construction, are 3.3% higher than FY25 and 4.02% higher, including new construction. The City’s Real Estate Assessor states that in a stable real estate market, a typical annual assessment increase usually ranges from
3% to 5%. Therefore, due to the current economic condition, 4% was used to forecast real estate assessment increases for FY27 through FY30.
Personal Property tax is a tax on the value of primarily vehicle assessments. In recent years, fluctuating supply chain conditions, inflationary pressures, and shifts in consumer demand have influenced used vehicle values, impacting personal property taxes. While vehicle assessments saw sharp increases during supply shortages, recent market stabilization and rising interest rates have led to more moderate valuation trends. The Commissioner of the Revenue projects that vehicle assessments will experience steady but tempered growth. However, personal property revenue collections also depend on collection rates and delinquency levels, which remain variable due to economic uncertainties. As a result, a cautious growth estimate has been applied for FY27 through FY30.

In FY23, business license revenue surpassed prepandemic levels last seen in FY19. Budgeting for these licenses remains challenging, as current fiscal year revenue is received late in the budget process. FY24 significantly exceeded expectations, rising 16% over FY23. Sales and meals tax collections remain strong, aligning with projections for FY25. BPOL revenue is expected to grow in FY26 compared to the projected actuals for FY25, with a steady 2% growth rate anticipated from FY27 through FY30.
The hotel and motel tax is influenced by room occupancy and fluctuations in room rates aimed at maintaining demand. In FY20, revenue declined by 30% due to the impact of COVID-19, followed by a 46% decrease in FY21 compared to pre-pandemic levels. However, FY22 experienced a rebound, with occupancy and revenue surpassing pre-pandemic figures by nearly 5%. FY23 continued this upward trend, recording a 10% increase over pre-pandemic levels, while FY24 saw minimal growth year-overyear. A 3% revenue increase is projected for FY25. Additionally, the lodging tax rate is anticipated to increase from 5% to 7% in January of 2026, as part of FY26, in response to evolving economic conditions. For FY27, this will be the first full year
that the excise tax increase will be implemented, resulting in an 18.42% increase. From FY28 through FY30, revenue growth is expected to stabilize at a steady rate of 1.5% annually.
Restaurant and food tax revenue experienced a 20% decline during the pandemic in FY20 and FY21. However, by FY22, revenue rebounded, exceeding FY19 pre-pandemic levels by 7.5%. FY23 saw continued growth, with meal tax revenue reaching approximately 20% above pre-pandemic figures. In FY24, revenues increased modestly by 1% year-over-year, with a projected 5% increase anticipated for FY25. In alignment with the planned lodging tax adjustment, the restaurant and food tax rate is anticipated to increase from 5% to 6.5%, effective in January of 2026. The first full year of the meals tax at 6.5% will be in FY27, resulting in a 16.43% increase. The City projects a steady growth rate of 3.0% annually from FY28 through FY30.
The City plans to implement an admissions tax beginning January 1, 2026, as part of the FY26 budget. A 10% tax will be collected at the point of ticket sales for Williamsburg events. This tax is expected to enhance revenue generation from the city's vibrant entertainment sector. For the first full year of the implemented admissions tax there is anticipated to be a 2.61% growth rate. A steady annual growth rate of 2% is projected from FY28 through FY30.

The general expenditure growth rates in the fiveyear forecast assume that City programs and services will continue mostly unchanged over the next five years without significant additional initiatives. City operations are primarily driven by personnel costs. The City has initiated a recruitment and retention strategy that will impact personnel costs. The baseline forecast assumes the City workforce is largely unchanged in the next five years and that implementation of the
recruitment and retention strategy will increase costs for salaries and benefits at a rate exceeding previous historical trends, meeting or exceeding the rate of inflation.
The impact of inflation has caused an increase in materials and services and, most notably, in the contribution to other regional agencies and capital improvement plan costs.
Taking into account conservative estimates and potential economic impacts related to inflationary growth, the City of Williamsburg anticipates a modest increase in the unassigned fund balance over the next few years. This projection indicates that the unassigned fund balance will exceed the baseline fund balance policy for the forecasted period. It's important to recognize that this forecast is based on certain assumptions, and alterations
to these assumptions could lead to different actual results. Notably, significant generational capital projects, such as the sports complex, are expected to drive robust revenue growth in the foreseeable future. Moreover, the forecast assumes that the City will maintain a fund balance sufficient to withstand unforeseen inflationary impacts on the economy.
The Virginia Constitution authorizes cities and counties in Virginia to issue general obligation bonds secured by a pledge of its full faith and credit. For the payment of such bonds, the City’s governing body is required to levy an ad valorem tax on all property subject to local taxation to ensure debt service payment. The issuance of general obligation bonds is subject to a limit of 10% of the assessed value of taxable real property in the city. The City's limit is $316 million and its outstanding debt is $48 million. The Public Finance Act of Virginia also authorizes a city in Virginia to issue limited liability revenue bonds provided that the rates, rents, fees, or other charges are sufficient to pay the cost of operation and administration and the principal and interest on the bonds when due.

The City has the following outstanding general obligation bonds at the end of FY 2025:
GO Public Improvement & Refunding Bonds
GO Public Improvement & Refunding Bonds
December 2017
October 2022
GO Public Improvement & Refunding Bonds
November 2023
$19,630,000
$12,520,000
$24,500,000
$24,500,000
$10,195,000
$10,195,000
All interest paid semi-annually; principal annually 20 years, 2.736% pay-off July 2037
Ten-year callable bond, fixed interest for first four years at 3.1% with option to renegotiate for the remaining term, interest paid semi-annually with principal and accrued interest due at maturity, pay off November 2032
Fixed interest rate bonds at 4.59% with final maturity July 15, 2051. Subject to redemption prior to maturity at the option of the City: at a redemption price of 100% of principal plus accrued interest. Also, subject to mandatory repurchase by the City at a price of 100% during the periods beginning two months before and ending two months following each of July 2034 and 2044 at the discretion of the registered owner, with three months prior written notice.

Below is the future fiscal year Principal & Interest on the current outstanding debt of the City.
Note: This includes $24,500,000 in the 2022 BAN principal and interest, which will be refinanced in FY 2027.
The City of Williamsburg is autonomous and independent of any county or other political subdivision and is not subject to taxation by any county or school district, nor is it liable for any county or school division indebtedness. Currently, there is no overlapping debt.
Bond or credit ratings are independent opinions of an issuer’s general creditworthiness based on relevant risk factors. Long-term general obligation ratings are based on an issuer’s ability and willingness to fully repay the principal and interest of its debt obligations on a timely basis. Municipal credit ratings are primarily based on four main factors: the issuer’s financial position, the issuer’s current and future debt burden, financial management, and the economy. Often an investor places significant emphasis on a bond’s credit rating to help evaluate a price or willingness to hold the investment. Each major credit rating agency in the U.S. applies its own methodology in measuring creditworthiness and uses a specific rating scale to communicate its ratings opinions. Typically, ratings are expressed as letter grades that range from ‘AAA’ to ‘D’ to communicate the agency’s opinion of the relative level of credit risk. Credits are further distinguished with “notches” within each rating category.
The City's credit has strong investment quality ratings for the CITY’S GENERAL OBLIGATION BOND as follows:
• Moody’s Investors Service (“Moody’s”) Aa1
• S&P Global Ratings (“S&P”) AAA
State statutes impose a legal debt margin for general government debt, a limit of 10% of the assessed value of real property in cities. For 2025, the City’s assessed value of real property was $3.165 billion; the debt outstanding, including amortization of premium, is $48 million, resulting in a legal debt margin of $268 million.
In addition to the legal debt margin, the City has established financial policies that direct any financial decisions on debt issuance in addition to the legal debt margin. These conservative financial policies demonstrate its commitment to sound financial practices and contribute to maintaining the City’s high credit ratings, lower borrowing costs for capital projects, and promoting long-term fiscal sustainability.
*10-year payout includes the payout for refinancing the 2022 bond in FY 2027.
*Permanent financing for FY 2022 Bond Anticipation Note
**Bond Anticipation Note for Library and other projects that will be permanently financed FY 2030
The City proposes to refinance the $24.5 million of the October 2022 bond and borrow $20.63 million of new money by issuing bonds of $630,000 and $20 million in FY 2027 to fund various projects, including the police station and library. This graph illustrates that the debt service for planned future issuances is below the City’s debt service policy limits for future years.
The City intends to issue revenue bonds to support Utility Capital Improvement Projects totaling $25.7 million over a 10-year period. To finance this initiative, a 30% increase in utility rates will occur in Fiscal Year 2026, the first-rate adjustment since Fiscal Year 2018. These critical infrastructure investments include the renewal of the Water Treatment Plant, Distribution System Renewal Phases I and II, and Sewer System Renewal.
$9,000,000
$8,000,000
$7,000,000
$6,000,000
$5,000,000
$4,000,000
$3,000,000
$2,000,000
$1,000,000
***For this graph, estimates for future issuances use schedules supplied by the City’s financial advisor. The actual structure of principal and interest payments may vary when the bonds are issued.
Below is the estimated fiscal year debt service payments for current outstanding and planned new debt to be issued in Fiscal Years 2026 and 2027 for All Funds.
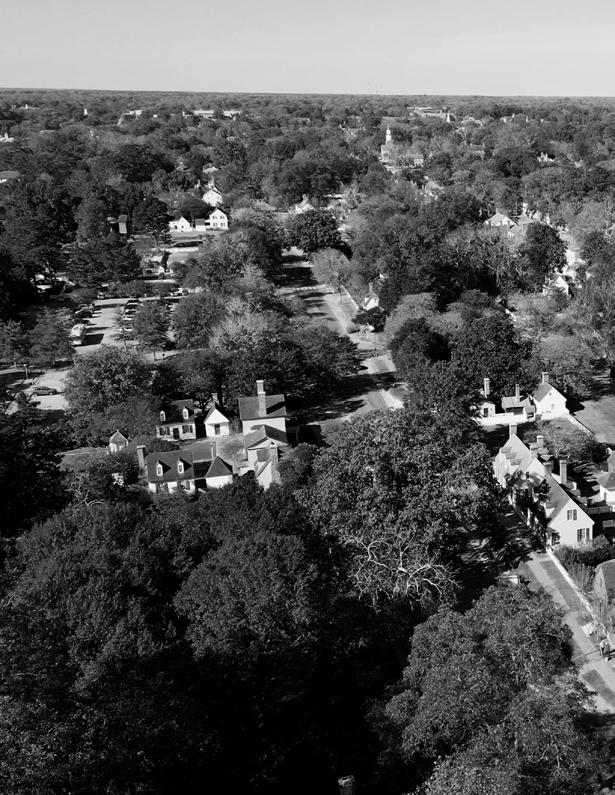

The Budget Summaries section provides an overview of all budgeted funds for the upcoming year. These include the General Fund, the Capital Improvement Plan Fund; the Tourism Development Fund; the Utility Fund, which also includes capital improvements; the Public Assistance Fund; and the Quarterpath Community Development Authority Fund.
AN EXPLANATION OF EACH FUND CAN BE FOUND ON PAGE I-51
Revenues and expenditures/expenses are categorized by type, in accordance with recommended standard formats of the Government Finance Officers Association, enabling consistency and comparability between all forms of local government.
EXPENDITURES/EXPENSES
Quarterpath CDA is a fiduciary fund for collection and remittance of special assessments each year.
EXPENDITURES
General property taxes include all real estate, public service, personal, and business property taxes, including penalties and interest. On average, real estate property reassessments are expected to increase by approximately 4.02%. The average increase in single-family residential reassessments is anticipated to be 4.75%, and the average commercial values are anticipated to increase 1.57%. Multifamily residential is expected to increase by 6.54%, excluding new construction. The adopted real estate tax rate is $0.62/$100.
This category consists of consumer utility taxes, communication sales taxes, business and franchise, bank stock, recordation, cigarette, room, and meal taxes. Utility taxes are based on residential and commercial usage. Overall, other local tax receipts are estimated to increase by 18.1% for FY26. This is primarily due to the anticipated implementation of an increase in meals tax by 1.5% and a 2% increase in lodging tax, and the implementation of a 10% admissions tax beginning in January 2026.
Licenses and permits consist of citywide on-street parking, building, electrical, plumbing, mechanical, sign, and various inspection fees. This category of revenues fluctuates based on various development projects occurring in the City during a particular fiscal year. Receipts were $261K in FY24 because of a few major private developments obtaining permits. It is expected to be $172K for FY25, with totals for FY26 budgeted at $266K, based on anticipated projects in the City.
Court fines, parking citations, and code violations make up this revenue classification. Court fines are collected by the Clerk of Circuit Court and remitted to the City monthly. Receipts generated revenues of $187K and $216K for FY23 and FY24. FY25 revenues are expected to be $210K, and FY26 is budgeted at $270K.
(Thousands)
Income from rentals of City-owned buildings, such as the Transportation Center, Stryker Center, Community Building, and parking fees from the Prince George Parking Garage are included here. Revenues totaled $813K in FY23. Revenue for FY24 was $806K and is expected to be $795K for FY25. The FY26 budget is set at $855K, as revenues are expected to mimic pre-pandemic values.
Charges for services represent fees for various activities within the City, such as all recreation fees and program revenues, cemetery lots, and grave openings. Revenues for FY23 and FY24 were $440K and $501K, respectively. FY25 revenues are expected to be $646K and increase to $700K in FY26 as additional classes and activities are added. The driving force of the increase from previous fiscal years is the addition of the Farmers Market Revenues in FY24.
This category comprises various sources, such as payments in lieu of taxes, Arts Commission reimbursement from James City County and the State, overhead charges from the Utility Fund, EMS Recovery Fees, and an emergency services agreement with William & Mary. The estimated FY25 revenue is $2.86M, and the adopted FY26 is $3.02M.
These funds include State reimbursements for Constitutional Officers' expenses, 599 law enforcement funds, VDOT street maintenance payments, and various other taxes returned to the City. VDOT street maintenance payments, law enforcement 599 funding, and funding from the State Compensation Board for the Commission of Revenue, Treasurer, and Registrar were higher than expected in FY23. An increase of 179K, or 5.2%, is projected for FY26 compared to FY25.
This category includes City Council, Clerk of Council/ Communications, City Manager, Human Resources, City Attorney, Commissioner of the Revenue, City Assessor, Treasurer, Finance, Vehicle Repair Shop, Electoral Board, Registrar, and Information Technology. Expenditures are estimated to increase by 7.5% or $652K compared to the FY25 budget. Some of the significant factors for the increase:
• Increases to balance were primarily salaries and benefits to all departments.
• Due to economic conditions, inflation has also had an impact on operating costs.
• Increases in maintenance and service costs.
Judicial functions are performed by the Circuit Court, General District Court, Juvenile and Domestic Relations Court, Clerk of the Circuit Court, Commonwealth Attorney, 9th District Court Service Unit, and Magistrate. Judicial functions have been performed in the jointly operated WilliamsburgJames City County Courthouse since FY01. An expanded explanation is included in the “Notes on Funding Relationships” section of the budget guide. Costs are shared with James City County on a population basis each year. Funding of $767K is anticipated for FY26.
Departments included in this classification are Police, Parking Garage, consolidated E-911 Dispatch, Fire, Group Home Commission, Colonial Commission Corrections, Animal Control, City’s share of the cost for participation in VA Peninsula Regional Jail Authority, and Codes Compliance. Public Safety costs increased for FY26 by $1.41M or 9.4%, compared to the FY25 adopted budget. The increase is due to changes in pay and benefits of $920K. Increases to the police budget include $25K for vehicle expenses and $10K for police supplies. For Fire, the FY26 adopted budget includes a $22K increase for professional health services and a $26K increase for EMS supplies. In addition, there is a $21K increase for E-911 services paid to York County in FY26 and a $226K increase for the Regional Jail. PUBLIC
The City Shop, Engineering, Streets, Stormwater Operations, Refuse Collection, Building, and Facility Maintenance, Landscaping, and Cemetery comprise the operating budget’s Public Works section. Overall, costs for FY26 increased by $300K, which is 6.5% higher than FY25. Building Facilities and Maintenance had an increase in service contracts of 40K. Another contributing factor to the increase is 74K in the Streets department.
This category consists of the City’s contribution to the local Health Department, Colonial Behavioral Health (CBH), Olde Towne Medical & Dental Center, and the Public Assistance Fund and Public Assistance Transportation subsidy. Peninsula Health Center, Olde Towne Medical & Dental Center, and Colonial Behavioral Health provide health services for the community. City contributions for the adopted FY26 budget decreased by $189K, a 7.1% decrease compared to FY25. The CBH contribution increased by $14K, the contribution to the Peninsula Health District decreased by $21K, and Olde Towne Medical increased by $4K. The City’s budgeted subsidy of $1.87M to the Public Assistance Fund decreased by $185K in FY26 over the FY25 budget.
The City and James City County jointly fund the Williamsburg-James City County Public School system. FY24 was the first year of the FY23-FY28 School contract. The City’s contribution to school operating costs for FY26 is anticipated to be $12.7M based on the joint School contract with James City County, which is a $1.4M increase from FY25 or a 12.4% increase. In FY25, the Schools received their portion of state sales tax directly from the State versus a pass-through from the City. Capital costs are budgeted in the Capital Improvement Fund for the City’s portion of school projects next year.
HEALTH & WELFARE (Millions)
Recreation administration, playgrounds, parks, library, and grants provided to organizations upon recommendation of the Williamsburg Area Arts Commission are included in this category. The City's contribution to the Williamsburg Regional Library, operated jointly with James City County, is adopted at $1,141,588, a $56K increase compared to FY25. Arts Commission contributions are funded at $159K for FY26. James City County reimburses the City for half the program costs as a funding partner. Overall, this category of expenditure increased $54K or 1.7% in FY26 compared to the FY25 budget. Parks & Recreation had an increasing trend in the overall budget due to the addition of the Farmers Market and other operating expenses adjusting for current economic conditions.
This includes the Planning Department and contributions to various human service, community and economic development agencies within the City. This category’s budget for FY26 increased by $254K, or 17.8%, over what was budgeted in FY25. Increases can be accredited to contributions to outside agencies such as the Williamsburg Area Transit Authority of 94K.
The City’s Goal “Prioritizing Safety and Wellness” is to provide targeted services that proactively support, improve, and sustain individual health and community safety. One of the objectives to achieve this goal is to review the plan for shared mission funding for these services. The chart below represents the shared services programs and costs. It is important to note that in Fiscal Year 2025 the actual costs are budgeted in the individual department’s budget.
*This table summaries the funding history and adopted FY26 budget for the General Fund's eight major funding categories. Debt Service is included in the Capital Improvement Program budget.
TOTAL $55,897,341
3101 -
3102 - POLICE, E911
3103 -
9301 - DEBT SERVICE*
*Included in Capital Improvement Plan Fund
REVENUES
1,086,284
EXPENDITURES
TOTAL $7,211,284
EXPENDITURES
Local tourism-related taxes consist of the $2 per night lodging tax and the Historic Triangle sales tax. Lodging tax collections have remained relatively stable, totaling $978K in FY23 and $954K in FY24. For FY26, the City is projecting an increase to $1.2M. Historic Triangle sales tax collections are expected to grow by just under 1% compared to the FY25 budget, with revenue projected at $2.62M in FY26. Together, these two revenue sources are anticipated to generate a combined total of $3.82M for the Tourism Fund in FY26.
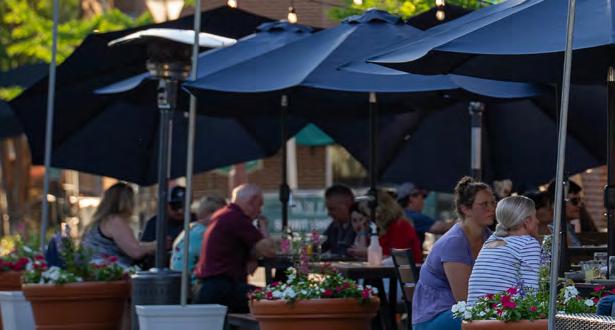
As with all City funds, interest earnings in the Tourism Fund come from the City’s practice of investing available cash that is not immediately needed. These funds are invested in accordance with the City's stringent investment policy, primarily in the Commonwealth’s Local Government Investment Pool (LGIP) and Insured Cash Sweep (ICS) accounts at local banks. With higher interest rates in FY25 and strong cash balances expected, Tourism Fund interest earnings are projected to reach approximately $100K for FY26.
(Thousands)

The FY26 budget for administration is $327K, representing a 7.8% increase over the FY25 budget of $304K. The $23K increase is primarily attributed to an increase in salary, benefits, and training for staff. The increase from FY24 actual to FY25 budget is due to the underutilization of the professional services line in FY24.
The FY26 budget includes $1.4M for tourism marketing, a 10% increase of $127K compared with FY25. This increase is mainly attributed to anticipated growth in revenue from the Historic Triangle sales tax, a portion of which is allocated to the Williamsburg Tourism Council to promote the City as a travel destination. This marketing plays a key role in attracting visitors, which supports local hotels, restaurants, shops, and attractions by driving tourism-related spending throughout the community.
The total amount budgeted for FY26 is $2.6M, a decrease from the $2.9M budgeted in FY25. This includes the City's contribution to tourism-related outside agencies, including An Occasion for the Arts, CultureFix, Virginia Arts Festival, Williamsburg Downtown, and the Colonial Williamsburg Foundation. In FY24, the City awarded additional dollars to support the Ampersand International Arts Festival, using ARPA tourism funds to offset costs. For FY25, the City added this additional funding to its Tourism Outside Agencies budget, which is reflected in the increase between FY24 and FY25. TOURISM OUTSIDE AGENCIES (Millions)
This category includes grants awarded by City Council through the Tourism Development Fund (TDF), based on recommendations from the Tourism Development Grant Review Committee. The program supports projects that attract tourismrelated products, improve related infrastructure, and support placemaking initiatives. The FY26 budget for TDF Grant Awards is just under $2.9M, reflecting a $1.7M increase over FY25. This increase is due to the City’s annual contribution to the Historic Triangle Recreational Facilities Authority (HTRFA), a contractual commitment that supports regional tourism infrastructure. There is $361K available to the HTRFA.
$9,989,686
TOTAL $9,989,686
EXPENSES
The Public Utilities department operates a water distribution system throughout the City. Commercial customers are billed monthly. Residential accounts starting July 1, 2025, will be billed monthly to provide constant cash flow for this Enterprise Fund. An analysis of the water rates is included in the appendix. FY26 consists of an adopted rate increase of 30%.
FY25 Water Service revenue was budgeted at $5.1M; with level consumption rates and rate increase, water service revenues are expected to be $6.66M in FY26.

Sewer lines are maintained by the City, with 15 pump stations collecting and transmitting sewage to the Hampton Roads Sanitation District (HRSD) for treatment. Beginning in FY26, sewer charges will be billed directly by HRSD and paid by customers to HRSD, rather than through the City. Previously, sewer and water charges were combined on a single bill and based on water consumption. In FY23 and FY24, actual sewer revenues, as well as the FY25 budgeted amount, reflect collections made by the City and remitted to HRSD under a contractual arrangement. HRSD sets sewer treatment rates annually for all jurisdictions in the region, with steady increases driven primarily by compliance with evolving environmental regulations. For FY25, the City budgeted $3.0M in sewer service revenues.

These revenues consist of penalties, water and sewer connection fees, water tank antenna contracts, and other miscellaneous items. The amount of revenue provided by these sources is difficult to estimate from year to year. Revenue anticipated from other sources remains relatively level at $373K for FY26.
Interest earnings in this fund, like any municipal fund, are a product of idle resources invested under the City’s stringent investment policy and current interest rates. The City invests in the State’s Local Government Investment Pool (LGIP) and Insured Cash Sweep Accounts (ICS) at local banks. In FY25 interest rates have increased and, with this increase and anticipated cash resources, interest earnings are anticipated to be close to $400K for FY26.
OTHER SOURCES (Thousands)
Availability fees are charges for a home or business to have access to existing water and sewer lines. As discussed previously, water and sewer connection charges are additional charges based on the cost of constructing connections to a home or business. Availability fees increase as development takes place and, therefore, can vary each year. Increases in building activity are proportional to availability fee revenue. The budget estimate for FY26 is $100K.
In FY25, the City budgeted to receive 1.4M in Congressionally Directed Spending Funds to replace the Colonial Parkway Main. The City does not plan to apply for or receive any grants in FY26.
Administration expenses account for 31.2% of the total utility fund. The Utility Department's administrative staff currently consists of three fulltime employees, with the FY26 proposal including funding for one additional full-time position—a civil engineer. Overhead is reimbursed to the General Fund for all administrative functions performed by the City Manager’s Office, Engineering, the Shop, Information Technology, and the Finance Department (for billing, collections, and accounting) on a set percentage basis. Depreciation (a noncash expense) of the City’s intangible water rights purchased from Newport News in 2009 is based on an estimated 25-year period.
The City owns and operates its water treatment plant located at the Waller Mill Reservoir in adjacent York County. The plant produces an average of 3.3 million gallons of water daily and provides safe drinking water to over 4,300 accounts. In FY26, expenses for the water treatment plant are estimated to increase by about 4.53% compared to FY25 due to increases in chemical costs, electricity, and SCADA professional services. Capital expenses required by the water treatment plant are provided for in the Utility Fund Capital Improvement Plan.
Water system personnel are responsible for managing the water distribution system, consisting of 60 miles of lines and four water tanks throughout the City. Expenses for FY26 are expected to increase by 173K or 23.5% from the last fiscal year, mainly due to changes in salaries and benefits.
The sewer system includes approximately 50 miles of sewer collection and transmission lines and 15 pump stations within the City. This infrastructure conveys raw sewage to the Hampton Roads Sanitation District (HRSD) for treatment under a contractual arrangement. In FY26, sewer-related expenses are projected to decrease by $2.96M. This reduction reflects the change in billing structure, with HRSD now billing customers directly, eliminating the need for the City to collect and remit payments. As a result, there is no impact on the Utility Fund’s operating income. The FY25 budget, FY24 actuals, and FY23 actuals reflect the City’s prior role in collecting and forwarding these payments to HRSD.
SEWAGE SYSTEM (Millions)
The City borrowed $10M in a bank-qualified loan and refinanced this debt in October 2010 to take advantage of historically low long-term interest rates. Part of the refunded 2010 debt was refinanced again in FY18 to take advantage of lower interest rates. The remaining 2010 debt will be paid in full by the end of FY27. The City maintained its strong bond ratings from Standard & Poor's (AAA) and Moody's (Aa1) as part of this refinancing. Principal bond payments are treated as fund liabilities and not budgeted as expenses in this fund, but are included in the water rate analysis each year. In FY26, the City will be issuing the first of a series bonds to modernize the Water Treatment Plant. The 10-year plan equates to $25.7M.
The City contracted with Newport News Water Works in 2009 to access up to 2 million gallons of untreated water daily. In the last 16 years, the City's utility has not accessed this supply except for testing. The contract included a second payment for continued access to 1 million gallons of the daily supply due in June 2024 unless otherwise negotiated by the two parties. The 2009 agreement was extended to June 2025 to allow both parties more time to assess the demand and potential fee for continued access to the full 2 million gallons daily. In June 2025, the City finalized an agreement with Newport News Water Works that allows for 3 million additional gallons of water with no upfront costs, and the City is only charged upon use at the market rate, which is currently $4.29 per 1,000 gallons.
DEBT SERVICE (INTEREST) (Thousands)
SUPPLEMENTAL WATER (Thousands)
EXPENDITURES
2,972,224
The Quarterpath Community Development Authority (QCDA) was created in July 2006 to assist in financing public improvements for the property within the geographic boundaries of the Quarterpath Community Development Authority District. The property is located in the City at the intersection of U.S. Routes 60 and 199, about 2 miles west of Rte. 199 interchange with Interstate 64. The District consists of approximately 222 acres proposed to be developed as a mixed-use project. The improvements include the design, planning, coordination, and construction related to the following:
• Battery Boulevard (East-West Access);
• Commonwealth Avenue;
• Sidewalks, bike trails, and public amenities;
• Water and sewer utilities; and
• Wastewater management
The improvements are all provided to meet the needs of the property in the District that result from the proposed development of the property, providing necessary road enhancements, public amenities, and water, sewer, and stormwater management facilities that did not previously exist. The QCDA issued $15 million in Special Assessment Revenue Bonds in November 2011 to finance the acquisition, construction, and equipping of the project. The bond proceeds cover all expenses for constructing improvements, issuance costs, bank fees, and capitalized interest.
A Special Assessment Agreement between the City, Riverside Healthcare Association, Inc., and
the QCDA was signed in November 2011. This agreement describes the levy and collection of special assessments on real property within the CDA District to pay the debt service on the $15 million bonds. Special assessments are allocated to parcels within the District on a basis that reasonably reflects the benefit each parcel receives from the public improvements. The Board of the QCDA requests the City to collect annual installments of the special assessments within the CDA District in an amount to be determined in accordance with the rate and method sufficient to pay the CDA obligations payable in the applicable assessment year.
The Special Assessment Agreement requires that an amount equal to the annual installment be included in the City’s budget for each fiscal year any Bonds are outstanding. The QCDA Fund will account for the special assessment activity each year. FY25 is the 13th year special assessments will be collected by the City for the QCDA.
BUDGET
Of the $65,502,485 Fund Balance in the Governmental Fund CIP, approximately $39 million is nonspendable (invested in land held for resale) or bond proceeds.
Working Capital - June 30, 2024 [audited] $ 8,576,119
Estimated Revenues - Fiscal 2025 10,701,905
Estimated Expenses - Fiscal 2025 (13,678,785)
Subtotal
-
$ 5,599,239
Estimated Revenues - Fiscal 2026 Revenue from Use of Money & Property $ 590,000 Charges for Services 6,946,150 Other Financing Sources - Bonds 2,284,350
REVENUES $ 9,820,500
Estimated Expenses - Fiscal 2026 Public Utilities - Operations $ (7,355,936) Capital Projects & Transfer to General Government CIP (2,633,750) Total Expenses $ (9,989,686)
Subtotal Working Capital June 30, 2026 $ 5,762,152
Depreciation Expense (non-cash item) 850,000
WORKING CAPITAL - JUNE 30, 2026 $ 5,496,281
Fiscal Years 2020-2026
$70,000,000
$60,000,000
$50,000,000
$40,000,000
$30,000,000
$20,000,000
$10,000,000
$-
* Assumes all CIP projects are completed. Of the $65,502,485 fund balance, $3,778,524 is invested in land held for resale and the remaining is available for programming into the five-year Capital Improvement Plan for FY 2026.
A trend analysis of the City’s governmental funds operations shows how cycles of saving and spending have balanced over time to maintain adequate cash reserves:
FY 2015 - Stryker Center construction costs of $3M, street resurfacing costing $339K, and two motel properties on Capitol Landing Road were purchased for $1.45M. York Street sidewalk and roadway improvements from Page Street to Quarterpath Road were made at the cost of $750K.
FY 2016 - Stryker Center construction completed, totaling $3M in FY 2016. York Street roadway and sidewalks constructed for $747K. Annual street resurfacing costs were $2M, including Richmond Road, aided by VDOT grant funds. The unassigned fund balance was $12.4M, with $18.8M assigned for future capital projects.
FY 2017 - The City issued $13M in bonds for Fire and Police Station renovations. Annual street resurfacing costs were $1M, and underground wiring totaled $757.3K. The ERP System replacement totaled $273.6K. The unassigned fund balance was $12.6M, with $15.5M assigned for future capital projects.
FY 2018 - Effective July 1, 2018, the General Assembly added section §58.1-603 to the Virginia Code, increasing the sales tax in the Historic Triangle (City of Williamsburg, James City County, and York County) by 1% and creating the Historic Triangle Marketing Fund to be managed and administered by the Williamsburg Tourism Council. The Historic Triangle Marketing Fund’s sole purposes are marketing, advertising, and promoting the greater Williamsburg area as an overnight tourism destination.
One-half of the revenue from the increased sales tax and the $2/night room tax goes to the Historic Triangle Marketing Fund, while the other half remains with the locality, imposing the tax. The City of Williamsburg allocated its share of these taxes to local travel and visitation through the creation of a Tourism Fund.
FY 2019 - The Ironbound Road Project Phase 1 was substantially completed during FY19. This phase included the relocation of Longhill Road and the redesign of its interchange and was coordinated with the opening of the new James Blair Middle School. In FY19, $2,227,800 for this project was expended.
Underground wiring was completed on Second Street at the cost of $1,068,657.
Design work started on the Monticello Avenue Multiuse Trail project, a 4,200-foot-long lighted facility running from the William & Mary School of Education to Ironbound Road.
The Prince George Parking Garage was updated with new parking software, garage hardware, and tracking system, allowing gateless entry and exit. In FY19, $165,780 was expended, and $97,200 carried forward to FY20 for additional improvements.
A total of $7,913,834 was expended on capital projects during FY19, including $1,797,680 for the City’s share of school capital improvements.
As of June 30, 2019, the Capital Improvement Fund Plan had a fund balance of $29.7M, with $13.5M restricted in bond funds (new fire station and police station renovations) and $13.2M assigned for future capital projects.
FY 2020 - General Fund revenues outperformed FY19 in all categories of revenue through February of 2020. In mid-March, COVID-19 restrictions required limited commercial activity. By year-end, total operating revenue in the General Fund was about $1.5M less compared to operating revenue for FY19. The City’s tourism-based revenues were hit the hardest, with the decreases in meals tax of $1.4M, lodging tax of $1M, and Business, Professional and Occupational Licenses of $156K. These decreases were offset by increases (compared to FY19) in Real Estate taxes of $652K, Building Permits of $182K, and Personal Property Taxes of $182K.
The Capital Improvement Fund had a reduction in Sales Tax revenue of $390K compared to FY19. During FY20, the Monticello Avenue Redesign Project was substantially completed, with $2.5M expended
in the current year and $1.7M carried forward to FY21 to complete the project and pay outstanding bills. This project redesigns Monticello Avenue to include three lanes, a two-way cycle track, a new traffic signal, and wide sidewalks with amenities such as bike racks and benches, for a total cost of $4.2M. The Monticello Avenue Multiuse Trail project was also completed. This project features a 4,200-foot-long lighted trail that runs from the entrance to William & Mary School of Education to Ironbound Road. In FY20, $800K was expended with $641K carried forward to FY21 for final invoices, for a total project cost of $1.6M. The demolition of a derelict hotel was also completed at the cost of $465K. School Capital Improvement Projects total $865K.
A total of $7M was expended on capital projects during FY20, and as of June 30, 2020, the Capital Improvement Fund had a fund balance of $26.6M. $13.7M of fund balance is restricted in bond funds for a new fire station, and $12.9M is assigned for future projects.
FY 2021 - Overall, FY21 General Fund revenues were $4.9M higher than FY20 due to the recognition of Coronavirus Aid, Relief, and Economic Security (CARES) funding of $2.6M and a $1.5M transfer to the General Fund from the Tourism Fund. The COVID-19 pandemic continued to impact the City’s revenue during FY21. The City has experienced decreases in the lodging tax of $535K, Business, Professional and Occupational Licenses of $469K, building permits of $197K, and EMS Recovery fees of $171K. These decreases were offset by increases (compared to FY20) in real estate taxes of $408K, and personal property taxes of $126K.
The Capital Improvement Plan Fund had a reduction in Sales Tax revenue of $390K compared to FY20. During FY21, the Monticello Avenue Redesign Project incurred $1.1M in costs. Repaving costs during FY21 were $691K, including $280K to resurface historic streets. The Monticello Avenue Multiuse Trail project expended $593K during FY21. Public safety projects totaled $795K and included equipment and professional services costs to assist in determining options for a new fire station.
A total of $4M was expended on capital projects during FY21, and as of June 30, 2021, the Capital Improvement Fund had a fund balance of $26.8M. In the fund balance, $13.3M was restricted in bond funds for a new fire station, and $13.5M was assigned for future projects.
FY 2022 - Revenues in FY22 experienced a healthy increase as the City continued its economic recovery from the COVID-19 pandemic. Total General Fund revenues increased by $2.6M compared to FY21, with property taxes increasing by $1.6M or 10.3% with a tax rate increase of 4 cents per $100 value attributing to a portion of the increase. Personal property tax increased by $167K or 5.2% over FY21. Other local taxes, including meal and lodging tax, increased by 42.3% or $4.6M higher than FY22. By comparison, in FY21, there was one-time revenue of $2.6M for the recognition of CARES funding and a $1.5M transfer to the General Fund from the Tourism Fund.
The Capital Improvement Fund had an increase in Sales Tax revenue of 8.7% or $386K compared to FY21. During FY22, work for the fire station was under construction and $2.9M was spent; the new police station spent $716K. The Capitol Landing Road

Redesign Project incurred $277K in costs. Repaving costs during FY 2021 were $877K. Public safety projects totaled $795K and included equipment and professional services costs to assist in determining options for a new fire station.
A total of $6.8M was expended on capital projects during FY22 and as of June 30, 2022, the Capital Improvement Fund had a fund balance of $35.1M. In the fund balance, $3.4M was nonspendable land, $11.0M was restricted in bond funds for a new fire station, and $20.7M was assigned for future projects.
FY 2023 - Revenues continued a healthy trend in FY23. General Fund operating revenues increased by $5.3M compared with FY22. A strong housing market during FY23 and new construction contributed to increased assessed values and an increase of $2M in current real estate revenue compared with FY22. Other significant increased revenues, as compared with FY22, were $955K in meal taxes, $402K in personal property taxes, $372K in public safety grants, $363K in lodging taxes, $302K in state revenue for street maintenance, $236K for Utility Fund overhead, $137K in FEMA reimbursement; and $102K in building permits.
The Capital Improvement had an increase in sales tax revenue of $875K, or 18%, compared with FY22. Interest income for the year was $2.0M, an increase of 17% compared with FY22. Of the interest earnings, $1.3M was available to fund any projects in the adopted plan, and $700K was available to fund projects funded by bond funds or to pay down the debt.
A total of $17.7M was expended on capital projects during FY23. Major project expenditures during the year included $9.9M for the new fire station, $1.2M in repaving projects, $755K toward the vehicle replacement plan, $605K for school Capital Improvement Projects, and $583K for the new police station. In addition, $1.5M for debt service payments was expended.
FY 2024 - The healthy revenue trend continued in FY24, with General Fund operating revenues increasing by $2.6M, a 5.6% increase compared with FY23 and $2.4M more than the adopted budget. The increase was primarily due to real estate tax revenue increase of $2.4M; personal property increase of $479K; and Business, Professional, and Occupational License (BPOS) tax increase of $422K. These increases were offset by other revenue variances, resulting in a net decrease of $700K, with the most significant being the decrease in miscellaneous revenue of $438K.
The Capital Improvement Fund had an increase in sales tax revenue of $875K, or 4%, compared with FY23. Interest income for the year was $2.3M, a 15.8% increase compared with FY23.
A total of $19.9M was expended in the Capital Improvement Fund during FY24, with $17M expended on projects and $2.9M for debt service payments.
Major project expenditures during the year included $4.0M in street construction, $3.1M for the new police station, $3.3M for the new fire station, $1.3M for schools capital improvement projects, and $794K in maintenance software costs.

Note: Governmental Funds include General, Capital Improvement Plan Fund, and Special Revenue Funds
Source: City of Williamsburg Annual Comprehensive Financial Reports
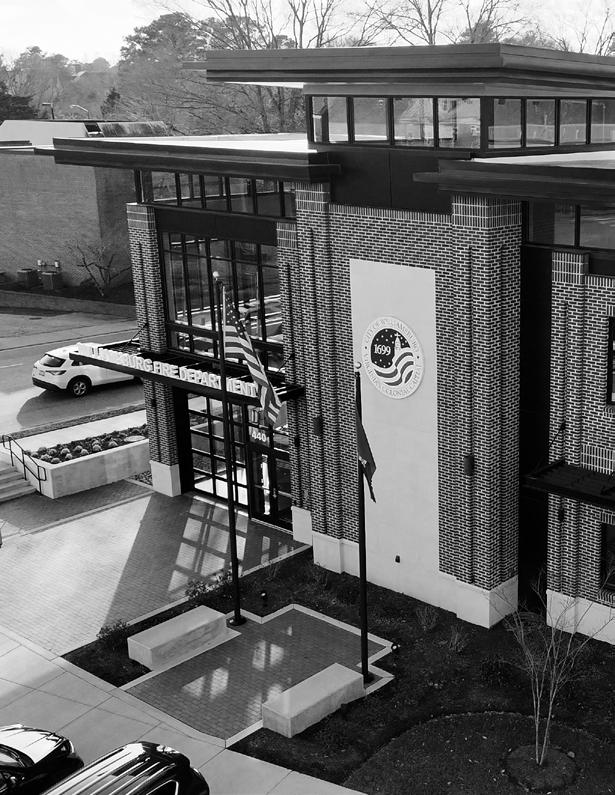

0011101 CITY COUNCIL
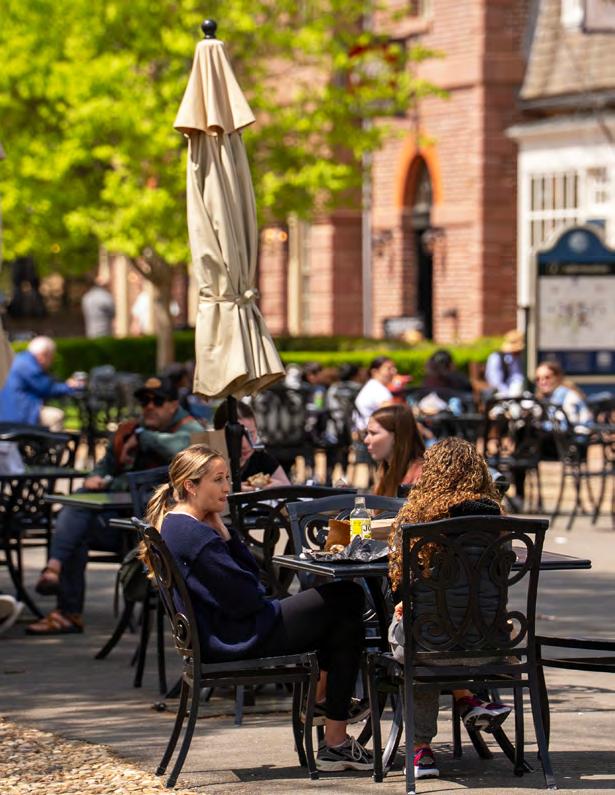
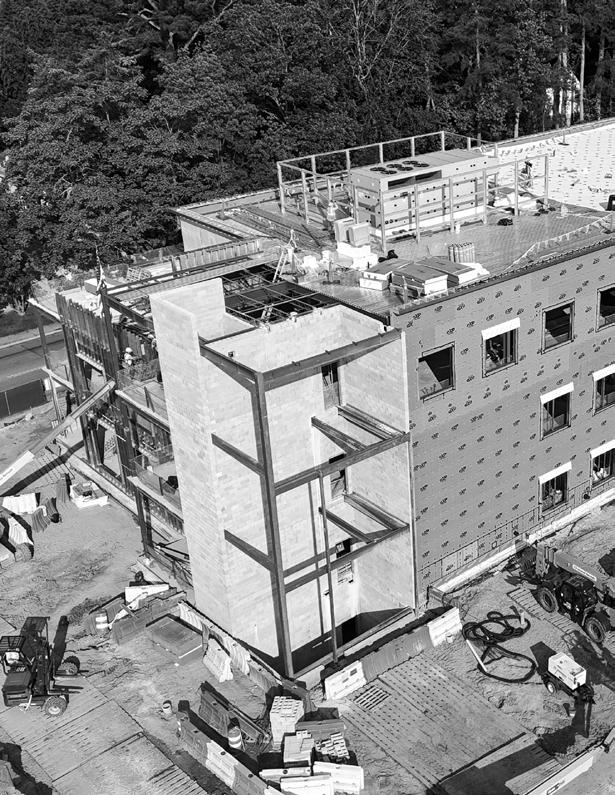

The capital improvement projects of the City of Williamsburg are administered through two funds: the Capital Improvement Plan Funds (CIP) (formerly Sales Tax Fund) for general improvements, and the Utility Fund for water and sewer projects. The City plans capital projects for five years, with the current year's projects funded by City Council and the remaining four years shown for planning purposes only. At year-end, the funding for any uncompleted project is encumbered as necessary and presumed to be finished in the next fiscal year.
Revenues of the CIP Fund are derived from the 1% Sales Tax that is collected and distributed monthly by the state. All taxable purchases in the Hampton Roads area of Virginia are charged at the rate of 6%, 1% of which is returned to localities by law. It has been the policy of the City Council for over 30 years to use this revenue to fund general capital projects in the City. Examples of projects completed with the use of these funds are schools, municipal buildings, land acquisitions, roads, vehicles, and equipment.
Interest earnings of the General Fund are accounted for in the CIP Fund. In the past, extreme changes in interest rates caused significant swings in these revenues, which in turn distorted the operating budget. This approach helps stabilize operations for comparison each year. The City’s annual paving program is included as a capital expenditure in this fund because of its capital nature and to minimize the skewing effect on operations over time.
Revenues of the Utility Fund are used to fund capital improvements, as well as operating costs, for the water and sewer systems.
Capital project detail sheets include a reference to one or more of City Council’s goal areas that the project supports.
- Federal Funding - (HSIPFlashing Yellow Arrow)
- Comm. Develop Funding (African American Heritage Trail)
Outside Funding (African American Heritage Trail)
of VA - Four-for-Life Grant (EMS Training &
(CONTINUED)
This project represents the City’s contribution to various capital expenditures for the WilliamsburgJames City County Public Schools. These estimates are based on the school system’s CIP. The City’s share of these expenses is estimated at 10.53% of the Fiscal Year 2025 total as stipulated in the current funding agreement between James City County and the City. The remaining funds for any projects not completed at fiscal year-end are carried forward to the following year.
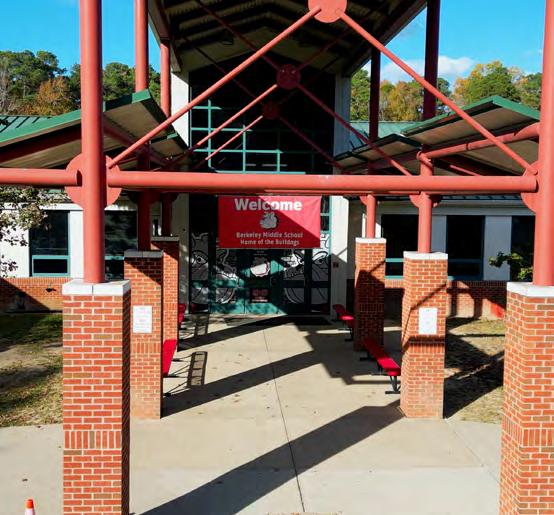


YEAR INTRODUCED: FY 2020
RELATED CITY COUNCIL GOAL: #3 Innovating a Modern City
The City includes funding in the CIP for repaving urban secondary roads, as needed. Streets are selected based on an annual street survey conducted by the Public Works Department. Approximately $350,000 is budgeted in Fiscal Year 2026 with increases biannually for inflation so all streets are repaved on a rotating basis every 10 to 20 years dependent on traffic volumes and general conditions. The City applied for $1,500,000 in Virginia Department of Transportation State of Good Repair (SGR) funds for the resurfacing of Jamestown Road from College Corner to Mill Neck Road, as well as York Street from Page Street to the corporate limits near Quarterpath Road. Paving fabric is proposed for the overlay to alleviate reflective cracking at the joints. The City applied for $2,000,000 in additional SGR funds in FY25 for resurfacing segments of Richmond Road, from High Street to Governor Berkeley Road.
The completion of the work will not have a direct fiscal impact beyond the associated costs. Repaving reduces long-term fiscal impacts as preventative maintenance reduces more considerable reactive maintenance expenses.
YEAR INTRODUCED: FY 2020
RELATED CITY COUNCIL GOAL: #3 Innovating a Modern City

In 2018, Colonial Williamsburg requested a modification of the Historic Area Streets agreement whereby the City would again maintain all the pavements within the Historic Area starting in July 2019. It had been many years since the pavements were last resurfaced, and wear from weather and heavy use combined with various repairs have culminated in a surface that does not fit with the surrounding area and atmosphere that visitors have come to expect. This ongoing project saw all streets in the Historic area resurfaced in 2022.
This is a multi-year project focusing on infrastructure repairs and refurbishments in the oldest section of the City. Improvements will be incorporated to best blend with the historic nature of Colonial Williamsburg but will also focus on long-term durability, accessibility, and affordability. COST ESTIMATE
There is no direct fiscal impact beyond the initial capital outlay. Resurfacing reduces long-term fiscal impacts because preventative maintenance reduces larger reactive maintenance and repair expenses.

YEAR INTRODUCED: FY 2023
RELATED CITY COUNCIL GOAL: #2 Courageously Leading
RELATED INITIATIVE: Carbon Emission Reduction
In the third round of Smart Scale funding conducted in 2018, City Council endorsed and requested Public Works to apply for funds to convert the existing signalized intersection of Monticello Ave./Richmond Rd./ Lafayette Street into a one- or two-lane roundabout. This project was originally envisioned in a study of the Monticello Avenue corridor prior to the development of Midtown Row and is to serve as the eastern anchor to the corridor. During the application, a safety analysis was conducted and the roundabout shows a marked decrease in injuries and property damage over the current signalized intersection while also providing improved throughput for traffic flow. Funding was granted by the Commonwealth Transportation Board in 2019 in the Six-Year Improvement Plan (SYIP). The $6,381,090 is 100% federal Smart Scale funds from VDOT with no local match required. COST ESTIMATE
The fiscal impact from this project will be nominal. Despite adding pavement, sidewalks, and streetlights, there is a small annual savings from removing the traffic signal. The traveling public will receive savings as idle time is reduced with a roundabout versus a traffic signal.
YEAR INTRODUCED: FY 2020
RELATED CITY COUNCIL GOAL: #2 Courageously Leading
RELATED INITIATIVE:
Smart City Initiatives / Carbon Emission Reduction
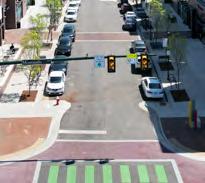
The City is planning to upgrade signal detection systems in FY25 and FY26 at a cost of $250,000 and to fully replace the Scotland Street and Richmond Road signals in FY27 at a cost of $450,000 as part of a 30to 40-year life cycle based on use and general condition.
The City also applied for and was awarded Smart Scale funding in FY24 and FY25 for Pedestrian Improvements and Signal Optimization for two corridors: Richmond Road ($203,500) and Lafayette Street ($91,000). This funding is 100% federal dollars and will install or upgrade pedestrian signals on a limited basis and provide for synchronization of the traffic signals for improved progression during peak and offpeak hours. This project began the design phase in FY24. COST
There is no direct fiscal impact beyond the initial capital outlay since no new signals are proposed. Improvements in traffic operations result in reduced travel time delays and energy savings for the users of the transportation network.
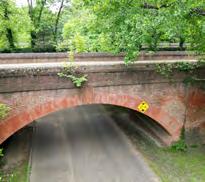
YEAR INTRODUCED: FY 2020
RELATED CITY COUNCIL GOAL: #3 Innovating a Modern City
This project includes federally required biennial inspections in even-numbered fiscal years ($20,000 with 10% increases for each biennium) for five bridges and one large box culvert. They are located along Page Street, Capitol Landing Road, Merrimac Trail, Bypass Road, Quarterpath Road, and South Henry Street.
The completion of the work will not have a direct fiscal impact beyond the cost of completion due to improved reliability and reduced maintenance costs.
YEAR INTRODUCED: FY 2017
RELATED CITY COUNCIL GOAL: #3 Innovating a Modern City
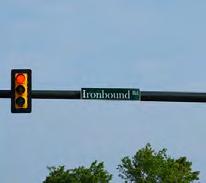
Ironbound Road Improvements are divided into three phases. Phase I included the redesign of the Longhill Road intersection and the relocation of Longhill Road. This phase was completed in FY19.
Phases II & III of the Ironbound Road project will be completed concurrently due to available funding. The combined project includes the redesign and widening from Middle Street to Depue Drive. The planned improvement includes a roadway with three lanes, pedestrian/bicycle improvements, streetlights, underground wiring, and the creation of dual left turn lanes at the Richmond Road intersection. The project also includes coordination of the traffic signals at Richmond Road, Longhill Road, and Treyburn Drive. This project will be completely funded through the VDOT federal-aid Smart Scale program for a total cost of $5,235,100 in FY24-FY26.
COST ESTIMATE
The fiscal impact from these projects will be negligible. Despite adding pavement and additional lanes, increased maintenance and revenue will be minimal.

YEAR INTRODUCED: FY 2020
RELATED CITY COUNCIL GOAL: #3 Innovating a Modern City
This project will widen the roadway from south of Wythe Avenue to north of Bacon Avenue to provide wider travel lanes (increasing from 9 ft. to 11 ft.) and meet standards for a minor arterial. It will also maintain on-street parking on the east side of the street, widen the sidewalk on the west side, add a shared-use path on the east side to connect to the Municipal Building, underground the utilities, and install new streetlights. The Arts District sidewalk project from previous CIPs is combined with this project for a total budget of $6,145,000 through FY26. The City was awarded $4,329,000 in VDOT federalaid Smart Scale funding beginning in FY24. The remaining costs ($1,816,000) will be from local funds to pay for underground wiring and utility betterments. Costs in FY24-FY25 are to begin design and utility relocations in anticipation of construction in FY26.
COST ESTIMATE
The fiscal impact from this project will be negligible. Despite adding pavement, sidewalks, and streetlights, increased maintenance and revenue will be minimal.
YEAR INTRODUCED: FY 2020
RELATED CITY COUNCIL GOAL: #2 Courageously Leading
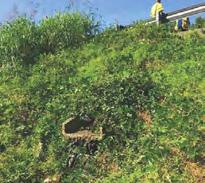
The roadway embankment at the corporate limit with York County on Merrimac Trail is eroding from a storm drainage inlet outfall. The project will extend and repair the storm sewer and discharge it lower on the slope to the existing stream channel while dissipating the energy. The embankment will then be regraded to a uniform slope and permanently stabilized with vegetative cover.
The City applied in 2023 for a grant from VDOT state-aid Revenue Sharing funds for FY27-28. The total cost of $600,240 is a 50% State, 50% City distribution. Design would begin in late summer 2026 with construction in late summer 2027.
COST ESTIMATE
Beyond the costs of construction, this project will not have a fiscal impact. The additional maintenance costs will likely be negligible.
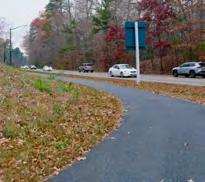
YEAR INTRODUCED: FY 2019 (Title & Scope Change in 2021)
RELATED CITY COUNCIL GOAL: #6 Connecting with the World
RELATED INITIATIVE: Trail757
The Planning Commission has encouraged the construction of a 1.5 mile± multi-use path connecting John Tyler Lane and the Strawberry Plains residential area. The GIOs call for the consideration of a shared-use facility along Strawberry Plains Road, John Tyler Lane, Jamestown Road, and Richmond Road that would form a loop with the recently completed Monticello Avenue trail. In FY22, a study was performed to aid in developing a funding application through the VDOT Transportation Alternatives (TA) Set-Aside program to fund Phase 2 of this loop from Berkeley Middle School on Ironbound Road to Berkeley Lane at John Tyler Lane. TA Set-Aside funding provides 80% in federal matching dollars up to $2.5M. The current estimated cost for this section is $3,277,597 with an anticipated design start date in 2023 and construction completion in 2027. The City was awarded $585,926 in federal TA Set-Aside funds in 2022 and received the remaining funding in Fall 2023. Costs previously allocated in FY23 ($317,650 FY23 + 5,918 FY22) are to begin design, property acquisitions/agreements, and utility relocations in anticipation of construction in FY25-FY26.
COST ESTIMATE
Beyond the capital costs of the construction, this project’s long-term fiscal impact is minimal other than routine pavement maintenance.
YEAR INTRODUCED: FY 2020
RELATED CITY COUNCIL GOAL: #6 Connecting with the World
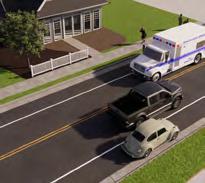
These two projects are combined to facilitate the work and value due to volume pricing as well as to take advantage of the VDOT Revenue Sharing program to leverage City funds. The Newport Avenue project will install a sidewalk along one side of Newport Avenue between Griffin Avenue and South Boundary Street. The sidewalk will not only provide for a neighborhood-requested pedestrian improvement but will also add a deterrent to cut-thru vehicular traffic by narrowing the street and slowing speeds. For FY23, $100,000 was programmed to saw-cut the existing pavement; install new curb, gutter, and entrances; and construct the new sidewalk.
The South Henry Street sidewalk extension runs about 2,200 feet, beginning at College Landing Park and continuing to the entrance of The Oaks subdivision. The sidewalk will provide pedestrian access from The Oaks subdivision into the downtown area of the City. In FY23, $50,000 was included to determine routing and design documents and an additional $124,500 was added in FY24. The City applied for FY27-28 Revenue Sharing funding for the remaining dollars for construction. The total project cost is $886,400.
The fiscal impact from this project will be negligible. Despite adding sidewalks, increased maintenance and revenue will be offset by the decrease in the existing pavement width.
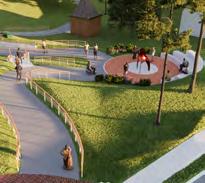
YEAR INTRODUCED: FY 2024
RELATED CITY COUNCIL GOAL: #1 One Williamsburg
RELATED INITIATIVE: African American Heritage Trail / 250th Commemoration
The proposed project is an approximately 2.3-mile-long marked pathway to connect various sites of historic and cultural importance to the African American community within the City of Williamsburg. African Americans have been part of Williamsburg's history since the City’s founding in 1699. Two of the oldest sites on the trail are the 1760 Williamsburg Bray School and the 1776 First Baptist Church, but more modern sites such as the Blayton Building and the memorial to Reverend Dr. Martin Luther King Jr. are also included to tell the whole story. The trail will have interpretive sites including signage, as well as lighting, ADA accessibility, and seating areas along the route. The total cost of the project is estimated at $2,748,900. The Phase 1 cost is $450,600 and includes Segment A, which starts at a trailhead across from the Municipal Building at Lafayette Street and Virginia Avenue. A 10-foot wide asphalt trail then runs cross-country through 'Harris Bottom' to eventually emerge adjacent to First Baptist Church and the Blayton Building at the intersection of Scotland and Prince George streets. The phase also includes the conversion of the unused 1933 Pump Station #1 building at the trailhead into a unisex comfort station, or public restroom.
COST ESTIMATE
The trail will expand the City’s heritage tourism, attracting visitors and residents from diverse cultural backgrounds. This will increase foot traffic downtown, leading to immediate and long-term growth in sales, meals, and room tax revenue. The project includes about 2,150 feet of new sidewalk and a public restroom, both requiring maintenance.
YEAR INTRODUCED: FY 2025
RELATED CITY COUNCIL GOAL: #6 Connecting with the World

This project involves installing a new sidewalk to connect existing sidewalks on Merrimac Trail. This will provide a safer route for pedestrian traffic on the road. Due to the topography, some significant filling and grading will be required to address steep slopes along the intended path. We anticipate design starting in FY27 with construction taking place in FY28. The total project cost is $315,000. COST ESTIMATE
SOURCES
IMPACTS
IMPACT SUMMARY:
The fiscal impact from this project will be negligible. Despite adding sidewalks, increased maintenance and revenue will be offset by the decrease in the existing pavement width.
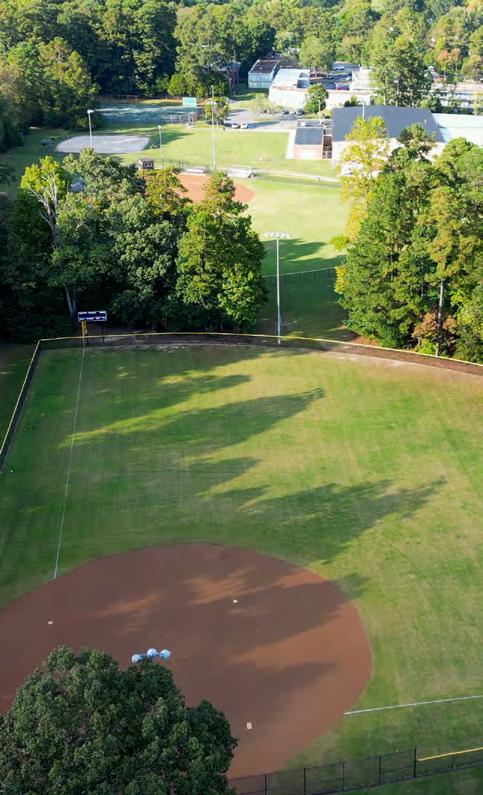
YEAR INTRODUCED: FY 2025
RELATED CITY COUNCIL GOAL: #4 Prioritizing Safety & Wellness
RELATED INITIATIVE: Enhance Existing Park Facilities
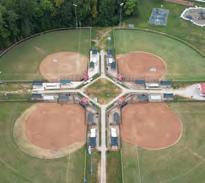
To improve the safety of our youth softball fields, warning tracks will be installed. These tracks are designed to provide athletes with a three-step warning when they are close to the edge of the field and approaching the fence. This 10-foot safety component will be installed around the perimeter of each softball field at Kiwanis Park. The warning track surface will be the same infield mix blend currently used.
The staff time and resources of mowing and weeding the fence lines will now transition into grooming and maintaining the warning tracks, resulting in an even trade of time and resources. This project should minimize the risk of injury which will minimize the number of insurance claims.
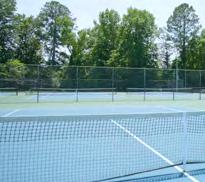
YEAR INTRODUCED: FY 2021
RELATED CITY COUNCIL GOAL: #4 Prioritizing Safety & Wellness
RELATED INITIATIVES: Enhance Existing Park Facilities
The Kiwanis Park tennis courts were constructed in 1973 and have exceeded their lifespan. The courts require a rebuild, otherwise crack repairs will need to occur every six to eight months.
There will not be a fiscal impact due to this project.
YEAR INTRODUCED: FY 2025
RELATED CITY COUNCIL GOAL: #4 Prioritizing Safety & Wellness
RELATED INITIATIVE: Enhance Existing Park Facilities

To improve the safety of the adult softball fields, warning tracks will be installed. These tracks are designed to provide athletes with a three-step warning when they are close to the edge of the field and approaching the fence. These 10-foot safety components will be installed around the perimeter of each softball field. The warning track surface will be the same infield mix blend that is currently used.
The staff time and resources of mowing and weeding the fence lines will now transition into grooming and maintaining the warning tracks, resulting in an even trade of time and resources. This project should minimize the risk of injury which will minimize the number of insurance claims.
YEAR INTRODUCED: FY 2025
RELATED CITY COUNCIL GOAL: #4 Prioritizing Safety & Wellness
RELATED INITIATIVE: Enhance Existing Park Facilities/Public Restrooms
Smart, self-cleaning public restrooms will replace the current port-a-johns located between softball fields #2 and #3 at Quarterpath Park. This modular restroom facility offers remote access control, automated cleanings, graffiti-resistant surfaces, and is ADA-compliant. This structure will house two family bathrooms and is approximately 9'x22'. The completion of this project would satisfy one of two public bathrooms as outlined in the GIOs.
This project will incur utility expenses but, as a self-cleaning operation, will result in significant staff savings. It is estimated there will be a water consumption savings of 9 liters per flush, and 3,720 liters per month related to cleaning when compared to a traditional restroom.
YEAR INTRODUCED: FY 2021
RELATED CITY COUNCIL GOAL: #4 Prioritizing Safety & Wellness
RELATED INITIATIVE: Enhance Existing Park Facilities

To become ADA compliant the walkways at Quarterpath Park (from parking lot to softball fields, playground, and shelter) need to be paved. This project was first introduced in FY21 but was put on hold until the location of the regional sports center was determined. The price for this project has since increased by $30,000.
There is no additional fiscal impact from this project.

YEAR INTRODUCED: FY 2023
RELATED CITY COUNCIL GOAL: #4 Prioritizing Safety & Wellness
RELATED INITIATIVE: Enhance Existing Park Facilities
The bathrooms at the Quarterpath Recreation Center are showing their age and should be renovated. The floors, walls, partitions, and countertops are stained; tiles are beginning to crack; and tile colors should be updated. The renovation will include fixtures, partitions, countertops, and tiles.
Replacing all fixtures should reduce maintenance calls to the Facilities Division for service. Estimated staff savings is $1,800 annually.
YEAR INTRODUCED: FY 2024
RELATED CITY COUNCIL GOAL: #4 Prioritizing Safety & Wellness
RELATED INITIATIVE: Enhance Existing Park Facilities
The current trash cans at Quarterpath Park should be replaced with a more functional receptacle that is graffiti-resistant and has an enclosed lid. This will help prevent wild animals rummaging in the trash cans and scattering litter. Transitioning to a uniform can will also allow them to be interchangeable with the other parks. To outfit the park, 35 trash cans with lids are needed.
Upgrading trash cans will reduce the staff time needed to clean up excess litter around the receptacles. Estimated staff savings is $988 annually.

YEAR INTRODUCED: FY 2024
RELATED CITY COUNCIL GOAL: #4 Prioritizing Safety & Wellness
RELATED INITIATIVE: Enhance Existing Park Facilities
To improve ADA accessibility, the Waller Mill Park Shelter #4 parking lot should be paved to include designated handicap parking spaces.
The shelter parking lot will need to be striped every three to five years, as needed, and will be included when the main lot is serviced. Estimated cost $3,000 every three to five years.
YEAR INTRODUCED: FY 2025
RELATED CITY COUNCIL GOAL: #4 Prioritizing Safety & Wellness
RELATED INITIATIVE: Enhance Existing Park Facilities
Waller Mill Park will transform into a revitalized park with more opportunities for visitors to enjoy. To accommodate campground patrons, a restroom and shower facility will replace the existing port-a-johns located between shelters #2 and #3. This amenity consists of four family-style restroom units with a shower. Additionally, coin-operated/card reader laundry will be included. This 30'x24', vandal-resistant amenity is ADA-compliant and constructed with high-strength precast floors, walls, and roof.
This project will incur utility expenses, staffing, and supply costs.

YEAR INTRODUCED: FY 2021
RELATED CITY COUNCIL GOAL: #4 Prioritizing Safety & Wellness
RELATED INITIATIVE: Enhance Existing Park Facilities
The six pedal boats used as a rental amenity of Waller Mill Park need to be replaced.
There will not be an additional fiscal impact as a result of this project. Pedal boats are offered as a rental amenity; therefore, no additional staffing expenses would occur.
YEAR INTRODUCED: FY 2024
RELATED CITY COUNCIL GOAL: #4 Prioritizing Safety & Wellness
RELATED INITIATIVE: Enhance Existing Park Facilities

The bathrooms at Waller Mill Park, built in 2000, require an upgrade. Poor conditions include cracked tiles, stained countertops, sinks and toilets, and poor lighting.
Due to the poor operation of the bathrooms, Facilities staff is called for repairs monthly. New fixtures should alleviate the call volume for repair and free up time for other maintenance services. Estimated staff savings is $1,800 annually.

YEAR INTRODUCED: FY 2025
RELATED CITY COUNCIL GOAL: #4 Prioritizing Safety & Wellness
RELATED INITIATIVE: Enhance Existing Park Facilities
The current dirt shelter roadway at Waller Mill Park will be paved to allow for improved accessibility. Due to the volume of use of this roadway, it often contains excessive potholes that need constant maintenance. This project will also include paving the Shelter #3 parking lot.
The results of this project will reduce the repair costs for filling in potholes.
YEAR INTRODUCED: FY 2023
RELATED CITY COUNCIL GOAL: #4 Prioritizing Safety & Wellness
RELATED INITIATIVE: Enhance Existing Park Facilities

The fleet of jon boats at Waller Mill Park is more than 40 years old and has exceeded its life expectancy. The fleet is currently down to 10 boats from 15. This request will replace the existing boats and bring the fleet back up to 15.
There is no additional fiscal impact from these projects. Jon boats are currently offered as a rental amenity; therefore, no additional staffing expenses would occur.
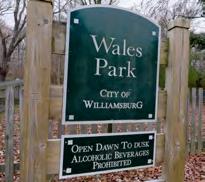
YEAR INTRODUCED: FY 2022
RELATED CITY COUNCIL GOAL: #4 Prioritizing Safety & Wellness
RELATED INITIATIVE: Enhancing Existing Park Facilities
The playground and fence at the Wales subdivision will be replaced.
There is no additional fiscal impact as a result of this project.
YEAR INTRODUCED: FY 2022
RELATED CITY COUNCIL GOAL: #4 Prioritizing Safety & Wellness
RELATED INITIATIVE: Shoreline Access

The stationary canoe/kayak launch at College Landing Park will be replaced by a functional ADAcompliant launch with an accessible pathway. Additionally, a self-service kayak kiosk station will be installed. This amenity houses four kayaks, paddles, and life preservers for park visitors to rent at their leisure. This revenue-generating amenity is planned as a 50% profit share with Rent-it-Fun.
The kayak rental station, a new revenue stream, is a 50% profit share with the rental company.

YEAR INTRODUCED: FY 2026
RELATED CITY COUNCIL GOAL: #3 Innovating a Modern City
A mobile storage and operations unit is needed for the Williamsburg Farmers Market to improve efficiency and streamline setup and breakdown procedures. This custom unit will not only provide proper storage, but it will allow staff to directly manage market operations on-site. Additionally, it will provide a much needed climate-controlled environment for staff during inclement weather as the market transitions to a year-round opportunity. The trailer will be custom wrapped and branded as the City of Williamsburg Farmers Market.
This unit will reduce staff time for market operations setup and breakdown and reduce the risk of injury. There will be minimal costs associated with basic trailer maintenance and annual inspections.
YEAR INTRODUCED: FY 2022
RELATED CITY COUNCIL GOAL: #4 Prioritizing Safety & Wellness
RELATED INITIATIVE: Enhance Existing Park Facilities
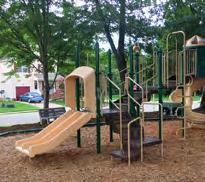
Originally installed in 2007, the Strawberry Plains Park playground and amenities will be replaced with innovative play structures and provide an ADA-compliant accessible route.
There is no additional fiscal impact for this project.
YEAR INTRODUCED: FY 2023
RELATED CITY COUNCIL GOAL: #4 Prioritizing Safety & Wellness
RELATED INITIATIVE: Enhance Existing Park Facilities
Redoubt Park's paved walkway from the parking lot to Redoubt #1 is in need of repair due to tree root damage and wear. This has caused numerous wide cracks that will continue to spread if not repaired. Due to the quantity of repairs, it will be more beneficial to do a complete repave ($85,000). This walkway was originally installed in 2007. As part of this project, grass parking at Redoubt Park will be converted into paved parking, and existing parking spaces introduced in FY23 ($20,000) will be restriped. These projects have been combined to allow for the use of a single contractor and to minimize mobilization.
There will be no additional fiscal impact as a result of this project.
YEAR INTRODUCED: FY 2024
RELATED CITY COUNCIL GOAL: #4 Prioritizing Safety & Wellness
RELATED INITIATIVE: Enhance Existing Park Facilities

The trash cans in the parks system (Redoubt, Strawberry Plains, College Landing, Highland, Bicentennial, Geddy, and Wales) will be replaced with more functional receptacles that are graffiti-resistant and have covered lids to prevent rain water collection and deter wild animals.
Upgrading trash cans will reduce the staff time needed to clean up excess litter around the receptacles. Estimated staff savings is $494 annually.

YEAR INTRODUCED: FY 2025
RELATED CITY COUNCIL GOAL: #4 Prioritizing Safety & Wellness

Approximately 50% of the radios in the Williamsburg Police Department are 20 years old. This funding will allow replacement with up-to-date devices.
All officers will have the most modern portable radios available to ensure their safety.

YEAR INTRODUCED: FY 2017
RELATED CITY COUNCIL GOAL: #5 Engaging with our Partners
City Council approved the consolidation of the Public Safety Answering Point (PSAP) with York County in February 2009. The consolidation required an expansion of the PSAP in York County. The City supported costs of that renovation equal to an annual debt service of $45,000 in each fiscal year of CIP. At the time, the estimated City savings due to the consolidation equaled approximately $200,000 annually.
COST ESTIMATE
IMPACTS
The completion of the work will not have a direct fiscal impact beyond the cost of completion due to improved reliability and efficiency of any new improvements, including equipment.
YEAR INTRODUCED: FY 2017
RELATED CITY COUNCIL GOAL: #4 Prioritizing

Use of this funding is limited to EMS training and equipment, and it is reported annually to the Virginia Office of Emergency Medical Services. This funding is primarily used to support EMT-Paramedic training and Advanced Cardiac Life Support training, and to replace EMS equipment and supplies used on a daily basis. The majority of FY25 funding will be utilized to enhance training opportunities for Advanced Life Support providers and equipment. The anticipated expense in each future fiscal year accommodates annual paramedic training and daily EMS supplies.
The availability of grant funds for EMS equipment and training reduces expenditures in the Fire Department operating budget each year, as these are essential to operations.

YEAR INTRODUCED: FY 2023
RELATED CITY COUNCIL GOAL: #4 Prioritizing Safety & Wellness
The generator at Quarterpath Recreation Center is nearing its useful life expectancy. Repair and maintenance costs continue to increase, and a long-term replacement plan is necessary. The $70,000 cost proposed in FY26 is for a 150kW Natural Gas Generator. Grants are available to help offset the cost of the generator. Currently, the plan will be to apply for two grant cycles to reduce the expense of the generator replacement. If the grant applications are unsuccessful, sales tax revenue is committed in FY26.
COST ESTIMATE
SUMMARY:
The long-term impact will be reduced maintenance and repair. Also, switching from diesel to natural gas will make the unit more efficient in terms of maintenance, fuel supply, and planning efforts.
YEAR INTRODUCED:
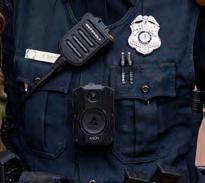
The Axon OSP7+ program includes additional GPS tracking and redaction features, as well as Axon’s Records, Citizen and Performance modules. These components increase the safety of the officers while ensuring the highest level of officer accountability. The administrative suite of features will increase personnel effectiveness and efficiency while ensuring FOIA compliance.
The use of non-lethal devices and body cameras may reduce legal liability for the department. The Commonwealth Attorney’s office needs additional staff to file, store, and review data recorded by the cameras. The City will incur its share of the cost to support two additional paralegals in the CA’s Office. The City’s share of the cost for FY26 is $22,889. A 2% increase in salary cost is assumed with each successive year.

YEAR INTRODUCED: FY 2021
RELATED CITY COUNCIL GOAL: #4 Prioritizing Safety & Wellness
RELATED INITIATIVE: Smart City Initiatives
While the mobile data terminals were replaced recently, they are recycled every five years to ensure continuity of the program. The cost of each unit is $7,000 and includes the hardware, software, and installation. Maintenance costs are $25 per month per unit, beginning after the one-year warranty expires.
FUNDING SOURCES
SUMMARY:
The annual maintenance costs associated with this project are $25 per month per unit, beginning after the one-year warranty expires.
YEAR INTRODUCED: FY 2021
RELATED CITY COUNCIL GOAL: #4 Prioritizing Safety & Wellness

The standard useful life for Motorola portable radios is approximately 10 to 15 years. The current inventory is older than 10 years. As the portable radios age, replacement parts will be more difficult to find. To maintain the proper life cycle of portable radios, replacement of approximately 84 units is planned for FY28.
The current radio equipment is included in the City's repair and maintenance contract with Motorola.

YEAR INTRODUCED: FY 2021
RELATED CITY COUNCIL GOAL: #4 Prioritizing Safety & Wellness
RELATED INITIATIVE: Smart City Initiatives
The WPD utilizes the Axon Fleet system in its police vehicles. This system is integrated into the Evidence Storage System for video storage and has proven to be more effective and efficient with lower costs. The Axon 3 system will provide more features to increase safety and accountability. This system includes a fully integrated Automatic License Plate Reader (ALPR) system, increasing effectiveness while reducing expense and simplifying systems. The rising costs from FY26 to FY30 are due to an increased number of patrol cars in the fleet that will require camera systems in the later years.
SOURCES
The inclusion of ALPRs in the new system will eliminate the need to purchase separate ALPR units and their associated maintenance fees, which amount to approximately $3,000/year. By comparison, to outfit each patrol car with an ALPR from the current ALPR vendor would require an initial investment of approximately $480,000 plus a maintenance fee of $36,000 per year.
YEAR INTRODUCED: FY 2021
RELATED CITY COUNCIL GOAL: #4 Prioritizing Safety & Wellness

Repairs to the firing range were initially funded in FY24; however, they cannot proceed until the Public Works Dam project commences. The second installation of funds is scheduled for FY26 with the third tranche in FY28.
There are no annual contract costs associated with this repair.
YEAR INTRODUCED: FY 2022
RELATED CITY COUNCIL GOAL: #4 Prioritizing Safety & Wellness
The Flock Safety ALPR system provides real-time actionable intelligence and evidence that increases case clearance rates. Since the system's initial deployment, the City has experienced numerous successes with the technology.
SOURCES
SUMMARY:
Staffing savings are realized from a decrease in the number of hours a detective or other investigating officer would be required to perform surveillance or other similar activity to develop a suspect. The Flock system can provide this data using a simple query.
YEAR INTRODUCED: FY 2022
RELATED CITY COUNCIL GOAL: #4 Prioritizing Safety & Wellness

The BolaWrap is a remote restraint device that deploys an 8-foot Kevlar tether to temporarily restrain subjects from a distance of 10 to 20 feet. This device will increase officer safety and reduce the likelihood of injury to persons who are aggressively resisting arrest.
There

YEAR INTRODUCED: FY 2025
RELATED CITY COUNCIL GOAL: #4 Prioritizing Safety & Wellness
Mobile Data Terminals (MDTs) are devices assigned to front-line apparatus that provide critical real-time information for responding personnel including access to several map layers to improve tactical decisions and general incident planning. Traditionally, the Fire Department has replaced MDTs as part of the vehicle replacement plan. MDTs are suggested to be replaced every four to five years. Over the next two fiscal years, four MDTs will need to be replaced.
Routine replacement of the MDTs according to the manufacturer and the 911 Center guidance helps minimize repair and maintenance needs to keep the MDT inventory operational. Additionally, the annual operating cost of the AirCard fees for the units is approximately $5,000.
YEAR INTRODUCED: FY 2022
RELATED CITY COUNCIL GOAL: #4 Prioritizing Safety & Wellness

SmartWater CSI uses an invisible solution to discreetly mark valuables, making them traceable back to the original owner in the event that they are stolen. This system could be deployed to members of the community most at risk of suffering losses from burglary or other larceny crimes. The City of Williamsburg could become known as a SmartWater community, and it is believed incidents of larceny would decrease. Funding would provide 200 kits for distribution within the community.
There is no fiscal impact beyond the fee for the program.

YEAR INTRODUCED: FY 2022
RELATED CITY COUNCIL GOAL: #4 Prioritizing Safety & Wellness
The protective plate inserts for Williamsburg Police Department's ballistic vests are recommended for replacement every five years. To ensure user safety while also meeting manufacturer recommendations, the plate inserts will need to be programmed to be replaced in FY28. Ballistic vests are important protective equipment for personnel when responding to active threats or other potentially dangerous incidents.
ESTIMATE
FUNDING SOURCES
FISCAL IMPACT
SUMMARY:
Some operating costs will be incurred to repair equipment as needed.
YEAR INTRODUCED: FY 2026
RELATED CITY COUNCIL GOAL: #4 Prioritizing Safety & Wellness

Glidescope is the Fire Department's preferred laryngoscope system. The GlideScope is critical for the airway management of patients requiring intervention and assistance. The department's current inventory is nearing its useful life and is in need of replacement.
Repair and maintenance of the equipment has an ongoing fiscal impact.

YEAR INTRODUCED: FY 2024
RELATED CITY COUNCIL GOAL: #4 Prioritizing Safety & Wellness
RELATED INITIATIVE: Internet Connectivity
By integrating live video, data, and sensor feeds from multiple existing sources, this project will significantly enhance situational awareness for officers responding to emergencies and establish a comprehensive archive of information to support criminal investigations. This cloud-based technology increases staff efficacy while enhancing the safety of officers and citizens.
SUMMARY:
There is no fiscal impact beyond the cost of the program.
YEAR INTRODUCED: FY 2026
RELATED CITY COUNCIL GOAL: #2 Courageously Leading

The Police Department has maintained decades of historical files in boxes at the Municipal Building. This project would involve a third-party vendor digitizing the files and destroying them, eliminating the need for further storage.
There are no financial impacts beyond the scope of the project.
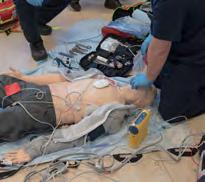
YEAR INTRODUCED: FY 2025
RELATED CITY COUNCIL GOAL: #4 Prioritizing Safety & Wellness
Several pieces of the City's EMS equipment are coming to the end of their useful life and will be due for replacement. This includes replacing stair chairs, which assist in moving patients up and down stairs as well as updating the City's inventory of Lucas devices, which are cardiopulmonary assist tools that perform chest compressions and are now considered the gold standard for resuscitation efforts.
SOURCES
FISCAL IMPACT
SUMMARY:
Equipment purchased is included in the Fire Department's annual repair and maintenance contract with the vendor.
YEAR INTRODUCED: FY 2025

The Fire Department conducts annual work performance evaluations (WPE) to assess the physical fitness level of all career firefighters. WPEs are currently conducted at James City County Station 22. Since Station 22 is scheduled for demolition, it is necessary to develop the capability to conduct WPE independently. This project supports that transition by funding the purchase of additional replacement gym equipment used to prepare firefighters for the evaluation.
The fiscal impact of this equipment will be minimal, and the expenses shown are for any repair and maintenance needs that may occur from use.
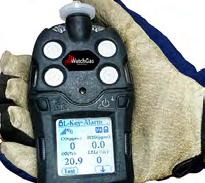
YEAR INTRODUCED: FY 2025
RELATED CITY COUNCIL GOAL: #4 Prioritizing Safety & Wellness
The inventory of four-gas monitors is nearing useful life. The cost to repair the recently damaged monitors is comparable to the price of purchasing new units. In an effort to improve the Fire Department’s gas monitor, the plan is to move from a four-gas monitor to a five-gas monitor. The five-gas monitor is more sensitive and is capable of recognizing a larger range of gases, improving incident outcomes and firefighter safety. In addition, the aging inventory of carbon monoxide monitors will be replaced. These monitors are used on all department EMS bags and help detect environments with high carbon monoxide levels, greatly improving firefighter safety and awareness.
Purchase of the units includes a full three-year warranty that will cover repair and maintenance.
YEAR INTRODUCED: FY 2025
RELATED CITY COUNCIL GOAL: #4 Prioritizing Safety & Wellness

The current inventory of 10 Panasonic Toughbooks are coming to the end of their useful life. They were purchased in 2020 with a life expectancy of five years. They need to be replaced in FY26. These computers are used to capture EMS report documentation, which is directly tied to EMS billing and revenue recovery.
Once purchased, the computers come with a three-year warranty for repair and maintenance. In FY29, the warranty will be extended for one year.

YEAR INTRODUCED: FY 2017
RELATED CITY COUNCIL GOAL: #4 Prioritizing Safety & Wellness
This project consists of Aid to Localities funding and includes future funding estimated at $50,000 each year for the next four years. State code mandates specific use of these funds, with annual reporting to the Virginia Department of Fire Programs. While it is difficult to forecast specific fire equipment needs, types of equipment purchased with this funding include personal protective equipment, hoses, firefighting tools, and fire suppression foam.
COST ESTIMATE
FUNDING SOURCES
IMPACTS
SUMMARY:
The availability of grant funds for fire equipment reduces expenditures in the Fire Department operating budget each year, as these are essential to operations.
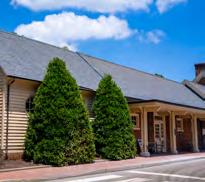
YEAR INTRODUCED: FY 2025
RELATED CITY COUNCIL GOAL: #3 Innovating a Modern City COST ESTIMATE
The approximately 1,350-square-foot storage space in the Williamsburg Transportation Center is currently being used as a workshop by the City's Facilities Maintenance Division. There are plans to build a new workshop in the Public Works Yard in FY26-FY27. Once vacated, Economic Development proposes converting this space to a leasable commercial unit, preferably for a cafe. The space could be leased to a long-term tenant or could be used as a retail incubator space managed by the Economic Development Authority. To achieve "vanilla box" status for the space, an estimated $250,000 will be required. This estimate includes $150,000 for a Contractor; $50,000 for Architecture, Engineering, Plumbing and HVAC; and $50,000 for finishing elements such as lighting, flooring and contingency. Estimates for these items were secured and verified by Public Works.
2026
2027
2028
SOURCES
In the immediate term, the fiscal impact is minimal beyond the costs for conversion. In the long term, the investment will create revenue.
YEAR INTRODUCED: FY 2023
RELATED CITY COUNCIL GOAL: #4 Prioritizing Safety & Wellness
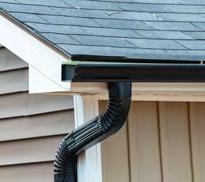
Beginning in FY24, the Williamsburg Redevelopment & Housing Authority has initiated a five-year plan to replace the roofs and gutters at all properties. The objective is to complete replacements at approximately four to six buildings per year.
This initiative includes the removal of aging three-tab shingle roofs, deteriorated plywood, and outdated gutter systems. The replacements will enhance the longterm integrity of the buildings by supporting preventative maintenance efforts, improving energy efficiency, and preserving property value.

YEAR INTRODUCED: FY 2026
RELATED CITY COUNCIL GOAL: #4 Prioritizing Safety & Wellness
The Williamsburg Redevelopment & Housing Authority seeks to replace the hot water tanks at all sites to maintain code compliance.
SOURCES
The Authority's ability to provide an energy-efficient hot water supply will reduce costs to tenants.
YEAR INTRODUCED: FY 2023
RELATED CITY COUNCIL GOAL: #4 Prioritizing Safety & Wellness
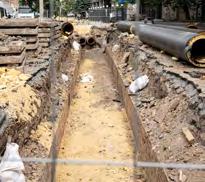
The Williamsburg Redevelopment & Housing Authority seeks to replace the sewer lines at all family sites that have been compromised. It is the Authority’s goal to replace 10 sewer lines per year.
FISCAL IMPACT SUMMARY:
The Authority’s ability to provide clean, decent, and safe housing at our sites has been impacted due to failing sewer lines. The Authority seeks to replace sewer lines that are blocked by tree roots or collapsed as a result of deterioration.

YEAR INTRODUCED: FY 2023
RELATED CITY COUNCIL GOAL: #4 Prioritizing Safety & Wellness
The Williamsburg Redevelopment & Housing Authority seeks to replace 10 HVAC units, including programmable thermostats, per year, until all 66 family site units have energy-efficient systems.
SOURCES
SUMMARY:
Due to the age of the current HVAC systems at the family sites, the units are in need of an upgrade, to make them more energy-efficient and reliable.
YEAR INTRODUCED: FY 2023
RELATED CITY COUNCIL GOAL: #4 Prioritizing Safety & Wellness
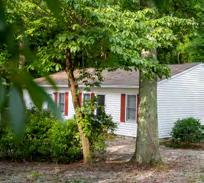
In an effort to provide workforce housing, there are 16 housing units that are utilized for City employees who meet the program requirements. The units are offered generally offered to employees who respond to emergencies so that the City derives a valuable benefit of having staff in close proximity to work. The funds requested will be used to renovate and maintain the housing units.
To support the long-term availability of affordable housing for City employees, the Authority continues to allocate for funding for ongoing maintenance of existing workforce housing units. In addition, planning and budgeting efforts are underway for the renovation of a newly acquired structure, which will accommodate two additional workforce housing units.
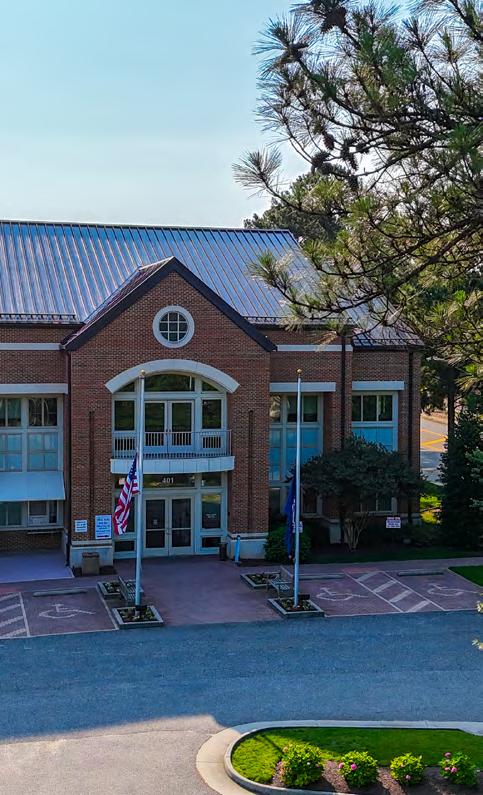
YEAR INTRODUCED: FY 2023
RELATED CITY COUNCIL GOAL: #2 Courageously Leading
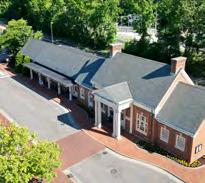
Maintains City buildings ensures a fresh and professional appearance for the City of Williamsburg's public image and presence in the community. Some repairs are required to maintain aging systems. In FY26, $190,000 is proposed for replacing the 20 custom interior doors and door frames that are in disrepair at the Transportation Center to allow for the installation of access control. The total cost of the doors is $100,000 and the cost for the electronic access control is $50,000. Additionally, $40,000 is budgeted for exterior repainting at the Transportation Center.
COST ESTIMATE
There is minimal fiscal impact other than the initial capital outlay for maintenance repairs and painting.
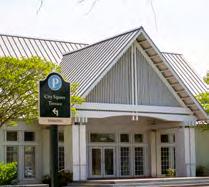
YEAR INTRODUCED: FY 2023
RELATED CITY COUNCIL GOAL: #4 Prioritizing Safety & Wellness
This project will provide for improved access control systems and improvements to enhance the Williamsburg Community Building's ability to operate in adverse conditions as well as improve the facility's appearance. In FY26, $100,000 is proposed for exterior door replacements. A diesel generator is proposed for installation at the building in FY27, at a cost of $150,000, to ensure reliable back-up power at a designated polling site. Door replacement in FY30 is a cost of $42,000.
IMPACTS
There is minimal fiscal impact other than the initial capital outlay for control software and equipment.
YEAR INTRODUCED: FY 2026
RELATED CITY COUNCIL GOAL: #3 Innovating a Modern City

This Public Works project involves seal coating the top level of the Prince George Parking Garage. Seal coating will prolong the life of the garage by helping keep moisture out of the concrete at all levels. A similar coating was applied to the parking terrace on Boundary Street yielded positive results.
The completion of the work will not have a direct fiscal impact beyond the cost of completion due to reduced maintenance costs, extending the life of the garage deck.
YEAR INTRODUCED: FY 2024
RELATED CITY COUNCIL GOAL: #3 Innovating a Modern City
This project involves removing and replacing the bearings in the pedestrian bridge at the City Square parking terrace on Boundary Street. Bridge bearings transfer the weight of the bridge deck (superstructure) to the supporting piers (substructure) while allowing for controlled movement, such as expansion and contraction from temperature changes. The bearings act as flexible connections that help prevent structural damage.
IMPACTS
The completion of the work will not have a direct fiscal impact beyond the cost of completion due to improved reliability and reduced maintenance costs.
YEAR INTRODUCED: FY 2026
RELATED CITY COUNCIL GOAL: #4 Prioritizing Safety & Wellness

In the Voter Registrar's office at the Municipal Building, a wall with service windows will be installed, mirroring the design seen at the Commisioner of the Revenue. The new barrier will enhance security for both Registrar staff and confidential information.
The completion of the work will not have a direct fiscal impact beyond the cost of completion.

YEAR INTRODUCED: FY 2026
RELATED CITY COUNCIL GOAL: #3 Innovating a Modern City
This project involves replacing City-owned street lights due to age and the difficulty of finding replacement parts. The City currently owns 150 street lights but will likely install more over time. For FY26 and FY27, $75,000 will cover the replacement of approximately 10% (15 units) per year.
SOURCES
The completion of the work will not have a direct fiscal impact beyond the cost of completion due to improved reliability and reduced maintenance costs.
YEAR INTRODUCED: FY 2024
RELATED CITY COUNCIL GOAL: #2 Courageously Leading
RELATED INITIATIVE: Carbon Emission Reduction

This project will provide for improved access to Electric Vehicle Charging Stations at public parking garages and parking lots. Upgrading existing EV charging stations on Level 2 and Level 3 is proposed in FY26.
FISCAL IMPACT SUMMARY:
It is anticipated that operating costs for the EV stations will increase due to the improved use but this cost could not be determined.

YEAR INTRODUCED: FY 2025
RELATED CITY COUNCIL GOAL: #3 Innovating a Modern City
RELATED INITIATIVE: Comprehensive Plan Update
This project involves the execution of a Comprehensive Plan that, upon delivery, recommends a Complete Streets Policy; considers the appropriateness of existing Architectural Review Board District boundaries; reviews opportunities for additional housing downtown, infill development, and two-story development requirements; identifies school planning concerns; includes a citywide pedestrian/bike plan that considers existing facility improvements, expansion of assets, and trail connectivity; and delivers a revised economic development strategic plan that emphasizes economic diversification, including opportunities for a Research Village as part of the megaregion that satisfies requirements of the Virginia Business Ready Sites Program.
The Code of Virginia mandates that all localities review their Comprehensive Plan every five years. The City’s current plan, adopted in 2021, is based on research, data, goals, and implementation steps developed prior to the COVID-19 pandemic. Since then, the pandemic has significantly disrupted various markets and systems, particularly those affecting housing and commercial investment. Beyond these transformative shifts, changes in state and local dynamics also necessitates a reassessment. It is crucial for the City to revisit its vision for the built environment, transportation systems, and overall development strategy. This review will help ensure the City is well-positioned to sustain, improve, and enhance the quality of life for both current and future residents.
YEAR INTRODUCED: FY 2020
RELATED CITY COUNCIL GOAL: #2 Courageously Leading

Annually, the City follows a PC replacement schedule, replacing those computers that have reached their end of useful life or malfunction during the fiscal year. The department requests $35,000 for this expense in the upcoming fiscal year.
FISCAL IMPACT SUMMARY:
The replacement of computers will not have a direct fiscal impact beyond the cost of completion. Efficiency is gained by staying current with new technology and software.

YEAR INTRODUCED: FY 2019
RELATED CITY COUNCIL GOAL: #6 Connecting with the World
The City utilizes the features and functionality of the Microsoft Office 365 platform across the entire organization. This project renews that licensing on an annual basis.
IMPACTS
IMPACT SUMMARY: No follow-on impacts related to the budget outside of the annual renewal.
YEAR INTRODUCED: FY 2026
RELATED CITY COUNCIL GOAL: #2 Courageously Leading

The City completed an assessment performed by the Department of Homeland Security two years ago. A major recommendation of that assessment was to install cameras on the exterior and interior of the Municipal Building to provide better situational awareness. The fire station and police station both have, or will have, cameras installed in this same manner. This project will install 23 cameras on both the interior and exterior of the Municipal Building and connect to the Genetec system.
FISCAL IMPACT SUMMARY:
License renewals are $46/camera/year and will be included in the IT operating budget.

YEAR INTRODUCED: FY 2026
RELATED CITY COUNCIL GOAL: #6 Connecting with the World
The wireless network is a critical component of ensuring seamless operations across the entire organization. The existing wireless network has been in place for more than six years and is reaching the end of its useful life. This project will replace the in-building wireless network across all city facilities with a new, state-of-theart wireless network. The new access points will be manufactured by our wired network vendor, Extreme Networks, allowing us to better leverage seamless access for employees, tighter control over security and significantly improved speeds.
COST ESTIMATE
This project includes a three-year license, so there will be no operating impact until FY29.
YEAR INTRODUCED: FY 2026
RELATED CITY COUNCIL GOAL: #2 Courageously Leading

To comply with new requirements for reporting election results by precinct – including early voting, vote-by-mail, and same-day registration provisionals – the Electoral Board must now utilize additional voting equipment. Specifically, the spare voting units currently used as supplemental machines during Presidential elections are now needed on a permanent basis to meet reporting and operational demands.
To ensure compliance with §24.2-627 of the Code of Virginia and maintain efficient election operations, four new voting machines are necessary. This will support the requirement to deploy two ballot scanners at each polling location and allow for the phased replacement of aging equipment with updated software and hardware.
Per §24.2-627, each precinct must have at least one scanner, and precincts with more than 4,000 registered voters must have a minimum of two scanners during Presidential elections – unless the locality, in consultation with the General Registrar and Electoral Board, determines that a second scanner is unnecessary based on historical turnout and wait times.
The additional operating cost is the annual maintenance fee for software and hardware.

YEAR INTRODUCED: FY 2026
RELATED CITY COUNCIL GOAL: #3 Prioritizing Safety & Wellness
The City replaces vehicles after extensive use, following industry standards. When general fleet vehicles are replaced, they are repurposed or sold as surplus. Following a replacement schedule in FY26, several vehicles are scheduled to be replaced.
Typically, operating and maintenance costs are reduced with newer vehicles.

YEAR INTRODUCED: FY 2019
RELATED CITY COUNCIL GOAL: #3 Innovating a Modern City
RELATED INITIATIVE: Downtown Library
The Williamsburg Library facility was constructed in 1974 with two additions in 1982 and 1988. The Williamsburg Regional Library system meets almost all major Virginia AAA Public Library Standards, with the exception of facilities, where it ranks as single A. The AAA standard is 1 square foot per capita. The actual library space, minus the theater and basement, is 25,000 square feet, which translates to .34 per capita of the population served. At 300% beyond recommended capacity, the library lacks any additional space to expand collections, collaborative works spaces, adequate seating, a teen area, interactive learning experiences, or other spaces for 21st-Century library services. In late FY24, the project began with some design funding already allocated by the City. The localities are continuing discussions on a jointly funded capital project replacement library. The outcome of the negotiations will determine the final size of the new library project. The previous budget accounted for $450,000 for design.
ESTIMATE
SOURCES
This project has no direct fiscal impact in the immediate term beyond the cost of completion.
RELATED CITY COUNCIL GOAL: #5 Engaging with Our Partners
The City of Williamsburg and James City County jointly own and operate the Williamsburg/James City County Courthouse as authorized by §17.1-281 of the Code of Virginia. Each locality has previously authorized the assessment of a courthouse maintenance fee of $2 for each civil and criminal action and/or traffic case in the District and Circuit Courts for the City of Williamsburg and James City County. The Clerk of the Circuit Court collects and remits fees monthly to the City’s Department of Finance, acting as agent for the Courthouse Maintenance Fund. Funds are invested in the Commonwealth of Virginia’s Local Government Investment Pool. Disbursements are approved by resolution of both the Williamsburg City Council and the James City County Board of Supervisors for capital projects deemed necessary.
Fiscal impact will be analyzed when specific projects are determined.
RELATED CITY COUNCIL GOAL: #5 Engaging with Our Partners
This project represents City's contribution to various capital expenditures for the joint Williamsburg-James City County school system. These estimates are based on the school system CIP. The City’s share of these expenses is estimated at 10.53% of the FY26 total as stipulated in the current funding agreement between JCC and the City. The remaining funds for any projects not completed at fiscal year-end are carried forward to the following year.
ESTIMATE
FUNDING SOURCES
IMPACTS
FISCAL IMPACT SUMMARY:
This project has no direct fiscal impact beyond the cost of completion due to improved reliability and efficiency of any new improvements, including appliances.
IMPROVEMENT PLAN (SALES TAX) UTILITIES
GRAND TOTAL
TO:
Andrew O. Trivette, City Manager
FROM: Planning Commission
DATE: March 19, 2025
RE: Capital Improvement Program (CIP)
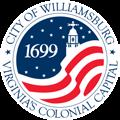
The Williamsburg Planning Commission has reviewed the proposed Five-Year Capital Improvement Program. The Commission held a public hearing on January 15, 2025, and a work session on January 22, 2025. Following a discussion on the CIP, the consensus of the Commission is to support the proposed Five-Year Capital Improvement Plan and strongly supports the following:
Highland Park Improvements: The Planning Commission recommends the City consider improvements in Highland Park that would allow original property owners to age in place.
Recreational Facilities: Consider locating pocket parks in appropriate locations.
Comprehensive Plan Update: A member of the Planning Commission should participate in the selection process for the consultant the City will hire to update the plan.
Safety: Improving safety for pedestrians and bicyclists with a focus on improvements and repairs to walking surfaces, increased lighting, bus stop and crosswalk improvements, and safety for bicyclists and pedestrians. The Commission agrees with the tenets of Complete Streets, an approach to planning, designing, building, operating, and maintaining streets that enables safe access for all people who need to use them, including pedestrians, bicyclists, motorists, and transit riders of all ages and abilities. The Commission requests attention be paid to the following areas:
• Lafayette Street from its intersection with Page Street to Matthew Whaley. For a long stretch, there are no sidewalks, and in certain areas, the sidewalks are very narrow and outdated and
• Merrimac Trail. The sidewalks are very narrow, outdated, and poorly lit. In the stretch near the Capitol Landing Road intersection, there is no sidewalk at all, and
• Mill Neck Road from Jamestown Road through the S-Curve to the road/pathway into College Woods; and
• Jamestown Road from Ukrop Way from the four-lane stretch from Lake Matoaka to Route 199. Specifically, we measure and conduct a speed study in the city, consider traffic calming measures, and consider restriping for safe bicycle access and pedestrian crossings along Jamestown Road.
School Capacity: Addressing capacity issues at our local schools. A strong school system provides the best tools to educate our children and helps our community attract the best teachers. Further, excellent schools are important for our future because they help attract new businesses, contributing many economic and social benefits to our city.
Affordable Housing: Examining and implementing recommendations from the Affordable Housing Work Group to improve the availability of workforce housing in the City.
Civic Center Redevelopment: Ensuring a cohesive vision for the redevelopment of the Civic Center Area. The Commission strongly supports the statement in the City's Goals, Initiatives, & Outcomes that improvements in this area should create a sense of place and comprise complementary architecture and design features.
The Commission looks forward to continuing its partnership with you and your staff to develop and implement the City's Capital Improvement Program.
James Boswell, Chair Williamsburg Planning Commission
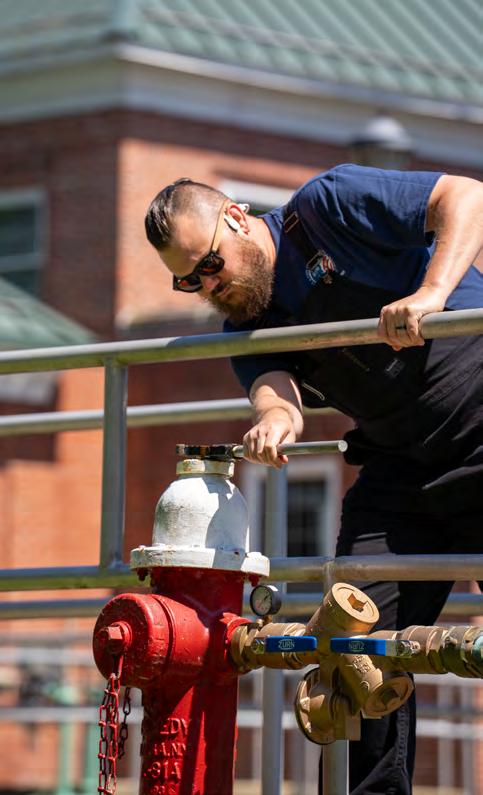
YEAR INTRODUCED: FY 2020
RELATED CITY COUNCIL GOAL: #4 Prioritizing Safety & Wellness
RELATED INITIATIVE: Utilities Infrastructure

The City has been aggressive in purchasing watershed property for several decades to protect its drinking water source. The City now owns or has conservation easements on 60% of the watershed. Funding is set aside in FY26 to provide for additional land acquisition should property become available. Funding is also for other initiatives such as forestry management and security improvements to the Plant and watershed (signage, access control).
While protecting the watershed around Waller Mill Reservoir will ensure a high-quality water source, purchase or control of more property will result in a larger area to be managed. This minimal impact is eliminated with the increased water quality benefit to water treatment.
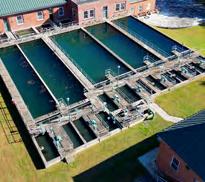
YEAR INTRODUCED: FY 2024
RELATED CITY COUNCIL GOAL: #4 Prioritizing Safety & Wellness
RELATED INITIATIVE: Utilities Infrastructure
The Water Plant was constructed in 1944 with a major expansion in 1978. As with many older structures, periodic repairs are needed due to deterioration and use. In FY24, $15,000 was budgeted for a structural evaluation of the floor system/basement ceiling which has cracked and corroded due to chlorine exposure. An initial allocation of $100,000 was included in the FY25 budget for the floor system repairs; however, this amount was increased upon receipt of updated cost estimates for the anticipated repairs. In FY26, the structural repairs at the plant will be completed for $200,000. The FY26 budget also includes $100,000 for a new server and SCADA system to remove the system from outside access, $60,000 to replace valves in one of the raw water pump houses, $60,000 to purchase and install a new automatic tranfer switch for the plants generator, and $80,000 for filter inspections. In FY27 and FY28, $100,000 is designated for additional valve replacements, followed by $500,000 in FY29 and FY30 for major pump and motor replacements.
COST ESTIMATE
The completion of the work will not have a direct fiscal impact beyond the associated project costs.
YEAR INTRODUCED: FY 2026
RELATED CITY COUNCIL GOAL: #4 Prioritizing Safety & Wellness
RELATED INITIATIVE: Utilities Infrastructure
A recently completed evaluation and rehabilitation design for components of the settling basins includes recommendations to replace all isolation valves, weir gates for the flash mix, flocculators, and sedimentation areas of the Water Treatment Plant. Also, this project will add more direct connections to the floc tanks to allow for greater operational control of the system. Furthermore, this project will address structural repairs needed to the sedimentation basins.
FISCAL IMPACT SUMMARY:
The completion of the work will not have a direct fiscal impact beyond the cost of completion due to improved reliability and reduced maintenance costs.

YEAR INTRODUCED: FY 2026
RELATED CITY COUNCIL GOAL: #4 Prioritizing Safety & Wellness
RELATED INITIATIVE: Utilities Infrastructure
This project is a full rehabilitation of the seven filters at the Water Treatment Plant. This includes replacement of filter media, isolation valves, controls, and instrumentation. The filter basins, dating back to the 1940s, were last inspected in 2009. The media is replaced when needed. Anthracite media was added in 2015 but was not fully replaced. The valve assemblies need to be replaced when each filter is scheduled to be brought down for structural rehabilitation. The unit's instrumentation and controls need to be replaced as they are original and are becoming obsolete. Additional valves need to be added to isolate the filters to the header pipe in the pipe galley serving the plant discharge piping.
SUMMARY:
The completion of the work will not have a direct fiscal impact beyond the associated project costs.
YEAR INTRODUCED: FY 2026
RELATED CITY COUNCIL GOAL: #4 Prioritizing Safety & Wellness
RELATED INITIATIVE: Utilities Infrastructure

The facility draws water from an on-site reservoir through two raw water pumping stations. The raw water suction piping from the reservoir is constructed through the berm of the reservoir and is exposed and actively leaking. The piping is fed by a single withdrawal point from the reservoir and cannot be isolated without shutting down the raw water supply. A permanent secondary withdrawal point from the reservoir needs to be investigated and installed to provide the system with the needed reliability and resilience to maintain a continuous water supply to the facility.
The completion of the work will not have a direct fiscal impact beyond the associated project costs.

YEAR INTRODUCED: FY 2023
RELATED CITY COUNCIL GOAL: #4 Prioritizing Safety & Wellness
RELATED INITIATIVE:
Utilities Infrastructure
The raw water and finished water pumps have not been performance tested to determine if they are properly operating as manufactured. Proactive testing of the pumps is recommended to establish a baseline to better predict operational decline. This allows the City to replace the pumps prior to failure, thereby providing additional assurance and system reliability. Pump testing will be conducted on regular intervals.
The completion of the work will not have a direct fiscal impact beyond the associated project costs.
YEAR INTRODUCED: FY 2026
RELATED CITY COUNCIL GOAL: #4 Prioritizing Safety & Wellness
RELATED INITIATIVE: Utilities Infrastructure
Improvements to the chemical building are recommended to improve safety and reliability. This includes additional HVAC throughout the building, tankage and containment areas, and a replumbing of the chemical pumping and piping systems.
FISCAL IMPACT SUMMARY:
The completion of the work will not have a direct fiscal impact beyond the associated project costs.

YEAR INTRODUCED: FY 2023
RELATED CITY COUNCIL GOAL: #3 Innovating a Modern City
RELATED INITIATIVE: Utilities Infrastructure COST ESTIMATE
The City's water distribution system dates back to the late 1910s and early 1920s. Significant expansion corresponding to annexations in 1923, 1943, 1964, and 1984 was accomplished as the City grew, but there are still many older parts of the system in operation. This ongoing project is to fund the replacement of known galvanized and cast-iron water mains due to their age and propensity to rupture and leak. This will eliminate costly repairs and water loss.
SUMMARY:
While this project will have no direct operating impacts, it will increase overall efficiency.
YEAR INTRODUCED: FY 2020
RELATED CITY COUNCIL GOAL: #4 Prioritizing Safety & Wellness
RELATED INITIATIVE:
Waller Mill Dam Improvements / Utilities Infrastructure
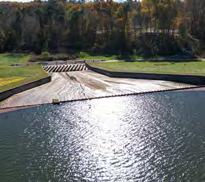
The City has an operation and maintenance permit for Waller Mill Dam from the Department of Conservation and Recreation (DCR). Due to new regulations, the dam went from a low hazard to a high hazard classification. A substantial amount of work may be required at the dam as a result of the new designation. Using new rainfall criteria required by the state, an engineering firm conducted a study of the dam’s capability to handle a worst-case rainfall event. Results of the study indicated that the earthen dam would overflow, meaning the City may be required to raise the dam or armor it with structural material.
The City has a permit from the state, conditioned upon improvements being made to the dam. Money was budgeted in FY21 for engineering work to review the latest State requirements and to determine options to protect the dam. Estimated budget figures are shown in FY26 for construction of anticipated improvements.
The completion of the work will not have a direct fiscal impact beyond the associated project costs.
YEAR INTRODUCED: FY 2023
RELATED CITY COUNCIL GOAL: #3 Innovating a Modern City
RELATED INITIATIVE: Utilities Infrastructure
This project would connect an existing 16-inch main at the St. Demetrios Greek Orthodox Church (4900 Mooretown Road) to an existing 12-inch main that crosses the CSX railroad tracks at Williamsburg Storage (5151 Mooretown Road). Most of the project is in York County and would improve flows and provide redundancy for the Mooretown Road and Richmond Road corridor north of Bypass Road. The loop would also improve water quality and fire protection for the area. The total length is 1,550 feet and requires crossing several pipelines and infrastructure in the Dominion Energy Right-of-Way as well as an encased crossing of Mooretown Road.
Funds are programmed at a cost of $10,000 in FY24 to complete the engineering design, and $625,000 in FY26 and FY27 for construction.
SOURCES
The additional cost for maintenance of the new pipeline is offset by lower operating costs due to the lowering of hydraulic losses in a looped system and greater reliability.
YEAR INTRODUCED: FY 2020
RELATED CITY COUNCIL GOAL: #3 Innovating a Modern City
RELATED INITIATIVE: Utilities Infrastructure
The original consent decree issued to all Hampton Roads Sanitation District (HRSD) localities by the Virginia Department of Environmental Quality (DEQ) was revised substantially. HRSD manages the more extensive Sanitary Sewer Overflow (SSO) capacity problems, including those associated with the Regional Wet Weather Management Plan (RWWMP). The localities are responsible for their respective collection systems and are charged with resolving structural deficiencies and issues associated with management, operations, and maintenance (MOM) of the sanitary sewer system. As such, the City is budgeting money for inspection, repairs, and rehabilitation.
These capital expenditures will be a factor in increasing utility rates. However, upgrading the sewer system will help reduce operation and maintenance costs.
YEAR INTRODUCED: FY 2023
RELATED CITY COUNCIL GOAL: #3 Innovating a Modern City
RELATED INITIATIVE: Utilities Infrastructure
This project would connect an existing 12-inch main at the City limit on Penniman Road to an existing 12inch main that crosses the CSX railroad tracks just east of Harrop Lane. The entire project is located in York County and would improve flows for the entire Penniman Road area and provide redundancy for the Second Street corridor. The loop would also improve water quality and fire protection for the area. The total length is 1,320 feet. Service lines for the 10 existing customers in Middletown Farms that front Penniman Road would be replaced, and the small diameter galvanized steel main serving these homes would be abandoned. Funds are programmed for a total cost of $550,000.
SUMMARY:
The additional cost for maintenance of the new pipeline is offset by lower operating costs due to the lowering of hydraulic losses in a looped system and greater reliability.
YEAR INTRODUCED: FY 2020
RELATED CITY COUNCIL GOAL: #2 Courageously Leading
RELATED INITIATIVE:
Smart City Initiatives / Utilities Infrastructure

There are 15 sewage pumping stations in the City. Because the City drains into shellfish waters, the stations are classified as Reliability Class I stations, which provides for the strictest standards of reliability. For example, the stations are required to have emergency backup power or other means of operating the pumps in case of power failure. As part of the Sanitary Sewer Overflow (SSO) Consent Decree, pump stations were identified as critical infrastructure to operate/maintain to avoid sewer overflows. These designations require heightened maintenance and failure avoidance. The initial phase involves the complete replacement of pumps at Pump Station 9 for $170,000. Subsequent upgrades or replacements of additional pump stations are planned annually, based on the findings of utility assessments.
The completion of the work will not have a direct fiscal impact beyond the associated costs due to improved reliability and efficiency of any new improvements, including equipment.

YEAR INTRODUCED: FY 2020
RELATED CITY COUNCIL GOAL: #3 Innovating a Modern City
RELATED INITIATIVE: Utilities Infrastructure
Water and sewer system contingency funds must be budgeted annually to cover unforeseen items. The utility must have the money reserved to operate on a continuous basis. Examples of water and sewer contingency expenditures include:
• Emergencies, such as major pipeline failures, pump/motor replacement, or generator failures
• Contributions to new infrastructure installed by development
• Capital project contingency
SUMMARY:
There is no fiscal impact to these contingency funds.
YEAR INTRODUCED: FY 2020
RELATED CITY COUNCIL GOAL: #3 Innovating a Modern City
RELATED INITIATIVE: Utilities Infrastructure

The City replaces vehicles after extensive use, following industry standards. The vehicle replacements are planned for FY26, FY28, FY29, and FY30, as follows:
2009 Ford F350 Diesel 4x4 - FY26 | 2006 Ford Van-Camera Truck - FY26 | 2013 Ford Explorer - FY26
2014 Ford F150 - FY28 | 2013 Ford Explorer - FY29 | 2015 Chevrolet Colorado - FY30
2018 F-250 4x4 Super Cab - FY30
FISCAL IMPACT SUMMARY:
When City vehicles are replaced, they are either repurposed in the organization or sold as surplus.

YEAR INTRODUCED: FY 2025
RELATED CITY COUNCIL GOAL: #2 Courageously Leading
RELATED INITIATIVE: Smart City Initiatives / Utilities Infrastructure COST ESTIMATE
There are 15 sewage pumping stations in the City. Pump testing was conducted on four pump stations in 2024. Testing to identify proactive maintenance needs will be conducted on the remaining pump stations at regular intervals over the next two fiscal years.
SOURCES
The completion of the work will not have a direct fiscal impact beyond the associated costs due to improved reliability and efficiency of any new improvements, including equipment.


This Budget Guide is designed to assist those responsible for preparing the ANNUAL OPERATING BUDGET and the FIVE-YEAR CAPITAL IMPROVEMENT PLAN of the City of Williamsburg. The budget process defines, communicates, and funds the City’s programs and priorities. The completed budget is City Council’s financial roadmap and a primary management tool for the City Manager and Department Heads. To that end, the document must be of high quality with the greatest level of care and diligence applied to its preparation.
The BUDGET GUIDE is a formal call for all departments of the City, and agencies associated with the City, to prepare and submit an estimate of the resources required for the next fiscal year. It includes a set of procedures for building a comprehensive budget to be submitted to City Council in March each year. It also serves as a mid-year review to identify adjustments necessary to the current year’s budget.
The Charter and Code of Ordinances of the City of Williamsburg, as well as the Code of Virginia, prescribe budgetary responsibility and process. Budgetary accounts are maintained according to the UNIFORM FINANCIAL REPORTING MANUAL FOR VIRGINIA COUNTIES AND MUNICIPALITIES, as prescribed by the Auditor of Public Accounts, Commonwealth of Virginia. This guide consolidates pertinent budgetary information as concisely as possible, providing a reference for making sound, informed, and consistent budget decisions.

23 The City hosted a series of Future Festivals to gather public input as part of its biennial Goals, Initiatives, and Outcomes (GIO) process.
Finance and Human Services Departments distribute applications to Outside Agencies, advising of budget submittal requirements and deadlines, including Tourism. Requests are due back to Finance/Human Services on Nov. 8.
Preliminary Revenue Projections – First Round
City Council GIO Retreat
16 Instructions sent to departments for FY26 operating budget requests, FY26 CIP requests, FY25 CIP updates, and Performance Metrics. Requests and updates are due on or before Nov. 22, and Performance Metrics, Dec. 1.
23 Budget Class videos sent to departments
Outside Agency Requests due to Human Services or Finance
Preliminary Revenue Projections – Second Round
FY26 CIP requests and FY25 CIP updates due
of operating budget requests due in the Munis System along with submission of Performance Metrics
in which Outside Agencies and Williamsburg
24 Submit Budget Synopsis to run on March 29 in the Virginia Gazette and Second Notice to run on April 2. Per State Code §15.2-2506, these must be advertised seven days before public hearing
27 First Notice of Public Hearing for Water Rate Increase Advertisement in VA Gazette, if applicable (VA Code §15.2-5136). Second Notice date is April 2.
29 Notice of Public Hearing for proposed property tax increase, if applicable. VA Code §58.1-3321 requires a seven-day minimum notice.
29 Notice of Public Hearing for Meals, Lodging, and Admissions tax increase, if applicable. VA Code §58.1-3007 requires seven-day minimum notice.
31 Balancing Act interactive budget released on the City website for public input
31 Deliver Proposed FY26 Operating and Capital Improvement Budgets to City Council and the media. (Per VA Code §15.2-2503, the City Manager, on or before April 1 of each year, shall prepare and submit to the council a proposed budget.).
2
Second Notice of Public Hearing (VA Gazette Ad) for Water Rate Increase, if applicable (VA Code §15.2-5136)
2 Second Notice (VA Gazette Ad) of Budget Synopsis / Proposed Budget. (Per State Code §15.2-2506, second notice must be advertised seven days before public hearing.
7 City Council holds Work Session that includes an FY26 Budget Overview and Open Forum.
10 City Council holds Public Hearing on Proposed Budget, Tax Levy, Bond, and Utility Rates.
2025
5 Council Work Session
8 City Council Meeting includes adoption of FY26 Operating, Capital, Utility, Tourism, Public Assistance, and Quarterpath CDA Fund Budgets with Budget Resolution and new tax rate, if applicable. (Per City Charter §34.2, the budget shall be formally adopted no later than June 1)
20 Communicate with Outside Agencies on Award
JULY 2025
1 Begin Fiscal Year 2026
5 Printed budget documents distributed to City Council AUG 2025
November 8, 2024
Outside Agency Requests Due
January 15, 2025
Planning Commission
Public Hearing on Proposed CIP
February 14, 2025
City Council Budget Retreat
March 29, 2025
Advertise Proposed Property Tax Increase, and Proposed Meals, Lodging, and Admissions Tax Increase, if Applicable
By March 31, 2025
FY26 Proposed Budget Published Online; Online Public Input Begins via Balancing Act
April 7, 2025
FY26 Proposed Budget Overview Presented to City Council
April 10, 2025
Public Hearing on Proposed Budget
May 8, 2025
City Council Adopts
FY26 Budget

In early October, Finance staff will provide instructions and access to the Munis budget system so that departments with operating activity can review and update departmental line items:
A. Expenditures for the last two fiscal years
B. Current year budget
C. Current year expenditures
D. A column for estimating CURRENT FISCAL YEAR total expenditures through June 30
E. A column for NEXT FISCAL YEAR’S line-item budget estimates
Each department head should complete ITEMS D AND E. The current year estimate is both the basis for recommending amendments to the current year’s budget and for determining next year’s amount for consideration by City Council.
Recommendations on PERSONNEL EXPENDITURES (addition/deletion of positions, etc.) should be submitted in memo form. Payroll and fringe benefits line items in the system should be left blank. Finance will calculate and enter these line items.
1. Analyze each line item separately. Compare historical data, current year budget, and estimated spending levels for the current year to assist with your request.
2. Round all figures to the nearest $10.00 (i.e., $32 to $30 and $85 to $90).
3. Verify all object codes, amounts, and totals.
4. Meet all Budget Calendar deadline dates. Preparers should highlight key dates and actions.
5. Keep backup materials used in computing your budget request. These will be used both in explaining budget recommendations and administering the budget.
6. Departments are responsible for managing their operating budgets by closely monitoring expenditures and encumbrances against the budget monthly. Written requests for BUDGET ACCOUNT TRANSFERS or SUPPLEMENTAL APPROPRIATIONS must be submitted on forms provided and approved before obligating spending over the adopted budget.
The Capital Improvement Plan (CIP) identifies, schedules, and budgets capital projects. A capital project is a major expenditure that adds to the net assets of the City. Capital projects fall within one or more of the following categories:
1. Land acquisition or long-term lease
2. Construction of buildings, public facilities, and infrastructure, generally exceeding $20,000
3. Acquisition or improvement of property, generally exceeding $20,000
4. Major additions or rehabilitation to public facilities, generally exceeding $20,000
5. Major studies such as engineering, feasibility, etc., related to public facilities
6. Vehicles and equipment, generally exceeding $10,000
Examples of capital projects include street construction, sewer lines, parks, sidewalks, storm drains, water lines, building construction or major renovation, fire trucks, and police cars.
Engineering or planning studies, which are directly linked to a specific capital project, are part of the cost of that project. Such engineering studies should be included in the
project description of which they are a part. Other studies and plans, which constitute a major expense of a non-recurring nature, are included in the CIP even if they are not assets in the traditional sense (i.e. a building).
The Five-Year Capital Improvement Plan is presented annually to City Council. The first year of the Capital Improvement Plan is a capital budget and contains the list of projects for implementation during the coming fiscal year. The CIP is updated annually as new needs become known and as priorities change. It is possible that a project with low priority can remain in the CIP program longer than five years as more important projects appear and move to the forefront. Conversely, a project may be implemented sooner than originally planned due to changing priorities.
All requests for capital projects and input on priorities will be evaluated by the City Manager and Finance Director before being submitted to City Council.
The Planning Commission will receive the proposed CIP when it is distributed to City Council. The Commission will be invited to advise Council on the consistency of the CIP with the Comprehensive Plan of the City.
Capital Improvement Plan projects will be submitted on forms provided by the City Manager. The following is a non-inclusive list of project categories:
• Streets & Traffic
• Solid Waste Management
• Building Improvement
• Economic Development
• Parking Facilities
• Property Acquisition
• Stormwater Management
• Park Development
• Water & Wastewater Improvements
• Field Equipment
• Planning/Feasibility Studies
• Vehicles
All vehicles owned by the City are listed on a replacement plan. The plan is based on a five-year projection. It is updated annually along with the CIP.
Each year departments submit an update to the CIP as the first step in budget formulation. Updates include:
1. Submission of a Capital Project Form for NEW PROJECTS with a description of the project, funding source(s), estimated costs, an operating budget fiscal impact statement, and an appropriate picture of the project.
2. For EXISTING PROJECTS, submission of a statement for each CURRENTYEAR PROJECT of work accomplished at the SIX-MONTH point and the accomplishments expected by the 12-MONTH point.
3. Submission of a revised CAPITAL IMPROVEMENT SUMMARY for that portion of the CIP assigned to the originator’s department.
The SECOND STEP requires department heads to provide a status report by Dec. 1 of each year for all projects funded during the prior fiscal year ended June 30. This information will be provided to the Finance Department to determine the balance of capital projects funds needed to carry forward to the next fiscal year for project completion.
The City of Williamsburg has a vision for the future. To advance the City’s vision, every two years, the City Council identifies new strategic objectives for the City government. The biennial GOALS, INITIATIVES, AND OUTCOMES (GIOS) provide an expression of city priorities, as specific and measurable as possible, covering a two-year period.
City Council elections are held in November of even-numbered years, with two or three new or incumbent members elected each cycle. The newly elected Council members then inherit a recently adopted strategic plan, giving them time to become familiar with workings of City government before attempting to chart the City's course. Council begins its methodical goal-setting process in the Fall of evennumbered years. City Council's adopted goals then become a guide for the two succeeding budgets.
Through this model, the Council spends the six months prior to the election deciding what should be accomplished based on various forms of public input and staff recommendations, and the remaining 24 months before the next election concentrating on implementing its goals. This process, with a newly elected Council inheriting a strategic plan, provides much-needed stability to the organization.
During the midterm, or odd-numbered years,
the Council should revisit and re-evaluate progress in accomplishing those goals, but the formal goal setting process takes place only every two years.
In order to be fully useful, goals should be SPECIFIC, MEASURABLE, SHORT-RANGE, AND ACHIEVABLE. They should also be developed by exception; the continuation of existing policies and practices of city government should not be listed as goals, however important they may be.
The City of Williamsburg's strategic plan is a layered plan known as the Goals, Initiatives, and Outcomes (GIOs). The plan consists of four components:
1. VISION STATEMENT: Establishes the planning horizon for the work, which is currently 2040.
2. GOALS: Designed as statements of six work areas that are considered on 10-year increments and, when satisified, fulfill the Vision.
3. INITIATIVES: Intended actions wtihin each goal, established every two years to advance the City toward satisfaction of the corresponding goal statements.
4. OUTCOMES: Define the result of work being done in measurable terms to the extent possible.
The calendar below outlines the process for City Council’s Goals, Initiatives, and Outcomes. The City Council’s two-year election cycle fits well with this biennial goal setting cycle.
MAY National Community Survey (NCS) Conducted.
JULY Executive Team hosts internal retreat for initial planning of the strategic plan process.
SEPTEMBER Council provides public participation opportunities to gain ideas and suggestions on past and future goals.
OCTOBER Council hosts retreat to review and evaluate progress of current GIOs, receive results from the public input process, and discuss future priorities.
NOVEMBER City Council Election.
City Manager presents a draft Biennial Goals, Initiatives and Outcomes (GIOs) based on the outcome of the retreat and public comment for Council consideration.
City Council adopts the new biennial GIOs.
City Staff begins work on the operating and capital budgets for the coming fiscal year, reflecting priorities in the statement of goals.
DECEMBER
JANUARY 1
The Mayor and City Council delivers a “State of the City” address.
Four-year terms begin for new Council members.
The City of Williamsburg operates its budgetary system on a FUND ACCOUNTING basis.
The funds used by the City of Williamsburg are GOVERNMENTAL, FIDUCIARY, AND PROPRIETARY. The Governmental Funds consist of the General Fund (001), Tourism Fund (003), the Capital Improvement Program (Sales Tax 004), the Public Assistance Fund (006), and the American Rescue Plan Fund (777). The Fiduciary Fund consists of the Quarterpath Community Development Authority (QCDA 555). The Proprietary Fund is an Enterprise Fund (010) which accounts for City water and wastewater as the Utility Fund.
The General Fund is used to account for all financial resources except those required to be accounted for in one of the other funds. The General Fund encompasses all City departments, except utilities, and includes entities funded through City government, such as constitutional officers, detention, schools, library, and outside agencies.
The Tourism Fund is a major special revenue fund used to account for tourism tax revenue (1% of the Historic Triangle regional sales tax and the $2 lodging tax). The expenditures in the Tourism Fund are for the purpose of funding tourism development projects.
The Public Assistance Fund is a non-major special revenue fund used to account for the social services programs of the City and is funded primarily through intergovernmental revenues.
The American Rescue Plan Fund is a fund to account for the activities funded by the State
and Local Fiscal Recovery Funds provided by the federal government under the American Rescue Plan Act to respond to the impacts of the COVID-19 pandemic. This fund also includes ARPA funding for Municipal Utility Relief Funding, ARPA Tourism funding passed through from the Commonwealth, and COVID-19 contingency.
The Capital Improvement Program is used to account for major capital outlay items. Historically, the city has used the state’s 1% sales tax revenue to fund capital projects.
The City has one Fiduciary Fund, the Quarterpath Community Development Authority (QCDA), for which the City collects special assessments on behalf of the QCDA.
Enterprise Funds are used to account for operations that are financed and operated in a manner similar to private business. The intent of these operations is to finance the cost of providing continued services to the public primarily through user charges and fees.
AND RESPONSIBILITY lists the individual responsible for submitting and managing each departmental budget.
document all existing and potential sources of revenue received by the City of Williamsburg to finance its operations each year. This section contains a thorough description of each revenue source, trends, and other pertinent information that should help the reader gain an understanding of the basis of each of these sources.
provides an explanation of each line item to help properly and consistently classify expenditures.
FUND DEPT.
NUMBER NUMBER
General Fund:
001 1101
001 1102
001 1201
001 1203
001 1204
001 1205
001 1206
001 1207
001 1209
001 1210
001 1213
001 1214
001 1221
001 1301
001 1302
001 2100
001 3101
001 3102
001 3103
001 3201
001 3301
001 3303
001 3401
001 3501
001 3503
001 3505
001 4101
DEPARTMENT
Legislative
Clerk of Council
City Manager
RESPONSIBILITY
Andrew O. Trivette
Andrew O. Trivette
Andrew O. Trivette
Economic Development & Tourism Yuri Matsumoto
City Attorney Christina Shelton
Human Resources
Triangle Building Management
Workforce Housing
Dawn Hicks
Tyrone Franklin
Tyrone Franklin
Commissioner of the Revenue Michele Mixner DeWitt
City Assessor Derek J. Green
Treasurer Jennifer Tomes
Finance Barbara Dameron
City Shop R. Jackson Reed
Electoral Board
Registrar
Joint Activities
Police
E-911
Parking Facility
Fire
Regional Jail
Tina Reitzel
Tina Reitzel
Barbara Dameron
Sean Dunn
Sean Dunn
Sean Dunn
Larry W. Snyder Jr.
Roy Witham
Middle Pen. Juv. Det. Center Gina Mingee
Codes Compliance
Animal Control
Medical Examiner
Lauri Springsteen
Sean Dunn
Larry W. Snyder Jr.
Emergency Management Larry W. Snyder Jr.
Engineering R. Jackson Reed
001 4102 Streets R. Jackson Reed
001 4103
001 4203
001 4305
001 4306
001 4307
001 4308
001 4309
001 5101
001 5103
001 5302
Stormwater Management R. Jackson Reed
Refuse Collection R. Jackson Reed
Municipal Complex
Rental Properties
New Municipal Building
Information Technology
Landscaping
Health Department
Mosquito Control
Public Assistance
R. Jackson Reed
R. Jackson Reed
R. Jackson Reed
Mark Barham
R. Jackson Reed
Barbara Dameron
R. Jackson Reed
Wendy Evans
001 5305
001 6101
001 6103
001 7101
001 7102
001 7104
001 7106
Public Assist. – Transportation
School Board
Joint School Contributions
Recreation Administration
Waller Mill Park
Recreation Programs
Farmers Market
Wendy Evans
Barbara Dameron
Barbara Dameron
Robbi Hutton
Robbi Hutton
Robbi Hutton
Robbi Hutton
001 7108 Cemetery R. Jackson Reed
001 7302 Library – Contributions Barbara Dameron
001 8101 Planning Tevya Griffin
001 8102 Contrib. to Other Agencies Barbara Dameron
001 8202 Soil & Water Conservation R. Jackson Reed
Tourism Fund:
003 3900 Administrative Expenditures Yuri Matsumoto
003 3910
003 3920
003 3930
003 3940
Tourism Marketing Andrew O. Trivette
Tourism Development Andrew O. Trivette
Tourism Grant Awards Andrew O. Trivette
Tourism Resiliency Andrew O. Trivette
General Property Taxes account for approximately 48% of the City’s general fund operating revenues. These taxes are derived from the annual assessment of real estate and tangible personal property located in the City. The City Assessor appraises real estate property annually. This category includes property tax collections for current and delinquent years. Also included in this category are collections for Public Service Corporations, property appraised by the State Corporation Commission, and cover real, personal property, and machinery and tools. Revenues received for property tax on mobile homes, boats, and motorcycles are also included in this revenue category.
By state law, all real property taxes must be assessed each year at 100% of fair market value. The assessments are made on a calendar year basis and must be completed and mailed to property owners by June 30 for the next fiscal year. Taxes are then due on Dec. 1 and June 1 of that fiscal year. The current tax rate (FY25) is $.62 per $100 of assessed value.
The City’s real estate tax rate history is shown in the following tabulation:
Real property taxes generated by other selected Virginia localities for the fiscal year ended June 30, 2024, are as follows1:
Real property tax revenues received during the past 10 fiscal years are shown below2:
1 Commonwealth of Virginia – 2024 Comparative Report of Local Government Revenues and Expenditures – Exhibit B
2 City of Williamsburg’s Annual Comprehensive Financial Reports – Amounts include prior years’ delinquent real estate tax receipts
Real estate taxes are generated based on the annually reassessed value of property. Taxable real estate property values for the last 10 fiscal years are as follows:
For each 1¢ of the City’s tax rate, approximately $316K is generated annually, based on the 2025 land book values. New construction each year tends to skew increases in total property valuations shown above from year to year.
Tangible personal property is classified into two categories for valuation purposes: personal and business property. Cars, trucks, boats, trailers, etc., comprise personal property, and furniture, fixtures, and machinery account for business property. Property is assessed each Jan. 1, and taxes are due on Dec. 1 of the same year. The rate of assessment for motor vehicles is determined by the NADA or “Blue Book” average loan value. Furniture, machinery, etc., is assessed at 30% of the original cost. The City does not prorate for partial-year occupancy. The tax rate is $3.50/$100 of assessed value.
Personal property taxes generated by select Virginia localities for the fiscal year ended June 30, 2024, are as follows3:
*Includes Machinery & Tools and excludes State reimbursement for Personal Property Tax Relief Act.
Personal Property tax revenues received during the past 10 fiscal years are shown below4:
*Business personal property tax receipts include autos, machinery, & tools
3 Commonwealth of Virginia – 2024 Comparative Report of Local Government Revenues and Expenditures.
4 City of Williamsburg’s Annual Comprehensive
– Amounts include
Tax revenues are generated by public service corporations based on annual assessments of property, both real and personal, by the State Corporation Commission. Public service corporations are those providing services such as water, heat, light and power, telecommunications, and railroads within local government boundaries.
Property assessments for the last 10 fiscal years, along with the total revenue receipts for public service corporations are provided as follows:
Personal property and first-half fiscal year real estate taxes are due Dec. 1 each year. Secondhalf real estate taxes are due June 1. Penalties are charged on all property tax accounts if not paid by these due dates.
Penalty charges for delinquent property taxes are as follows:
Interest charges begin Jan. 1 for delinquent first-half real estate and personal property taxes and July 1 for second-half taxes. Interest is computed monthly, with an annual percentage rate of 10% as provided for in the Williamsburg City Code.
Penalty and interest revenues over the past 10 fiscal years are shown in the following table:
This category of local revenues differs from general property taxes in that they are not billed by the City, except in the case of business licenses. They are dependent on business volume, and most are self-imposed. Businesses report sales activity directly to the City, and charges are based on these reported figures. Business activity is subject to verification by the Commissioner of Revenue
Effective July 18, 2018, the additional Historic Triangle Regional sales and use tax of 1% was levied for all of York County, James City County, and City of Williamsburg businesses under the authorization of Senate Bill 942, which raised the overall general sales tax to 7%. The taxes are collected and submitted to the Virginia Department of Taxation on a monthly basis, and half of the 1% of these proceeds are then returned to the City directly from the state. As a matter of policy, the City has designated the original 1% to pay for its ongoing capital improvement program, and the new 1% is reported in the Tourism Fund. Revenues received from the Commonwealth of Virginia for sales taxes over the last 10 fiscal years are as follows:
Use taxes are collected by public utility companies and remitted to the City on a monthly basis. City Council approves the rates charged annually. Since Fiscal Year 2007, Telecommunications sales taxes are 5% for all Virginia localities.
The following table highlights the purpose and rates charged by these utility companies in effect during the fiscal year 2026:
The Commonwealth of Virginia deregulated gas and electric utilities in 2001. Since then, local utility taxes for those industries are designed to be revenue-neutral to localities. Beginning July 1, 2003, the City of Williamsburg began imposing a tax on wireless communications.
Total receipts collected over the last 10 fiscal years are as follows:
All businesses in the City must obtain a business license to operate. The Commissioner of the Revenue sends business license applications in late December each year. Forms provided include prior year information - name, address, type of business conducted, gross receipts, etc. – and it is the responsibility of licensees to confirm or change this information. The applications must be returned to the Commissioner by Feb. 15. The fees for business licenses are based on gross receipt figures provided in the application. The payment for business licenses is due March 1 each year, with a 10% penalty beginning March 2 and interest accruing at a 10% annual percentage rate.
A detailed list of rates is provided below for information purposes.
Business or Personal Service
Contractor
Fortune Teller
FEE* MINIMUM FEE
$.36/$100 $30 up to $8,200
$.16/$100 $30 up to $18,000
$1,000 flat fee Flat license fee
Itinerant Merchant or Peddler License $500 flat fee Flat license fee
Professional Service
Retail Merchant
Wholesale Merchant
Restaurant (seating 50-100)
$.58/$100 $30 up to $5,000
$.20/$100 $30 up to $15,000
$.05/$100 $30 up to $60,000
$200 Flat license fee
Restaurant (seating 101-150) $350 Flat license fee
Restaurant (seating 151+)
Off-Premises Sale of Beer
Flat license fee
*Based on gross receipts
Business licenses receipts over the last 10 fiscal years are as follows:
The Code of Virginia, Chapter 58.1, governs the licensing and regulation of cable television in the City. Gas and electric utilities using the City streets and right-of-ways to conduct business are classified here also, with consumption taxes set by state code. The Code of Virginia § 58.1-2904 imposes consumption taxes on consumers of natural gas in the City, and the Code of Virginia § 58.1-2900 covers consumption taxes on electricity in the City. These taxes are separate from consumer utility taxes charged monthly. The City’s current franchise agreement with Cox Communications expires in 2026.
Cable TV
Telephone
Gas
Electric
Taxi & Bus Services
5% of gross receipts
$.50 per access line
$.004/CCF first 500CCf per month
Under 2,500 kWh = $.00159/kWh/month
2,500 – 50,00 kWh = $.00102/kWh/month over 50,000 kWh = $.00077/kWh/month
$100 flat fee plus $100 per cab owned
Utility license fees collected over the past 10 years are shown below:
Educational and Governmental Access Channels (PEG)
Every incorporated bank, banking association, or trust company organized by or under the authority of the laws of the Commonwealth are responsible for filing bank franchise taxes5 A specific state tax form is prepared annually for banks and filed with the Commonwealth of Virginia. The City’s local tax is 80% of the state tax rate of $1.00 per $100 of a bank’s taxable value on Jan. 1 of each year. Banks submit the portion of their total bank stock taxes to local governments based on the percentage of banking operations within each locality.
Bank stock tax collections over the past 10 fiscal years are shown below:
5 Commonwealth of Virginia, Dept of Taxation, Virginia Bank Franchise Tax, 1997 Forms
State law gives City Council the power to impose recordation taxes upon the first recordation of each taxable instrument recorded in the City. Taxable instruments generally consist of deeds, deeds of trust, and marriage licenses. The rate charged is $.15 on every $100 or fraction thereof of the consideration of the deed or the actual value of the property conveyed, whichever is greater6. For deed recordation in excess of a $10M value, a sliding scale is used. The Clerk of the Circuit Court is responsible for collecting and remitting these fees monthly to the City. In addition to these fees, a local tax is imposed (equal to up to one-third of the state recordation tax) and submitted to the City. The City has charged this maximum fee for many years. A grantor’s tax is also collected by the Clerk of the Circuit Court and submitted to the State for quarterly distribution. This tax is classified under the Non-Categorical Aid section of this report.
Local recordation taxes collected over the past 10 fiscal years are as follows:
The City of Williamsburg began imposing a cigarette tax of 25¢ per pack on July 1, 2003, and the current rate for FY25 is 40¢ per pack. The timing of vendor stamp replenishment is unpredictable each year.
Total cigarette taxes collected over the past 10 years are as follows:
The City's FY25 transient occupancy tax rate on hotels, motels, bed and breakfasts, and other facilities offering guest rooms was 5%. Businesses collect this tax and submit it to the City by the 20th of the following month.
Room tax collections over the last 10 fiscal years are:
Pursuant to the Code of Virginia, the City is authorized to levy an excise tax on all food and beverages sold in the City as meals. City Code defines “food and beverages” as all food, beverages or both, including alcoholic beverages, which are meant for refreshment or nourishment value, purchased in or from a restaurant, whether prepared in such restaurant or not, and whether consumed on the premises or not.7 The meal tax rate in FY25 was 5%.
Meal tax collections over the last 10 fiscal years are: 7
The City’s adopted Fiscal Year 2026 operating budget estimates room & meal tax revenues to be $16,790,000 or 29% of the total operating budget. Rates charged by nearby Virginia localities, and the percentage of budgeted FY24 receipts to total operating budgets, are presented below:
*In addition to room taxes, the City of Williamsburg, James City County and York County collect a $2.00 per night per room tax, which commenced on July 1, 2004, per Code of Virginia, section 58.1-3823C. The revenues generated are designated and expended solely for tourism development. Half of the receipts are sent to the state’s Historic Triangle Marketing Fund, and the other half the City retains in the Tourism Fund. In addition, Newport News and Chesapeake charge a flat-rate tax of $1 per night per room, and Virginia Beach and Hampton a flat-tax rate of $2 per night per room. ^For Virginia Beach, only a 2% room tax rate and a 3.5% meals tax rate is allocated to the General Fund. Percentage of Budget shown for Virginia Beach is that portion dedicated to the General Fund only.
The City uses the Virginia Uniform Statewide Building Code (USBC), which covers new construction, renovation, demolition, plumbing, gas, mechanical, electrical, fire protection system installations, and asbestos removal. The category’s major components consist of building, electrical, plumbing, and mechanical permits.
A 10-year history of permit revenues follows:
*Other includes dog licenses, parking, zoning, right-of-way, raffle, rental inspections, gas and fire prevention permits.
This revenue category is used to account for court and parking fines. The court system has guidelines for setting case-related fines, while City Code sets the rates for parking fines. The Clerk of the Circuit Court collects court fines and submits receipts to the City monthly, while parking fines are paid directly to the Department of Finance. Effective October 2018, the City implemented the following parking fine structure:
*Ordinance #18-09 was adopted October 2018 to amend Sections 11-162, 11-165 and 11-167 of Chapter 11, Article VI of the Code of the City of Williamsburg regarding Parking Fines. If payment for any ticket is made after 14 days of issuance, the fine for the ticket shall increase.
Revenue collections for fines and forfeitures over the last 10 fiscal years are as follows:
This revenue classification includes interest earnings on surplus funds, rental income from City-owned properties, and sale of surplus vehicles and equipment. Interest earnings shown here are reported in the Capital Improvement Plan Fund, as Utility Fund revenues are presented separately in the Budget Summaries section. Rental income consists of various rental properties, including the Community Building user fees. The base rate for a weekday is $125 per hour with a three-hour minimum.
Revenue collections from the use of money and property over the last 10 fiscal years are presented below:
A breakdown of rental income from properties over the last 10 fiscal years is presented below:
*Includes Triangle Building Commercial rent and houses on Strawberry Plains Road and Scotland Street.
The City uses this revenue classification to account for various revenue sources requiring charges. Minor amounts are included under Sheriff’s fees and Commonwealth Attorney’s fees, of which the City has no control. Also included are charges for maintenance of highways, streets, and sidewalks, which are used for the billing of special mowing or trash pickup and are minimal in amount. Charges for Planning & Community Development include minor amounts for maps and surveys, with the largest dollars attributable to the sales of Cedar Grove Cemetery lots and grave openings. The largest item under this category is charges for Parks & Recreation. The City Code authorizes the Parks & Recreation Department to set and collect charges for programs and activities for the use of its facilities and services.
Charges for Services collected over the past 10 years are shown below:
Parks & Recreation fees for the last 10 fiscal years are outlined in detail below:
Cemetery lot sales and grave opening fees over the last 10 years are as follows:
As of July 1, 2005, the City began a program of billing health insurance providers for emergency medical transportation services. Receipts over the last 10 years are as follows:
Monies received from the Commonwealth of Virginia are classified as either Non-Categorical or Categorical Aid. Non-Categorical revenues are received quarterly according to state code, are not billed or itemized by the City or any constitutional officer, and are not designated to be used for any specific purpose. These are directly deposited in the General Fund and used to pay for overall operations. Categorical Aid must be spent on specific purposes. In the case of constitutional officers, expenditures are itemized and sent to the Commonwealth for reimbursement, based on various formulas provided by state code.
1. ROLLING STOCK TAXES - The State Corporation Commission determines the assessed value of “Certified Motor Vehicle Carriers,” primarily bus companies, and assesses a property tax at the rate of $1 per $100 value. These revenues are distributed quarterly to localities according to the number of miles traveled within each locality, based on reports submitted by the carriers.
2. RENTAL CAR TAXES - Payments received from the Commonwealth are based on rental car taxes collected by rental companies within each jurisdiction. A 4% rental car tax is required to be assessed on all rental vehicles. Rental companies submit the taxes monthly to the Department of Motor Vehicles with a report by locality. The Commonwealth distributes these funds monthly to localities.
3. GRANTOR’S TAX - The Clerk of the Circuit Court collects additional recording fees for this purpose, details monthly activity, and deposits these receipts in a state account. Activity is separated at the courthouse for deeds relating to Williamsburg or James City County. Funds are distributed quarterly by the Commonwealth from a $10 million fund ($40 million per year) to localities based on their share of overall grantor tax collections in the Commonwealth.
Non-Categorical Aid received over the last 10 fiscal years is as follows:
1. SHARED EXPENSES - Constitutional offices are included as City departments/operations with reimbursements provided, in part, by the Commonwealth of Virginia.
a. SHERIFF - This is a joint activity shared with James City County. Virginia refunds approximately 100% of state-approved salaries and operating costs of this department. However, since the City is now part of the Virginia Peninsula Regional Jail Authority, the Sheriff's responsibilities are now limited to courtroom security and prisoner transport. Jail staffing at the Courthouse has been significantly reduced, as many former employees now work for the Authority. Salary supplements are not reimbursed by the state.
b. COMMISSIONER OF THE REVENUE - State code provides for reimbursements to the City at 50% of salaries, fringe benefits, and a minor portion of operating expenses. Any constitutional officer can make special requests for payment from the Compensation Board for additional consideration. For the City’s Annual Comprehensive Financial Report dated June 30, 2024, total reimbursements were 34.5% of expenditures.
c. TREASURER - This is also a joint activity shared with James City County. The state reimburses the City two-thirds of salary, fringe benefits, and operating costs for the Deputy Treasurer, whose office is in the Municipal Building. In turn, the City bills James City County 25% of the non-reimbursed amount annually. In the City’s Annual Comprehensive Financial Report, only the state-reimbursed monies are classified as Categorical Aid. Reimbursements received from James City County are classified as credits to the expenditures in the Treasurer Department 1213.
d. MEDICAL EXAMINER - The position is reimbursed at $30 per examination.
e. REGISTRAR/ELECTORAL BOARD - For FY25, salaries were reimbursed by the state at 77% for the Registrar and 82% for the Electoral Board members. No reimbursements are made for fringe benefits or operating expenditures. The Department of Finance files for reimbursement to the state Electoral Board annually.
2. WELFARE - All of the City’s Human Services programs are accounted for as a special revenue fund and are included in the City’s Annual Comprehensive Financial Report in the Virginia Public Assistance Fund.
3. 599 FUNDS - Each locality in the Commonwealth is eligible to receive a share of the total distribution proportional to its share of the total adjusted crime index, as determined by the Department of Criminal Justice Services (DCJS). The City must notify DCJS prior to July 1 each year that its law enforcement personnel have complied with minimum training standards as provided for by the Code of Virginia. These distributions are made quarterly.
4. EDUCATION (State Sales Tax for Education) - The governor distributes 1% of statewide sales tax receipts to every school district based on state census figures provided for school-age population. This is adjusted with each triennial census performed by the joint school system and verified by the localities.
5. OTHER CATEGORICAL AID - See the next section for a detailed description.
Categorical Aid received over the last 10 fiscal years is as follows:
Other aid received from the Commonwealth and designated for specific use includes:
1. ARTS COMMISSION - Grant funds are applied for by the City and James City County to the Commonwealth for the Creative Communities Partnership Grant. Funds are received directly by each locality. James City County includes the state grant in its annual reimbursement for its share of the Williamsburg Area Arts Commission budget. Historically, each locality receives $4,500, the state maximum award allowed under this state program.
2. STREET & HIGHWAY MAINTENANCE - The City is reimbursed quarterly by the Commonwealth according to lane miles of streets within its boundaries. In FY24, the City was reimbursed $29,094.20 per lane mile for Principal/Minor Arterial Roads and $17,082.15 per lane mile for Collector/Local Streets. Lane miles used to calculate reimbursement change only when additional roads are built in the city. Total revenue for FY24 was $2,459,321.68 based on peak-hour moving lane miles of state arterial roads in the City of 40.39 miles and local streets of 81.04 lane miles.
3. EMERGENCY SERVICES - Each year, funds are received for Radiological Emergency Preparedness. These funds support the activities of state agencies and certain local governments in establishing, maintaining, and operating emergency plans, programs, and capabilities to deal with nuclear accidents8. Annual training exercises are performed, within program guidelines, and are coordinated throughout the geographic area with other local governments and Dominion Energy. Amounts received each year are based on the projected annual cost of administering the state and local government programs for the power stations.
4. FIRE PROGRAMS - This is a special appropriation to localities to be used for fire service training, training facilities, and fire-fighting equipment or vehicles. Localities must provide detailed expenditure reports annually to qualify for these funds. This revenue is reported in the Capital Improvement Plan (Sales Tax) Fund.
8 VA of Emergency Services - Funding to State and Local Government Agencies and Supporting Organizations, June, 1992
5. 4 FOR LIFE (EMS) - State Code provides an additional $4 per year to be charged and collected when registrations for pickups, panel trucks, and motor vehicles are made at the Department of Motor Vehicles. These monies are paid into the state treasury to be used for emergency medical service purposes. Twenty-six percent of these funds are returned to the localities where the registrations were made. It supports volunteer and paid personnel training, equipment, and supplies for emergency purposes. This revenue is reported in the Capital Improvement Plan (Sales Tax) Fund.
6. LITTER CONTROL - The City receives this annual grant from the Department of Waste Management to aid in litter control. Monies are used for litter prevention, elimination, and control. The grant must be applied for annually, and year-end accounting is required to verify that the funds were spent appropriately. Amounts vary each year depending on available funds and local program requirements.
Other Categorical Aid received over the last 10 fiscal years is as follows:
The City’s Annual Comprehensive Financial Report itemizes federal receipts on the Schedule of Federal Awards, according to the Catalog of Federal Domestic Assistance catalog numbers. Human Services programs account, by far, for the majority of the City’s federal funds. These programs are accounted for in the Public Assistance Fund. These programs are highlighted:
1. DEPARTMENT OF EMERGENCY SERVICES - These funds are administered by the Federal Emergency Management Agency (FEMA). Funds are received for disaster assistance and hurricane preparedness and, more specifically, are intended to supplement the cost of deploying the City’s Emergency Management team in accordance with FEMA requirements during natural disasters. In FY22, the City received $14,483 for the Surfside Condominium Collapse in Florida. In FY23, the City received $37,258 for Tropical Cyclone Ian. The City also received a Staffing for Adequate Fire and EMS Response (SAFER) grant in FY22 of $148,525, in FY23 of $250,150, and in FY24 of $169,129. In FY24, the City received $82,819 for the Assistance to Firefighter Grant (AFG) to install a diesel exhaust system in the new fire station.
2. DEPARTMENT OF TRANSPORTATION - These federal revenue-sharing funds are used for street planning and construction. During FY20, $312,356 in federal funds was received for the Ironbound Road Phase 1 Improvements and Monticello Multi-use Trail. During FY21, $404,870 in federal funds was received for the Capitol Landing Road Improvements, Monticello Multiuse Trail, and the Francis Street Sidewalk/Trail. During FY23, $406,051 in federal funds were received for Capitol Landing Road Improvements; Citywide Flashing Yellow Arrow (FYA) Signals; Capitol Landing / Bypass Roads Intersection; Francis Street Sidewalk/Trail; and State of Good Repair Resurfacing on Jamestown Road, South Henry Street, and Richmond Road. During FY24, $256,329 in federal funds were received for Capitol Landing Road Improvements, Francis Street Sidewalk/Trail, South Henry Street, and College Woods Circuit.
3. DEPARTMENT OF TREASURY - The City received $2,609,358 of Coronavirus Relief Funds in FY20 and FY21. In FY22, $12,892,454 of State and Local Fiscal Recovery Funds (SLFRF) under the American Rescue Plan Act was received. The City received the final tranche of $5,527,208 of SLFRF in FY23. In FY24, the City received SLFRF funds in the amount of $268,000 to be used for tourism from the Virginia Tourism Corporation and $230,147 from the Department of Criminal Justice to be used for Police equipment.
The City provides fire and emergency medical services to William & Mary. As a state agency, the university is exempt from local taxation. Beginning in FY21, the university committed to providing financial support to the City in the amount of $165,000, with a 3% escalator each year to partially defray the cost of providing these essential services on campus. This agreement expires in December 2025 but may be renewed by the university for up to two additional five-year terms.
Code of Virginia §58.1-3840 allows cities or towns to charge excise taxes on admissions, which the City has proposed to implement starting in January 2026.

51000 SALARIES & WAGES
51001 Salaries
Compensation for all full-time employees who hold permanent positions.
51002 Salaries - Overtime
Compensation for overtime and holiday pay for all eligible employees. (Personnel Manual)
51003 Salaries - Part-Time Employees
Compensation for all part-time employees (less than 40 hours per week) who are paid on an hourly basis and are not eligible for all employee benefits. (Personnel Manual)
51005 Salaries - Temporary
Compensation for employees who are working on a temporary basis. (Personnel Manual)
51006 Discretionary Leave
Compensation for Police, Fire, or Water Plant personnel who must work on stated holidays. (Personnel Manual)
51008 Traffic Control
Compensation for police department personnel who work extra hours for traffic control purposes.
51009 Off-Duty Police Officers
Compensation for police personnel hired by outside establishments after regular working hours. (City is reimbursed by the contracting party.)
52000 FRINGE BENEFITS
52001 FICA
Employer’s share of Social Security Taxes.
52002 Virginia Retirement System (VRS)
Cost of contributions to Virginia Retirement System for all full-time employees. VRS enrollment is mandatory for all full-time employees and paid as a percentage of base salary.
52004 Dental
Costs for employee dental reimbursement program.
52005 Hospitalization
Cost for medical benefit package premiums, not including dental.
52006 Group Life Insurance
City’s cost for VRS group life insurance policy.
52009 Unemployment Insurance
Costs for unemployment insurance.
52010 Worker’s Compensation
Costs for worker’s compensation insurance.
52012 Clothing Allowance
Costs associated with the purchase of clothing by designated personnel.
52013 Education Allowance
Costs for tuition assistance.
53001
Costs associated with medical services such as physicals for certain employees.
Costs associated with the printing of forms, documents, manuals, etc.
53007 Advertising Costs for classified and legal advertisements.
53008 Laundry & Dry Cleaning
Costs associated with uniform rental.
53009 Purchase of Services
Costs for purchasing services and supplies from other governmental agencies. Does not include joint activities. 53013 Jurors, Commissioners, & Witnesses
Costs associated with court trials and legal disputes.
Garbage Contract Costs for garbage pick-up and disposal.
Costs for treatment of raw sewage by Hampton Roads Sanitation District. 53033 Exterminating Costs for extermination contracts for city-owned buildings. 53099 Detective Funds
Costs associated with police work.
& SERVICES
55101 Electricity
Costs of electricity (Dominion Energy).
55102 Heating Fuel
Purchase of natural gas and heating oil.
55103 Water & Sewer
Costs of water and sewer services.
55201 Postage
Stamps, stamped envelopes, postage meter costs, permit fees, etc.
55203 Telecommunications
Costs incurred for landline, cellular phone, and pager service.
55204 Radios
Cost of operating citywide radio systems.
55205 Emergency “911”
Costs of operating emergency lines for the dispatch operation.
55301 Boiler Insurance
Costs of insuring heating plants, generators, and other mechanical equipment.
55302 Fire Insurance
Costs of insuring buildings and contents against fire.
55305 Motor Vehicle Insurance
Costs of insurance for motor vehicles.
55306 Surety Bonds
Costs for surety bonds for certain city personnel.
55307 Public Officials Liability
Costs of insuring certain public officials against suits, etc.
55308 General Liability Insurance
Cost of insuring the City against certain accidents, etc.
55401 Office Supplies
Costs of office supplies such as envelopes, pens, pencils, paper, forms, etc. used in everyday office operations.
55402 Food & Food Service Supplies
Costs of providing miscellaneous food or supplies at the fire station.
55403 Agricultural Supplies
Costs for care and treatment of plants, lawns, landscaping, including small tools.
55404 Material & Lab Supplies
Costs for purchasing medical and laboratory supplies for appropriate city departments.
55405 Laundry, Housekeeping & Janitorial Supplies
Costs of custodial and housekeeping supplies, including light bulbs.
55406 Linen Supplies
Costs of linens used in Fire Department.
55407 Repair & Maintenance Supplies
Costs of building material supplies, paint, electrical, and plumbing supplies.
Costs
Costs
Costs of materials used by the Fire Department for fire prevention.
Costs of supplies for operation of Quarterpath Pool.
Costs of purchasing water meters for the Utility Fund. 55418 Litter Control
Costs associated with litter pickup.
Travel Expense
Mileage reimbursement – Based on IRS mileage rates. 55504 Travel – Conferences & Conventions
Costs for lodging, transportation, registration fees, and materials. All travel must have prior department head approval.
Colonial Behavioral Health (formerly Colonial Services Board)
Costs of City’s contribution to the community program.
55604 Contributions to Other Agencies
Donations to outside organizations approved by City Council.
55801 Dues & Memberships
Costs for dues and memberships in professional organizations.
55805 Other Costs (non-recurring) not budgeted under other accounts.
55838 Principal Repayment of long-term debt principal.
55839 Interest Interest payments on long-term debt.
55899 Joint Activity Payments to James City County for jointly operated departments and agencies.
57000 FIXED ASSETS
58001 Lease & Rental of Equipment Cost for temporary rental or lease of equipment (no leasepurchase agreements).
58002 Lease & Rental of Buildings Costs for rental or lease of office or storage space.
AGENCY/ORGANIZATION
LIST OF OTHER CONTRIBUTORS
Governed by the Compensation Board. The state pays a portion of salary, benefits, and some operating costs. The City pays salary supplements, in some cases, fringe benefits. Operating salaries for these officers are approved by the state.
The City provides office space for this officer and staff. The state reimburses the City for 50% of salary, fringes (except healthcare), and some operating expenses. The reimbursable portion of the commissioner’s salary is based on the 1980 salary amount divided in half plus any and all increases in pay since that date. The state pays 50% of the two full-time positions allowed based on population. A salary supplement is provided by the City. The state reimburses half the employer cost of VRS (Retirement), FICA, and Group Life insurance. The balance of fringes is paid by the City. The staff participates in all City employee programs (e.g., health insurance, deferred and workers’ compensation), including the Pay Plan.
The City, state, and James City County share in the local cost of the treasurer. The state reimburses 88% of state-approved salary, 100% of FICA match, and 46% of Virginia Retirement System (VRS) costs. JCC bills the City for a percentage of the non-reimbursable costs based on population. Office space is provided by both localities. The state reimburses the City for two-thirds of salary and fringes (except healthcare) for the City deputy treasurer, whose office is located in the Municipal Building. The City bills JCC for 25% of the nonreimbursable costs for salary and fringes associated with the City deputy treasurer position for work associated with Williamsburg/James City County Schools.
State
The state funds salaries and a portion of fringes and operating expenses for the Clerk and staff. A portion of fringe benefits is supplemented. Twelve positions in this office are fully state-funded. Two part-time positions are locally funded. All temporary part-time personnel costs are reimbursed by the state, but not permanent part-time positions. These part-time salaries and some fringes are paid by the City and County per the Courthouse Agreement (See Circuit Court).
JCC, State
JCC, State
The Compensation Board sets the salaries for the Commonwealth’s Attorney, four assistants, and four fulltime support staff. All positions receive a salary supplement, ranging from 1.5% to 61%, paid by the City and James City County based on population each year. In addition, the Victim’s Assistance program consists of three grant positions, which are supplemented locally. The balance of any fringes in excess of the amount provided by the state is paid by the City and JCC based on population per the courthouse agreement.
The joint Williamsburg/James City County Sheriff is responsible for courtroom security and serving civil warrants, but no longer handles jail facilities since the City became part of the Virginia Peninsula Regional Jail Authority. The City and JCC share local costs based on a population formula as provided in the City/County Joint Courthouse Agreement. Payroll and operating expenses have been administered by JCC since Jan. 1, 1998. The state compensation board will reimburse the county for state-approved salaries, benefits, and some operating expenses. Salary supplements and a portion of unreimbursed operating expenses are shared locally based on the Courthouse Agreement. Sheriff’s employees participate in the JCC’s worker compensation, health insurance, and Virginia Retirement System programs.
Board of Elections, State
JCC, State
The state pays the majority of the registrar’s salary. For FY25, salaries were reimbursed by the state at 77% for the Registrar and 82% for the Electoral Board members. No reimbursements are made for fringe benefits or operating expenditures. The Department of Finance files for reimbursement to the state Electoral Board annually. Staff participates in the City’s workers’ compensation, health insurance, and other employee benefit programs. The City provides accounting and payroll services.
The City and James City County share in the cost of the judge’s secretary, legal assistant, jurors, capital outlay, and operating expenses of this office. The judge’s salary is paid by the state. All courthouse personnel and operating costs are the responsibility of the local government and are split between the City and county based on population.
JCC, State
JCC, State
Juvenile Probation Office
State, JCC, York, Charles City, King William, King & Queen, Mathews, Gloucester, New Kent, Middlesex, Poquoson
JCC, York, and Gloucester counties, State Dept of Youth & Family Svcs.
VIRGINIA PENINSULA REGIONAL JAIL AUTHORITY
JCC, York County, Poquoson, Dept. of Corrections
The City and James City County share in the cost of operating expenses and capital outlay for this office per the Courthouse Agreement. The judge’s salary is paid by the state.
The City and James City County share in the cost of operating expenses for this office per the Courthouse Agreement. The Judge’s salary is paid by the state.
Salaries and fringes for this office are paid by the state. Local operating costs are shared between the City and James City County. For the District office, the City pays one-eleventh of the operating costs. In addition, the City pays actual juvenile detention expenses for the Merrimac Center through the Middle Peninsula Juvenile Detention Commission for City cases.
This Commission is funded through a state block grant, and member localities share operating costs based on utilization. Programs include Community Supervision and Psychological Services.
The City shares in the cost of operating this authority. VPRJA operates a regional jail on Route 143 in lower James City County. The City pays its share based on the number of prisoners held for crimes committed in the City.
18 Localities, State-Dept of Juvenile Justice
JCC, York County, Poquoson, New Kent Co., Charles City Co., and State
State, Newport News, JCC, York County, and Poquoson
State funds, JCC, York County, Poquoson Federal Funds, fee revenues
State, Fed Dept. of Social Services
This Commission operates the Merrimac Center, a 48-bed facility that provides secure juvenile detention services for localities in the 9th and 15th District Court Service Units. The City pays its share based on the number of juveniles held for offenses committed in the City.
This organization provides alternatives to incarceration to persons awaiting trial, pre-trial, post-trial and re-entry services, and substance abuse counseling to offenders.
The City’s contribution is based on a funding formula that apportions local share among district jurisdictions. Some monies are refunded based on generated revenues each year.
Colonial Behavioral Health is funded at the discretion of the Social Security Advisory Board. The funding request is based on population and usage.
Approximately 70% of personnel and operating costs are reimbursed by the state and federal governments.
JCC, State, Federal
JCC, York County, State, and generated revenues
United Way, State Housing Dept., JCC, York County, private donations
State and Federal funds, Newport News, Hampton, Poquoson, JCC, York County, private donations
JCC, York Counties
Local funding share is apportioned between the City and James City County based on the Joint Schools Agreement, as amended in 1991, 1996, 2001, 2007, 2012, 2017, and 2022. Historically, state support has been approximately 30% of the total school system cost, based on a formula and General Assembly appropriations. Federal funding is received and largely directed to categorical programs and received on a cost-reimbursement basis.
Cost-sharing by the City, James City County, and York County is governed by the 5th Amended Contract for Library Services based on circulation. Each jurisdiction pays for the capital costs associated with the library buildings located therein. The state contributes approximately 5% of total operating costs on a formula basis through the Library of Virginia.
This organization is funded at the discretion of the City Council, per the advice of the Social Services Advisory Board.
This organization is funded at the discretion of the City Council, per the advice of the Social Services Advisory Board.
This organization is funded at the discretion of the City Council, per the advice of the Social Services Advisory Board.
JCC, donations, State/Fed. grants
Public/private partnershippartner agencies, corporations, foundations, individuals, local gov’ts
United Way, private donations
JCC, York County, State funds
Endowments, generated revenue, private contributions
JCC, York County
This organization is funded at the discretion of the City Council, per the advice of the Social Services Advisory Board.
This organization is funded at the discretion of the City Council, per the advice of the Social Services Advisory Board.
This organization is funded at the discretion of the City Council, per the advice of the Social Services Advisory Board.
The authority is funded at discretion of City Council. The Authority administers the regional transit system serving residents, visitors, and students through fixed-routes and services for the disabled in the City, James City County, and the Bruton District of York County.
This foundation is funded at the discretion of the City Council through an annual application process, supporting projects and events that benefit residents and visitors, while generating revenue from related goods and services provided.
The Council is funded by sales and use tax as prescribed by the Code of Virginia §58.1-603.2. Fifty percent of the revenues collected are distributed to localities, and by agreement, the localities appropriate at least $126,600 annually to the Williamsburg Tourism Council to promote the area and its visitor-driven programming and events.
JCC, York County
JCC, York County
PLANNING DISTRICT COMMISSION AND METROPOLITAN PLANNING ORGANIZATION (MPO)
JCC, York County, Newport News, Poquoson, Hampton, Gloucester, Tidewater jurisdictions, State and Federal funds
The Chamber is funded by sales and use tax as prescribed by Code of Virginia §58.1-603.2. Fifty percent of the revenues collected are distributed to localities, and by agreement, the localities appropriate at least $402,000 annually to the Greater Williamsburg Chamber of Commerce to advocate, collaborate and create an environment in which business can grow and succeed.
The Authroity is funded by sales and use tax as prescribed by Code of Virginia §58.1-603.2. Fifty percent of the revenues collected are distributed to localities, and by agreement, the localities appropriate at least $1,450,000 annually to the HTRFA to oversee the construction and management of regional recreational facilities as part of the redevelopment of property alongside the Colonial Williamsburg Visitor Center.
The City's share is based on per capita membership assessment each year.
Hampton, Newport News, JCC, York County, Gloucester, Poquoson
State, Newport News, JCC, Poquoson, York County, Hampton
State, JCC, York County
JCC, State funds
ANIMAL CONTROL
These organizations are funded at the discretion of City Council.
HERITAGE HUMANE SOCIETY
JCC, York County, private donations
Virginia Peninsula Community College is funded at the discretion of City Council, based on population formula for improvements to parking and site, not including buildings.
This is a state agency and is primarily funded by the state. Historically, the CSWCD member jurisdictions have shared in the cost of funding one position.
The Commission is funded at the discretion of City Council. WAAC reviews all funding requests to make its recommendation and then monitors how the funds are spent. The City and James City County pay equal part contributions pursuant to an agreement.
The City pays James City County to provide animal control services under a mutual aid agreement.
The organization is funded at the discretion of City Council.
JCC, York County, Hampton, Newport News, Poquoson, and Middle Peninsula jurisdictions
JCC, York County, State grants, private donations, admission fees
JCC, York County, State grants, private donations
WILLIAMSBURG AREA MEDICAL ASSISTANCE CORPORATION (WAMAC)
JCC, State
The City's share is based on a budget formula adopted annually by the VPPSA Board of Directors.
The foundation is funded at the discretion of City Council.
CASA is funded at the discretion of City Council, per the advice of the Social Services Advisory Board.
The organization is funded at the discretion of City Council per the advice of the Social Services Advisory Board.
The City’s accounting system is organized on the basis of funds and groups of accounts, each of which is considered to be a separate accounting entity. The operations of each fund are accounted for by providing a separate set of self-balancing accounts, which comprise its assets, liabilities, fund equity, revenues, and expenditures or expenses. The various funds are grouped in the financial statements as follows:
GOVERNMENTAL FUNDS account for the expendable financial resources, other than those accounted for in proprietary or fiduciary funds. The Governmental Fund measurement focuses on determining financial position and changes in financial position, rather than on determining net income as would apply to a commercial enterprise.
GENERAL FUND accounts for all revenues and expenditures of the City that are not accounted for in other funds. Revenues are derived from general property taxes, other local taxes, licenses and permits, and revenues from other governmental units.
TAX) FUND accounts for scheduled major capital improvements for the upcoming year. Revenues are traditionally derived from the 1% Sales Tax monies collected monthly at the state level and interest earnings.
TOURISM FUND is a special revenue fund used to account for tourism tax revenue (half of the 1% Historic Triangle regional sales tax and $2 lodging tax). The expenditures in the Tourism Fund are for the purpose of funding tourism development projects.
PUBLIC ASSISTANCE FUND accounts for the activities of the City’s Department of Human Services. The majority of funding is provided by the federal and state governments
for social service programs. The remainder of its funding is provided by the City as an annual contribution from the General Fund.
AMERICAN RESCUE PLAN ACT FUND accounts for the activities funded by the State and Local Fiscal Recovery Funds provided by the federal government under the American Rescue Plan Act to respond to the impacts of the COVID-19 pandemic. This fund also includes ARPA funding for Municipal Utility Relief Funding and ARPA Tourism funding passed through from the Commonwealth of Virginia.
PROPRIETARY FUNDS, or Enterprise Funds, account for operations that are financed in a manner similar to private business enterprises. The Proprietary Fund measurement focus is upon the determination of net income, financial position, and cash flows. Enterprise funds account for the financing of services to the general public where all or most of the operating expenses involved are recovered in the form of charges to users of such services. The Utility Fund, consisting of the operations for water and sewer services, is the City’s only Enterprise Fund.
FIDUCIARY FUNDS (Trust, Custodial and Agency Funds) account for assets held by the City unit in a trustee capacity or as an agent or custodian for individuals, private organizations, other governmental units, or other funds. Agency Funds utilize the accrual basis of accounting and do not have a measurement focus. Agency Funds include the Williamsburg Regional Library, the Williamsburg Tricentennial Fund, Economic Development Authority, the Quarterpath Community Development Authority, the Historic Triangle Recreational Facilities Authority, and the Special Welfare Fund.
is employed as a management control device for the General Fund, Capital Improvement Plan Fund, Tourism Fund, Utility Fund, Quarterpath Community Development Authority Fund, and Public Assistance Fund. Annual operating budgets are adopted by ordinances and resolutions passed by City Council for those funds. Budgets are prepared on the same basis of accounting used for financial reporting purposes. The City does not integrate the use of encumbrance accounting in any of its funds. The original budgets and revisions, if any, are authorized at the department level by City Council. The City Manager has the authority to transfer funds within the departments, so long as the total appropriation for a department is not adjusted. All appropriations for operating budgets lapse at year-end to the extent that they have been fully expended. As capital projects can be multi-year, funds appropriated by City Council can carry over to future years for projects not completed each year, at the discretion of the City Manager.
GOVERNMENTAL FUNDS - Governmental Funds utilize the modified accrual basis of accounting under which revenues and related assets are recorded when measurable and available to finance operations during the year. Accordingly, real and personal property taxes are recorded as revenues and receivables when billed, net of any allowances for uncollectible amounts. Property taxes not collected within 45 days after yearend are reflected as deferred revenues, or uncollected property taxes. Sales and utility taxes are collected by the state or utilities and subsequently remitted to the City; they are recognized as revenues and receivables when collected by those entities, typically in the month prior to the City's receipt. Licenses,
permits, fines, and rents are recorded as revenues when received. Intergovernmental revenues, consisting primarily of federal, state, and other grants to fund specific expenditures, are recognized when earned or at the time of the specific expenditure. Expenditures are recorded as the related fund liabilities are incurred.
PROPRIETARY FUNDS - The accrual basis of accounting is used for the Utility Fund. Under the accrual method, revenues are recognized in the accounting period in which they are earned, while expenses are recognized in the accounting period in which the related liability is incurred.
FIDUCIARY FUNDS - The accrual basis of accounting is used for all Fiduciary Funds and they do not have a measurement focus.
Budgets are prepared on the same basis of accounting used for financial reporting purposes (Generally Accepted Accounting Principles or GAAP). There are some instances wherein the principles used for financial reporting purposes will differ from those used in budget preparation.
Under GAAP reporting requirements, changes in the fair market value of the City’s investments are treated as adjustments to revenue at fiscal year-end, and those effects are not considered (or known) in the budget process.
The other difference is the annual adjustment necessary to reflect the value of earned but unused vacation leave due to employees at fiscal year-end. Such amount would be paid upon an employee’s separation from the City but is not known or budgeted due to the unknown nature of employee’s use of vacation leave.
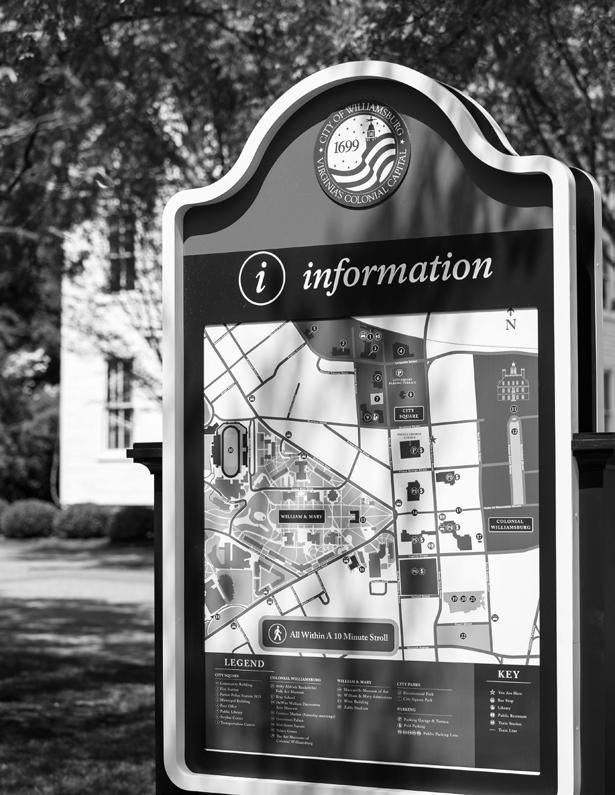
GOVERNMENTAL FUNDS
PROPRIETARY FUND ALL FUNDS
FIDUCIARY FUND
UTILITY FUND
QUARTERPATH COMMUNITY DEVELOPMENT AUTHORITY FUND
HISTORIC TRIANGLE RECREATIONAL FACILITIES AUTHORITY
GENERAL FUND
CAPITAL IMPROVEMENT FUND
SPECIAL REVENUE FUND
TOURISM FUND PUBLIC ASSISTANCE FUNDS
AMERICAN RESCUE PLAN FUND (ARPA)
a. The General Fund, the General Capital Improvement Plan (CIP), Utility Operating Fund, and the Utility CIP Fund are all subject to the annual budget process.
b. All operating and capital fund budgets must be balanced - total anticipated revenues plus fund balances or reserves brought forward must equal total estimated expenditures each year.
c. The Utility Fund (the City’s only Enterprise Fund type) will be self-supporting.
d. All budgets will be formulated and adopted in conformity with accounting principles generally accepted in the United States of America (US GAAP).
e. The budget process will include coordinating the development of the capital improvement budget with the development of the operating budget.
a. Budgets will be adopted annually, taking into consideration input from all organizational levels of the City. The Planning Commission will review current and future capital improvement projects and make recommendations to staff for input to the annual budget document.
b. The long-term revenue, expenditure, and service implications of continuing or ending existing programs or adding new programs, services, and debt will be considered while formulating all budgets annually.
c. Each year, the City will assess the condition of all major capital assets, including buildings, roads, bridges, water and sewer lines, vehicles, and equipment.
d. To estimate the City’s future financial position, the long-term impact of operating and capital spending will be analyzed with a five-year projection, concurrent with the formulation of all budgets.
e. The General Fund will maintain a minimum of 35% of total operating revenues as its unassigned fund balance.
f. Fund Balance of the General Fund shall be used only for emergencies, non-recurring expenditures, or major capital purchases that cannot be accommodated through current year savings.
The City will strive to maintain a diversified and stable revenue system to protect the City from short-run fluctuations in any one revenue source and ensure its ability to provide ongoing services.
a. The City will identify all revenue and grant options available each year.
b. All revenue collection rates, especially for real estate and personal property taxes, will be reviewed annually, and all efforts to maximize receipt of revenues due will be made by the Finance Department.
Fees will be reviewed and updated on an ongoing basis to ensure that they keep pace with changes in the cost of living as well as changes in methods or levels of service delivery.
a. For the rental of City properties, charges will be reviewed annually and compared with market rates for comparable space or property in the community. The City will consider annual escalator clauses in multi-year rental contracts to take into effect the impact of increases in the cost of living.
b. Building permit and inspection fees will be reviewed annually.
c. Recreation program charges will be reviewed annually. In general, all efforts will be made to provide programs and activities at an affordable level for the residents of the Williamsburg area while still recovering a major portion of incidental costs of programs, not to include administrative costs or the use of facilities.
i. Charges for specialty classes such as yoga, aerobics, dance, dog obedience, etc. will be set at a level to encourage maximum participation, and also enable 75% to 80% of program receipts to be used to compensate instructors.
ii. Team sports participation fees will also be set to encourage maximum participation, with approximately 80% to 90% of charges being used to defray costs of officiating, prizes and awards, scorekeepers, and team pictures.
d. The City’s Utility Fund will be self-supporting. Water and Sewer charges will be reviewed annually and set at levels which fully cover the total direct and indirect costs, including operations, capital outlay, and debt service.
3. Use of One-Time or Limited-Time Revenues:
a. To minimize disruptive effects on services due to non-recurrence of these sources, the City will not use one-time revenues to fund operating expenditures.
4. Real Estate Review Policy – See Section H
a. The City will finance all current expenditures with current revenues. The City will not shortterm borrow to meet cash-flow needs.
b. Future operating costs associated with new capital improvements will be projected and included in operating budgets.
c. Capital Improvement Plan budgets will provide for adequate maintenance of capital equipment and facilities and for their orderly replacement.
d. The budgets for all funds shall be controlled at the department level. Expenditures may not exceed total appropriations for any department without approval from the City Manager.
e. All operating fund appropriations will lapse at fiscal year-end. Any encumbered appropriations at year-end may be reappropriated by City Council in the subsequent year. Multi-year capital improvement projects may be carried forward in the subsequent year, at the discretion of the City Manager.
f. The City will include contingency line items in the General Fund, General CIP, and Utility Fund CIP, not to exceed $200,000, to be administered by the City Manager, to meet unanticipated expenditures of a non-recurring nature.
g. The City will maintain a budgetary control system to ensure adherence to the budget and will prepare and present to City Council monthly financial reports comparing actual revenues and expenditures with budgeted amounts.
The City will maintain the following standards on general government debt to ensure a higher level of financial security than that afforded by meeting minimum state standards:
1. DEBT AS A PERCENTAGE OF ASSESSED VALUE – Outstanding debt is divided by real estate assessed values as of the most recent Landbook.
2. DEBT SERVICE AS A PERCENTAGE OF GENERAL FUND OPERATING EXPENDITURES
– The total debt service for general government is divided by the total General Fund Operating Expenditures. Actual is based on actual debt service for the most recent audited fiscal year divided by total General Fund operating expenditures for the same period. General Fund operating expenditures equal the operating expenditures plus transfers out less any one-time expenditures financed with non-recurring revenues (i.e. Coronavirus Act Relief Funds).
3. 10-YEAR PAYOUT RATIO – The totaling principal payments of general government debt for the next 10 years is divided by the current outstanding debt.
Other standards adhered to by the City of Williamsburg for general government debt include the following:
1. A five-year Capital Improvements Plan (CIP) will be developed and updated annually, along with corresponding anticipated funding sources.
2. CIP projects financed by issuing general obligation bonds or other long-term debt, including lease-purchase obligations, will be repaid within a period not to exceed the expected useful life of the improvement. In consideration of bond issue cost, bond issues shall be appropriately sized, preferably not less than $3 million. Multiple projects may be grouped in a single bond issue.
3. To maintain a predictable debt service burden, the City will give preference to debt that carries a fixed interest rate. However, consideration may be given to variable-rate debt. Conservative estimates will be used in budgeting variable rate debt service interest expense. Variable-rate debt will be limited to no more than 20% of total outstanding debt.
4. The City’s outstanding debt will be reviewed for opportunities to refinance when interest rate conditions are favorable for producing debt service savings. Generally, refunding will be considered if the present value savings on the refunding issue exceed 3% of the refunded principal or if the refunding/restructuring favorably enhances the City’s financial sustainability.
5. The City will comply with SEC continuing disclosure requirements for all bond issues, including the annual filing of audited financial statements with the Municipal Securities Rulemaking Board and all national rating agencies that have assigned the City a bond rating.
*Revised policy adopted by City Council June 11, 2021
In recognition of its fiduciary role in the management of all public funds entrusted to its care, it shall be the policy of the City that all investable balances be invested with the same care, skill, prudence, and diligence that a discerning and knowledgeable person would exercise when undertaking an enterprise of like character and aims. Further, it shall be the policy of the City that all investments and investment practices meet or exceed all statutes and guidelines governing the investment of public funds in Virginia, including the Investment of Public Funds Act of Virginia and the guidelines established by the State Treasury Board and the Governmental Accounting Standards Board.
Copies of the City’s comprehensive investment policy, including the objectives, allowable investments, quality, maturity restrictions, prohibited securities, and additional requirements, are available at the Finance Department.
Sound financial management principles require that the City retains sufficient funds to provide a stable financial base at all times. Maintaining adequate fund balance levels is essential to mitigate risks (e.g., revenue shortfalls and unanticipated expenditures), ensure stable tax rates, and protect against reducing service levels. Fund balance provides resources during the time it takes to develop and implement a longer-term financial solution. Fund balance is also crucial in long-term financial planning and capital funding as credit markets carefully monitor fund balance levels to evaluate creditworthiness.
The Governmental Accounting Standards Board requires that the General Fund fund balance be classified according to five levels of constraints. The following classifications constitute the Fund Balance:
• NONSPENDABLE FUND BALANCE – Amounts that cannot be spent due to form, such as inventories and prepaid amounts, and amounts that must be maintained legally or contractually intact, such as the long-term portion of loans receivable and nonfinancial assets held for sale.
• RESTRICTED FUND BALANCE – Amounts constrained by external parties, constitutional provisions, or enabling legislation for a specific purpose.
• COMMITTED FUND BALANCE – Amounts constrained for a specific purpose by the City Council using its highest level of decision-making authority. It would require another action of the City Council to remove or change the constraints placed on the resources. Commitments must be established.
• ASSIGNED FUND BALANCE – Amounts constrained for a specific purpose by the City Manager, who the City Council has given the delegated authority to assign amounts. The amount reported as assigned should not result in a deficit in the unassigned fund balance.
*Adopted by City Council on June 9, 2011, amended June 9, 2022
• UNASSIGNED FUND BALANCE – Amounts not classified as nonspendable, restricted, committed, or assigned. Unassigned fund balance represents the residual fund balance after deducting the nonspendable, restricted, committed, and assigned fund balance categories. The General Fund is the only fund that would report a positive amount in the unassigned fund balance.
Funding Requirements of Unassigned Fund Balance and the Budget Stabilization Fund of the General Fund
• This policy establishes a minimum level for the General Fund unassigned fund balance and a Budget Stabilization Reserve. The General Fund unassigned fund balance shall be maintained at 35% of General Fund operating revenue as shown in the City’s most recent audited Annual Comprehensive Financial Report (Annual Report). Operating revenue will not include any substantial one-time revenue sources (such as Coronavirus Aid, Relief and Economic Security Funds, or American Rescue Plan Funds). The target for the Budget Stabilization Reserve is 5% of General Fund operating revenues (excluding any substantial one-time revenue), as shown in the City’s most recent audited Annual Report.
Funding Requirements of Unassigned Fund Balance of the General Fund
• The Budget Stabilization Reserve and Unassigned Fund Balance will be permitted to provide temporary funding for unforeseen emergency needs. The Budget Stabilization Reserve shall be exhausted before the unassigned fund balance is used.
• The use of unassigned fund balance should be restored as soon as reasonably possible. In determining the expediency of returning unassigned fund balance to the policy level, both the level of funding and the deficit’s size should be considered. The replenishment plan should consider the long-term forecast for both the operating budget and the capital improvement program. If feasible, the unassigned fund balance should be replenished within one or two years of use.
• The City Manager shall develop an explicit strategy to replenish the unassigned fund balance as part of each year’s budget and long-term financial plan.
• If the event that requires the use of reserves is not a temporary situation, the strategic plan for replenishing reserves should address how expenditures and revenues will be adjusted to match the new economic reality.
• The strategy development should consider any unintended consequences. Examples to consider are necessary reductions in service levels due to reduced expenditures, increased cost of delaying capital improvements, the potential safety and risk factors, the impact on employee morale or customer service, or other costs associated with staff reductions.
Monitoring and Funding
• City staff will report on compliance with this policy during the presentation of the Annual Comprehensive Financial Report (ACFR) at the regular meeting of City Council in December each year.
• The City shall annually demonstrate that it will comply with this policy based on its proposed Operating and Capital Budget for each year.
1. Special Revenue Fund
a. The Tourism Development Fund (TDF) will be established as a special revenue fund in the City Budget.
b. The TDF will be subject to the fiscal controls of the City and shall abide by the adopted Budget Policies of the City regarding financial planning, revenues, expenditures, debt, investment, and fund balance.
c. The TDF annual budget shall include a five-year financial plan, with year one being the budget appropriation and the following four years for planning.
d. Unspent or unallocated funds shall remain in the fund and be a carryover to the next fiscal year.
e. Funds can be used to pay debt service obligations and borrowing expenses associated with TDF projects.
f. Funds are subject to the City audit and Annual Comprehensive Finance Report (ACFR) policies and processes.
1. Purpose – The purpose of the Tourism Development Fund (TDF) is to increase patronage to restaurants, attractions, hotels, and events in the City of Williamsburg through financial assistance and reinvestment in tourism products, place-making projects, special events, and public-private partnerships.
2. Types of Expenditures Allowed
a. Development, expansion, or renovation of tourism products and infrastructure for tourism products
b. Place-making projects and events
c. Support projects and programs of the Economic Development Authority (EDA) for for-profit companies that meet the eligibility criteria and receive recommendations for funding
d. Administrative costs of up to 10% shall be retained by the City
*Adopted by City Council on August 10, 2017, amended February 14, 2019
3. Examples of Eligible Products
a. Streetscape renovations and enhancements
b. Transit improvements (bike share, pedestrian access, enhanced bus shelters)
c. Convention and group meeting facilities
d. Outdoor and indoor recreation facilities and amenities
e. Public parks
f. Tourism venues
g. Business improvement grants (through EDA)
h. Public art and place-making
i. Special events grants and marketing
j. Visitor infrastructure
k. Culinary arts incubators
l. Regional trails and cultural sites
m. Other projects that meet the eligibility criteria, demonstrate feasibility, and receive recommendation
1. Project Applications
The TDF application process will consist of two phases of application. The Phase 1 application is to establish eligibility and the Phase 2 process is to provide details necessary for staff and the TDF review committee to provide recommendations to City Council.
a. Phase 1 Application – At a minimum, the Phase 1 application will include information on the applying organization, the amount of funding requested, identify if the project is new or an expansion, a project description, and the initial project budget and construction values.
b. Phase 2 Application – At a minimum, the Phase 2 application will include information on project feasibility, room night calculations, marketing plan, business plan, drawings, photos, renderings, site plans, organization leadership, project management, detailed project description, description of the impact on local tourism, timeliness, project schedule, phasing, uniqueness of the project, the potential to stimulate other projects, letter of funding commitment, brand consistency, and methodology intended to capture visitation statistics provided.
2. Process requests for funding from the Tourism Development Fund shall follow the following process:
a. Submission of Phase 1 applications in March
b. Submission of Phase 2 applications in May
c. Tourism Development Grant Review Committee (TDGRC) application review, interviews, and site visits in June and July
d. TDGRC Review Committee application recommendation to City Council provided to the City Manager in September
e. City Council considers approval of projects in September
f. Funding appropriated and available to the TDF in October
1. PURPOSE OF THE REVIEW COMMITTEE – The Tourism Development Grant Review Committee (TDGRC) will review and evaluate proposals from applicants for Tourism Development Fund projects for the purpose of providing a recommendation to the City Council and City Manager for the budgeting and appropriation of funds. Recommendations shall be based on consistency and impact of the project and the purpose of the TDF.
2. APPOINTMENT – The TDGRC shall be appointed by the City Council and serve two-year terms. TDGRC members are eligible for re-appointment to serve three consecutive terms, six years. TDGRC members must be residents of the City, own or represent a City business, or represent an event that occurs in the City.
3. COMMITTEE COMPOSITION – The TDGRC shall consist of five members, with three members representing the tourism industry and two members being selected at-large.
4. EX-OFFICIO MEMBERS – A member of the Planning Commission and a member of the Economic Development Authority shall serve as ex-officio members of the TDGRC without a vote.
The Real Estate Tax Rate Review Policy commits to maintaining a fair real property tax rate to appropriately fund the City's services and initiatives, maintain an adequate reserve, and provide economic stability to the residents and businesses in the City.
The City of Williamsburg complies with Title 58.1, Subtitle III, Chapter 32, Article 9, §58.1-3321 A of the Code of Virginia, which requires cities to reduce their tax rate so that the revenue generated on reassessments (less new construction) is no more than 101% of the previous year’s tax levy. In lieu of reducing the tax rate, a city shall give notice of a proposed real property tax increase and public hearing.
Annually, as a part of the budget development process, the City shall review the real property tax rate for increase or reduction. The review shall include consideration of the following variables presented in priority order:
1. Reserve Balance – Projected balances for the unassigned fund balances in the General Fund and the Capital Improvement Fund (Sales Tax Fund)
2. Budget Stabilization – Projected balances in the:
a. General Fund budget stabilization line,
b. Capital Improvement Fund Plan stabilization line, and
c. Capital Improvement Fund Plan School CIP stabilization line
3. Fiscal Health – The year-end balances in each of the years depicted in the five-year financial plan for the General Fund and Capital Fund
4. Assessed Value – Increase or decrease in the average assessed value resulting in an effective real property tax rate increase or decrease
5. Economic Conditions – Anticipated changes in economic conditions on a national, state, or local level, such as a depression or a recession
The City’s operating revenue projections will be reviewed annually to determine if the projections for both the current budget year and the long-term forecast are modestly conservative and aligned with the economic forecast for the region. Indicators to be considered, but not limited to, are the Consumer Price Index (CPI), employment rates, and established and reputable forecasts from nonbiased industry experts including, but not limited to, the hotel and travel industry.
*Adopted by City Council June 10, 2021
Budgets will be developed to strategically achieve City Council’s Goals, Initiatives, and Outcomes. The City’s operating expenditures will be reviewed, and projections verified in regard to contractual increases, inflationary increases, and compensation packages that are sufficient to attract and retain quality employees and are competitive with other public-sector employers, and personnel budgeted at levels necessary for providing quality services. Budgets will not include unnecessary or excessive spending and costs. Costs associated with new services or increased service levels will be identified for the City Council’s consideration.
The City’s Capital Improvement Plan will include projects consistent with the City Council’s Goals, Initiatives, and Outcomes developed during the strategic planning process. The plan should include projects that maintain the City’s facilities and infrastructure; grow, maintain, or diversify the City’s economic base; support the City’s quality of services; and improve the quality of life for residents and visitors. Care should be taken to ensure the plan does not increase the cost in future budgets by delaying the necessary maintenance of the City’s assets.
The City maintains compliance with legal requirements and Fiscal Policies, particularly the Fund Balance and Debt Policies.
1. TARGET – Target working capital is equal to 75% (270 days, based on 360 days) of operating and maintenance expenses (not including depreciation), capital expenses, and debt service.
2. WITHDRAWAL & REPLENISHMENT OF RESERVES – To the extent that working capital remains above the target, 20% of the reserve may be used to fund significant capital improvement projects. For emergency repairs or unforeseen and sudden revenue shortfall of 10% or more, up to 30% of the reserve may be used in conjunction with a committed plan to restore working capital to the target level within three to five years. The plan to restore working capital will be submitted as part of the annual budget process.
3. REPORTING AND OVERSIGHT – Working capital target levels will be analyzed annually and reported to the City Council as part of the year-end financial report presentation.
*Amended June 10, 2021
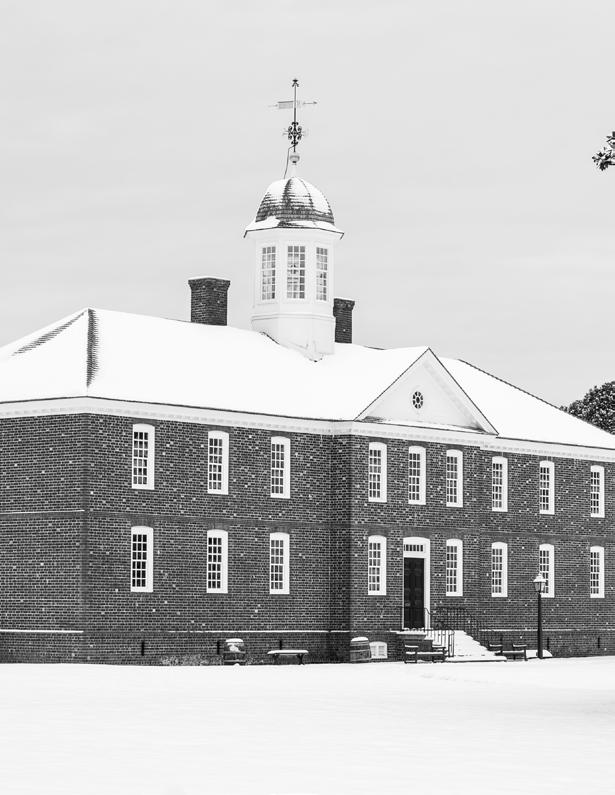

WHEREAS a proposed budget for the City of Williamsburg for the fiscal year ending June 30, 2026, has been prepared in accordance with § 15.2-2503, et seq. of the Code of Virginia (1950), as amended (the "Code"), and as required by Code § 15.2-2506; a brief synopsis thereof has been duly published, and a public hearing has been held at the regular meeting of City Council held on April 10, 2025; and
WHEREAS, the proposed budget for the fiscal year ending June 30, 2026, is based upon an increase in the City's total assessed value of real property and maintaining the real estate tax rate at $0.62 per $100.00 of assessed value; and
WHEREAS, at its April 10, 2025, session, and as required by Code of Virginia, Chapter 32 §58.1-3321, City Council held a separate, duly advertised public hearing regarding the increase in the total assessed value of real property; and
WHEREAS, based upon comments received from the public attending each of such hearings, and further based upon all the information known to City Council regarding the financial needs of the City for such fiscal year:
NOW, THEREFORE, BE IT RESOLVED that the City Council of the City of Williamsburg hereby adopts the proposed budget considered at the April 10, 2025, budget hearing with amendments as described in Exhibit 1.
A copy of the adopted budget shall be certified by and maintained by the Clerk of Council as part of the minutes of this May 8, 2025, session of City Council.
BE IT FURTHER RESOLVED, by the City Council of the City of Williamsburg, Virginia:
1. The City's real estate tax rate shall be $0.62 per $100.00 of assessed value of taxable real estate.
2. That revenues and expenditures are hereby appropriated by Fund as set forth in Schedule A, entitled: “Adopted Budget - Fiscal Year Commencing July 1, 2025."
3. That taxes shall be levied in the classifications and for the amounts set forth in Schedule B, entitled: "Local Tax Levies - Fiscal Year 2026.”
4. That revenues and expenditures for capital projects are hereby appropriated as set forth in Schedule C, entitled: "Capital Improvements Fiscal Year 2026."
5. That the number of full-time equivalent positions set forth in Schedule D entitled “Authorized FullTime Equivalent Positions FY 2026” shall be the maximum number of positions authorized for the various departments and divisions of the City during Fiscal Year 2026, and the number may be changed as authorized by the City Council. To improve the effectiveness and efficiency of service delivery, the City Manager is authorized to transfer or change existing positions throughout the fiscal year as may be necessary to implement organizational goals.
6. Flexible budgets are hereby authorized, whereby appropriations may be increased to the extent that offsetting grant revenues, insurance proceeds, donations, or police or fire compensation for special events are also appropriated.
7. That EMS Recovery rates will be set at 150% of the Medicare Part B Ambulance Fee Schedule.
8. That the City Manager shall administer this budget in strict adherence to the Charter and Code of the City of Williamsburg, as amended, and the laws of the Commonwealth of Virginia. Amendments to the budget as adopted shall be only by Resolution, provided further that the City Manager is authorized to approve transfers of appropriated expenditures between object codes within fund groups as may be necessary to carry out the work of the City as directed by the City Council during the coming fiscal year.
9. This resolution shall take effect upon its adoption by City Council.
PASSED AND ADOPTED by the City Council of the City of Williamsburg, Virginia, on May 8, 2025.
DUSTIE McCAY, CITY COUNCIL CLERK

DOUGLAS PONS, MAYOR
EXHIBIT 1 - SUMMARY OF REVISIONS TO PROPOSED BUDGET AS OF 5/8/2025
-$ 1,909,269
EXHIBIT 1 - SUMMARY OF REVISIONS TO PROPOSED BUDGET AS OF 5/8/2025 (CONTINUED)
FUND (SALES TAX) Initial
$ 33,164,026
-$ 6,400,000
EXHIBIT 1 - SUMMARY OF REVISIONS TO PROPOSED BUDGET AS OF 5/8/2025
9,989,686
3,400,000
7,211,284
CHANGES $ 1,086,284
EXHIBIT 1 - SUMMARY OF REVISIONS TO PROPOSED BUDGET AS OF 5/8/2025 (CONTINUED)
CDA FUND: NO CHANGES
TOURISM DEVELOPMENT FUND
PUBLIC ASSISTANCE FUND
QUARTERPATH CDA – FIDUCIARY FUND Revenues
(Special Assessments)
Assessments)
ON $100.00 OF ASSESSED VALUE OF TAXABLE REAL ESTATE, THE RATE SHALL BE $.62.
1. On purchase of electricity, the rate shall be $.70/month plus $.007468 per kWh for residential, and $1.15/month plus $.006947 per kWh for commercial and industrial users. The maximum charge for residential users is $1.00 per month and $20.00 per month for commercial and industrial users.
2. On purchase of gas, other than propane, the rate shall be $.70/month plus $.014 per ccf for residential users and $1.15/month plus $.0243 per ccf for commercial and industrial users. The maximum charge for residential users is $1.00 per month and $20.00 per month for commercial and industrial users.
3. On purchase of transient lodging, the rate shall be five (5) percent of the total amount paid for lodging.
4. On purchase of meals, the rate shall be five (5) percent of the total amount paid for meals.
5. On purchase of cigarettes, the rate shall be two cents ($.02) per cigarette for each cigarette sold in the city (forty cents ($.40) per pack of twenty (20) cigarettes).
1. On $100.00 of assessed value of taxable tangible personal property, including the property specifically classified by Section 58.1-3506 and Section 58.1-3507 of the Code of Virginia, the rate shall be $3.50. Assessed value of tangible personal property, including machinery and tools, but exclusive of motor vehicles will be 30% of acquisition cost. The assessed value of motor vehicles will be 100% of the J.D. Power (formerly NADA) average loan value. Motor vehicles specially equipped to provide transportation for physically disabled individuals, in compliance with City Code Section 18-29, shall be exempt from personal property taxation if such motor vehicle is licensed with special plates pursuant to Section 46.2-731 of the Code of Virginia, as amended. One motor vehicle owned and regularly used for transportation by any disabled veteran of the United Armed Forces (as defined by and in compliance with City Code Section 18-30) shall be exempt from personal property taxation.
2. On qualifying vehicles with assessed values of more than $1,000, Tax Relief shall be set at 21% and applied to the first $20,000 in value of each qualifying vehicle pursuant to Chapter 25 of Title 15.2 of the Code of Virginia.
3. On each $100.00 of bank net capital assessed as provided by law, the rate shall be eighty (80) cents per $100.00 as authorized by Sections 58.1-1208 and 58.1-1211 of the Code of Virginia.
The above tax rates shall also be applicable to real and tangible personal property of public service corporations, based upon the assessments generated annually by the State Corporation Commission, and duly certified.
This budget contains an increase in the transient lodging tax, from 5 to 7 percent, an increase in the meals tax from 5 to 6.5 percent, and an admissions tax at a rate of 10 percent, to be enacted in January 2026. These increases were duly advertised, and a public hearing held on such proposed increases at the April 10, 2025, meeting of the Williamsburg City Council. Such ordinances adopting these rate increases will be placed on the Jan. 8, 2026, City Council business meeting for adoption.
The Fiscal Years 2026-2030 internal water rate review looks at the utility fund's financial viability in terms of projected expenses and revenues and year-end working capital for each year of the next five-year period. The water rate was not increased last year, remaining at $5.30 per 1,000 gallons. However, the rate will increase to $6.89 per 1, 000 gallons for FY 2026. The City does not have a separate rate for sewer.
A. WATER SYSTEM – In an effort to identify future capital improvement needs, the City of Williamsburg began developing a Utility Master Plan. The master plan will provide a roadmap for the City to plan improvements and upgrades to meet the water and wastewater system's current and future needs. These needs have been identified and have been programmed into future years of the City’s capital improvement plan. Currently, the proposed five-year capital expenses for the water system amount to approximately $10.7 million. Large projects include the Waller Mill Dam Project and water main improvements along Capitol Landing Road, which will be funded via a transfer from the Utility Fund to the Capital Fund. Debt service is the other driver in capital expenses affecting the water rate.
B. SEWER SYSTEM – In addition to the water system, the utility master plan has identified capital improvement needs for the sewer system. The proposed five-year capital expenses for the sewer system amount to approximately $5.8 million. Large projects planned for the sewer system include major rehabilitations of City-owned sewer pump stations as well as force main replacements. Planned upgrades will reduce the frequency of sanitary sewer overflows, keeping the City in compliance with the memorandum of understanding (MOU) instituted by the Hampton Roads Sanitation District (HRSD).
The City does not treat its wastewater. Wastewater is pumped to HRSD for treatment. Effective in Fiscal Year 2026, City customers are billed separately by HRSD. Rates established by HRSD will continue to increase for the foreseeable future.
On the operating side, the Utility expects an increase (7%/year) in expenses over the next five-year planning period, to account for large cost increases due to previous years’ inflation. Future expense increases are due to regulatory requirements primarily aimed at water treatment at the Plant, an aging infrastructure, personnel expenses, and economic conditions, including inflation and increased interest rates. Regulatory requirements continue to affect Water Plant operations as more testing is mandated; in some cases, Water Plant procedures must be modified. The aging infrastructure requires more inspection and maintenance, and the City is proactive in maintaining and repairing/ replacing infrastructure. Expansion of the water and sewer systems, e.g., High Street, Quarterpath at Williamsburg, and York County developments, require more effort to operate and maintain.
Water demand in previous years has remained relatively flat because of the emphasis on water conservation through water-saving fixtures. The temporary decline in consumption due to the pandemic has reversed, and consumption has returned to pre-pandemic levels with a slight increase due to the completion of new development projects. Potential revenue from James City Service Authority was not included since water sales to the Authority are on an emergency basis only.
The fees are broken into three areas: availability fees, Hampton Roads Sanitation District (HRSD) fees, and connection fees. The availability fees are designed to have new development pay for capital improvements, which primarily benefit future customers. The HRSD wastewater facility charge is for new connections and covers the cost of treatment capacity expansion, line extensions, and pump stations. The third fee is the connection fee, which is the construction cost of the City installing the water and sewer connections to the customer’s property line.
The availability fees are based on meter size to reflect capacity and demand on the system. Several years ago, the City substantially increased the fees. This increase was predicated on new growth, paying equitably in the growth of the system, including securing a new water supply and the expenses associated with the capital investment in the utility system. A review of the City’s fees compared to other water purveyors in Virginia shows our fee structure to be in the average range. An increase in availability fees is not recommended for FY26.
HRSD establishes its fees and rates and reviews them each year. Their rates/fees are expected to increase because of the SSO Consent Order with the Environmental Protection Agency (EPA), and related work associated with the SWIFT initiative. The City elects to collect and forward their fees as well as usage charges for a “one-stop shopping” experience for City residents and businesses.
Finally, the water and sewer connection fees are the costs associated with the City installing water and sewer service lines. Service lines run from the main lines to the customer’s property line. In a new development, the developer installs the service line as part of the overall infrastructure of the development project. The City primarily installs service lines to infill development in existing subdivisions and small commercial sites. The water connection fee is based on meter size, while the sewer connection fee is more of a flat fee for residential or commercial construction. An increase is not recommended for FY26 since the fees are representative of the actual costs of constructing water and sewer service connections. The City’s connection fees are in line with other water and sewer purveyors in the region.
Working capital projections were developed for the next five-year period through 2030. The year-end working capital is essentially the Fund’s cash balance – the difference between short-term assets and liabilities.
Exhibit 1 shows working capital projections with a 30% increase in year one and an additional 10% increase per year over the five-year study period. This 10% figure is based on market assumptions
but could potentially change based on future market conditions and City Council approval. Working capital projections were developed using a 17.8% increase in revenue in year one, and approximately 7% increases in revenue thereafter, with 7% increases in expenses over the five-year period. Capital improvement expenses are based on recently submitted FY 2026-2030 CIP budget figures. Debt service and estimated water purchase costs are shown for the long-term water contract with Newport News Waterworks.
Exhibit 1 shows a reasonable estimated working capital balance for each year of the study period based on the City’s adopted target working capital policy. The policy states that the target working capital of at least 75% (270 days, based on 360 days) of operating and maintenance expenses (not including depreciation), capital expenses, and debt service. Although working capital is estimated to be under the target policy for future years, the City’s current working capital meets the policy. Maintaining a strong working capital balance is necessary to continue a viable enterprise, and working capital will be closely monitored.
Proposed FY26 HRSD rates were not available at the time of this report.
A comparison chart, prepared by the Hampton Roads Planning Commission, comparing the utility bills for other Hampton Roads communities is presented in Exhibit 2. Although the other localities are also in the process of evaluating rates for FY26, rates currently in place (FY25) are used for comparison purposes. Williamsburg remains well below all other Hampton Roads communities.
R. JACKSON REED DIRECTOR OF PUBLIC WORKS & UTILITIES
Assumptions:
0.5%
7.0%
Fiscal Year 2025 Water and Sewer rates for each locality within Hampton Roads. Total rates are labeled at the top of each bar. Totals were calculated as the sum of the locality water (purple) and sewer (yellow) contributions in addition to the HRSD bill (blue). The monthly bill was calculated for 5,000 gallons used by a single-family residence.
Source: Hampton Roads Planning District Commission
*Based on the adopted FY26 rate increase
ACCOUNT NUMBER – A numerical code identifying revenues and expenditures by fund, department, activity, type, and object.
ACCOUNTING SYSTEM – The total set of records and procedures that are used to record, classify, and report information on the financial status and operations of the City.
ACCRUAL BASIS OF ACCOUNTING – The method of accounting under which revenues are recorded when they are earned (whether or not cash is received at that time) and expenditures are recorded when goods and services are received (whether or not cash disbursements are made at that time).
ACTIVITY – One of the tasks, goals, etc., of a departmental program.
ALLOCATE – To set apart or earmark for a specific purpose.
APPROPRIATION – An authorization granted by the City Council to make expenditures and to incur obligations for purposes specified in the budget.
AMERICAN RESCUE PLAN ACT OF 2021 (ARPA) – Law signed on March 22, 2021, to provide funding to mitigate the continuing effects of the COVID-19 pandemic.
AMERICAN RESCUE PLAN FUND (ARP) – Fund created June 2021 to account for revenue and expenditures of the Coronavirus State and Local Fiscal Recovery Funds (SLFRF).
ASSESSMENT – The value set by the city assessor annually for a particular real property in the City.
BALANCED BUDGET – The city manager annually proposes, and the City Council adopts, a budget or financial plan for the upcoming year in which the revenues available, including any available fund balance from prior years, match or exceed the projected expenditures.
BOND – A type of financial security typically sold to finance capital improvement projects. Bonds evidence the issuer’s obligation to repay a specified principal amount on a set maturity date, together with interest at a stated rate, or according to a formula that determines that rate.
BOND RATING – An evaluation performed by an independent rating service of the credit quality of bonds issued. Ratings are intended to measure the probability of timely repayment of principal and interest on municipal securities.
BUDGET – A policy-setting document establishing a comprehensive plan for financial operations. The plan details an estimate of proposed expenditures for a given period and the proposed means of financing them. The City’s annual budget is established by City Council with a budget resolution.
BUDGET REVISION – A formal change in the total amount of budgeted expenditures during a fiscal year by action of City Council.
BUDGET STABILIZATION – Funds that may be used at City Council’s discretion to address temporary cash flow shortages during economic downturns, to fund one-time opportunities, and to provide flexibility in funding opportunities that help achieve the City’s goals.
BUDGET TRANSFER – A formal transfer from one activity to another, without changing a department’s budget total. Transfers are approved at the city manager level and do not require action by City Council.
– A tax on the privilege of doing business within the City. The tax is administered by the Commissioner of the Revenue.
CAPITAL ASSETS – Assets of long-term character that are intended to continue to be held or used, such as land, buildings, infrastructure, vehicles, machinery, furniture, and other equipment.
– A five-year program developed to guide spending for the scheduled major capital improvements for the upcoming year, such as, but not limited to, buildings, parks, and streets. The CIP also identifies financing sources for these projects. The CIP budget is adopted as a one-year appropriation as part of the five-year plan to authorize expenditures for the projects in the first year of the program. In Williamsburg, the CIP Fund was formerly known as the Sales Tax Fund as the 1% retail sales tax revenue returned to the locality from the Commonwealth of Virginia are budgeted in this fund.
CAPITAL PROJECT – A long-term, capitalintensive project that is relatively large and permanent in nature. For example: street improvements, sidewalks, bridge rehabilitation, buildings, park improvements, and City vehicles. Capital improvements are accounted for in either the Capital Improvement Plan Fund for general improvements, or the Utility Capital Improvement Fund for water- and sewer-related projects.
CARRYOVER – Refers to the process of transferring specific funds and obligations previously approved by City Council from the end of one fiscal year to the next fiscal year.
(CDBG) – A grant program funded by the U.S. Department of Housing & Urban Development (HUD). These grant funds are used in the City to improve housing, neighborhoods, and economic conditions of the
City’s low- and moderate-income residents. The City works exclusively with the Williamsburg Redevelopment & Housing Authority (WRHA), as the agency receives federal funds directly for CDBG projects.
CONSTITUTIONAL OFFICES – The offices or agencies directed by elected officials whose positions (sheriff, treasurer, Commissioner of the Revenue, etc.) are established by the Constitution of the Commonwealth of Virginia or its statutes.
CONTINGENCY ACCOUNT – A budgetary reserve set aside for emergencies or unforeseen expenditures.
CONTRACTUAL SERVICE – An expenditure for services performed by a non-employee. For example: computer, building, and copy machine maintenance, special studies, etc.
CARES – Coronavirus Aid, Relief, and Economic Security Act signed into law on March 27, 2020, to provide funding to alleviate the economic effects of the COVID-19 pandemic.
COVID-19 – The name given by the World Health Organization (WHO) on February 11, 2020, for the disease caused by the novel coronavirus SARS-CoV-2. COVID-19 emerged in December 2019 and caused a worldwide pandemic with health, economic, and social implications.
DEBT SERVICE – The annual payment of principal and interest that the City pays on funds borrowed for capital projects.
DEFICIT – The excess of an entity’s liabilities over its assets or the excess of expenditures over revenues during a single accounting period.
DEPARTMENT – The department is the primary administrative unit in City operations. Each is directed by a department head. Departments are generally composed of divisions of activities that share a common purpose.
DEPRECIATION – (1) Expiration in the service life of capital assets attributable to wear and tear, deterioration, action of the physical elements, inadequacy or obsolescence; (2) that portion of the cost of a capital asset which is charged as an expense during a particular period.
ENCUMBRANCES – An obligation or commitment, typically in the form of a purchase order, which commits current appropriated funds for a future payment. The purpose of encumbrance accounting is to prevent budget overspending.
ENTERPRISE FUND – A self-supporting fund for which a fee is charged to external users for good and services.
EXPENDITURE – A decrease in net financial resources. The outflow of funds paid or to be paid for an asset or goods or services obtained regardless of when the expense is actually paid.
FAMILIES FIRST CORONAVIRUS RESPONSE
ACT, (FFCRA) – Law passed on March 18, 2020, that provides funding for the ongoing economic consequences of the COVID-19 pandemic, requirements for expanded sick leave, and other provisions.
FINANCIAL POLICY – The City’s policy in respect to taxes, spending, and debt management as related to the provision of City services, programs, and capital investment and financing.
FISCAL YEAR (FY) – The 12-month period on which the City operates its financial affairs. At the end of the period, the City determines its financial position and results of its operations. The City of Williamsburg’s fiscal year is July 1 through June 30.
FIXED ASSET – An expenditure for a good that has an expected life of more than one year and the cost of which is over $5,000. Examples include real property, office equipment, and vehicles.
FRINGE BENEFITS – Job-related benefits, in addition to wages or salary, provided to employees as part of their total compensation. (i.e., FICA, retirement, health, life, dental insurance, etc.).
FULL-TIME EQUIVALENT (FTE) – The percentage of time a staff member works represented as a decimal. A full-time authorized staff position is 1.00, equating to 2,080 hours of work per year (2,912 for uniformed firefighters) a half-time person is .50 and a quarter-time person is .25.
FUND – A fiscal and accounting entity with a self-balancing set of accounts recording cash and other financial resources which are segregated for the purpose of carrying on specific activities or attaining certain objectives.
FUND BALANCE – The equity of a fund. It is the excess of a fund’s assets over its liabilities. Fund Balance is calculated by taking the beginning balance as of the beginning of the fiscal year, adding in all revenues received during the year, and deducting the year’s expenditures. Fund balance is categorized based on the type and source of constraints placed on how the resources can be spent. There are five categories: nonspendable, restricted, committed, assigned, and unassigned fund balance.
GENERAL FUND – The fund type that accounts for the daily operations of the City, supported by local taxes, fees, and state revenues. This fund includes all revenues and expenditures not accounted for in specific purpose funds and is the largest fund in the City’s budget.
PRINCIPLES (GAAP) – The uniform set of accounting principles, standards and procedures used for financial accounting, recording, and reporting purposes.
– To advance the City’s vision, every two years the Williamsburg City Council identifies and adopts new strategic objectives for City government. The biennial Goals, Initiatives, and Outcomes (GIOs) provide an expression of City priorities, as specific and measurable as possible, covering a two-year period.
BOARD (GASB) – A nonprofit organization organized in 1984 as an operating entity of the Financial Accounting Foundation (FAF) to establish standards of financial accounting and reporting for state and local governmental entities.
ASSOCIATION OF THE UNITED STATES AND CANADA (GFOA) – An association of government finance officials with the mission to advance excellence in public finance.
GOVERNMENTAL FUNDS – Funds generally used to account for tax-supported activities. There are five different types of governmental funds: the general fund, special revenue funds, debt service funds, capital projects funds, and permanent funds.
GRANT – A contribution by a government or other organization to support a particular function.
HISTORIC TRIANGLE SALES TAX – A retail sales and use tax of 1% imposed in the Historic Triangle enacted by the General Assembly of Virginia in Section 58.1-603.2 of the Code of Virginia. Fifty percent of the revenue is distributed to the locality in which the sales tax was collected, and the other 50% is deposited into the Historic Triangle Marketing Fund. The purpose of the Historic Triangle Marketing Fund is to market, advertise, and promote the Historic Triangle area as an overnight tourism destination.
HISTORIC TRIANGLE – The City of Williamsburg and the Counties of James City and York.
HISTORIC TRIANGLE MARKETING FUND –
Funded by one-half of the 1% sales tax imposed by Section 58.1-603.2 of the Code of Virginia and one-half of the transient occupancy tax imposed by Section 58.1-3828.3(C) of the Code of Virginia. Money in the fund is to be used solely for marketing, advertising, and promoting the Historic Triangle Area as an overnight tourism destination.
INFRASTRUCTURE – Public fixed assets such as bridges, curbs and gutters, streets, sidewalks, drainage systems, and lighting systems installed for the common good.
LINE ITEM – An individual expenditure (or expense) category listing in the budget (salaries, supplies, etc.).
MAINTENANCE OF EFFORT FUNDS – Funds appropriated by a locality in the Historic Triangle in the Fiscal Year 2018 for use by the Greater Williamsburg Chamber of Commerce (Chamber), formerly known as the Greater Williamsburg Chamber and Tourism Alliance. Maintenance of Effort Funds are significant because Section 58.1-603.2 D(2) of the Code of Virginia requires localities in the Historic Triangle to maintain this level of funding for the Chamber. For the City of Williamsburg, this funding amounts to $800,000.
MAJOR FUND – Governmental or enterprise fund reported as a separate column in the basic fund financial statements and subject to a separate opinion in the independent auditor’s report. The general fund is always a major fund.
– A basis of accounting used for governmental funds in which (a) revenues are recognized in the accounting period in which they become available and measurable and (b) expenditures are recognized in the accounting period in which the fund liability is incurred, if measurable, except for unmatured interest on general long-term debt and certain similar accrued obligations, which should be recognized when due.
NONSPENDABLE FUND BALANCE –
Amounts that cannot be spent due to form, for example, inventories and prepaid amounts; long-term loan and notes receivables, and property held for resale unless the proceeds are restricted, committed, or assigned; and amounts that must be maintained intact legally or contractually (corpus or principal of a permanent fund).
PAY-AS-YOU-GO – Also known as “paygo.” Refers to the method of financing capital projects from savings or normal cash flow. This requires annual appropriation of existing resources without the need to borrow funds.
PERSONAL PROPERTY – A category of property identified for purposes of taxation in Virginia. It comprises personally owned vehicles, as well as corporate property and business equipment. Examples include automobiles, motorcycles, trailers, boats, airplanes, business furnishings, and manufacturing equipment.
REAL PROPERTY – Real estate, including land and improvements, classified for purposes of assessment.
RESTRICTED FUND BALANCE – Amounts constrained for a specific purpose by external parties, constitutional provision, or enabling legislation.
REVENUE – Funds that the government receives as income. It may include taxes, fees for services, fines, receipts from other governments grants and interest income.
SALES TAX FUND – see CAPITAL IMPROVEMENT PLAN.
SPECIAL REVENUE FUND – A governmental fund used to account for the proceeds of specific revenue sources that are legally restricted or committed to expenditure for specific purpose such as grants for specific programs.
SUPPLEMENTAL APPROPRIATION – An increase to a department’s budget (spending authority) approved by City Council during the course of the fiscal year. It generally involves appropriation of a grant or other outside revenue.
SURPLUS – The excess of revenues over expenditures for a fund during a fiscal year.
TAXES – Compulsory charges levied by a government, school, sewer or other special district for the purpose of financing services performed for the common benefit.
TAX BASE – The total market value of real property (land, buildings, and related improvements), public service corporation property, and personal property (cars, boats, and business tangible equipment) in the City.
TAX LEVY – The total amount to be raised by either real or personal property taxes.
TAX RATE – The amount of taxes levied on a specific unit of cost (e.g., tax per $100 of assessed valuation, either real or personal property).
TAX RATE LIMIT TAX RATE – The maximum legal property tax rate at which a municipality may levy a tax. The limit may apply to taxes raised for a particular purpose or for general purposes. In Virginia, this is generally established in the Code of Virginia and by the governing authority (City Council).
TOURISM FUND – A Special Revenue Fund used to account for revenues and expenditures per City Council’s Tourism Development Fund Policy. Revenues of this fund include a transfer from the General Fund in support of tourism, one-half of the 1% Historic Triangle Sales Tax, and one-half of the $2 Lodging Tax.
TRANSFER – A transfer is a movement of monies from one fund, activity, department, or account to another. This includes budgetary funds and/or movement of assets.
balance that is available for any purpose. For the general fund, amounts not classified as nonspendable, restricted, committed, or assigned. The general fund is the only fund that would report a positive amount in unassigned fund balance.
– The state retirement system for public employees that provides its members with benefits at retirement or upon disability or death. Funding of the plan is provided by a 5% contribution from City employees and contributions from the City.
WORKING CAPITAL – Current assets less current liabilities. This measure indicates the relatively liquid portion of total enterprise fund capital, which constitutes a margin or buffer for meeting obligations.
WORKLOAD MEASURES – Represent the numerical inputs, outputs and/or outcomes of City operating programs.

ARPA – American Rescue Plan Act of 2021
BPOL – Business, Professional, and Occupational License Tax
CARES – Coronavirus Aid, Relief, and Economic Security Act
CDBG – Community Development Block Grant Program
CIP – Capital Improvement Plan
CSA – Children’s Services Act
DEQ – Department of Environmental Quality
DMV – Department of Motor Vehicles
DORA – Designated Outdoor Refreshment Area
EDA – Economic Development Authority
EMS – Emergency Medical Services
FFCRA – Families First Coronavirus Response Act
FHWA – Federal Highway Administration
FOIA – Freedom of Information Act
FTE – Full-Time Equivalent
FY – Fiscal Year. The City’s FY begins July 1 each year.
GAAP – Generally Accepted Accounting Principles
GASB – Governmental Accounting Standards Board
GFOA – Government Finance Officers Association of the United States and Canada
GIO – Goals, Initiatives, and Outcomes
HTRFA – Historic Triangle Recreational Facilities Authority
IT – Information Technology
JCC – James City County
NCS – National Community Survey
PC – Planning Commission
RFP – Request for Proposal
SBITA – Subscription-Based Information Technology Arrangement
SLFRF – State and Local Fiscal Recovery Funds
VDOT – Virginia Department of Transportation
VHDA – Virginia Housing Development Authority
VPRJ – Virginia Peninsula Regional Jail
VPSA – Virginia Public School Authority
VRS – Virginia Retirement System
WATA – Williamsburg Area Transit Authority
WRL – Williamsburg Regional Library