

Climate Resilience Toolkit
A Guide to Climate Resilient Land and Water Resource Management Planning
JENNY
LAUREN
Climate Change in Wisconsin
Communities across Wisconsin are feeling the widespread effects of climate change.
The Wisconsin Initiative on Climate Change Impacts (WICCI), a statewide collaboration of scientists and other key stakeholders evaluating the impacts of climate change, has documented the issues and impacts the warming climate has and will have in Wisconsin. The group compiled a peer-reviewed report projecting future climate scenarios as well as providing strategies to address these impacts.
KEY CLIMATE TAKEAWAYS
Wisconsin is 3° Warmer
On average, Wisconsin has become approximately 3° Fahrenheit warmer since the 1950s.
SETTING RECORDS
The last two decades have been the warmest on record, and the past decade has been the wettest.
17% INCREASE
IN PRECIPITATION
Wisconsin has become wetter –average precipitation has increased 17% (about 5 inches) since 1950.
Southern Wisconsin has experienced the highest increase in precipitation
Warming is happening fastest in the winter and at night.
Extreme Events
are causing immense impacts across the state, and the frequency of those events will generally increase.
By addressing these interconnected challenges through comprehensive planning, Wisconsin counties can build resilience to climate impacts while protecting natural resources, working lands, and community well-being.
Conservation as a Climate Solution
Conservation is one of our best tools to adapt to and mitigate the effects of climate change. Not only do conservation practices draw carbon dioxide from the atmosphere, they also offer numerous co-benefits such as ecological restoration, water quality enhancement, and wildlife habitat protection.
Building Resilience
With extreme weather events on the rise, building resilience is an essential component of any climate action planning. Climate resilience is the ability to prepare for, recover from, and adapt to the impacts of these weather events (c2es). Local-level conservation planning is at the forefront of reducing a community’s vulnerability while preventing impacts from growing worse.
Nature-Based Solutions
Conservation efforts serve as the foundation for naturebased solutions, which involve conserving, restoring, or better managing ecosystems to remove carbon dioxide from the atmosphere (AU). Examples include promoting the adoption of soil health-building agricultural practices, restoring wetlands, and preserving forests. Such practices serve to prevent greenhouse gas emissions and/or actively remove carbon dioxide from the atmosphere. Conservation practices offer a wide variety of opportunities to make a significant, measurable contribution to climate change mitigation, ultimately reducing the impacts on the environment and our local communities.
State Climate Action Plan
The Wisconsin Office of Sustainability and Clean Energy (OSCE) received a $3 million planning grant from the EPA to lead the development of a Priority Climate Action Plan (March 2024), a Comprehensive Climate Action Plan (by mid2025), and a Status Report (by mid-2027). The Priority Climate Action Plan (PCAP) built on previous state efforts including Wisconsin’s Clean Energy Plan and the Governor’s Task Force on Climate Change as well as Tribal and local government climate plans to identify strategies to reduce emissions in the state. The integration of climate action into county Land and Water Resource Management Plans supports the PCAP reduction Measure 6: Agriculture and Soil Solutions. By promoting and implementing climate smart practices, county conservation departments play an important role in supporting the state in obtaining the emissions reductions goals.
How to Use this Toolkit
This toolkit provides a framework and accompanying resources for integrating climate data and resilience planning into conservation planning. The toolkit is structured around three core components of land and water resource management planning: collecting and interpreting relevant data, identifying impacts and opportunities, and formulating goals and objectives for taking action. The resource assessment section provides tools and data sources for assessing climate impacts in your area, while the framework walks users through the process of identifying key resource concerns, opportunities for action, and adaptation strategies.
RESOURCE ASSESSMENT
Historic, Current, and Future Climate Trends
WICCI, NOAA, State Climatology Office, National Database Tools
RESOURCE CONCERNS
Potential Impacts, Vulnerabilities, and Adaptive Capacity of Systems
Prompting Question to Identify Opportunities
Goals, Objectives & Actions
Selecting Adaptations
Prompting Question to Identify Actions
DATA COLLECTION & INTERPRETATION IDENTIFYING IMPACTS & OPPORTUNITIES
TIPS FOR SUCCESS
Apply to Your Existing Planning Work
This toolkit is designed to be integrated into the 10-year Land and Water Resource Management Plan Update process and other Land and Water or climate resilience work (e.g., individual conservation projects, annual work plans, and 5-year plan reviews). Use some or all of the steps and resources provided here to apply a climate lens to the important planning work you are already undertaking.
Work With a Team
TAKING ACTION
Incorporating Climate Resilience in 10-year Land & Water Management Plans
Wisconsin law requires each county to have an approved 10-year land and water resource management plan (LWRMP). This planning toolkit is designed to complement the process that county conservation departments undertake for their 10-year plan update. The toolkit provides data tools and sources for the Resource Assessment section of the LWRMP as well as a workbook which guides planning teams in developing Goals and Objectives that promote climate resilience. For additional resources and relevant contacts, see this fact sheet
While much of the data gathering can be done by an individual staff person, identifying resource concerns, goals, objectives, and actions should be addressed by a team of stakeholders. The workbook provided in the Climate Planning Framework section is designed to be completed with others, such as a project team, technical advisory committee, or department.
Remember There Is No
“One Size Fits All” to Climate
Resilience
This toolkit provides many tools, resources, and potential adaptation strategies. You know your area best, so choose the tool(s) and solution(s) that make the most sense for your project and planning context!
Resource Assessment
Incorporating climate resilience into land and water planning requires data to characterize the conditions in your planning area. There are a number of resources available to help you understand how climate has changed in your area, what current climate conditions typically look like, and how climate is projected to change in the future. This section summarizes several helpful tools which can characterize the past, present, and future of climate in your area. Note that all of the tools are available at the county scale or finer.
PAST HISTORICAL TRENDS
PRESENT CURRENT CONDITIONS
FUTURE CLIMATE PROJECTIONS
STATE CLIMATOLOGY OFFICE WICCI
NOAA Climate at a Glance
Website: https://www.ncei.noaa.gov/access/monitoring/climate-at-a-glance/ SPATIAL SCALE: Nation, Region, State, Division, County, Major City FORMATS: Time-Series (Charts, Datasets)
NOAA’s Climate at a Glance tool provides historical climate data from 1895 to present-day at many different spatial scales, including at the county level. Most useful is the county time series feature which allows users to create exportable time series plots and datasets of different climate parameters for any county. The time scale, start and end years, and trendlines are all customizable.
Parameter: Average Temperature START YEAR : 1895 END YEAR : 2024 time scale: 12-Month month: December
Dane County, Wisconsin Average Temperature January-December
STATE: Wisconsin COUNTY: Dane County
TO USE
Select the Parameter of interest. The Time Scale determines the time period prior to the Month selected that will be averaged. For example, selecting Time Scale: 12-month and Month: December will give data points representing the annual average (January-December) for the years selected (see example above). Changing the Time Scale and Month allows you to see trends in different seasons. For example, selecting Time Scale: 3-month and Month: August will show trends for the summer months of June, July, and August. A trend line can be added for specified years. Note that WICCI uses 1950 as the start date when looking at long-term trends.
Wisconsin State Climatology Office (SCO)
Website: climatology.nelson.wisc.edu
Spatial Scale: State, Division, Station FORMATS: Time-Series (Charts, Datasets)
Based at University of Wisconsin-Madison, the SCO provides information and data, assists with interpretation of climate information, and conducts basic and applied research on Wisconsin’s climate.
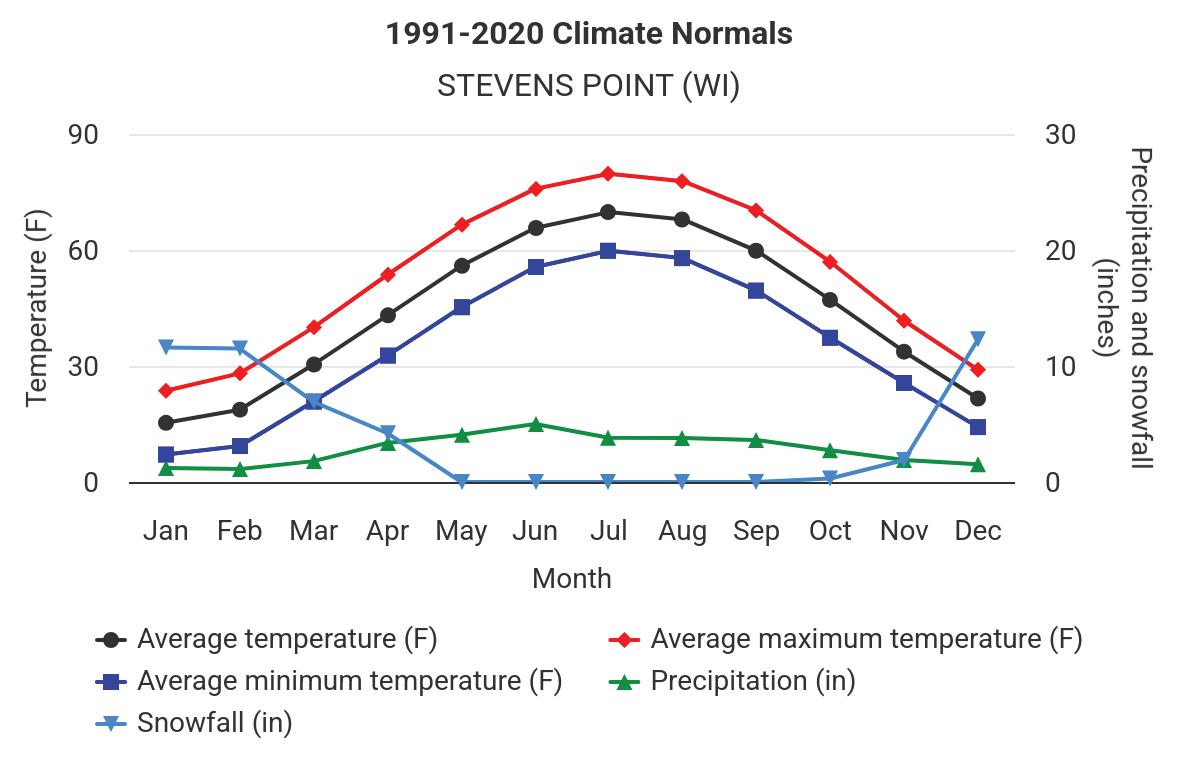
highcharts.com
Historical climate data
SCO provides a variety of historical climate data products for Wisconsin, available for download in chart or spreadsheet format. Long-term records and climate normals (recent, 30-year averages) are available for individual weather stations, with excellent state-wide coverage. SCO also provides longterm data for Wisconsin 9 climate divisions (sub-state regions).
Recent climate data
The Climatology Office provides many recent datasets (covering the last seven days to 12 months) and climate summaries for the state in addition to real-time data from a growing network of monitoring stations (Wisconet).

U.S. Drought MonitoR
Website: www.drought.gov/states/wisconsin
Spatial Scale: Nation, State, County Formats: Web Portal, Maps (PDF)
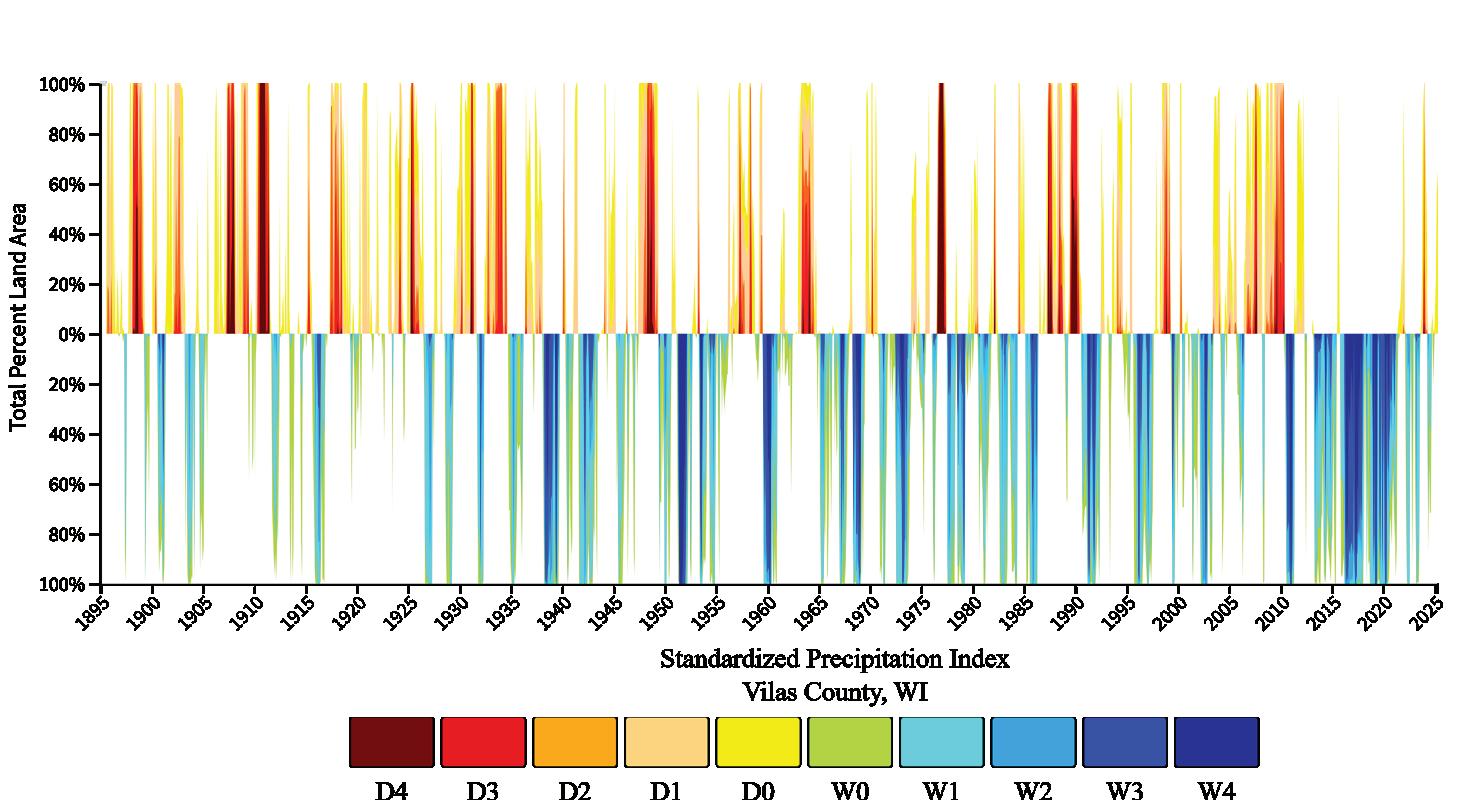
The U.S. Drought Monitor provides a range of presentday and recent climate and drought-related statistics. Data can be viewed at the statewide and individual county scale via the web portal and users can generate custom PDF maps at the county scale. The Drought Monitor provides a snapshot of current and recent past conditions in addition to comparisons to climate normals (recent 30-year averages). Users can also view historical trends in wet and dry conditions based on the Standardized Precipitation Index at the county scale.
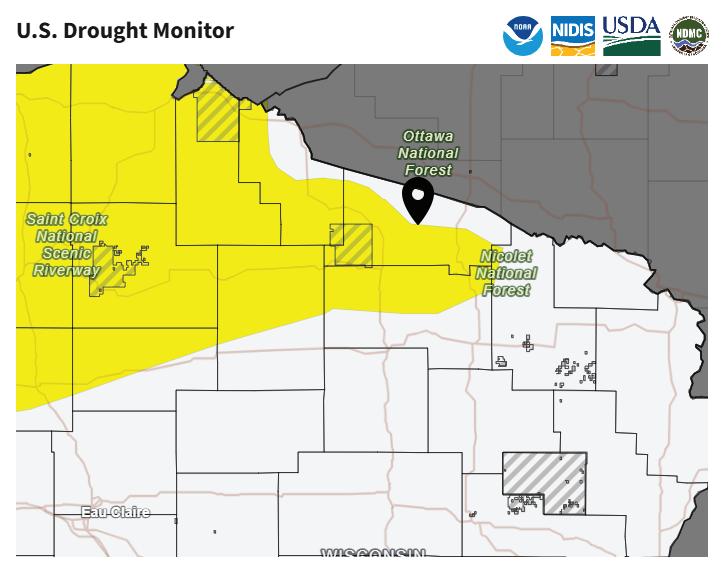
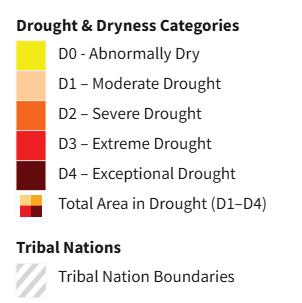
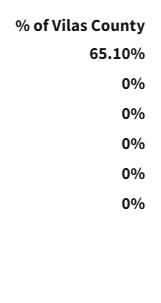
The U.S. Drought Monitor depicts the location and intensity of drought across the country using 5 classifications: Abnormally Dry (DO), showing areas that may be going into or are coming out of drought, and four levels of drought (Dl-D4).The U.S. Drought Monitor is a joint effort of the National Drought Mitigation Center, U.S. Department of Agriculture, and National Oceanic and Atmospheric Administration. Source(s): NDMC, NOAA, USDA Data Valid: 04/29/25 drought.gov
TO USE
Navigate to the Drought Conditions page for your county, which contains a variety of current, recent, and historical drought and climate data. To format and save a map or figure, right click on the map and select “Save Map.” Use the viewer to compile and format a customized map.
Historical drought conditions in Vilas County, 1895-2025
Current drought conditions in Vilas County, April 2025.
U.S. Drought monitor - HIstorical Drought Conditions
U.S. Drought monitor
Drought & Dryness Categories
Wisconsin Initiative on Climate Change Impacts (WICCI)
Website: wicci.wisc.edu
Spatial Scale: State, County FORMATS: Maps (PDF), GIS Data
WICCI is a statewide collaboration of scientists and stakeholders formed as a partnership between the University of Wisconsin (UW)-Madison and the Wisconsin Department of Natural Resources (WI DNR) to evaluate climate change impacts and solutions in Wisconsin.
Historical Trend Maps
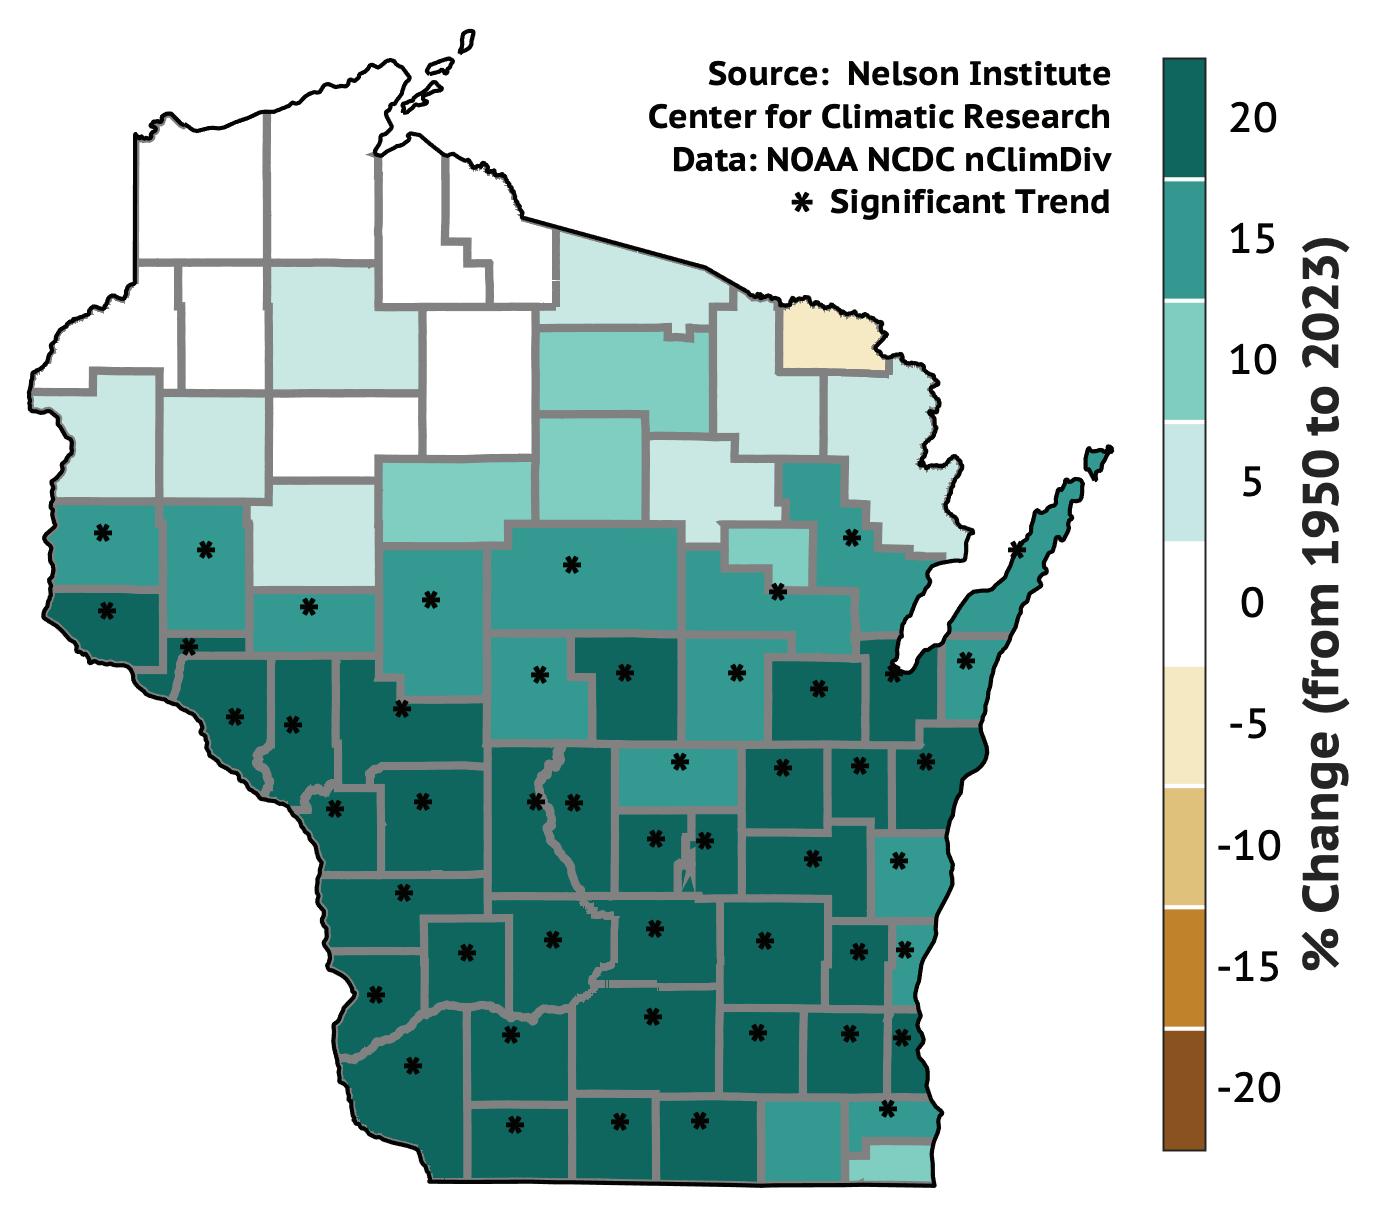
The WICCI Climate Working Group has prepared a series of PDF statewide maps showing historical trends for several temperature and precipitation parameters at the county scale. These maps show the change in each parameter from 1950 to 2023 and are based on data from the U.S. Climate Divisional Database, which can also be accessed in time-series format from the National Oceanic and Atmospheric Administration’s (NOAA) “Climate at a Glance” tool (see page 7).
HISTORIcal change in annual PRCP% from 1950 to 2023
GIS Data
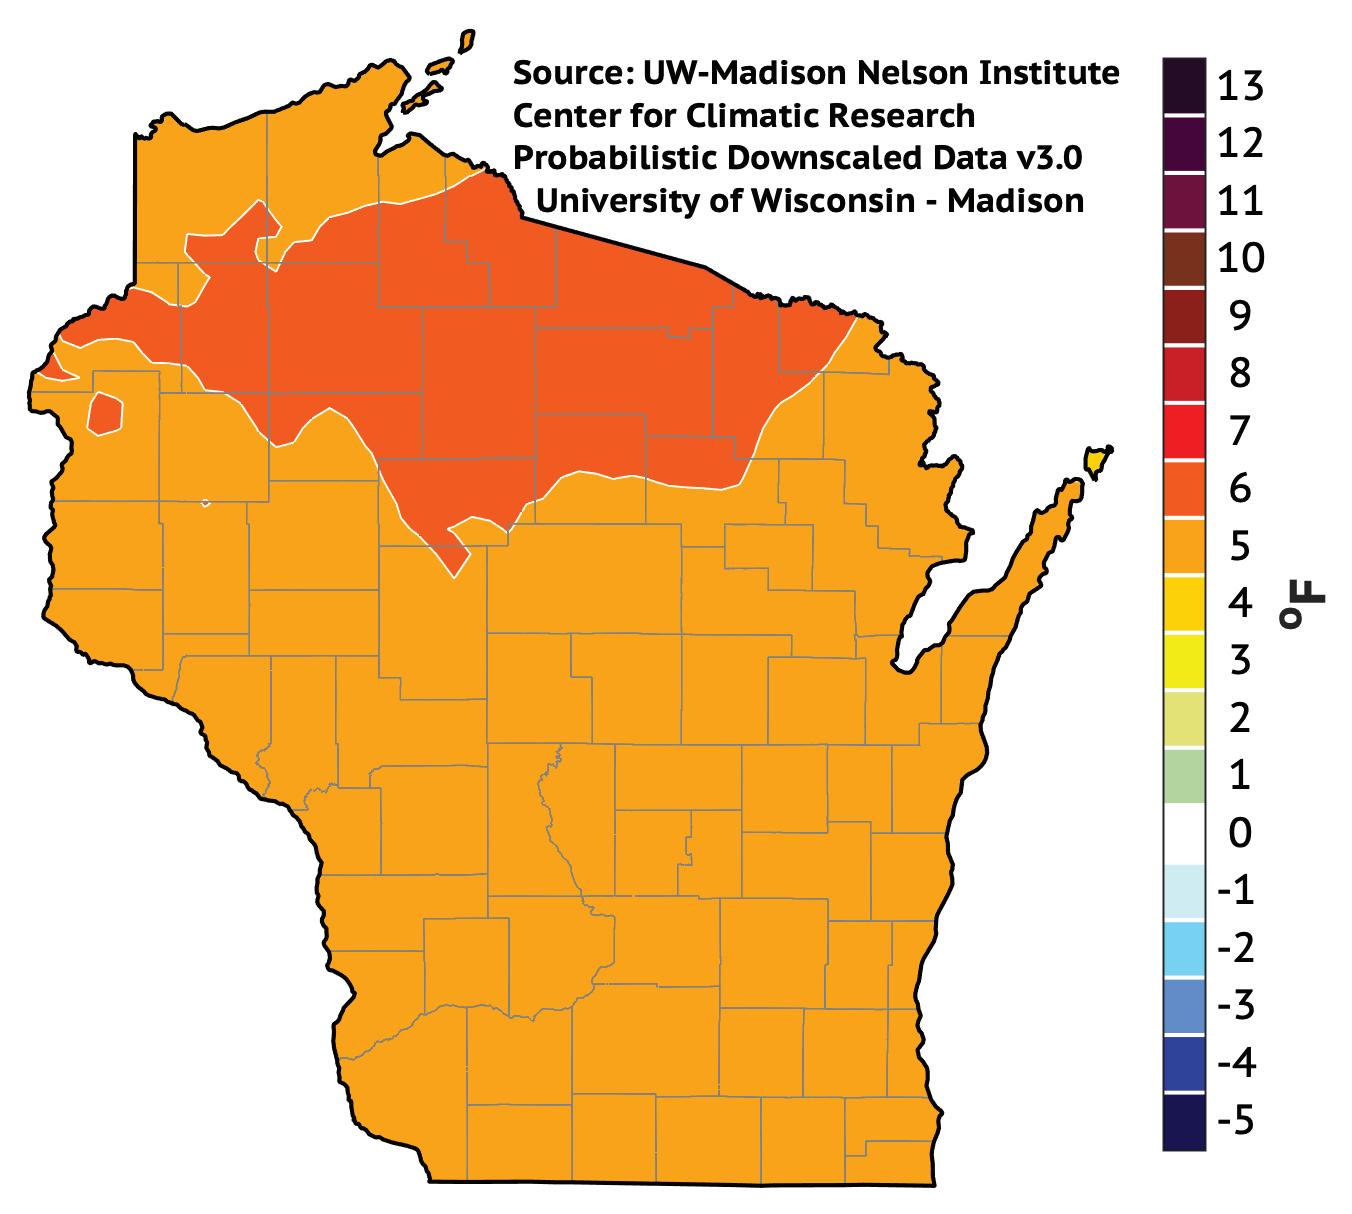
change in annual TMEAN, SSP245: 2041-2060 minus 1981-2010
Climate Projection Maps
WICCI has prepared a series of PDF statewide maps showing future climate projections for the mid-21st century (2041-2060) for several parameters. The maps use data from CMIP6 climate projections and show projected changes compared to recent 30-year historical averages (1981-2010).
Additional WICCI climate projections are also available as GIS-compatible datasets which can be used to create custom maps. These datasets are available to download from the State Cartographer’s Office GeoData@Wisconsin online geoportal.
Note: Climate projections are also available in similar formats from a number of national sources. See the Additional Resources section for an overview of other available projection mapping tools and resources.
THE Climate Explorer
Website: https://crt-climate-explorer.nemac.org/
Spatial Scale: County, City Formats: Map Viewer, Graphs
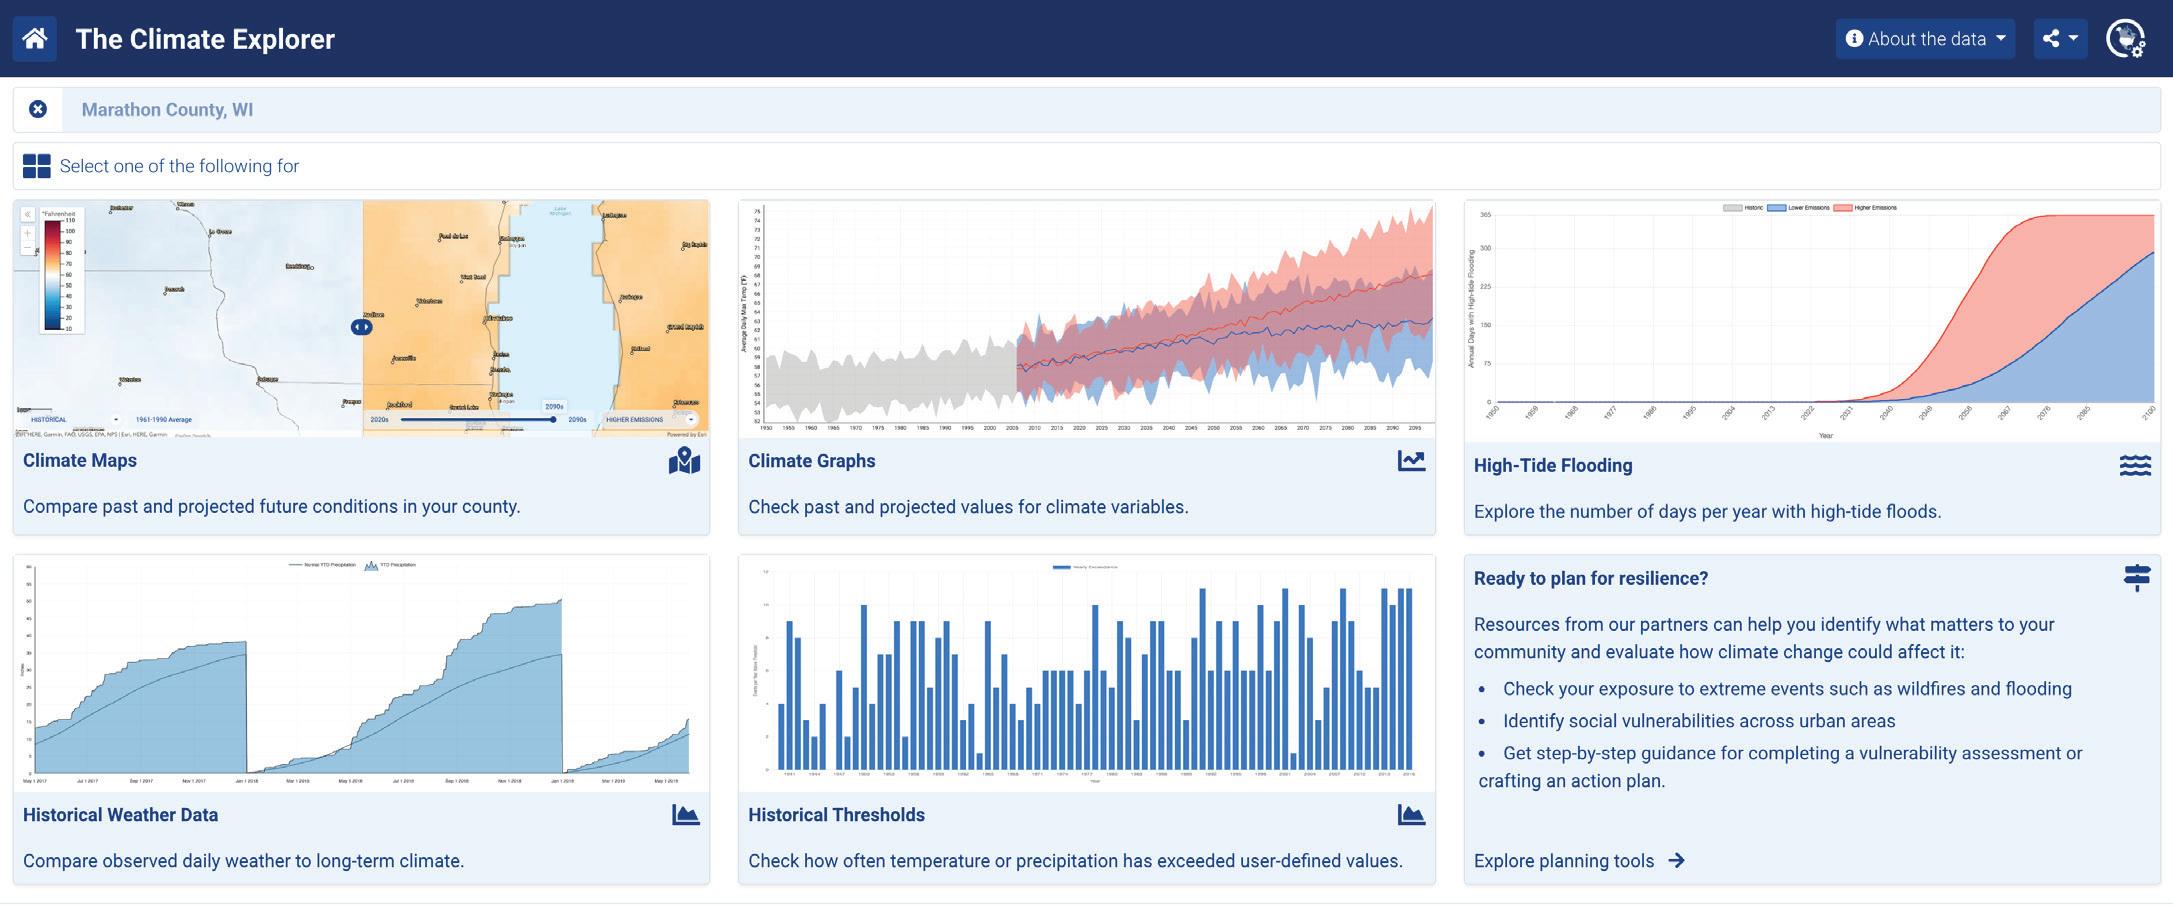
The Climate Explorer allows the user to explore interactive graphs and compare time-series maps showing climate projections and observations for any location in the contiguous United States, summarized by county. The Climate Explorer provides downscaled projection data at a county level using the same methods employed in the fourth National Climate Assessment. The tool allows you to explore historical temperature and precipitation observations at hundreds of climate stations. It also provides weather station data that you can query to examine thresholds of interest.
Map and Graphs
Climate Maps and Climate Graphs provide a variety of metrics for historical trends and future projections, using two emissions pathway scenarios (RCP 4.5 and RCP 8.5). The maps and charts are also downloadable images, which can be used and cited for your report. Extreme Events allows you to choose a reporting station within (or nearby) your area of interest and explore historical occurrences of extreme temperature and precipitation events.
To Use
When you enter The Climate Explorer, you will be asked to enter a location. Once you do, you will be provided with options for viewing climate data.
Plant Hardiness Zones
Website: https://planthardiness.ars.usda.gov/
Spatial Scale: Nation, State FORMATS: Maps (PDF), GIS Shapefiles
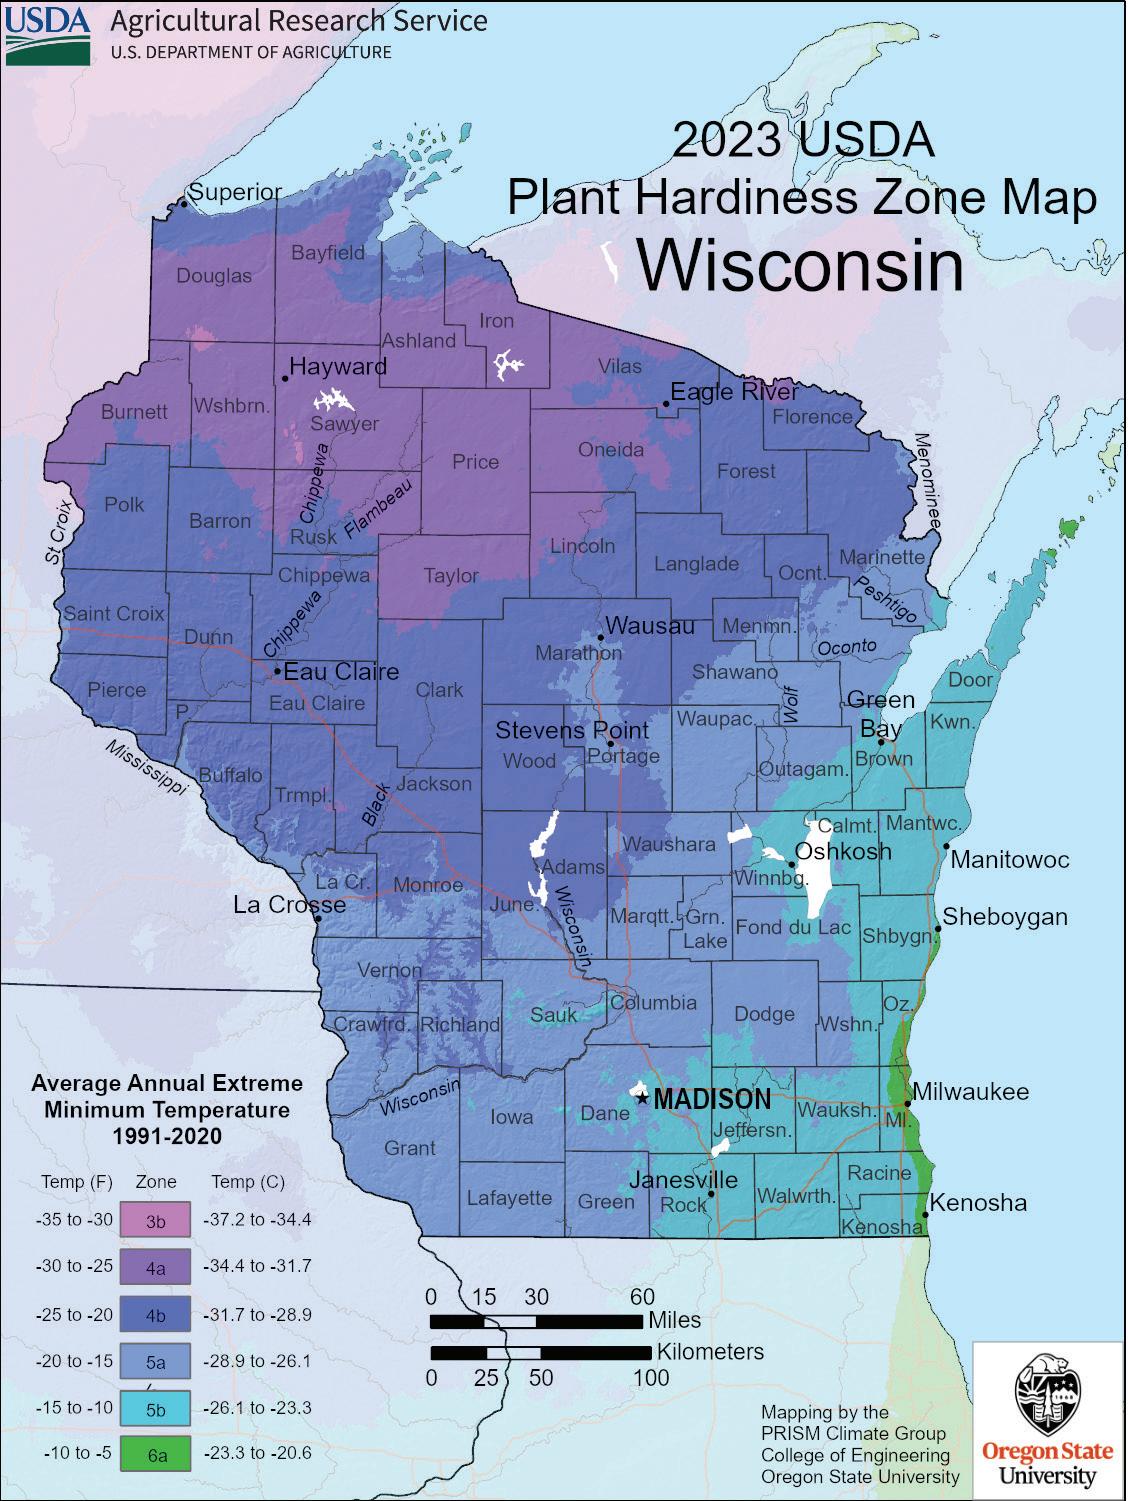
The USDA Plant Hardiness Zone Map (PHZM) is the standard by which growers can determine which plants are most likely to thrive at a location. The map can be used as a tool to support producers and landowners in selecting species that can best tolerate the local climate conditions and adapt to shifting climates, such as warmer winter temperatures.
The USDA updated the PHZM in 2023, revealing changes in the growing zones in Wisconsin and elsewhere since the last update in 2012 due to recent warming trends. 2023 statewide maps are available for download and the USDA provides additional guidance on how to use and interpret the maps.
GIS Data
If interested in preparing custom maps at a smaller spatial scale (e.g., county) or comparing the 2023 update against the 2012 zones, both datasets can be downloaded as GIS shapefiles from the PRISM Climate Group at Oregon State University website
National Risk Index for Natural Hazards
Website: https://hazards.fema.gov/nri/
Spatial Scale: County, Tract Formats: Map Viewer, Tables
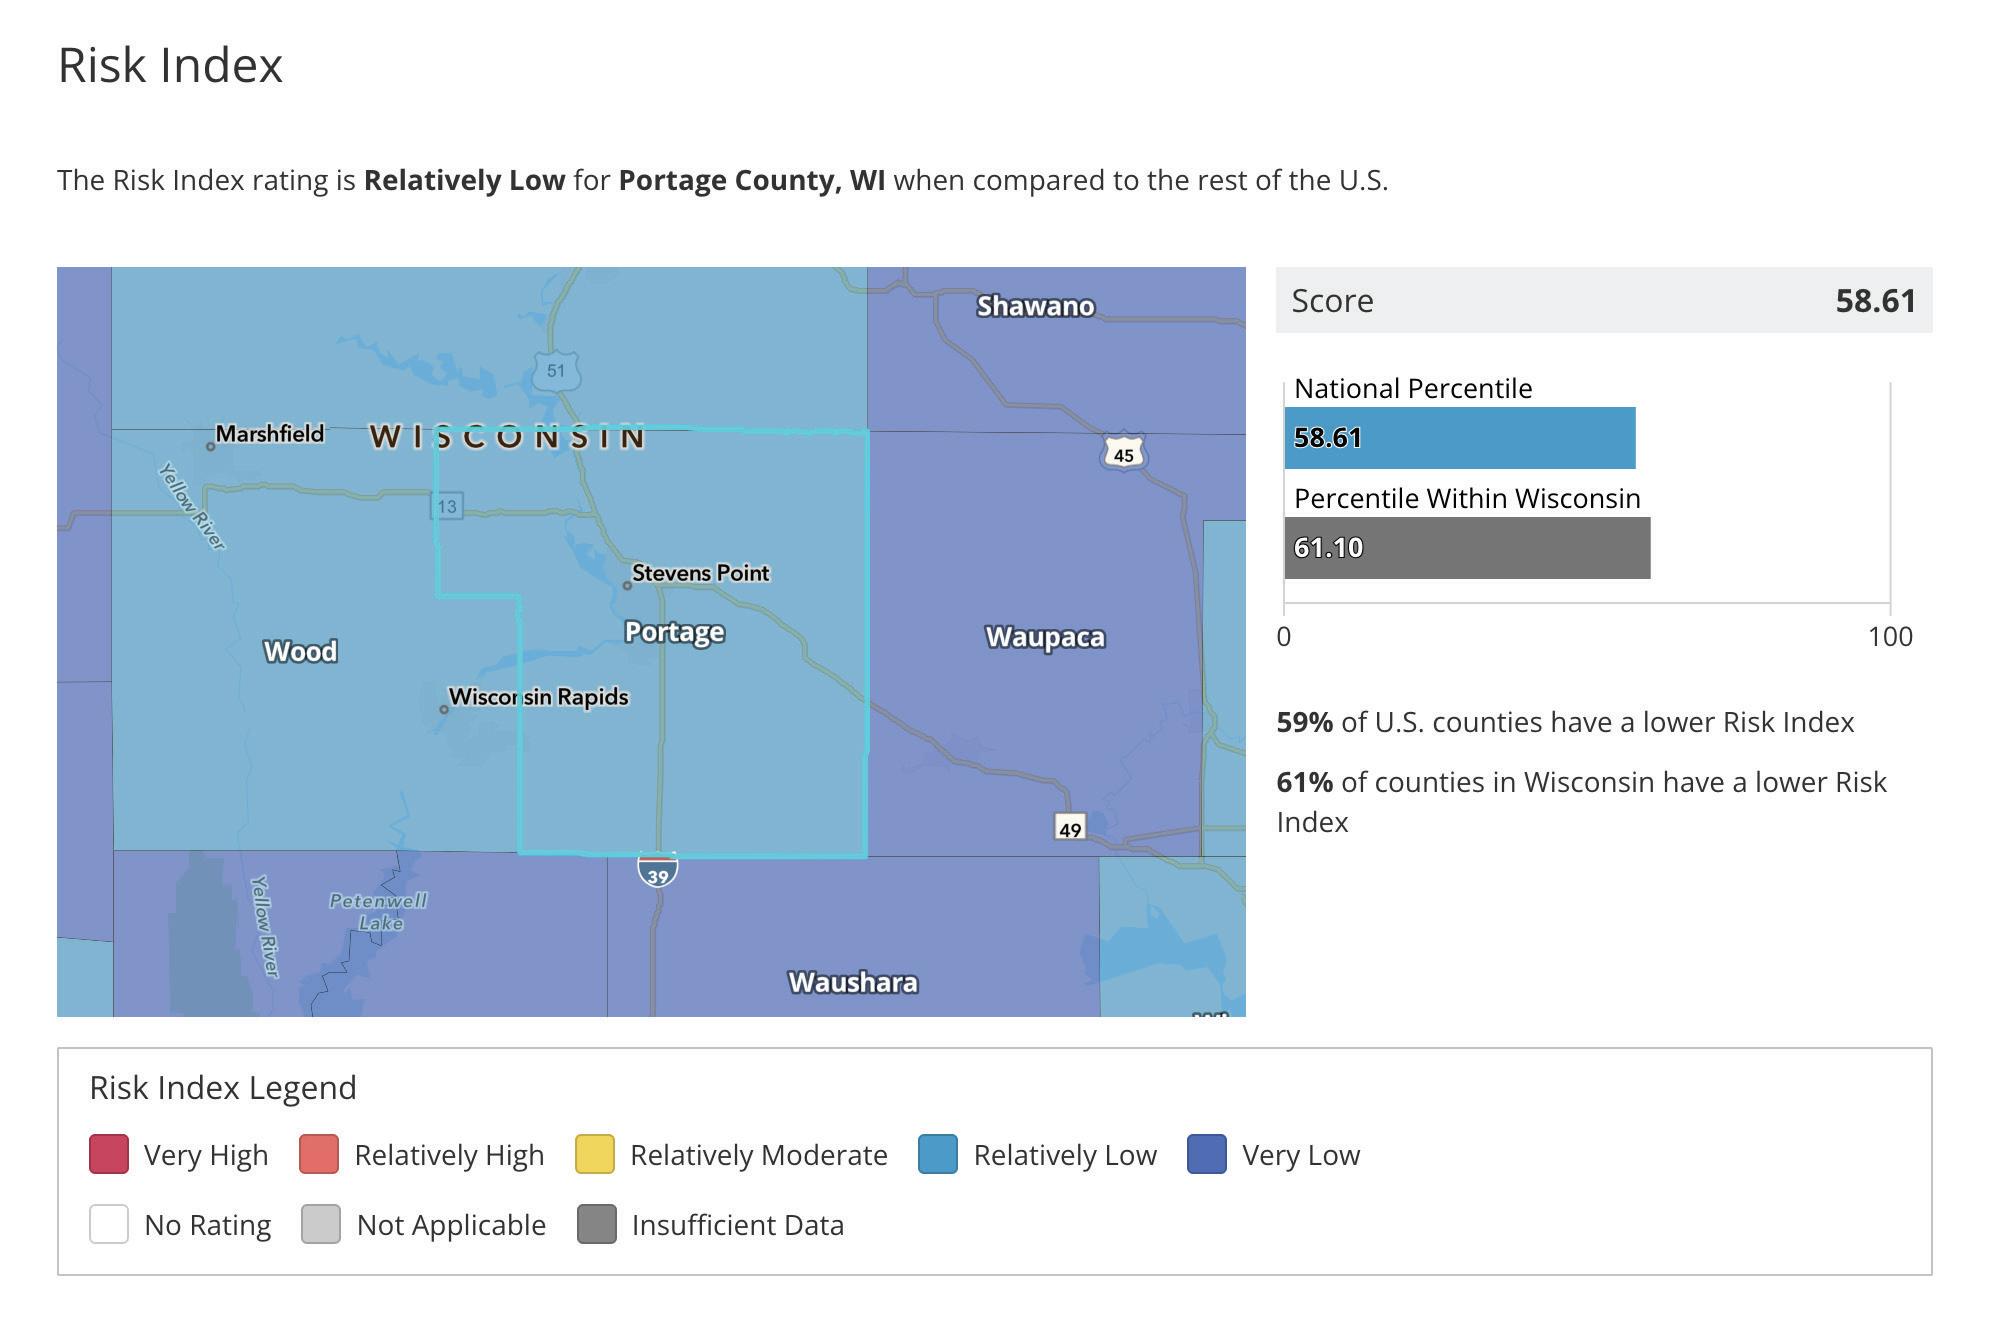
The National Risk Index, created by FEMA, can be used to identify communities at risk to 18 natural hazards. The tool includes the Risk Index, Expected Annual Loss estimates, Social Vulnerability, and Community Resilience at the county or census tract levels. The hazards included in the Risk Index can also be viewed individually, including:
• Coastal Flooding
• Drought
• Earthquake
• Heat Wave
• Hurricane
• Ice Storm
• Landslide
• Lightning
• Tornado
• Tsunami
To Use
Decide between County view and Tract view and select the desired location. The information can be viewed in the interactive map and scrolling sidebar or choose “Create a Report” to view the information in a PDF that can be saved or printed. This report goes into greater detail and provides information through maps, charts, graphs, and tables.
Healthy Watersheds, High-Quality Waters (HWHQW)
Website: dnr.wisconsin.gov/topic/SurfaceWater/HQW.html
Spatial Scale: Watershed (HUC6 & HUC12), Waterbody Level Assessment
FORMATS: Map Viewer, Map/Tables ( PDF ), GIS Shapefiles
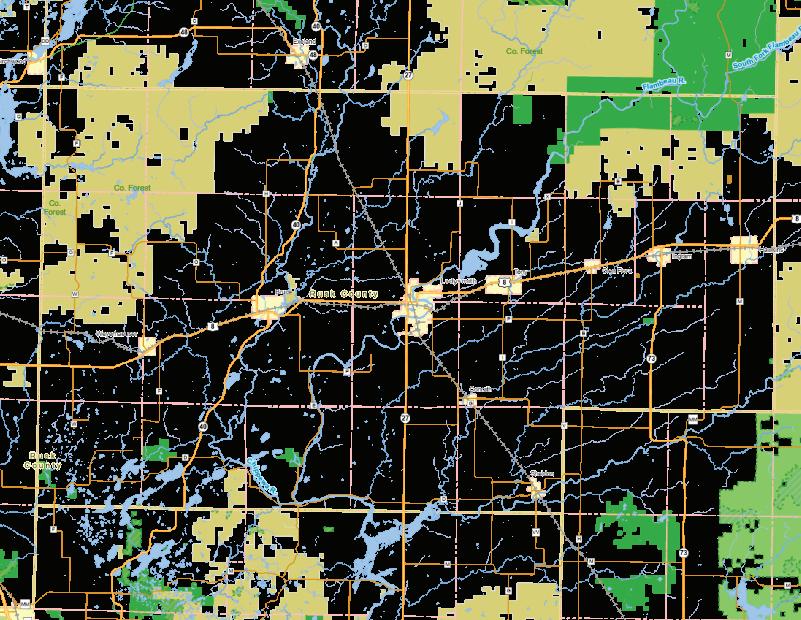
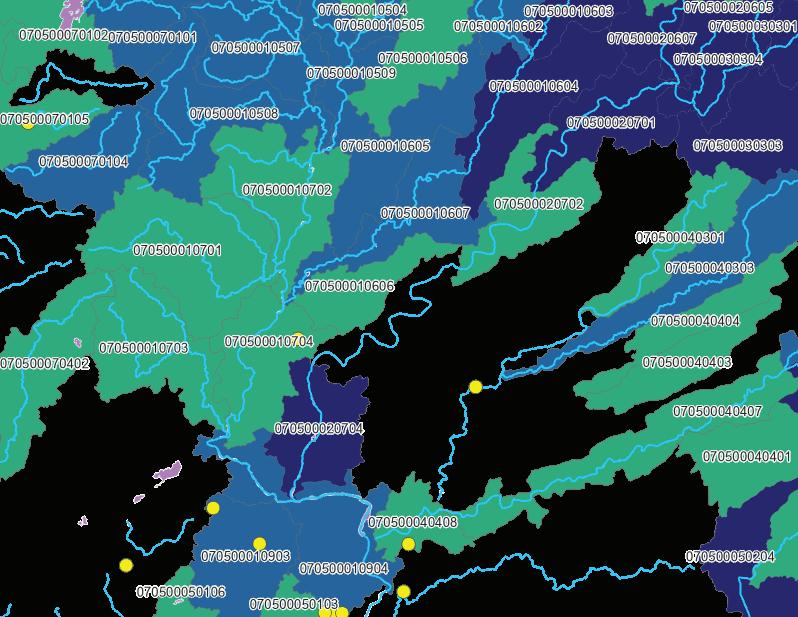
In 2022, the Wisconsin Department of Natural Resources (DNR) developed a new statewide water resources protection framework – Healthy Watersheds, High-Quality Waters (HWHQW). This initiative utilized the US EPA Watershed Restoration & Protection Screening Tool to model watershed health at the HUC12 scale throughout the state. The DNR also identified individual high-quality lakes, streams, rivers, and wetlands utilizing existing monitoring data and resource classifications. The HWHQW website features an accompanying technical report, action plan, and ready-made maps and information dashboards.
GIS Data
The Healthy Watersheds, HighQuality Waters datasets are available to download from the DNR Open Data Portal website. A link to access these shapefiles can be found under the Conservation Planning Tools section on the DNR website or within the Protection Tab on the Watershed Restoration and Protection viewer.
TO USE
The HWHQW modeling and assessment results can be found within the DNR Watershed Restoration and Protection Viewer
• The High Quality Waters dataset is made up of the Lakes & Large Rivers layer, Streams layer, and the Healthy & Rare wetlands.
●• The Watershed Protection Priorities dataset allows users to explore the top 30% healthiest HUC12 watersheds within two scales: statewide or within each Large River & Great Lakes Basin (HUC6).
• In addition to the watershed health information, there are three indices to help prioritize protection activities: vulnerability, opportunity, and the protection potential index. The vulnerability index can be a useful tool for climate resiliency planning since it includes metrics such as projected spring runoff volume and change in summer air temperatures.

Wisconsin Rainfall Project
Website: her.cee.wisc.edu/the-wisconsin-rainfall-project Spatial Scale: County Formats: Map Viewer, Charts, CSV
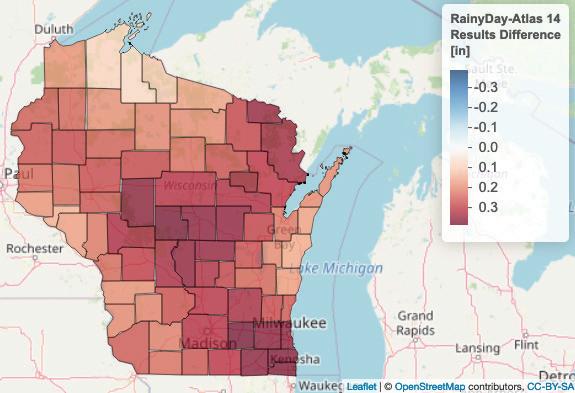
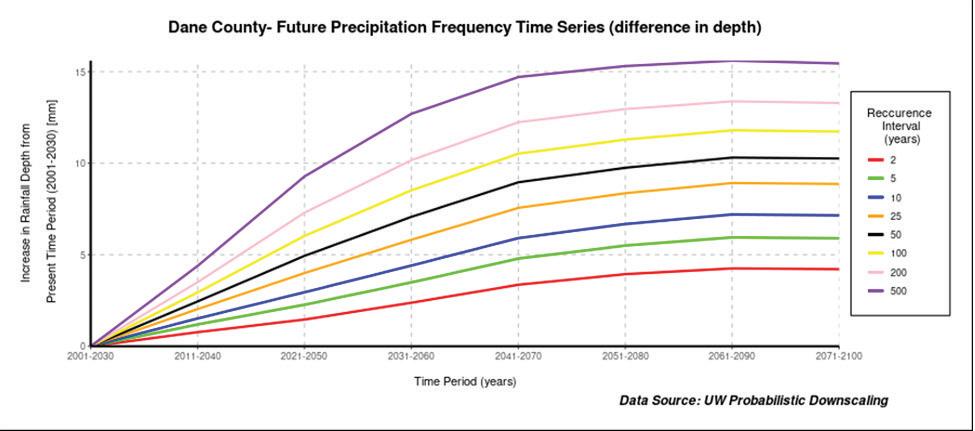
The Wisconsin Rainfall Project is a UW-Madison and WICCI effort that provides both current and projected future rainfall statistics for Wisconsin.
Rainfall Statistics
The present-day statistics are based on the Wisconsin Rainfall Project’s RainyDay framework and are intended to better reflect recent and current rainfall patterns and extreme events compared to existing data sources like NOAA’s Atlas 14. For future projections, users can view statistics for a variety of storm durations and reoccurrence intervals (for example, 100- or 1,000-year storm) under different emissions scenarios and timeframes. See the Fact Sheets on how the present-day statistics and future projections were generated for more information.
To USE
Choose a storm duration and recurrence interval, specify the units in terms of depth or intensity (depth/ hour), and select the present-day or future climate scenario of interest. Select a specific county on the map to view the full dataset for that county/scenario in chart, table, or csv format.
CLIMATE PLANNING FRAMEWORK FOR COUNTY CONSERVATION
This framework is aimed at helping county conservation departments integrate climate considerations into their land and water resource management plans. It is organized into three key steps, each with workbook questions to guide planning efforts.
The framework has been adapted from the Northern Institute of Applied Climate Science (NIACS) Quick Guide to Adaptation Planning for Natural Resource Professionals. The modified version in this toolkit is intended to suit county conservation staff in their planning efforts for land and water resource management. For more comprehensive adaptation planning, refer to the NIACS online Adaptation Workbook.
A quick guide to adaptation planning for natural resources professionals. NRS-INF-41-22. Madison, WI: U.S. Department of Agriculture, Forest Service, Northern Research Station. 14 p. https://doi.org/10.2737/NRS-INF-41-22
COLLECT DATA
MONITOR & EVALUATE
SELECT ADAPTATION
ASSESS IMPACTS & VULNERABILITIES
Consider Goals & Objectives
Identify Opportunities
Citation: Janowiak, Maria; Shannon, Danielle; Schmitt, Kristen; Baroli, Madeline; Brandt, Leslie; Handler, Stephen; ButlerLeopold, Patricia; Ontl, Todd; Peterson, Courtney; Rutledge, Annamarie; Swanston, Chris. 2022.
n this step, you will use the data collected in your Resource Assessment to identify the local impacts that may increase the potential effects of climate change in your area. Understanding these factors will help guide adaptation strategies for sustainable land and water management. Some examples of these factors are:
• Site conditions, such as topographic position, soils, or hydrology.
• Past and current management practices that have shaped the land’s resilience.
• Ecosystem composition and structure.
• Susceptibility to pests, diseases, or other stressors that may become more frequent and severe.
Once the local impacts have been identified, you can rate the level of vulnerability in your county:
Low Vulnerability – Ecosystems are expected to readily cope with potential climate change impacts. Climate change is more beneficial to ecosystems than disruptive.
Moderate Vulnerability – Climate change impacts are expected to alter ecosystems, but ecosystems will be able to cope with some impacts.
High Vulnerability – Climate change impacts are expected to exceed the ability of the ecosystem to cope with impacts. Ecosystems may undergo changes that will disrupt important ecosystem functions and key environmental benefits.
By assessing local climate vulnerabilities, conservation professionals can develop targeted strategies that enhance resilience and adaptive capacity in their land and water management plans.
Assess Climate Impacts and Vulnerabilities
Examples of regional and local climate change impacts
Regional
Changes in habitat suitability from northern to more southern species.
Increased average precipitation/periods of flooding.
Increased late-season drought.
Increased average temperatures/ high temperatures.
Climate Impact
Warmer temperatures and extreme heat
Shorter, warmer winters
Longer growing season
Increased winter and spring precipitation
More frequent heavy precipitation events
Reduced soil moisture or drought
Increased risk of wildfire
Altered stream flows
Changes in species ranges or assemblages (plant or animal)
Damage from insect pests or pathogens
Increases in nonnative plant species
Coastal hazards and shoreline erosion
Other:___________________________
Local and Project-Level Impacts
Project area contains a diverse mix of species, including many that are prevalent in locations to the south.
Many low-lying areas in the preserve are already prone to flooding and wet trail conditions.
Drought stress could exacerbate existing on-site issues with insect pests.
Stream on property supports healthy populations of coldwater fish species and contains some of the most high-quality habitat in the nearby area.
Local Impact
Pests & disease; species shift
Increased erosion and runoff –water quality impacts
Erosion and decreased stability of coastal bluffs
Source: Quick Guide to Adaptation Planning for Natural Resource Professionals
Once you’ve identified the local level impacts, consider how these impacts could influence the goals and objectives of your land and water management plan.
Four questions can be useful to help you evaluate your project goals and objectives in the context of climate change:
• What new or different challenges need to be addressed as a result of climate change and related stressors?
• What new opportunities might be available as a result of anticipated changes?
• Are your current management practices enough to overcome the challenges and meet your management goals and objectives?
• Do any of your goals or objectives need to change?
Once you’ve thought about how climate change projections may affect the plan’s goals and objectives, you can begin to identify climate resilience opportunities that would support your efforts to achieve your goals.
In the instance that the projections are creating challenges to meeting your goals, it might be an appropriate time to consider revising the goals and objectives. See the following example.
Identify Climate Resilience Opportunities within LWRM Goals
Examples of a revised objective :
Given all the risks and vulnerabilities outlined in Step 1, you may decide to revise an objective if the objective was not found to be feasible.
• Integrate cover crops, prairie, and/or wetland buffers in marginal row crop fields instead of attempting to manage increasing erosion with conventional tillage practices.
• Implement rotational grazing with silvopasture rather than maintaining open pasture that’s prone to compaction and runoff during extreme rain events.
• Establish native floodplain forests rather than replanting traditional tree species that are increasingly vulnerable to pests, disease, or hydrologic stress.
• Replace culverts with climate-resilient designs rather than continuously repairing undersized or outdated ones that fail during high-intensity storms.
Goals & Objectives
GOAL 1
Maintain and enhance quality of surface and ground water resources
Objective 1
Reduce nonpoint pollution and water quality risks
Goal 2
Conserve and enhance soil and terrestrial resources
Objective 2
Maintain/restore forests and vegetative cover
Resilience Opportunities
Select conservation actions that will be resilient to future precipitation patterns and extremes.
Select tree and plant species that will be resilient to future climate conditions.
Consider change in range of terrestrial invasive species.
You may need to alter your management practices to address new or increased challenges associated with a changing climate and environmental conditions. Identifying potential challenges and opportunities will position you to take action and adapt practices that will maximize your ability to achieve your goals for your property of interest.
Start by brainstorming and outlining specific actions that you want to evaluate for your project, and then consider:
Time Frames – When would this action be implemented? Some actions may occur in the short term, while others may not occur for a long time or will occur only in certain situations (such as after a large disturbance).
Benefits – What benefits does the action provide? For example, note if a tactic addresses your biggest challenge, addresses multiple challenges, or has co-benefits such as improving carbon mitigation and visitor experiences.
Drawbacks and Barriers – What drawbacks are associated with this action? Note any negative effects or potential barriers (e.g., legal, financial, infrastructural, social) that are likely to arise.
Effectiveness – Does the action meet the desired intent?
Feasibility – Can the action be implemented?
After considering the above items, you will be better able to select the specific actions that are a good fit for your situation. The preferred actions will likely be those that overcome the greatest challenges, have major benefits, and can be implemented given your available resources.
Identify Adaptation Actions
Examples of adaptation tactics, with Adaptation Strategy/Approach and Details
Adaptation Tactic Action (timeframe)
Collect seeds for restoration planting from a greater diversity of sites and increase diversity of prairie seed mixes (in 2 years).
Construct new trails away from frequently saturated areas and use boardwalks to provide access to wildlife viewing areas (in 5 years).
Use repeated physical removal of buckthorn along stream corridor to promote regeneration of native species and inhibit downstream spread (over 10 years).
Adaptation Strategy or Approach (insert from Adaptation Menu)
Use seeds, germplasm, or other genetic material from across a greater geographic range (Forest Approach 8.1).
Relocate Existing Infrastructure and Opportunities to Areas with Less Risk of Climate-Exacerbated Damage (Recreation Approach 6.2).
Prevent the introduction and establishment of invasive plant species and remove existing invasive species (Forest Approach 2.2).
Source: Quick Guide to Adaptation Planning for Natural Resource Professionals
Goal/Objective Action/Strategy
Maintain/restore forests and vegetative cover
Increase flood storage & retention on the landscape
Monitor and protect surface water resources
Evaluate list of tree species sold in County Tree & Shrub Sales.
Increase infiltration rates on agricultural fields
Inventory road/stream crossings to ensure hydrologic integrity
Benefits, Drawbacks, and Barriers
Limited availability of sources for prairie seed of desired species.
Boardwalks will increase cost but also minimize visitor impact to resource.
Potential to use volunteers for buckthorn removal.
Considerations: Benefits, Drawbacks, Feasibility, Barriers, Resources, Timeline
Resources: USDA Climate Tree Atlas; NIACS
Timeline: 5 years
Increased disaster preparedness and improved access to FEMA funds
Additional Considerations for Using the Framework
• Focus on Co-Benefits: Prioritize actions that provide multiple benefits (e.g., carbon sequestration, biodiversity enhancement, economic savings).
• Monitoring and Evaluation: Monitor the effectiveness of the selected adaptation strategies in helping achieve your goals and objectives. The uncertainties associated with climate change make it even more important to practice adaptive management. As new science emerges, adjust your management approaches appropriately.
• Community Engagement: Conduct outreach to ensure community voices are heard and included, especially those directly affected by climate impacts. Create a clear, accessible version of the plan to strengthen public support.

“
CLIMATE CHANGE is happening in Wisconsin, affecting our residents from rural communities to our largest cities. We have an opportunity—actually, a need—to adapt and make our landscape more resilient, and mitigate our contributions to climate change. We must shift our thinking from wondering if the next extreme storm event will occur to planning for when it does.
– Bob Micheel, Monroe County Land Conservation Department Director
Assess Climate Impacts and Vulnerabilities
GOAL
Identify how climate change may uniquely affect your county’s natural resources and communities.
Climate Impact
Shorter, warmer winters
Warmer temperatures and extreme heat
Longer growing season
Increased winter and spring precipitation
More frequent heavy precipitation events
Reduced soil moisture or drought
Increased risk of wildfire
Altered stream flows
Changes in species ranges or assemblages (plant or animal)
Damage from insect pests or pathogens
Increases in nonnative plant species
Coastal hazards and shoreline erosion
Other:
Workbook Questions
1. What climate impacts are you most concerned about in your county? Identify priorities
2. How specifically might these affect local resources?
Local Impact
Resources: Refer to Future Climate Projections section for a comprehensive list of tools
2 Identify Climate Resilience Opportunities within LWRM Goals
GOAL
Define clear management objectives that align with projected climate impacts and community needs.
Workbook Questions
1. What are the focus areas and land and water management goals and objectives in your plan?
2. What opportunities exist for incorporating climate resilience into these elements?
Identify Adaptation Actions
GOAL
Develop a list of prioritized actions to address vulnerabilities and enhance climate resilience.
Workbook Questions
1. Are your current management practices enough to overcome the challenges and meet your management goals and objectives?
2. What actions can you take to address these climate impacts in your county?
Goal/Objective Action/Strategy
Considerations: Benefits, Drawbacks, Feasibility, Barriers, Resources, Timeline
Resources: Refer to Adaptations section for comprehensive lists of actions and strategies
adaptation strategies

We grouped adaptation strategies and actions according to area of conservation. To help determine which adaptation strategies and actions to select, review the questions in the workbook and consider which climate impacts each strategy helps to reduce or minimize.
Adaptation strategies vary depending on the county and landscape context, including the magnitude of climate impacts, the inherent resilience of ecosystems, and values and resources of the local community. There is no one best approach in selecting climate action strategies. Your experience with and understanding of the challenges and opportunities within your county will serve as the basis for selecting which approaches are best suited to your region. The resources in this toolkit are designed to support your decision-making process, helping you apply your local expertise to identify the most effective strategies for your region.
adaptaTion strategy resources
Agriculture
ADAPTATION
USDA Climate Hub: Adaptation Resources for Agriculture
AgroClimate Decision Making Tool
WICCI - Agriculture Working Group Webpage and Report
MITIGATION
USDA Climate Smart Agriculture and ForestryMitigation Activities List for FY2024
WI Land + Water - Building Carbon
Agroforestry
Savanna Institute
University of Missouri - Center for Agroforestry
USDA Forest Service - National Agroforestry Center
Forestry
NIACS Strategies and Approaches - Forest Carbon Management
NIACS Adaptation Strategies
Climate Change Field Guide for Northern Wisconsin Forests
Shorelines
Healthy Lakes and Rivers - Best Practices and Grant Program
UW Sea Grant Institute - Adapting to a Changing Coast for Local Officials and Property Owners
UW Sea Grant Institute - Nature-Based Shoreline Options for the Great Lakes Coasts
Water
WICCI - Flood Resilient Culvert Design Primer and Manual
WICCI - Water Working Group Webpage and Report
US EPA - Actions That Could Reduce Water Temperature
US EPA - Nature Based Solutions/Natural Hazard Mitigation Resources
US EPA - Water Quality Adaptation Strategies
Wetlands
Northern Forests Climate Hub - Climate Adaptation Strategies and Approaches for Conservation and Management of Non-forested Wetlands
Wildlife
Climate Change Response Framework - Wildlife Adaptation Menu
• Interactive version linked here


FUTURE CLIMATE PROJECTIONS
Additional Mapping Tools
Climate Mapping for Resilience & Adaptation (CMRA)
Website: resilience.climate.gov
Spatial Scale: County
FORMATS: Tables/Reports (Image)
The CMRA website includes a number of helpful resources including the Climate Resilience Toolkit Steps to Resilience, information about federal funding opportunities, and the assessment and mapping tool.
Assessment Tool
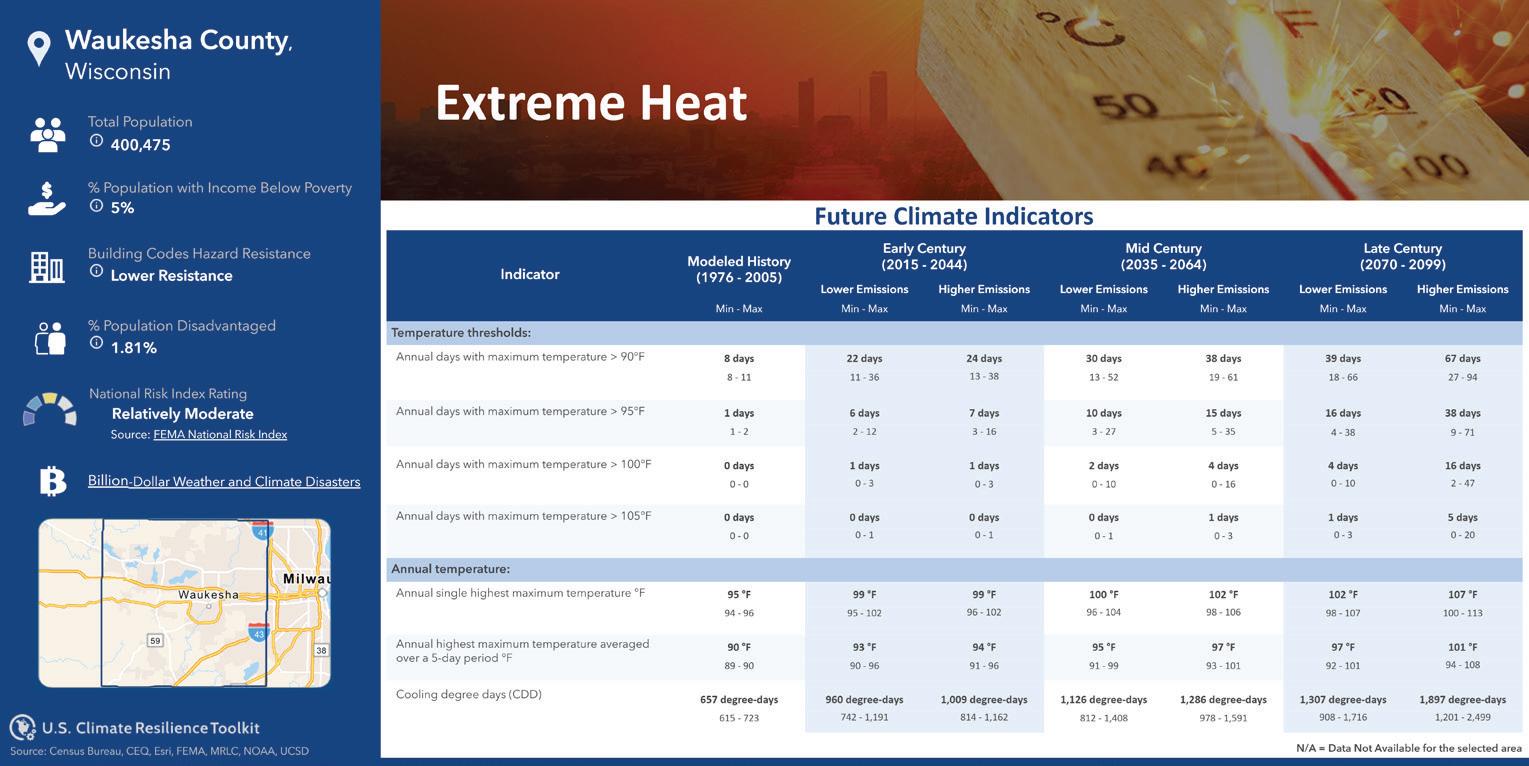
The Assessment Tool allows users to search for their location, view climate projection data at the county level, and generate a county-specific report.
●• Climate projection indicators are grouped by hazard type (extreme heat, drought, etc.) and provided for both lower (RCP 4.5) and higher (RCP 8.5) emissions scenarios at different timeframes (early, mid, and late 21st century). The baseline for comparison is 1976-2005.
• Note: the indicator “days with maximum temperature below 32 degrees F,” which is especially relevant for Wisconsin, is somewhat hidden and can be found under the “Flooding” hazard tab.
TO USE
Open the Assessment Tool and search for your county. Click “get complete report” in top right to generate an infographic report. Then click the arrow in the top right to save/export as an image. The report includes the full table of projections in addition to demographic information about the county.
Climate Risk and Resilience Portal (ClimRR)
Website: https://climrr.anl.gov/localprojections
Spatial Scale: County, Tract
Formats: Map Viewer, Tables, PDF Reports
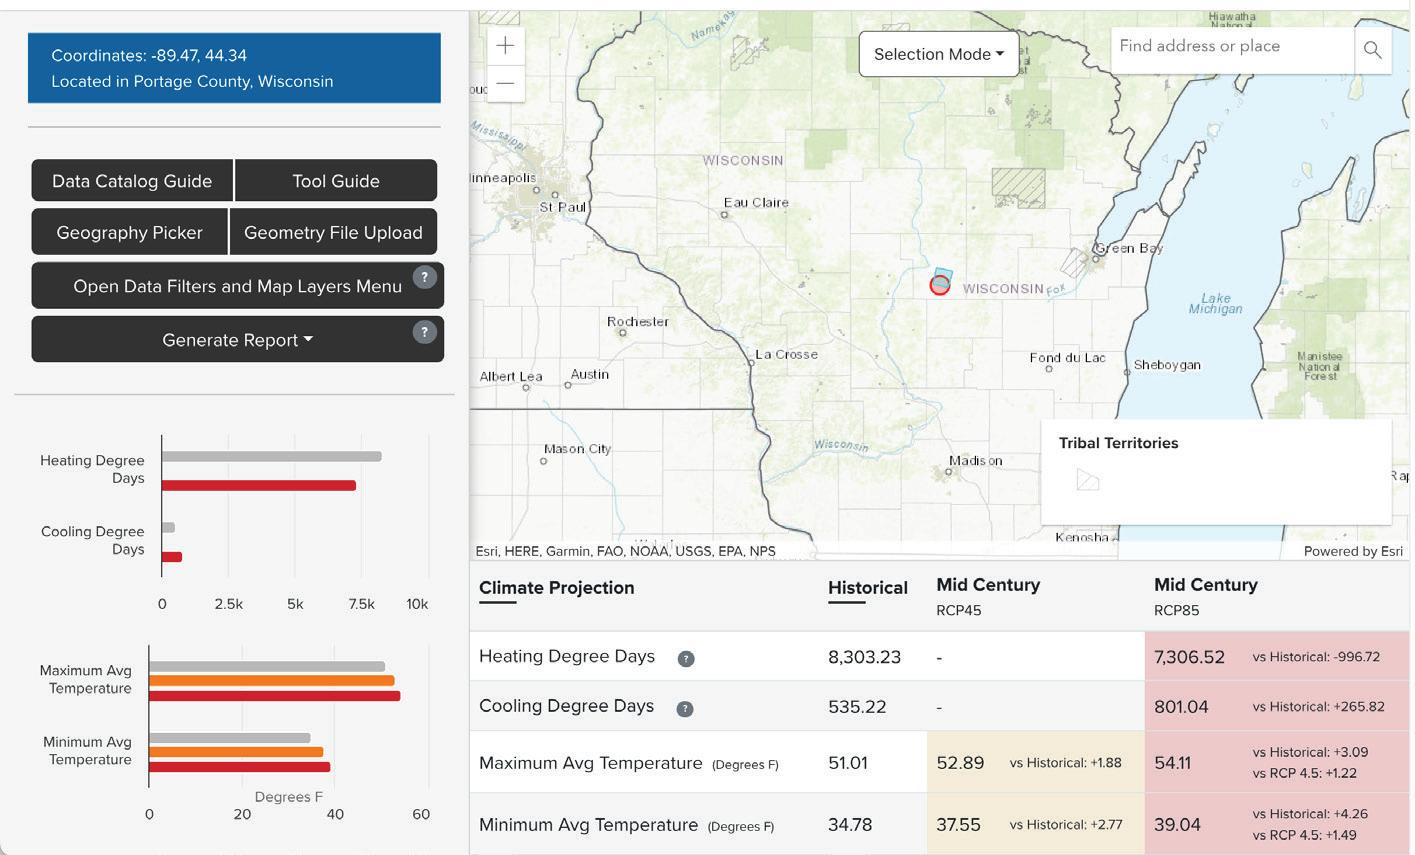
The Climate Risk and Resilience Portal provides future climate data by overlaying 60 climate variables to provide sophisticated projections for communities across the U.S.
LOCAL CLIMATE PROJECTIONS
ClimRR gives highly localized climate projections from midto end of century. The potential climate variables are presented under two scenarios: one in which the world proceeds in a “business as usual case” in terms of emitting greenhouse gases (RCP 8.5) and one in which the world takes sufficient action to meet the goals of the Paris Agreement –to limit global temperature rise to 1.5 °C above pre-industrial levels (RCP 4.5).
TO USE
Begin by selecting “county” under Time Interval on the top of the map. From there, enter the county in the search bar, select the correct location, and click on the highlighted region of the map. There is also an option to upload a geometry file on the left hand side. The graph above will showcase the changes in average temperature under different climate scenarios.
To look closer at specific climate variables, select “Close Data Filters and Map Layers Menu” and choose a climate variable category under Data Filters. There are additional resilience and infrastructure layers that can be applied here as well.
Once finished, a county-level report can be generated into a shareable pdf providing summarized information and climate statistics.
Climate Resilience Toolkit and NOAA’s Implementing the Steps to Resilience: A Practitioner’s Guide, 2022
EcoAdapt’s Climate Adaptation Starter Kit
Forest Adaptation Resources: Climate Change Tools and Approaches for Land Managers
Great Lakes Indian Fish and Wildlife Commission (GLIFWC) Climate Change Program
Green Infrastructure and Nature-based Solutions in the City of Milwaukee’s Local Hazard Mitigation Plan, 2019
Midwest Glacial Lakes Partnership Conservation Planner Lake Viewer, 2019
NOAA National Centers for Environmental Information –State Climate Summaries, 2022
Scanning the Conservation Horizon: A Guide to Climate Change Vulnerability Assessment
WICCI Assessment Report: Wisconsin’s Changing Climate, 2021
WI Department of Health Services Flooding Risk Assessment Flood Tool (RAFT)
WI Department of Natural Resources Statewide Forest Action Plan, 2020 - See chapter on Climate Change
WI Department of Natural Resources The Wonderful Waters of Wisconsin Action Plan, 2022
The Nature Conservancy - Wetland by Design
USDA/NIACS Climate Change Field Guide for Northern Wisconsin Forests, 2020
US EPA Climate Change Adaptation Resource Center (ARC-X)
wisconsinlandwater.org
info@wisconsinlandwater.org (608) 441-2677
