

$18tn
Investment gap to deliver the net-zero energy transition
$370bn
In funding allocated by the Inflation Reduction Act (IRA) to mitigate climate change
$97.3bn
Amount invested globally in Climate tech in 2022
$9tn - $12tn
Estimation of the climate tech market size by 2030
Looking at the Sustainable Global Economy from a VC perspective
The global climate crisis and the urgent need for a green transition are fueling what is being described as the new industrial revolution and the growth of what we call the Sustainable Global Economy As venture capitalists, we get to sit at the forefront of this revolution We believe we should be involved in this revolution not only because it is necessary for the good of our planet, but also because from a purely financial perspective it will undoubtedly see the rise of the unicorns of the future
The green transition has been gaining significant momentum in the last few years, driven by several key factors. Macroeconomic forces, including Europe’s energy crisis, ambitious government green initiatives (such as the US IRA, the EU Green Deal or Japan’s GX Basic Plan), substantial technological improvements in renewables, biomaterials, and carbon removal, and finally growing alignment in capital markets toward green investments are coinciding to drive major change across industries while creating new ones
There are many ways for venture capitalists to be involved, and we hope this report sheds a light as to where and how as generalists we can also participate, without having to completely rethink our investment criteria There are amazing new technologies and business models and it is up to us to discover them Software will play a pivotal role in this Sustainable Global Economy, the way it has elsewhere, disrupting industries and powering the green transition.
There will continue to be setbacks, hopefully not as harsh as during the last climate winter, but we believe this new industrial revolution is underway no matter what. It is up to us to seize this opportunity


 Authors


Despite the previous boom and bust, the conditions are now right for traditional VCs to fund the innovations needed to get us to Net Zero
It is now hopefully commonly accepted that a green transition is urgently needed Indeed, small shifts in the earth’s temperature have already unleashed dramatic storms, droughts, and floods to various parts of the globe, displacing millions, deregulating ecosystems, and driving biodiversity loss A chilling proof: the last Ice Age, tens of millions of years ago, represented only a 5°C shift in temperature The risks of going above 2 ° C are just too high
The good news is that after stalled efforts, there appears to be a global concerted initiative to address climate change and fund the technologies and businesses that will help us get to Net Zero quickly
Regulatory pressure, combined with consumer demand for sustainable and clean alternatives, are pushing stakeholders to rethink the way they do business while encouraging entrepreneurs to build the innovative solutions required.
Governments around the world are pushing for major change , with the US allocating more than $370bn to climate as part of their Inflation Reduction Act while the EU passed a ‘Green Deal’ which could see them dedicate more than €1tn in public and private funds to mitigating climate change Similar pieces of legislation are being passed around the world, from Brazil’s National Plan to Japan’s GX Basic Plan or the Chinese Five Year Plan These measures may open up many more opportunities, which McKinsey estimates could reach $9tn to $12tn in annual investment by 2023
We are at the very beginning of a new industrial revolution , driven by macro and micro tailwinds, which should see the development of entirely new industries, jobs, and businesses dedicated to solving a single problem.
Sustainability tech is becoming mainstream . That said, there is a big gap between the types of businesses that can be funded by traditional VCs and those that will require longer-term, more infrastructure and moonshot-based approaches. At White Star, we believe we can play here, without having to redesign our investment strategy, by identifying the sectors and businesses that match our investment criteria
Governments around the world have taken significant legislative and regulatory action to support their climate and energy priorities including mandates, subsidies and market design
The Green Deal (2019), Fit for 55 (2021) and RePowerEU (2022) programs have progressively raised the target for emission reductions by member states
The EU has also broadened its Emission Trading System (ETS) to include new sectors such as the maritime and aviation sectors In 2023, the European Commission introduced the Green Deal Industrial Plan, offering incentives for domestic production and CleanTech
The EU Taxonomy Regulation symbolises governments’ commitment to promoting sustainable finance and achieving environmental and climate goals by directing private capital toward sustainable investments. Under the SFDR, all EU financial market participants are required to disclose their ESG activities, with funds and banks classified under articles 6, 8 or 9 based on their investments. Since its adoption in 2000 the financial industry has seen a considerable increase in “green” practices
The Inflation Reduction Act stands as the most extensive piece of federal legislation ever addressing climate change, with an investment of $783bn in provisions centered on energy security and climate change.
Some of the levers include tax credits like the Investment Tax Credit (ITC) and Production Tax Credit (PTC), allowing taxpayers to deduct a portion of renewable energy systems costs from their federal taxes
The largest allocation areas are $128bn for renewable energy and grid energy storage, $30bn for nuclear power, $13bn for electric vehicle incentives, $14bn for home energy efficiency upgrades, $22bn for home energy supply improvements and $37bn for advanced manufacturing
Canada has announced $60bn in clean energy tax credits and $20bn in sustainable infrastructure investments as part of its 2023 budget
The largest portion of the Canadian budget’s energy transition-focused investments, representing more than $25bn through 2035, is made through the Clean Energy Investment Tax Credit
The budget proposes a 15% refundable tax credit for investments including non-emitting electricity generation systems.
On December 22, 2022 the Japanese government unveiled the Green Transformation (GX) Basic Policy It outlines regulatory, financing, and technology development priorities for the green transformation of various industrial sectors A key pillar of the GX Basic Policy is the support for energy transition
As we look to invest in the top startups from across the globe, we believe the following key trends will result in a growing number of opportunities within the Sustainable Global Economy
There is a significant amount of work to be done to reach net zero by both reducing and removing carbon from the atmosphere.
As a result, we will see the proliferation of technologies surrounding carbon emissions and carbon measurements, from deep tech to software, across both B2B and B2C.
Certain technologies may finally reach enough scale to make substantial impacts on carbon emissions, although this remains far away for now.
Companies can no longer afford to ignore consumer demands when it comes to where goods come from, how they are made, packaged, and distributed and where they end up.
The circular economy will no longer be on the fringes but will make its way into business models across food and agriculture, manufacturing, packaging, logistics, and energy.
We will see both deep tech and SaaS companies that recycle and repurpose materials, reduce waste, and recirculate goods.
Nature is not the only loser in a changing climate – our built environment is not ready to sustain harsher storms, colder winters, and hotter summers.
We will see plenty of new infrastructures and technologies to improve cities’ resilience to these changes as well as financial and insurance companies that help people who have been directly affected.
Renewable energy and EVs are increasingly overtaking oil and petrol cars, coal plants are being shut down, biodegradable and biomaterials are slowly overtaking plastics.
Yet there is so much work to be done to fully replace fossil fuels, in terms of price parity, infrastructure, and distribution.
We will see more and more businesses that tackle grid and EV management, address methane gas emissions, or reduce reliance on non-recyclables.
Raised by climate tech startups in the last 3 years
685
Mega rounds1
$7.4bn
Share of seed funding in the last 3 years
$181bn 140
Climate tech exits in 2022
Raised by climate tech startups in 2023 YTD (Jan-Aug)
14.8%
Share of VC funding over the last 3 years
43 VC-backed climate tech unicorns2
$35bn +163%
Share price performance of the top 30 public climate tech companies since 20173
The
Deal volumes have almost doubled in Europe and North America
Climate Tech Deal Count across Seed, Series A and Series B by
While deal values are almost 3x vs. 3 years ago
Total Capital Invested in Climate Tech across Seed, Series A and Series B by Region ($m)
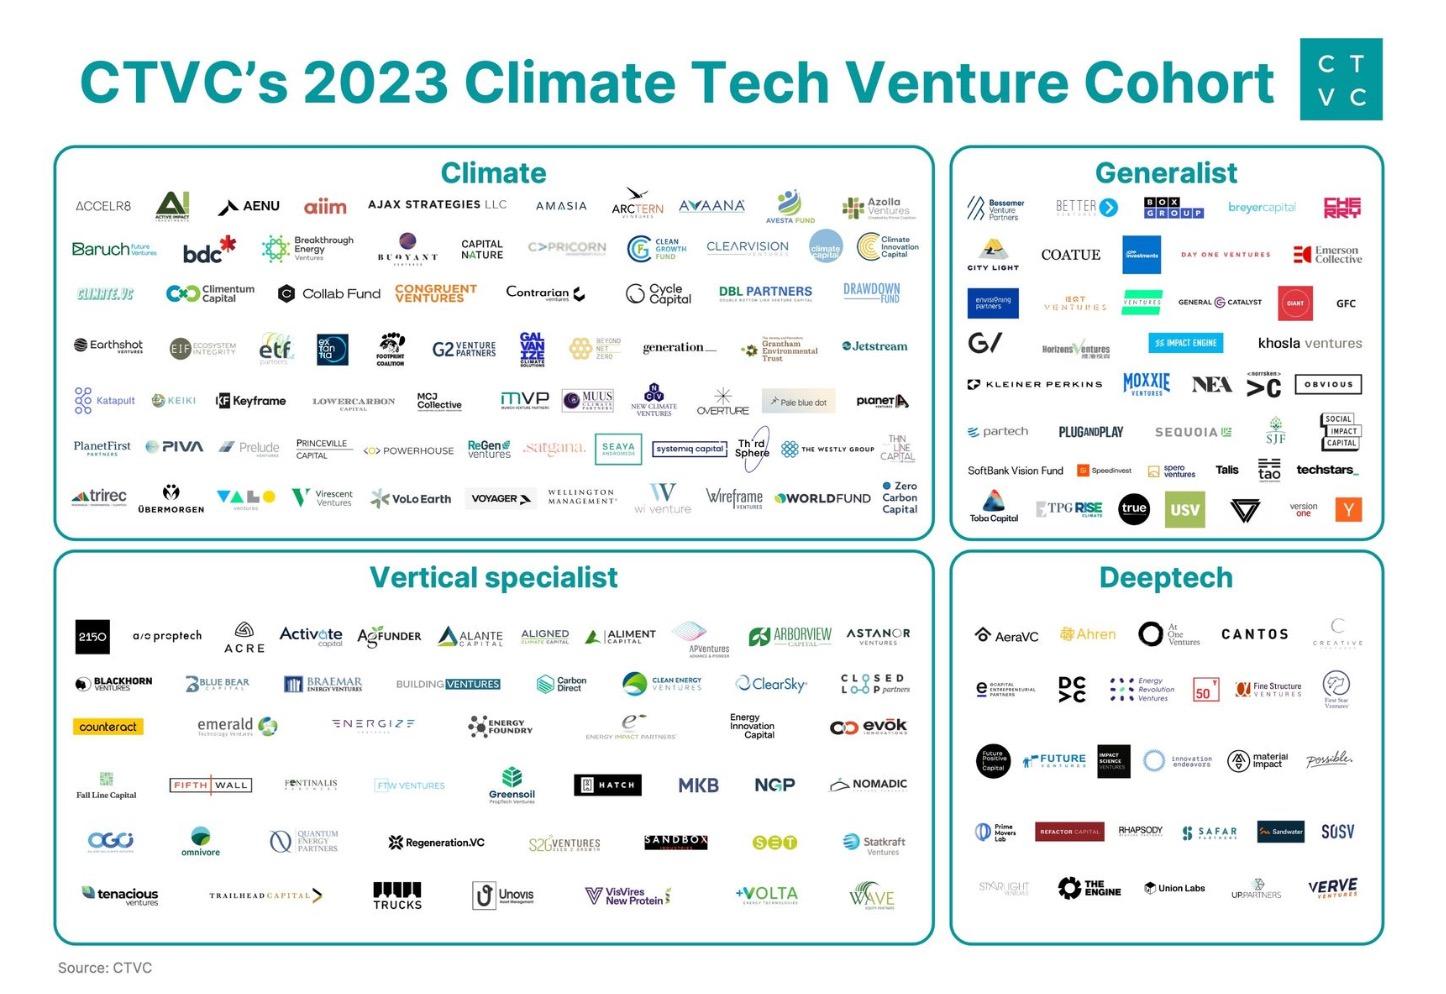
Classification of VC Investors: here we will use Sustainability and Climate Tech interchangeably
Climate Specialists: climate general thesis across 7 climate verticals (e.g. energy, mobility, food & agriculture, construction, carbon)
Vertical Specialists: single vertical focus within climate (e.g. energy, mobility etc.)
Deeptech: frontier, hard science technologies to address climate Generalist: predominantly enterprise or consumer software, with opportunistic climate investments
Climate Generalist
Vertical Specialist
DeepTech


Early-stage valuations remain resilient amid market downturns
Most sub-sectors saw boosted valuations from 2022 to H1-2023
Most
The Sustainable Global Economy: Ecosystem
Clean Energy, AgriTech & FoodTech, and Electric Infrastructure led overall funding
Packaging & New Materials and Clean Energy led count of exits
The exit environment is picking up, which is key to the long-term viability of the ecosystem
Climate tech exit activity has increased 70% YoY in the last two years, led by large energy companies and private equity firms
57%
Of exits from 2020 to February 2023 were M&A transactions
289
Climate tech companies have exited via M&A, SPAC, and IPO since 2020
63%
Of climate tech acquisitions since 2020 were driven by corporate buyers
$400bn Large
since 2020 M&A

[NASDAQ:NXT] $638mraisedat$4.9bn
M&A 2023

€1.6bn


M&A 2022


Renováveis for €600m


The most active acquirers are energy companies, followed by financial
Most active acquirers of Climate Tech companies by count since 2020


High-qualitylithium-ion batteries for electric vehiclesandenergystoragesystems

Renewableenergysupplier,offeringaffordable andsustainableenergysolutionstocustomers

Farmer-to-farmeragronomicinformation networktohelpfarmersinthemanagementof theirdataandgaininsightsfromeachother

Simplifythesolardesignandsalesprocess throughthedevelopmentoftheircutting-edge cloud-basedplatform

Developingmodular,verticalfarmingsystems thatcanbeinstalledinsupermarkets, restaurants,andwarehouses
$11.8bn valuation
$5.0bn valuation

$4.0bn valuation

$3.8bn valuation
$1.0bn valuation

Of the $25bn that VC investors poured into Climate Tech from 20062011, more than 50% was lost by 2015
• Starting in 2006, growing consumer awareness, rising fossil fuel prices, and new legislation led to Silicon Valley VC firms going all in on climate tech, with a heavy focus on energy and renewables
• By 2011, almost all of the renewable start-ups founded in the previous decade were shut down or about to be, driven to bankruptcy by a combination of falling natural gas prices, inconsistent government policies, and the credit crunch of the 2008 financial crisis
Cleantech companies developing new materials, hardware, chemicals, or processes, tend to be poorly suited to VC investment due to the significant capital requirements, long development timelines, and unclear exit opportunities
Technologies take a significant amount of time to reach maturity, beyond typical VC funds’ return requirements
SVB Climate Tech Innovation Hype Curve
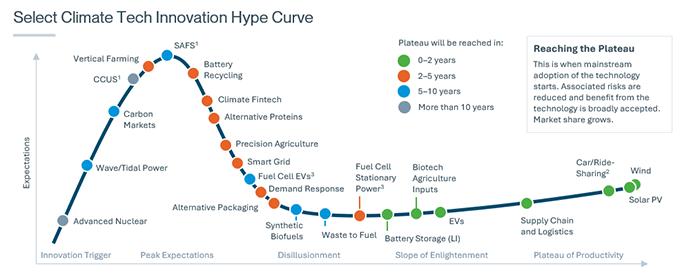
Source: Pitchbook (2023), SVB (2022)
Notes: 1) Includes NA, Europe and SEA
Yet we believe that the conditions are right for a new sustainable global economy, funded by VC
The market and macro conditions today are ripe for outsized climate investing returns and impact


1 - Policies and regulations: Governments and regulatory bodies worldwide are increasingly prioritising climate action and implementing policies and incentives to accelerate the transition to a low-carbon economy
2 - Corporate or consumer demand: Businesses and consumers are increasingly seeking to be “greener”. Sustainable solutions have become central to consumers and thus to corporates. This creates a substantially more positive market environment
3 - Capital alignment: The rise of impact investing and Environmental, Social, and Governance (ESG) considerations in investment decision-making is a massive boost to the sustainable global economy. In addition, governments around the world are pledging trillions of dollars to reach net zero by 2050
4 - Tech maturity: The previous climate tech boom and bust resulted in economies of scale, particularly in solar where prices decreased by 89% in the last 10 years. Many climate tech companies are building on established technologies and have demonstrated commercial viability
5 - Talent interest: The climate issue and the desire to have a career with impact is top of mind for younger generations. These aspirations in new generations will create a formidable pool of talent ready to innovate
6 - Urgency of the crisis: If some on the conservative side of the political spectrum are still reluctant to recognise the issue, there is a consensus over the urgency of the matter. Only a 5°C change in temperature was necessary to move from the glaciation age to our current climate. With a projected 3°C change in the next 30 years the issue will become more pressing as time passes
In keeping with WSC’s investment guidelines, it is still possible to invest in Climate Tech if companies are able to:
Deliver solutions at price parity with existing ones
Hedge against macro events
Innovate on business models to reduce sales cycle
Leverage established technologies
Leverage regulatory environments
Ramp up revenues with capital raises
We’ve
The purpose of this report will be to help shed light on this burgeoning ecosystem, looking at every single industry and identifying opportunities for investment as a generalist venture capital fund
Scoring: Yes = 1 / No = 0


Business Model
Is this a recurring business model?
Technology Readiness
Is the existing technology ready to scale?
Margins
Are there software-like margins?
Stage
Are there revenue-generating businesses raising at Series A?
Market Size
Does the potential market size at scale correspond to our criteria ($5bn+)?
Exit Environment
Have we seen large exits in this sector ($1bn+)?
Capital Efficiency
Can these businesses achieve scale without overly diluting early shareholders?
Market Readiness
Are we seeing pull from the market and supportive regulatory regimes?
Barriers to Entry
Are there barriers to entry?
Internationalisation
Is this an internationally scalable model?
Green FinTech

• Payments
• Lending
Circular Economy

• Sharing Economy
• Product Lifecycle Management
• Insurance / Risk Management
• Crypto
• Sustainable Materials
• Waste Management
Carbon Management, Trading & Capture
• Carbon Trading & Carbon Markets
• Carbon Accounting & ESG Reporting
• Carbon Utilisation
Electric Infrastructure
• Smart Grid Technology
• Energy Storage
• EV Charging Infrastructure
Construction

• Smart Buildings & Automation
• Sustainable Materials
• Prefabricated Buildings
AgriTech & FoodTech

• Picks & Shovels
• Precision Agriculture
• Alternative Proteins
Packaging & New Materials
• Packaging Software & Infrastructure
• Biodegradable & Compostable
Clean Energy

• Solar Power
• Wind Power
• Nuclear
• Direct Air Capture (DAC)
• Carbon Capture from Industrial Processes (CCI)
• Food Waste Reduction
• Vertical Farming
• Waste to Value
• Bio-Materials
• Hydropower
• Waste-to-energy
• Hydrogen
WSC focuses on these key sectors undergoing rapid structural change

Climate SaaS
Industrial processes are increasingly reliant on software to report, capture, or reduce emissions and become more sustainable
Circular Economy
Reengineering of value changes will play a key role in the transition to net-zero emissions, leading to structural changes to markets that accompany the technological transition
Climate Finance
Financial innovation will be needed to fund society’s climate adaptation and mitigation, while improved data, hardware, and models will pioneer broad-based spectrum insurance
RegTech
Increasingly heavy regulatory burdens globally can only be addressed through software
Based on our scoring, we have identified the following subsectors as the most investable for generalist VCs and thus WSC
Green Fintech
Insurance / Risk management
Circular Economy
Sharing Economy
Product Lifecycle Management
Carbon Management, Trading & Capture
Carbon Trading & Carbon Markets
Carbon Accounting & ESG Reporting
Electric Infrastructure
Smart Grid Technology
Construction
Smart Buildings & Automation
Agritech & Foodtech
Picks & Shovels
Precision Agriculture
Packaging & New Materials
Packaging Software & Infrastructure
Green FinTechs can deliver the innovative power that financial institutions lack by leveraging big data and AI, and reducing costs and friction
$1.7bn
Raised by Green FinTechs in H1-23
Sector Focus: Green FinTech Source: KPMG (2023), Worldbank (2023), Barclays (2023), WSC Analysis (2023) 27
$2.4tn
Raised for green bonds globally as of Jan-23 to support sustainable projects
$53tn
In AUM for global ESG assets by 2025
ESG and sustainability have become increasingly important to financial institutions. From carbon offsetting through payments, lending and investing into sustainable projects, to trading carbon, to risk analysis management and insurance, we are seeing increasingly innovative financial engineering to address environmental and sustainability challenges.
This is an area of sustainable technology that lends itself well to VC investments, given the asset light nature of these businesses That said, VCs should be aware of the growing regulatory burdens these businesses face, especially against greenwashing
75% Technology Notes
The EU Taxonomy Regulation is symptomatic of the efforts of Governments willingness to promote sustainable finance and achieve new environmental and climate goals The regulation aims to channel private capital towards environmentally sustainable investments Since its adoption in 2000 the financial industry has seen the emergence “green” focus practices
Industrial players and oil giants including Chevron and Exxon are taking the lead in investing in Carbon Capture and Utilisation (CCI) to reduce emissions from their extraction activities. Increasing consumer awareness of climate change and environmental issues has led to a growing demand for investment opportunities that promote sustainability and responsible environmental stewardship.
Stripe teamed up with Alphabet, Meta, Shopify, and McKinsey to launch Frontier, which aims to purchase $925m worth of carbon removal by 2030. Through Stripe, businesses can direct a % of their revenue to remove CO2.
Source: Climate Bonds Initiative (2023)
Notes: 1) Green, social, sustainability and sustainability-linked bonds, 2) Sustainability-linked bonds
Consumers and companies need tools and infrastructure that enable them to make sustainable spending decisions. The next wave of innovation for payments companies are tying transactions to carbon offsetting.
Tailwinds Challenges
+ Consumer demand
+ Ease of implementation
+ Growing transaction costs
+ Lack of transparency from off-setting initiatives
+ Already competitive market
Score: 7
Debt plays a major role in the green economy. The majority of heavy sustainability projects, such as solar panels or wind turbine installations are financed with debt. Sustainability-linked lending skyrocketed from $5bn in 2017 to $120bn in 2020.
Tailwinds Challenges
+ Many new policies and incentives are put in place to encourage green investments, including the issuance of green bonds
+ Institutional investors, including pension funds and asset managers, are increasingly interested in sustainable and responsible investment options
+ Green bonds may have lower yields
+ ”Greenwashing” concerns
Score: 7 WSC VC Investability Index: 7
Score: 7
Climate change affects insurance underwriting due to the prevalence of natural disasters in some regions. Innovations include climate projections; artificial intelligence and satellite monitoring; and insurance products, helping businesses assess climate-related risks and minimise losses.
Tailwinds Challenges
+ The rising frequency and severity of climaterelated events, such as hurricanes, wildfires, and floods, are driving demand for insurance and risk mitigation solutions
+ Difficulty of risk assessments
+ Lack predictability for pricing
+ Increasing loss ratios as prevalence of natural disasters grow
Score: 5
Most serious crypto companies in the climate space are centered around carbon credits, like Switzerland’s Toucan, which tokenises credits on blockchain. Blockchain can be a useful technology to prevent fraud and provide more transparency in carbon trading.
+ Transparency and traceability of transactions is facilitated by blockchain technology
+ Some blockchain networks, particularly proof-ofwork networks are criticised for their high energy consumption
+ Blockchain networks often face scalability issues


Sustainablefinancialplatform

Climatefocusinsuranceunderwriting

Dataanalyticsplatform
$450.3m raised to date
$139.7m raised to date

$97.0m raised to date

Softwaredesignedtopredictthephysicalriskof climatechange

Sustainabilityfocuseddigitalbankingservices
Source:
$37.5m raised to date
$26.3m raised to date
Source: Ellen MacArthur Foundation (2022), WSC Analysis (2023) Notes: 1) WSC portfolio includes 900.care offering refillable hygiene products 34 Sector Focus: Circular Economy
Software can solve for the 3 Rs: reducing, reusing, recycling, which are key aspects of sustainability and reducing overall emissions
2.1bn
Tonnes of waste dumped in landfills every year
1 Truckload
Of textile waste is discarded each second
9.3bn
Tonnes of CO2 emission that can be avoided by 2050 by implementing circular economy strategies
Our economy operates under a 'take-make-waste' system. In a circular economy, a fundamental requirement is that the materials re-enter the economy at the end of their use. The shift from a linear to a circular system is at the heart of the circular economy concept.
The sharing economy and second-hand market represent the most advanced sectors of the circular economy, largely thanks to major platform shifts (e.g. mobile, e-commerce, logistics), with some focusing on the optimisation of goods’ usage and promoting the idea of access over ownership.
$4.3tn Technology Notes
The circular economy is rapidly gaining traction across various sectors, fueled by public concern about waste reduction and resource scarcity
Policies & Regulation
Manufacturing is adapting to new global regulations, including Extended Producer Responsibility (EPR) regulations which require manufacturers to factor in the environmental costs of a product’s entire lifecycle into its market price.
This mandates manufacturers to bear the responsibility of the-end-of-life phase, encouraging waste reduction via take-back programs and contributing to recycling costs.
Controlled Landfill Landfill (Unspecified)
Sanitary Landfill (With landfill gas collection)
Open dump
Resource Scarcity
Depletion and increases in cost of natural resources like minerals, is driving the need for more efficient resource use and recycling. In the hightech industry, the rise in raw material costs has prompted manufactures to implement take-back schemes (e.g., Apple)
In the fashion industry, supply chain disruptions threatens margins, and the fashion industry now needs to rethink its supply chain and manage excess production
Score: 7
The sharing economy, exemplified by services like Uber and Airbnb, and the growth of secondhand market platforms such as eBay and Vinted, play a vital role by efficiently utilising resources and promoting product reuse.
Tailwinds Challenges
+ The sharing economy encourages the idea of access over ownership
+ Maturity and proven economic viability of these business models
+ Market saturation
+ Low margins
+ Limited barriers to entry
Score: 7
Technologies that improve product design and lifecycle management, or products that are easier to disassemble and recycle and using data analytics to optimise the use of resources.
Tailwinds Challenges
+ Commercial value of imbedding recyclability in product manufacturing
+ Can lead to cost optimisation in manufacturing process
+ Disrupts existing supply chain and infrastructure
WSC VC Investability Index: 7
Score: 5
Startups are developing new materials that are more sustainable and have a lower environmental impact, such as bioplastics, biomaterials, and recycled materials.
Tailwinds Challenges
+ Increasing awareness of environmental issues and resource depletion is driving demand for materials that have a lower environmental footprint
+ Disrupts existing supply chain and infrastructure
Score: 2
Startups are working on advanced recycling technologies to reduce waste, recover valuable materials, and create a circular economy from waste streams.
+ Regulations and standards are being implemented to promote responsible waste management, recycling, and waste reduction
+ Supply chain and infrastructure complexity
+ Achieving profitability
Waste Management


Sharing Economy


Operatorofasubscription-based electronics rentalplatformdesignedtoofferpay-as-you-go consumer electronics

Onlinemarketplaceforsecond-hand fashion productsenablingindividualstobuy,selland swapclothes,accessoriesandlifestyleitems

Developerofhardware-enabled,machine-visiondrivensoftwaredesignedtodetecttextiledefects in real-time

Developerofdigitaltoolsdesignedtodetectand provideanalyticsonwastemanagement

AIcomputervisionsoftwaretobedeployedin recyclingplantstomeasurewasteflowsand provideanalyticstoincreaserecyclingrates
$2.3bn raised to date
$562.5m raised to date

$32.3m raised to date

$23.6m raised to date
$17.0m raised to date
Carbon capture and management are intertwined, with a growing demand for direct carbon capture as companies seek to reduce emissions
14%
Potential reduction in greenhouse gas emissions from carbon capture by 2050
$250bn
Growth expected by the carbon-offset market by 2025
$2.7tn
Global carbon credit market by 2028
$6.1bn
Raised by carbon capture & management startups in the last 3 years
Carbon capture and management technologies are crucial in combating climate change To prevent a 5°C global temperature increase by 2050, we must reduce emissions and remove 220 gigatons of CO2 from the atmosphere.
While technologies within Direct Air Capture are still in their infancy and require significant investments to scale, carbon trading and offsetting technologies are mature and ready to scale.
Carbon markets, especially in software innovations for carbon trading, accounting, and offsets, have seen a significant increase in funding
With the implementation of the Corporate Sustainability Reporting Directive, numerous EU businesses are mandated to partake in carbon reporting Beginning in 2024, large enterprises operating within the EU with more than 250 employees must disclose their emissions including scope 3 value chain emissions.
In the UK, large enterprises, publiclylisted companies, and Limited Liability Partnerships (LLPs) must adhere to the Streamlined Energy and Carbon Reporting (SECR) policy, which mandates the reporting of their carbon emissions
Major industrial players and oil giants including Chevron and Exxon, are taking the lead in investing in Carbon Capture and Utilisation (CCI) to reduce emissions from their extraction activities, including fracking, while also enhancing their extraction capabilities.
Score: 8
Carbon markets, established in the 90s following the Kyoto protocol have matured significantly. Polluters can purchase credits to offset their emissions, tradable on open markets. Each credit equals one ton of CO2 equivalent.
Tailwinds Challenges
+ Emissions and carbon trading has become an established practice
+ Governments are reducing caps and demanding more transparency on emission levels
+ Oversaturated market
Score: 7
Software enabling companies to generate carbon emissions and ESG compliance reports.
Tailwinds Challenges
+ Carbon reporting mandatory in the EU for specific companies
+ New regulations coming into place including the SECR policy where carbon emissions reporting is mandatory
+ Oversaturated market
WSC VC Investability Index: 7
Score: 6
Exploring ways of utilising captured carbon such as converting it into useful products including fuels, chemicals, and building materials.
Tailwinds Challenges
+ Government support
+ Capital intensive projects primarily financed by governments or oil and gas companies
Score: 3
DAC technologies extract CO2 directly from the atmosphere through various chemical approaches which include solid DAC and liquid DAC. Solid DAC captures CO2 on the surface of a filter, while liquid DACs systems involve passing air through a chemical solution.
Tailwinds Challenges
+ Government support
+ Can be deployed around the world
+ Must demonstrate efficiency at scale
+ Massive industrial projects requiring large investments (e.g., Climeworks have raised over $700m but remains unprofitable)
+ Most expensive application of carbon capture
Score: 3
Capturing carbon emissions from industrial processes, such as cement and steel manufacturing, power plants or oil and gas production.
Tailwinds Challenges
+ Strong interest from oil and gas companies to finance such projects
+ Requires significant capital to deploy
+ Must demonstrate efficiency at scale
WSC VC Investability Index: 7
+ Criticised for providing a “free pass” for oil and gas companies to continue drilling


Developerofacarbonfootprintmanagement SaaSplatformtomeasure,analyse,andreport carbonfootprint

Developerofmachinelearning-based tools designedtotracktheperformanceofcarbon offsets

CarbonoffsettingAPIplatformintendedto manageandmitigatethecarbonfootprint

Carbonfootprinttrackingapplication

SaaS-basedclimateemissionsmanagement platformdesignedtohelpbusinessesscalethe climatefootprintdown
$114.5m raised to date
$97m raised to date
$81.5m raised to date
$26.8m raised to date
$25.7m raised to date
Source: IEA (2023), Goldman Sachs Research (2023), US Department of Energy (2022), Reuters (2023), WSC Analysis (2023) 48 Sector Focus: Electric Infrastructure
The pressing need for better grids, better storage, and better electricity management systems can be solved with software
50%
Of cars will be electric by 2035
90%
Decrease in the price of Lithium-ion battery in the last 10 years
$40bn
Went to investments in battery storage in 2023
The coming years will require a substantial increase in electricity supply, driven primarily by booming EV sales. As renewable energy and EVs gain momentum, the auto battery and energy storage markets are expected to grow at a 25%+ CAGR over the next decade. The widespread adoption of EV charging could lead to a 15% – 50% increase in peak electricity demand on local grids, requiring costly grid updates.
We believe software can address many of these issues. Energy creation and storage now goes hand in hand with software to help optimise loads at peak times, redistribute to the grid, and automatically rebalance how energy flows through our grids.
70x Technology Notes
Countries around the world are implementing EV-friendly policies and subsidies, encouraging car owners to make the switch
Yearly global EV sales ($m)


Peak DCfast chargingspeed for consumer cars
In 2022-2023, significant policy changes were announced in the EU and the US, including new CO2 standards and the IRA, driving cleaner transportation and EV adoption
Additionally, the March 2023 adoption of the AFID aims to promote alternative fuels, including EV charging infrastructure, setting targets for charging station deployment and common interoperability standards


Peak loadof100 singlefamilyhomes (avg.load=1.2kW perhouse)
To achieve 100% clean power by 2035 the Biden Administration has allocated $8bn to fund power-grid improvements
In June 2023, the DOE announced its largest-ever loan in the LPO’s 15-year history to strengthen domestic battery production. Ford secured a $9.2bn commitment in 2023, following GM’s $2.5bn loan at the end of 2022.
Score: 9
As the energy system decentralises and becomes more intermittent, startups are developing software platforms and services to optimise energy use, reduce costs and improve grid reliability. Emerging spaces are Virtual Power Plants (VPPs) and Distributed Energy Resources (DERs).
Tailwinds Challenges
+ Ageing grid infrastructure requires renovation
+ Reduction in cost of installation and increase in energy cost incentivizing individual homeowners to become energy producers
+ Renovating grid infrastructure requires public authority intervention
+ Complexity around interconnection with the grid by energy systems “behind the meter”
+ Slow sales cycles
Score: 6
Energy storage spans various sizes, from small vehicle batteries to large grid systems like the Tesla Megapack. While Lithium-ion batteries dominate, promising alternatives include the use of rust in new iron batteries, sodium-ion batteries and liquid metal batteries.
Tailwinds Challenges
+ Considerable reduction of cost (price per Kwt of energy stored with lithium-ion battery has dropped by 97% since 1991)
+ US and EU legislation is cutting red tape, providing tax credits and public subsidies
+ Highly competitive market
WSC VC Investability Index: 7
+ China’s raw material dominance in lithium, graphite and battery anode materials
Score: 6
With the rising popularity of EVs, the need to improve EV batteries and charging infrastructure is growing. A promising new market is emerging, focusing on building charging networks and charging solutions.
Tailwinds Challenges
+ Many regulations are put in place to subsidise the sale of EV by consumers
+ In 2022 the Zero Emission Government Fleet Declaration, requires governments to reach 100% zero emission vehicles in public procurement
+ EV battery space is dominated by incumbents
+ EV charging networks requires contracting with public authorities
+ Low margins


Developerofenergy-internetapplications designedtointegratealldistributedenergy resources

Developerofpredictiveanalyticssoftware designedtooptimisethedevelopmentand operationoflithium-ion batteries

Developerofenergyintelligencesoftware designedtomakechargingelectricvehiclesclean andcheapforutilitiesandtheircustomers

Developerofelectrificationsoftwaredesignedto connectelectricvehiclestothegrid

Developerofdigitalinfrastructuressoftwareasa service-basedplatformdesignedtoconnect energyhardwaretoapplications
$202.6m raised to date
$76.6m raised to date
$56.5m raised to date
$50.0m raised to date
$17.3m raised to date

Source: Globe News Wire (2023), WSC Analysis (2023) 54 Sector Focus: Construction
Despite the physical nature of the built environment, the sector leverages software to reduce emissions and improve energy efficiency
40%
Of annual world CO2 emissions
$300bn
Market size of the global green
market
1 NYC
Built every month for the next 40 years
The sustainable construction sector has experienced rapid growth in response to the demand for eco-friendly construction materials. Among various construction materials, concrete is the most crucial due to its significant global consumption, second only to water. Concrete accounts for 8% of human-made CO2 emissions, highlighting the urgent need for more sustainable alternatives.
Other emerging technologies include enhancing building energy efficiency through software and connected devices, which can tap into consumer markets.
30bn Technology Notes
Rising energy costs drive innovations supported by government regulations, including building isolation and energy management
Policies & Regulation
Regulations on building emissions, design, and efficiency standards are emerging around the US (California Green new deal). New certification systems and standards are being applied to construction, such as LEED (Leadership in Energy and Environmental Design) or BREEAM (Building Research Establishment Environmental Assessment Method)
Over 50 US regions have proposed or enacted restrictions on natural gas in residential homes which will increase electricity needs
Costs of energy
The rise in energy cost for individual homes highlight the need for building renovations and figuring out better ways to manage heating, ventilation, and air conditioning (HVAC)
Global Green Cement Market Size
Score: 8
Building automation systems can help reduce energy consumption by controlling heating, cooling, and lighting systems.
Tailwinds Challenges
+ Consumer demand for IoT and smart homes
+ Growing energy costs
+ Government regulations and standards pushing for more efficient energy systems
+ Competitive market
+ High upfront costs
+ Integrating various components and systems (e.g., HVAC, lighting, security)
+ Compatibility issues and the need for skilled technicians
Score: 4
Companies are developing sustainable building materials that have a lower environmental impact than the highly CO2 emitting cement and concrete. These new materials could be new biomaterials or reused materials. Organic materials, like hemp, are now being used for isolation.
Tailwinds Challenges
+ Governments and municipalities are implementing regulations and standards that encourage or require the use of sustainable construction materials, such as energy efficiency requirements, green building certifications, and building codes
+ Sustainable materials may have a higher upfront cost compared to traditional materials
WSC VC Investability Index: 7
+ Supply chain issues and raw material availability
+ Competition from traditional materials
Score: 1
Prefabricated construction involves building sections of a building off-site and then assembling them on-site. This is an area where 3D printing is playing an interesting new role. This reduces construction waste and can speed up the building process.
Tailwinds Challenges
+ Speed and efficiency
+ Design flexibility
+ High upfront costs (green premium)


Energymanagementandconsumptiontracking platformandsolarenergyequipmenttomonitor andoptimisesolarenergyconsumption

Install,manageandfinancerenewableenergy technologiesinthehome

Enterprisesoftwareplatformforcommercialreal estate
Homeimprovementservicesintendedtostop homeenergywasteandelectricity

Boilercontrolandindoortemperaturesensor networkdesignedtocontrolheatingsystemsin buildings
$576.0m raised to date
$77.5m raised to date
$73.9m raised to date
$57.6m raised to date
$30.2m raised to date
Source: Eurostat (2023), Agfunder (2023), Statista (2023), Our world in data (2019), WSC Analysis (2023) 60 Sector Focus: AgriTech & FoodTech
Food production remains a key focus for VC funds given its close ties to climate issues and the need to feed a growing global population
70%
Increase in food production needed to feed the world population by 2050
$260bn
Estimated global FoodTech market size in 2022
1/3
Of all food produced is lost or wasted, costing the global economy close to $940bn each year
A transition toward greener practices in agriculture and food manufacturing is critical, given that the current food system contributes to a third of CO2 emissions worldwide, consumes 70% of freshwater usage, drives 80% of global deforestation, and results in approximately one third of global food production going to waste.
Technological advancements combined to consumer demand for sustainable, healthy, affordable, and safe food options have led to the emergence of large unicorns in this space. Some solutions are more capital intensive than others, especially within alternative proteins, which saw substantial investment but has not reached global scale.
26% Technology Notes
Amount invested by category ($bn)
Decrease in the amount invested in delivery startups in 2022 compared to 2021.
Increase in the amount invested in the rest of FoodTech in 2022 compared to 2021.
Policies & Regulation
Governments are passing legislation to support sustainable farming. The UK government is allocating grants from £500,000 to £1.5m from a £12.5m fund for sustainable agriculture projects
Both the US and EU have committed to halving per capita food waste at the retail and consumer levels by 2030 and reduce food losses across the food production and supply chains.
To feed a projected global population of ~9.6bn people by 2050, a significant growth in food production will be required. At the same time, around 36 2m people worldwide currently struggle to afford a quality meal every second day The UN anticipates a 15% increase in global meat demand by 2031.
Score: 9
The infrastructure and software supporting AgriTech companies as they expand throughout the the value chain.
Tailwinds Challenges
+ Market maturity and readiness in adopting new software
+ Competitive and saturated market
+ Slow sales cycles
Score: 7
New technologies are being developed to improve the efficiency and sustainability of farming practices, such as using drones, sensors, and AI to monitor crops and optimise inputs.
Tailwinds Challenges
+ Reduces the need for excessive water, fertilisers, pesticides, and other resources
+ Optimise crop yields and productivity
+ Significant initial investment in hardware, software, and equipment
WSC VC Investability Index: 7
+ Farmers may exhibit resistance to adopting new technologies
Score: 5
There is a growing trend towards alternative proteins, such as plant-based and lab-grown meat, as consumers become more interested in sustainable and ethical food choices.
Tailwinds Challenges
+ As the global population continues to grow, alternative proteins offer a potential solution to food security
+ Increasing awareness of environmental and ethical concerns related to traditional livestock farming has led to a growing demand
+ Tough to scale
+ Low margins
+ Distribution challenges
Score: 4
Startups tackling food waste through new uses for products that would otherwise be discarded, such as turning 'ugly' produce into snacks or converting food waste into biofuels.
Tailwinds Challenges
+ Some governments and regions are implementing regulations and initiatives to encourage food waste reduction
+ Growing consumer demand
+ Supply chain and infrastructure complexity
+ Low margins
Score: 4
With the rise of urbanisation and the need to produce more food with less land and water, vertical farming is becoming increasingly popular. Most of these companies are using LED lighting and hydroponics to grow crops in stacked layers in urban environments.
Tailwinds Challenges
+ Resource efficient using significantly less land and water than traditional farming methods
+ Enables year-round production
+ Reliance on artificial lighting and climate control systems that are energy-intensive and sensitive to energy price fluctuations
+ High upfront costs
+ Tough to scale


Developerofmachinevisiontechnologies designedtomonitorandanalyseplant development

Smartagricultureequipmentdesignedtooffer an alternative to chemical-intensiveagriculture

Freshsupplychainplatformtodealwith perishablecategories

Ingredientorderingapplicationdesignedto connectrestaurantsandsuppliersfromallover the world

SaaStoolforecastsfoodsupplyanddemand, enablingfoodretailersandsupplierstomanage theirinventoryandreducefoodwastage
$300.0m acquired for

$284.0m acquired for
$148.0m raised to date
$111.0m raised to date
$72.0m raised to date
Source: Plastics Ocean International (2023), OECD (2023), Smithers (2020), WSC Analysis (2023) 67 Sector Focus: Packaging & New Materials
Sustainable packaging innovation is on the rise, with software firms playing a key role in advancing manufacturing and packaging design
380m
Tonnes of plastic produced annually, 50% of which are for single-use items
9%
Of global plastic waste is currently recycled
$57.9bn
Market size of the global ecommerce packaging industry
In 2019, global plastic packaging production exceeded 360m metric tons, making up a $917bn industry. By 2050, plastic production is projected to triple and will account for one-fifth of global oil consumption. This poses significant environmental challenges and calls for a major shift in packaging practices, while the large market size also makes it an attractive sector for investors.
Emerging packaging startups are actively developing sustainable, efficient, and consumer-friendly solutions using advanced materials and technologies to foster a circular economy.
$917bn Technology Notes
Packaging accounts for nearly half of global plastic use, and this industry has seen a surge in investment driven by new legislations Global
Policies & Regulation
Regulations around the world cracking down on single-use plastics.
The EU banned items including plates, cutlery, balloon sticks and straws in July 2021, and as of October 2023, the UK is implementing similar rules.
In the US, multiple states are enforcing laws to make all single-use products recyclable or compostable by 2032
As consumers are increasingly aware of plastic pollution and its impact on ecosystems, the demand for sustainable packaging alternatives is rising
Brands must innovate in their packaging to show their commitment to environmental consciousness and attract eco-conscious consumers.
Score: 8
The manufacturing of new materials requires infrastructure to scale up research but also to help consumers navigate this new packaging market.
Tailwinds
+ Market maturity and readiness in adopting new software
Challenges
+ Already competitive and saturated market
Score: 5
Several startups are focused on developing packaging materials that are biodegradable and compostable. These bio-materials generally produces flexible packaging made from plant-based materials (for example mushroom or seaweed).
Tailwinds
+ Regulation are favoring sustainable materials vs. single-use plastics
+ Consumers are increasingly seeking products made from sustainable materials
Challenges
+ Technologies are in the early stages of scaling
+ Distribution remains an issue
WSC VC Investability Index: 7
+ Low margins
Score: 5
Startups are also developing packaging materials made from waste materials, such as compostable plant-based materials, and biodegradable plastics from food waste.
Tailwinds
+ Commercial value of imbedding recyclability in product manufacturing
+ Can lead to cost optimisation in manufacturing process
Challenges
+ Technologies are just beginning to scale
+ Distribution remains an issue
+ Low margins
Score: 5
Rapidly growing sector focused on developing and commercialising innovative materials as alternatives to traditional materials derived from fossil fuels. The main areas of research are Bioplastics, Bio-based Textiles, Biomimetic Materials, Bio-based Composites.
Tailwinds Challenges
+ Increasing awareness of environmental issues and resource depletion is driving demand for materials that have a lower environmental footprint
+ Technologies are in the early stages of scaling
+ Distribution remains an issue
+ Low margins


Developerofcompostablematerials

Providerofgrocerydeliveryservicesintendedto reducetheuseofplastic

Platformintendedtotransformusedproducts for a waste-freeshoppingexperience

Operatorofadigitalpurchasingpackaging platformintendedtoconnectwell-known brands withpackagingsuppliers
Providerofsupplychaininfrastructureintended forcircularpackaging
$112.0m raised to date
$70.0m raised to date
$6.7m raised to date
$6.0m raised to date
$3.5m raised to date
Clean energy is achievable but will require hefty investments in new technologies and infrastructure, beyond the traditional VC scope
73%
Of emissions are created by energy use
$2tn Technology Notes Source: S&P Global (2021), Lightsourcebp (2023), McKinsey (2022), WSC Analysis (2023)
89%
Decrease in the price of solar energy in the last 10 years
80%
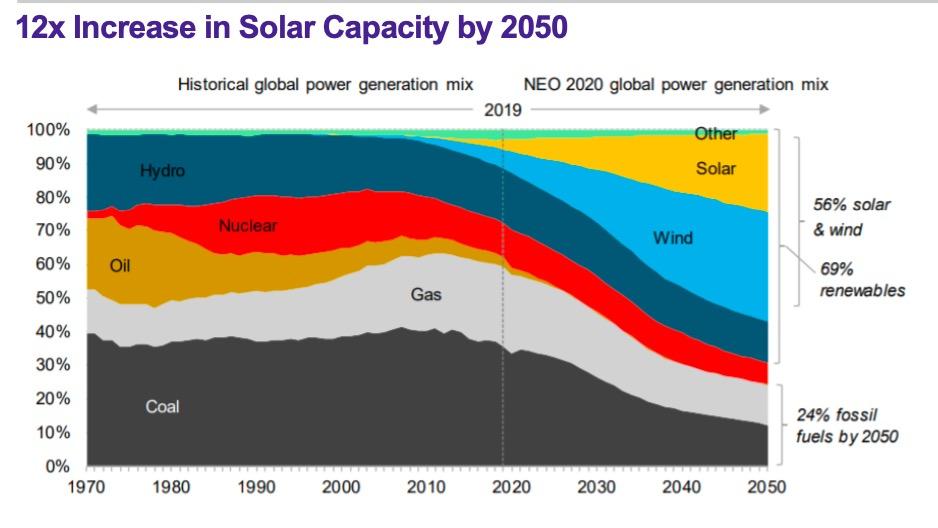
Surge in capacity for solar and wind power by 2026
The renewable energy market is growing significantly thanks to cost competitiveness, supportive policies and rising demand. Renewables are finally more cost-effective to produce than fossil fuels. In 2022, wind and solar power generated 22% of the EU's electricity, overtaking gas for the first time. In the EU, renewables now account for nearly 40% of total electricity generation.
Direct energy production lends itself more to infrastructure-type investments due to the long-term nature and capital intensity of these projects. That said, investors are monitoring Software as a Service (SaaS) offerings in these sectors for designing solar field infrastructure and optimising engineer deployments.
74 Sector Focus: Clean Energy
Government subsidies, grants and tax breaks are driving unparalleled growth in the energy sector, particularly in solar and wind
12x Increase in Solar Capacity by 2050 (%)
The US Inflation Reduction Act is the largest federal climate change legislation, allocating $783bn for energy security and climate initiatives including tax credits like the Investment Tax Credit (ITC) and Production Tax Credit (PTC), enabling deductions for renewable energy system costs for federal taxes.
56%
69% renewables
Geopolitical and macro pressures
Amid the Ukraine conflict and ongoing Gulf tensions, Western nations (particularly in Europe) are under pressure to secure their energy independence This context played a role in the US passing the IRA and the EU introducing a new Green Deal Industrial Plan
Score: 5
The solar industry has considerably matured in the last decade, with innovative technologies making solar energy more affordable and accessible, while software is coming in to reduce inefficiencies, help design infrastructure, monitor plants, and support engineers.
Tailwinds Challenges
+ Price has decreased by 89% in the last decade
+ Capacity is growing steadily
+ US and EU legislation is cutting red tape, providing tax credits and public subsidies
+ Market is dominated by large industrials
Score: 5
Wind turbines technologies have advanced significantly, primarily by increasing turbine size for greater energy generation. Innovations are also improving the efficiency and reliability of wind turbines, including vertical axis wind turbines, bladeless turbines, and offshore wind farm models.
Tailwinds Challenges
+ US and EU legislation is cutting red tape, providing tax credits and public subsidies
+ Governments are investing in offshore wind farms
+ Criticised for their visual impact on land
WSC VC Investability Index: 7
+ Offshore wind farms that require shallow seabeds
Score: 4
Nuclear energy has progressed slowly, with most technologies relying on fission. Despite major investments like ITER, progress in fusion has been limited and attention is turning to Modular Reactors (SMRs), Molten Salt Reactors (MSRs) and new Fusion Energy approaches.
Tailwinds Challenges
+ Proven and reliable technology
+ US and EU legislation is cutting red tape, providing tax credits and public subsidies
+ Lack of significant breakthrough in fusion
+ European governments have reduced research due to public pressure
+ Capital intensive projects
Score: 5
This category includes dams and tidal turbines. Hydro energy stands out as the most predictable source of energy, being the only renewable option capable of consistently providing reliable energy.
Tailwinds Challenges
+ Proven and reliable technology
+ Constant
+ Capital intensive projects
+ Requires specific land available
Score: 5
Waste-to-Energy technologies cover various methods for converting waste materials into energy, including incineration, gasification, pyrolysis, and anaerobic digestion.
Tailwinds Challenges
+ Proven and reliable technology
+ Not entirely clean
+ Limited profitability
WSC VC Investability Index: 7
Score: 4
Hydrogen, abundant in the universe, is a superior clean energy alternative for energy generation and storage, used in a variety of applications including transportation, heating and power generation and serves as an energy storage medium.
Tailwinds Challenges
+ Ability to use existing fossil fuel infrastructure
+ Versatility in energy applications
+ Supported by new government regulations
+ Limited natural hydrogen availability
+ Green hydrogen production is challenging and costly
+ Storage and production involve significant energy loss


Developerofengineeringdesignandsales proposalsoftwaredesignedfordistributedsolar andstorageenterprises

Provider of installation and services related to solar,electricitystorage,andcharging infrastructure

Renewableenergyassetmanagement
Renewableenergytransactionplatform designedtoconnectcorporateandinstitutional powerbuyerstooffsiteprojects

$523.6m raised to date
$451m raised to date
$120m raised to date
$68.4m raised to date
$23.5m raised to date