Ensure Equal Pay for Equal Work


Transparent, diverse workforces are more equitable, productive, have less turnover, and produce higher profits. That’s why The Women’s Foundation of Colorado and our partners helped pass the Equal Pay for Equal Work Act in 2019, leading a national trend for pay transparency. However, gender, racial, and economic inequities remain. We must act now to ensure equal pay for equal work.

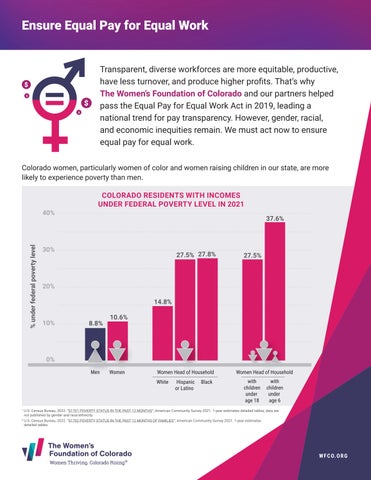
Colorado women, particularly women of color and women raising children in our state, are more likely to experience poverty than men.


$ $
$ 10% 0% 20% 30% 40% % under federal poverty level 8.8% 10.6% 14.8% 27.5% 27.8% 27.5% 37.6% White Hispanic or Latino Women Head of Household Black with children under age 18 with children under age 6 Women Head of Household WFCO.ORG COLORADO RESIDENTS WITH INCOMES UNDER FEDERAL POVERTY LEVEL IN 2021 1 U.S. Census Bureau, 2022. “S1701 POVERTY STATUS IN THE PAST 12 MONTHS”; American Community Survey 2021. 1-year estimates detailed tables; data are not published by gender and race/ethnicity. 2 U.S. Census Bureau, 2022. “S1702 POVERTY STATUS IN THE PAST 12 MONTHS OF FAMILIES”; American Community Survey 2021. 1-year estimates detailed tables.
$
Women are nearly half of the Colorado workforce (46%) and are more likely to have a bachelor’s degree.


Yet, they are still paid less on average. The average earnings for women in Colorado who work full-time, year-round are 83% of men’s average earnings for full-time work.4 The gender wage gap persists in sectors where women are the majority of the workforce and the gap is even wider in sectors where most of the workers are men.5
WOMEN ARE PAID LESS THAN MEN IN BOTH WOMEN- AND MEN-MAJORITY SECTORS
Updates to Colorado’s Equal Pay law will increase workplace fairness and transparency even more for both employees and employers. Take action to help pass SB23-105 to Ensure Equal Pay for Equal Work.
Ensure Equal Pay for Equal Work Percent with bachelor’s degree or higher COLORADANS AGE 25 AND OLDER WITH BACHELOR’S DEGREE OR HIGHER 46% 42.9% 3 Calculated based on U.S. Census Bureau, 2022. “B15002 SEX BY EDUCATIONAL ATTAINMENT FOR THE POPULATION 25 YEARS AND OVER (TWO OR MORE RACES)”; American Community Survey 2021. 1-year estimates detailed tables. 4 U.S. Census Bureau, 2022. “S2414 INDUSTRY BY SEX AND MEDIAN EARNINGS IN THE PAST 12 MONTHS (IN 2021 INFLATION-ADJUSTED DOLLARS) FOR THE FULL-TIME YEAR-ROUND CIVILIAN EMPLOYED POPULATION 16 YEARS AND OVER”; American Community Survey 2021. 1-year estimates detailed tables 5 U.S. Census Bureau, 2022. “S2413 INDUSTRY BY SEX AND MEDIAN EARNINGS IN THE PAST 12 MONTHS (IN 2021 INFLATION-ADJUSTED DOLLARS) FOR THE CIVILIAN EMPLOYED POPULATION 16 YEARS AND OVER”; American Community Survey 2021. 1-year estimates detailed tables. $42,883 $54,108 Sector: Educational services, and health care and social assistance Sector: Professional, scientific, and management, and administrative and waste management services $54,119 74% EMPLOYMENT H ELD BYWOMEN EM NT H ELD 41.7% $77,994
3