


Covering Data For Calendar Year 2023
Esta información es importante. Si necesitan ayuda en traducir pueden contactar la cuidad de Westminster.
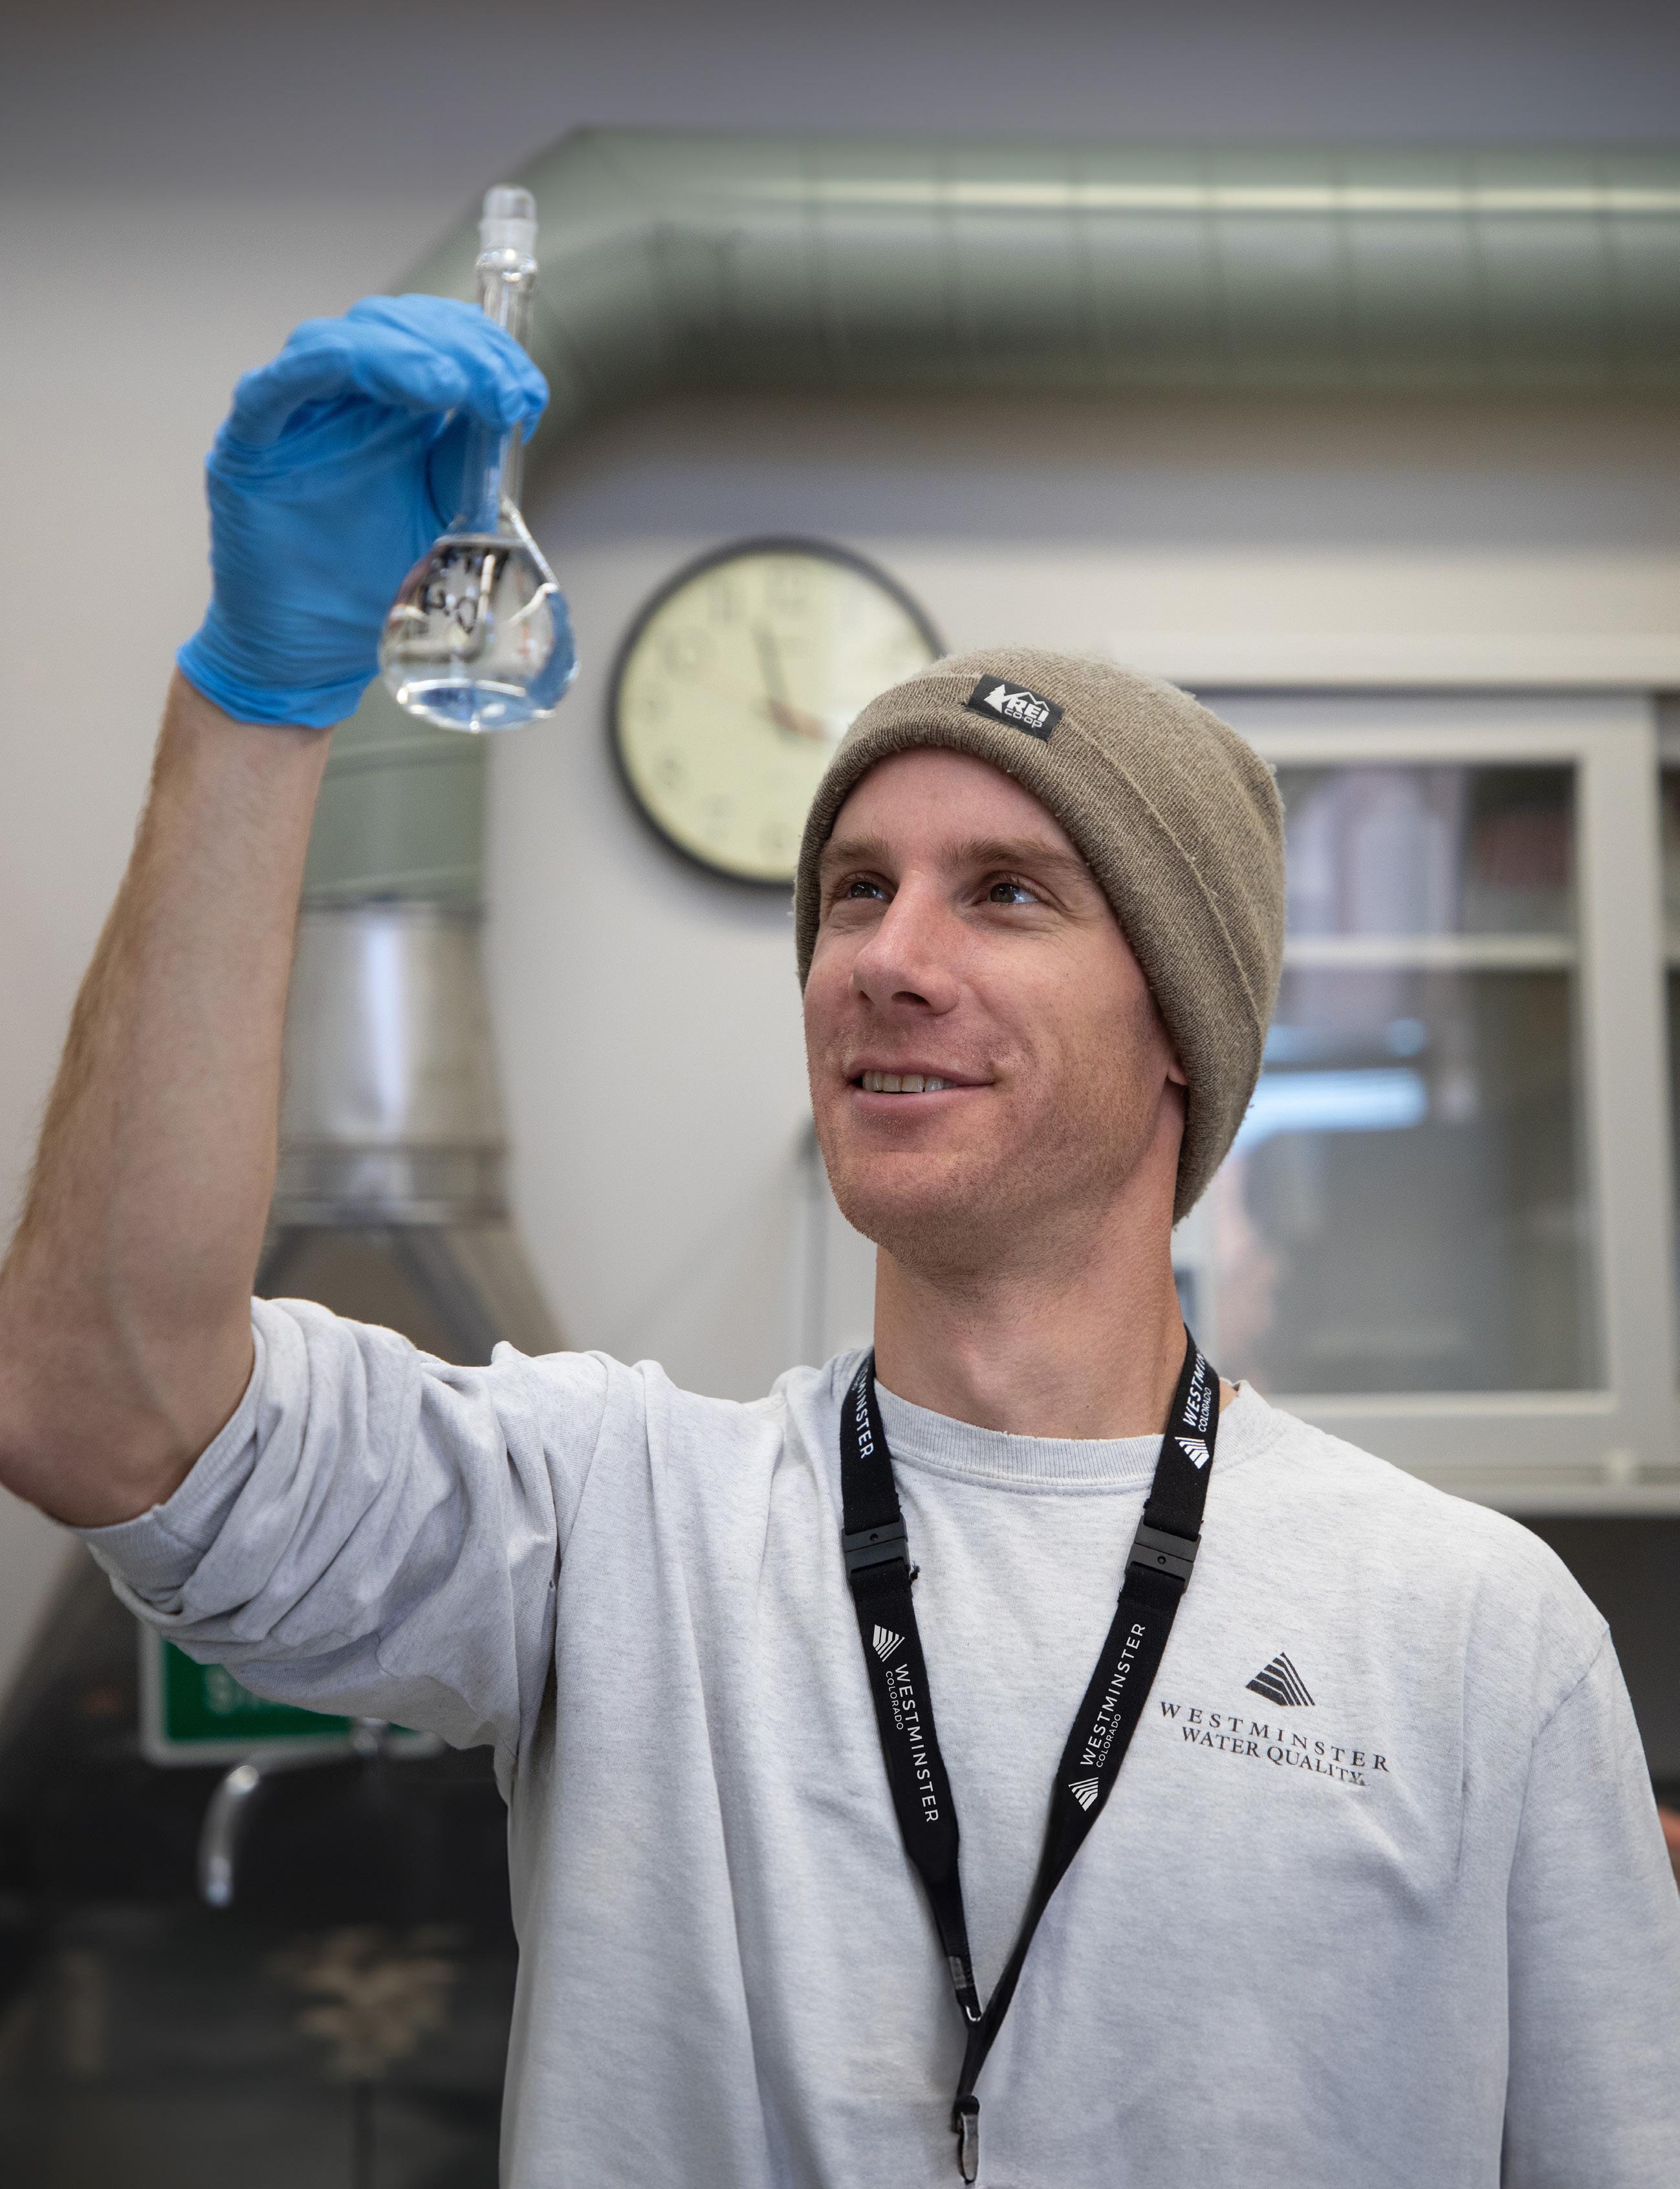 John Senior Water Quality Analyst, Public Works And Utilities
John is analyzing water samples in the lab at Semper Water Treatment Facility
Dear Westminster Community,
As part of our commitment to providing our community with safe, clean, and affordable drinking water, I am pleased to present our 2024 Water Quality Report. Our staff works hard every day ensuring the water we provide our customers for drinking, cooking, and cleaning meets and exceeds state and federal drinking water standards.
Our efforts include a collaborative, multi-city partnership to protect our watershed from wildfires, following the latest water quality science, and making long-term investments in our infrastructure. The City is making significant progress toward a new drinking water facility along Westminster Boulevard that will ensure our community has the ability to have clean drinking water, respond to potential wildfire-related contaminants, and expand treatment capacity. In a changing world, the new drinking water facility offers our community additional resilience to emerging water quality challenges.
Thank you for taking the time to read this report, and if you have any questions, please do not hesitate to email our water quality team at water@westminsterco.gov. We are here to serve you!
Respectfully,
City Manager Mark Freitag
The Safe Drinking Water Act www.epa.gov/sdwa
Your Water Quality Report www.westminsterco.gov/waterquality
CDC - Consumer Confidence Reports www.cdc.gov/healthywater/drinking/public/understanding_ccr.html

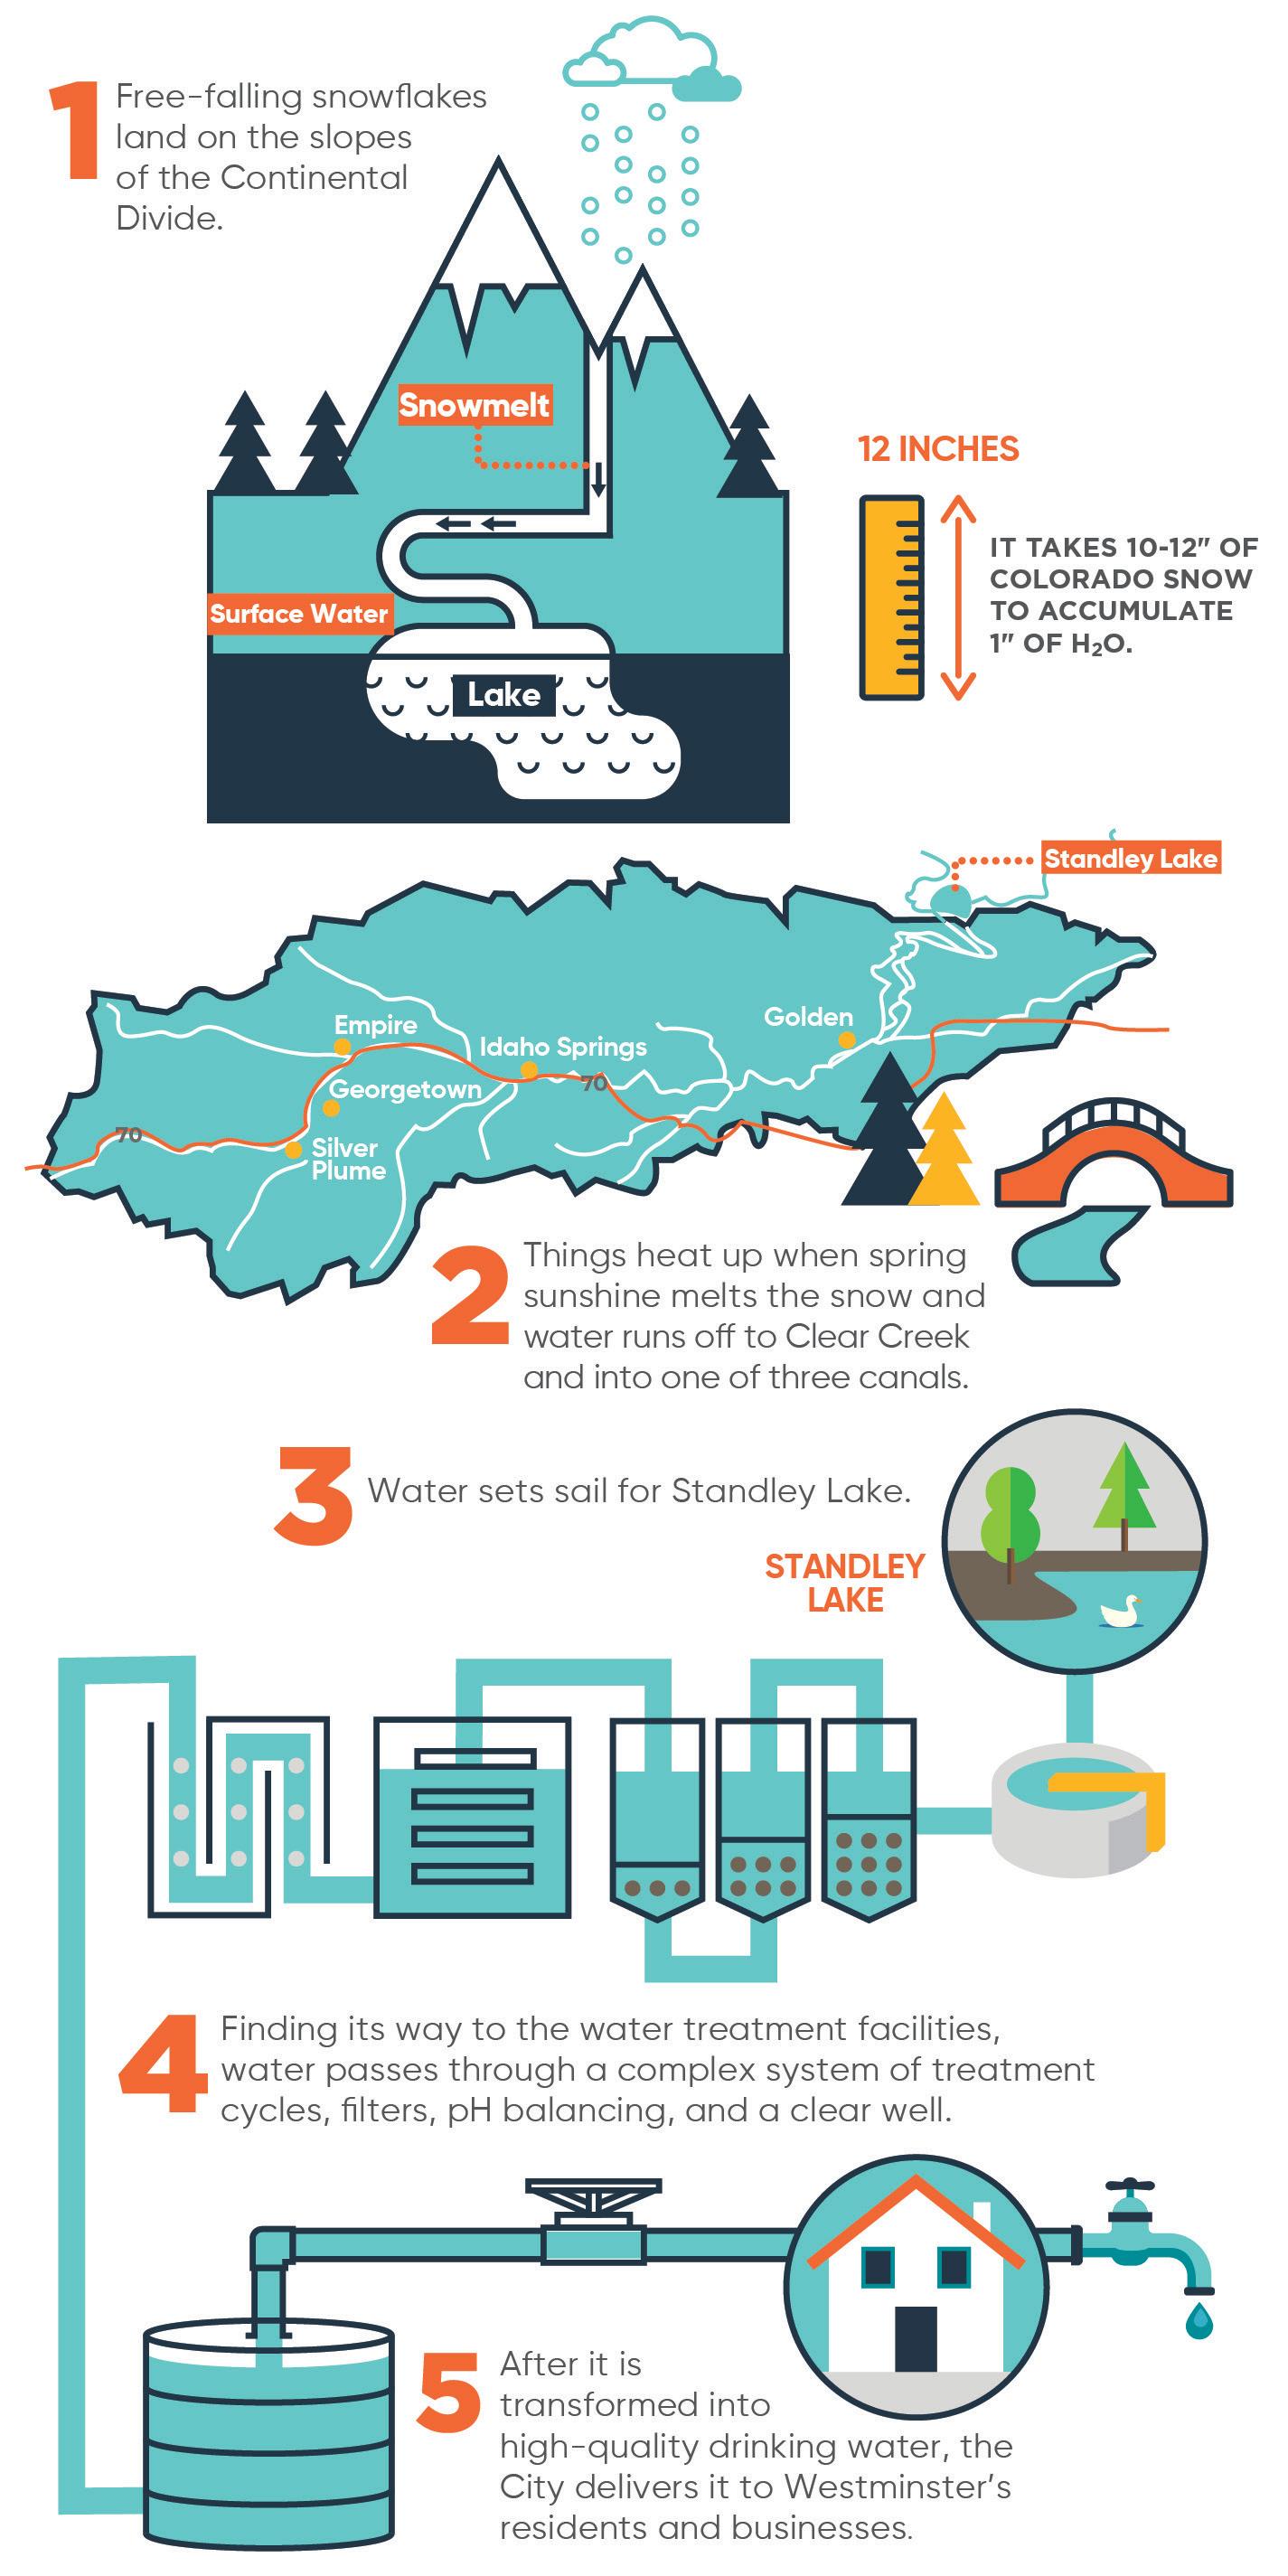
Westminster’s water begins its journey as snow from the eastern slope of the Rocky Mountains along Clear Creek and is diverted to Standley Lake through a complex canal system. The lake stores up to 14 billion gallons of water. Half of the water belongs to the City of Westminster and the other half is reserved for Thornton, Northglenn, and other entities. Westminster’s storage in Standley Lake is enough to serve City customers for one year. While Standley Lake’s water supply varies throughout the year based on snowpack, rainfall, and seasonal weather, the lake’s water level will typically be lowest in the fall after a summer of irrigation water demands by people and farms.
Water is a precious resource, and we make every effort to save every drop. The City partners closely with neighboring communities to monitor Clear Creek and the canal systems to reduce
potential threats to our source water. In an emergency, the City and our partner communities have the ability to reroute contaminated water around Standley Lake until the issue can be resolved.
Why does my water taste different in the fall?


Seasonal changes at Standley Lake may temporarily make our water taste a little earthy.
The Colorado Department of Public Health and Environment (CDPHE) completed a Source Water Assessment Project report (SWAP) for our water supply. It provides a screening evaluation of potential contamination that could occur in the Standley Lake watershed. It does not mean that the contamination has occurred or will occur. This information is used to evaluate the need to improve our current water treatment capabilities and prepare for future contamination threats.
A copy of the report is available by contacting our Water Quality staff at 303-658-2461 or by email at water@westminsterco.gov
Potential sources of contamination to our source water include existing/abandoned mines, aboveground and underground leaking storage tanks, Environmental Protection Agency (EPA) abandoned contaminated sites, EPA chemical inventory/storage sites and toxic release sites, EPA hazardous waste generators, permitted wastewater discharges, solid waste sites, forests, fallow and pasture/hay, septic systems, oil/gas wells and roads, EPA Superfund sites, commercial/ industrial/transportation, residential areas, urban recreational grasses, quarries/strip mines, gravel pits, and row crops.
Here is how the City cleans our drinking water. Similar to most other drinking water treatment facilities, the City uses four steps for treating water.
Standley Lake
STEP 1: Flocculation and Sedimentation
Water from Standley Lake enters the drinking water treatment facility and is channeled into a mixing chamber where chemicals called coagulants cause small particles such as dirt and debris to stick together, forming larger particles. As the particles continue to coagulate or stick together, they get heavier. Over time, the heavy, larger particles settle to the bottom of the settling tanks where they are removed through a bottom drain. Lime is added during flocculation for corrosion control.
STEP 2: Filtration
The cleaner, clearer water that remains flows through a series of fine media filters. Semper, the City’s oldest drinking water treatment facility, uses a 36-inch layer of sand and anthracite to filter water. It’s a lot like a three-foot-tall Brita® water filter. Built in 2001, Northwest Treatment Facility is a more modern treatment facility that uses a thin microfiltration membrane to remove fine particulates.
STEP 3: Disinfection
After the water has been filtered of large and fine particles, a small amount of chlorine is added to eliminate bacteria or viruses.
STEP 4: Water Delivery
Once our drinking water has been cleaned and filtered, it is pumped to one of several water towers. Thanks to gravity, clean and safe water flows to our homes 24/7 through a network of over 550 miles of water lines.
CHLORINEHere’s a glimpse into our evaluation of water quality during the year.
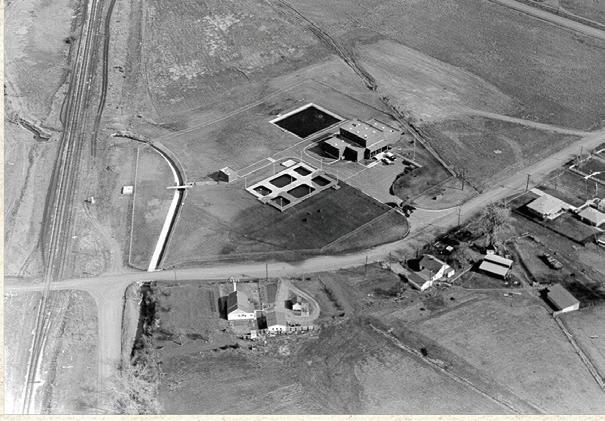
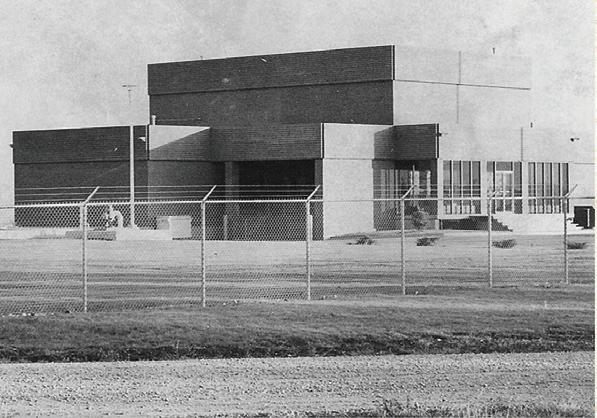
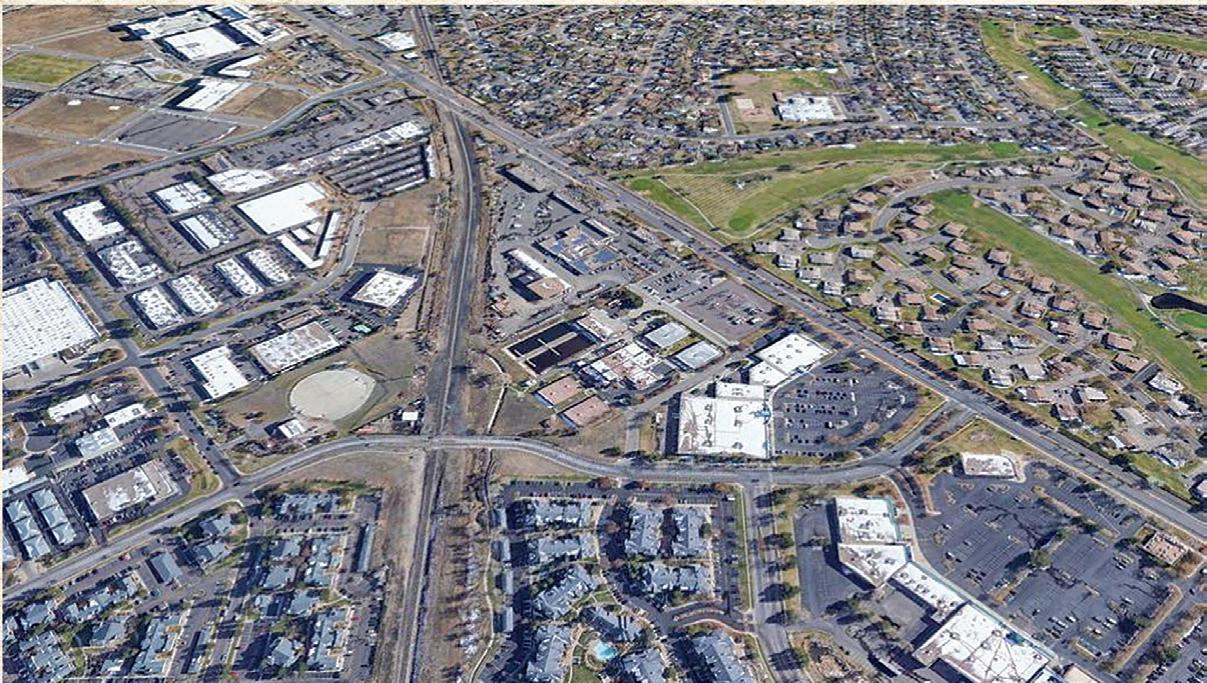
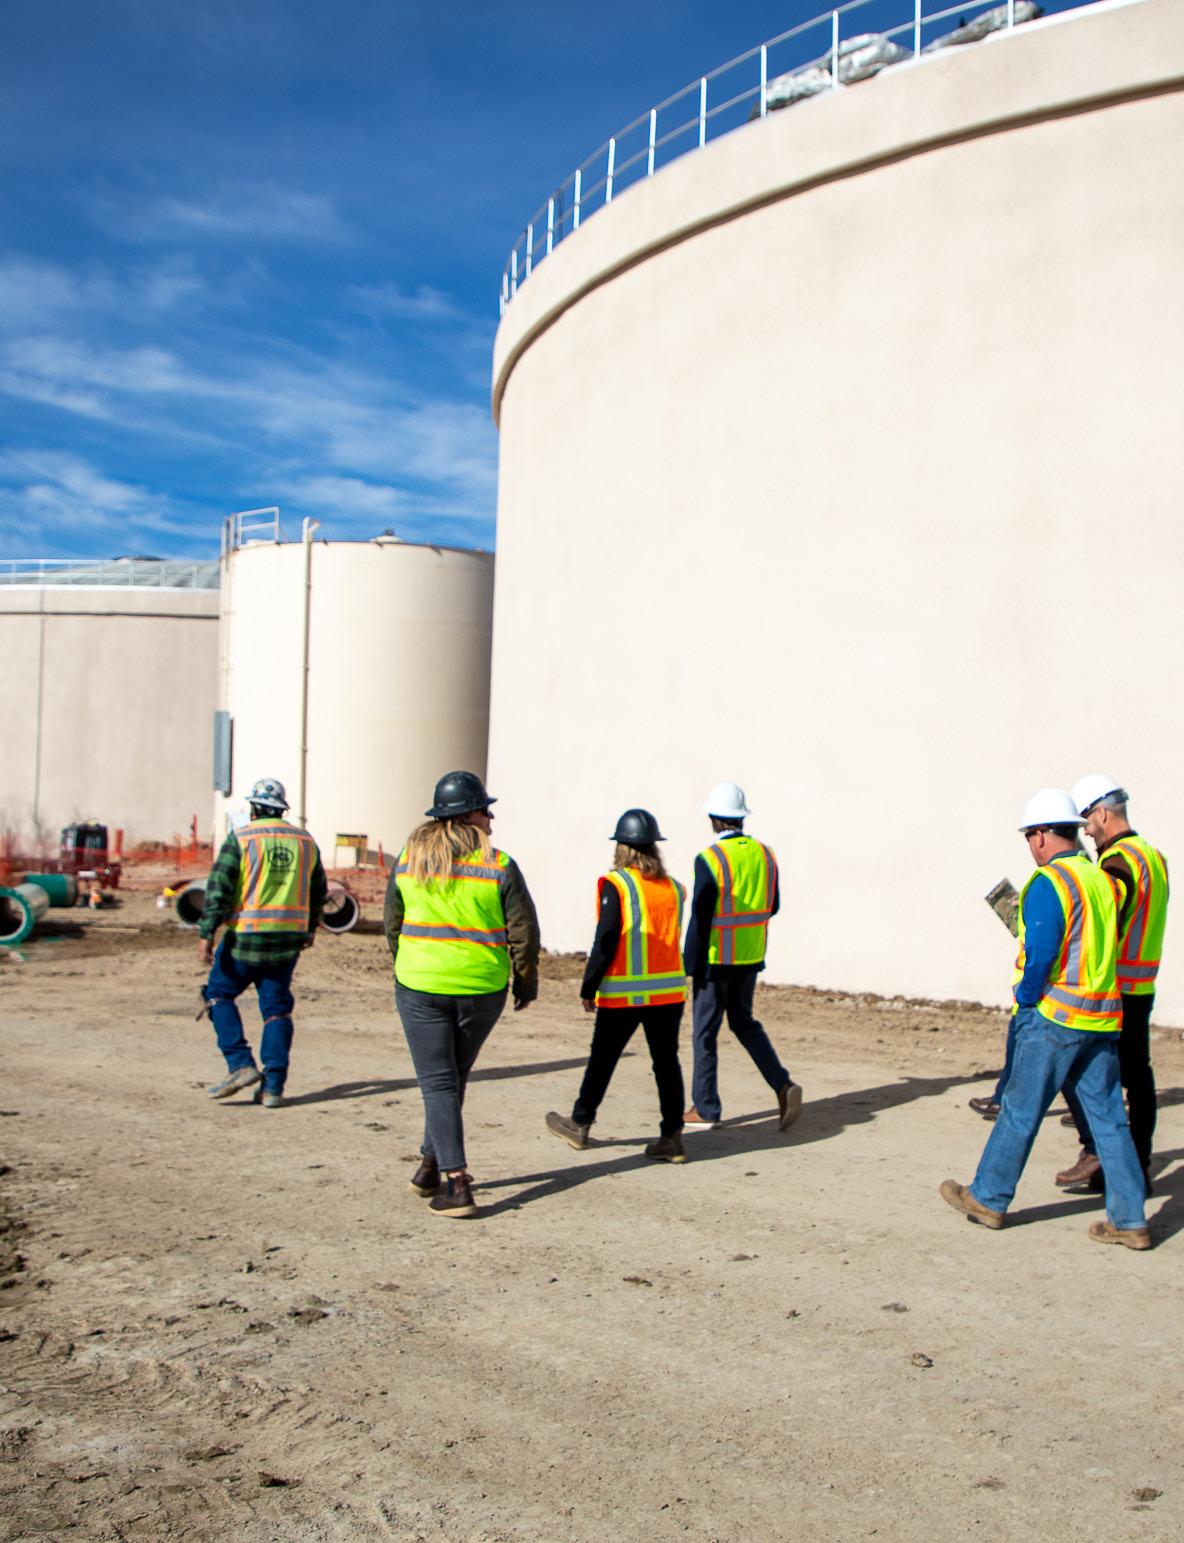
Over the years, expansions and upgrades to Semper Water Treatment Facility were needed to meet the needs of a booming Westminster. Semper was built back in 1969 when the city’s population was approximately 20,000 people. According to the 2020 census, Westminster is now home to about 116,000 residents.
The aerial photo of Semper in 2020, to the right, captures the 50-year-old facility, which treats 65% of the City’s water annually. Northwest Treatment Facility treats the remaining 35% of the City’s drinking water supply.
The City of Westminster invites you to join our public engagement efforts for large capital projects throughout our city. We value community engagement and want to ensure our projects align with our community’s values.
Public engagement is a top priority for the City, and we have established community advisory teams for two of our multi-year projects: the Drinking Water Facility and Municipal Courthouse project. The advisory teams include nearby residents, business owners, and community organizations. Their involvement ensures our project teams get regular feedback from the surrounding community most impacted by the project. In addition to the advisory teams, we will hold both virtual and in-person open houses that the entire community is welcome to attend. You’ll have the opportunity to learn about the
project, talk to project team members, and share feedback on the project design.
Projects take years of careful design before construction can begin, and this is when your feedback can help shape the final product. Your involvement helps our engineers and planners design projects to meet your needs as a community member. Learn more about each project by scanning the QR codes below or visiting the website. You can sign up for updates about project status, upcoming open houses, and ways to help design projects in your community.


The City of Westminster Public Works & Utilities (PWU) team works around the clock to make sure the water you fill your children’s bottles with, the water you bathe in, and the water you use to boil pasta for dinner is safe and highly refreshing. A lot of time and effort goes into disinfecting and distributing the water before it even reaches your faucet.
After the water has been tested and deemed suitable for drinking, it flows through a system of pipes over 550 miles long until it reaches your faucet. That’s a lot of pipe to maintain! If you were to lay it out, it would reach nearly all the way to Omaha, Nebraska. Sometimes, unfortunately, cracks, fractures, and holes can form in the underground pipes and cause water to leak out. This is known as a water main break. They are an inconvenience for everyone when they happen, which is why the City’s PWU crews do preventative maintenance to keep a break from happening.
City workers regularly check each pipe in the City every four years. This means they investigate pipes to make sure there’s no damage or weak spots. In some cases, crews use leak detection equipment with acoustic listening software, which allows them to find a leak that hasn’t risen to the street level yet. If that’s found, they can go in and repair or replace the pipe before it becomes a problem for neighbors.
Most water main breaks aren’t like what you see on TV — they’re usually not geysers of water shooting up from the ground. Of course, that is possible, but leaks are often more subtle, and you likely wouldn’t even notice an issue. If you happen to see water pooling in the street or see a trickle of water that just doesn’t look right, please call the 24/7 PWU hotline at 303658-2500.
“Our residents are our eyes out there. They are kind of our first line of defense to at least make us aware of something,” Utilities Operations Supervisor Jim Wielebnicki says. “We always go and investigate what they report. So even if it’s after a rainstorm, and we don’t know if it’s groundwater, rain,
snow, snow melt or anything like that, we take their claims seriously and investigate them.”
When a water main break happens, you typically don’t need to worry about your drinking water being contaminated. The pipe has positive pressure that keeps the water flowing outward instead of being sucked back into the pipe and bringing dirt and debris back into it.
Often, workers will need to turn off your water while they fix the break. Doing this helps crews to work as quickly and safely as possible, allowing them to turn your water back on sooner. Fixing a water main break is a priority, not an afterthought. “We work 24/7, meaning we do rotating 12-hour shifts. We will not stop until the water main break affecting customers is fixed,” Wielebnicki said. “It’s not a ‘we’ll get to it when we can’ situation — we always try and make sure that we’re putting our customers back in service as quickly as possible.”
When you see PWU crews working, please give them a safe distance when driving. If you see an area zoned off, please follow detour signs. Sometimes you might notice a break in the cones, but that’s for utility trucks to get through, not resident vehicles. If you have questions about the work they’re doing, please feel free to ask. “It’s OK if a customer wants to come and talk to us because we enjoy educating people so that they understand whether we’re doing maintenance or making a repair,” Wielebnicki says. “We do ask that you keep a safe distance if a piece of equipment is in operation, and flag somebody if you have questions.”
When it comes to preventative maintenance, you can rest assured that Westminster is going above and beyond to keep water main breaks from happening. The American Water Works Association says that for every 100 miles of pipe in the ground, you should have fewer than 15 water main breaks per year. Westminster averages seven breaks per 100 miles of pipe, placing them way ahead of the curve
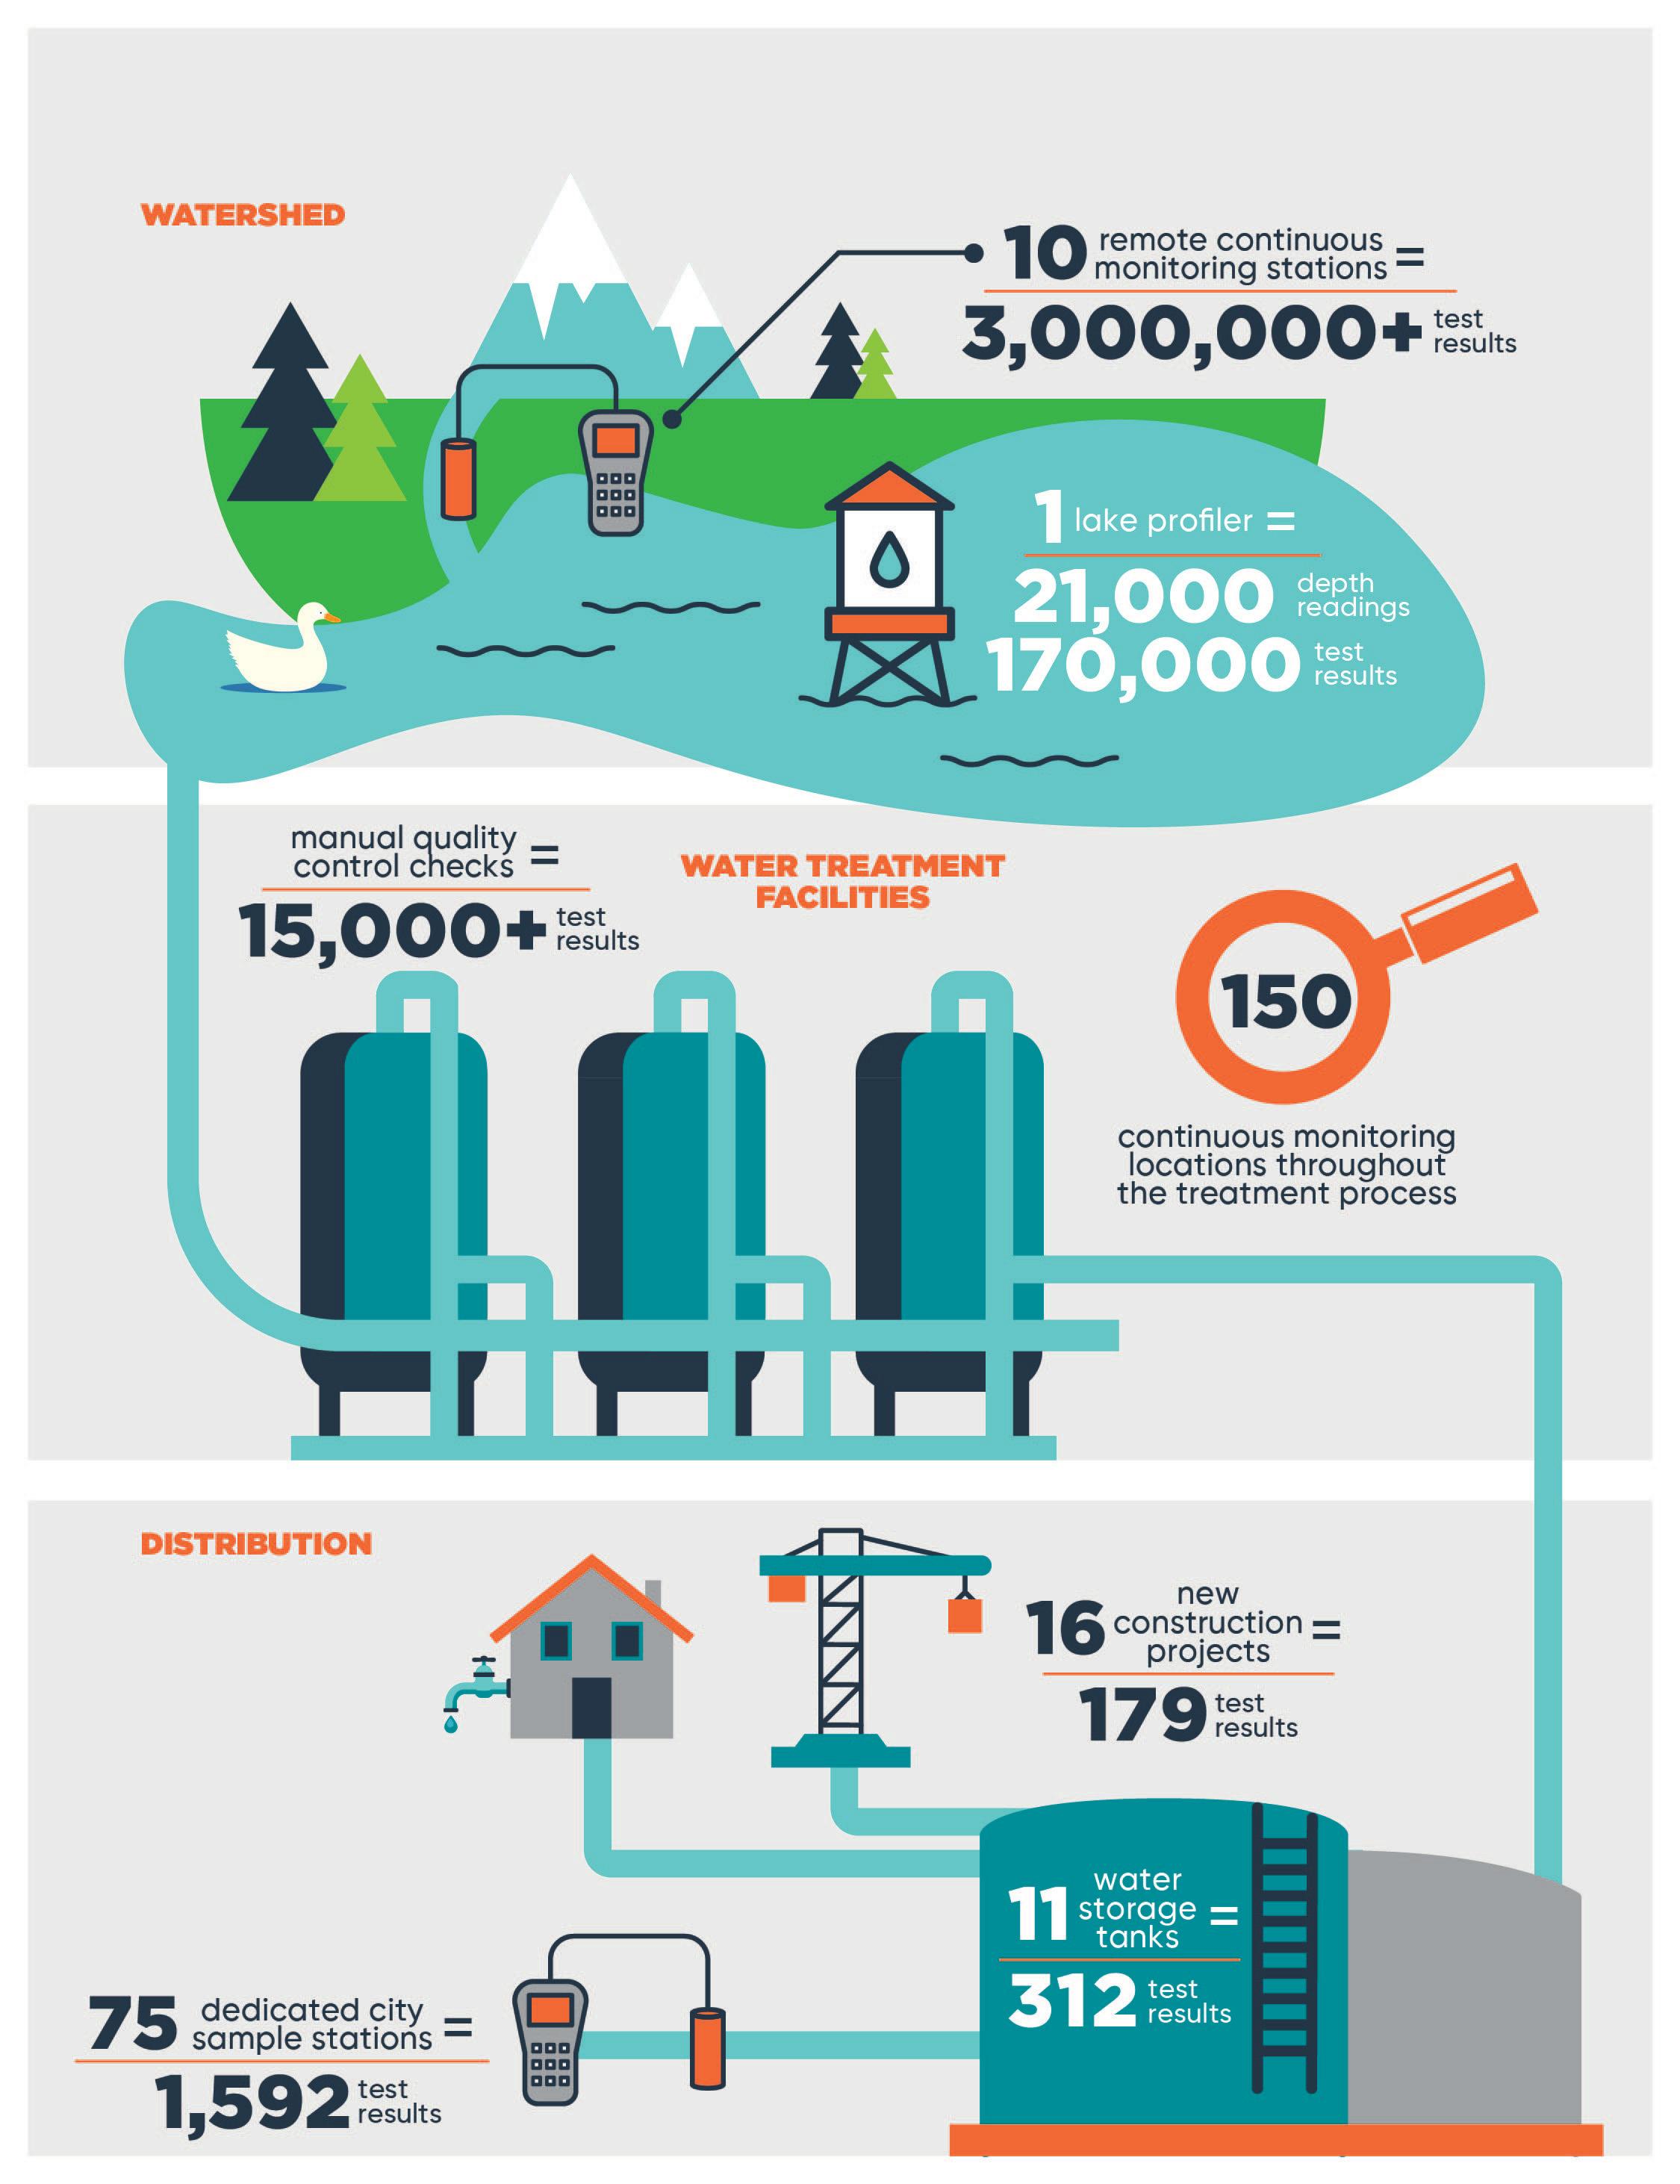
Westminster’s drinking water is monitored for more than 100 different substances on a strict sampling schedule, and more than 1,700 water samples are taken annually across the entire distribution system. The water we provide to residents and businesses must meet specific state and federal health standards. To help you better understand what is in your drinking water, we are sharing the 2023 test results for regulated substances that were detected. The “Amount We Found” that is referenced in the tables on the following pages is reported as the maximum amount detected unless otherwise noted.
The frequency of testing for individual substances is determined by CDPHE based on the likelihood that the concentrations of the substance will change over time. Some test results are for samples that were collected in 2021.
Maximum Contaminant Level (MCL)
The highest level of a contaminant that is allowed in drinking water.
Maximum Contaminant Level Goal (MCLG)
The level of a contaminant in drinking water below which there is no known or expected risk to health. MCLGs allow for a margin of safety. MCLs are set as close to the MCLGs as feasible using the best available treatment technology.
Treatment Technique (TT)
A required process intended to reduce the level of a contaminant in drinking water.
Health-Based
A violation of either an MCL or TT.
Non-Health-Based
A violation that is not related to an MCL or TT.
Action Level (AL)
The concentration of a contaminant which, if exceeded, triggers treatment and other regulatory requirements.
Maximum Residual Disinfectant Level (MRDL)
The highest level of a disinfectant allowed in drinking water. There is convincing evidence that addition of a disinfectant is necessary for control of microbial contaminants.
Maximum Residual Disinfectant Level Goal (MRDLG)
The level of a drinking water disinfectant, below which there is no known or expected risk to health. MRDLGs do not reflect the benefits of the use of disinfectants to control microbial contaminants.
Nephelometric Turbidity Unit (NTU)
Measure of the clarity or cloudiness of water. Turbidity in excess of 5 NTU is just noticeable to the typical person.
Highest Level Allowed
Single or calculated value used to determine if regulatory contaminant level (e.g. MCL) is met. Examples of calculated values include the 90th percentile, Running Annual Average (RAA) and Locational Running Annual Average (LRAA).
Violation
Failure to meet a Colorado Primary Drinking Water Regulation.
Picocuries per liter (pCi/L)
Measure of the radioactivity in water.
Parts per million = Milligrams per liter (ppm = mg/L)
One part per million corresponds to one minute in two years or a single penny in $10,000.
Parts per billion = Micrograms per liter (ppb = ug/L)
One part per billion corresponds to one minute in 2,000 years, or a single penny in $10,000,000.
Not Applicable (N/A)
Does not apply or not available.
90th percentile (P90)
The Amount We Found levels reported for lead and copper represent the 90th percentile of the total number of sites tested. The 90th percentile is equal to or greater than 90% of our lead and copper test results.
Not Detected (ND)
Indicates that the substance was not found by laboratory analysis.
Amount
How it gets in the water: Erosion of natural deposits Beta
How it gets in the water: Decay of natural and man-made deposits Barium
Chromium (ppb)
Amount
it gets in the water: Erosion of natural deposits
Table Notes
How it gets in the water: Discharge of drilling wastes; discharge from metal refineries; erosion of natural deposits
How it gets in the water: Water additive used in treatment to control microbes
it gets in the water: Erosion of natural deposits
1 The MCL for Gross Beta Particle Activity (Beta Emitters) is 4 mrem/year. Since there is no simple conversion between mrem/ year and pCi/L the Environmental Protection Agency considers 50 pCi/L to be the level of concern for Beta Emitters.
2 The Amount We Found for Chloramine represents the average of all individual sample results collected in the distribution system. 100% of the samples collected at the entry points to the distribution system met the TT requirement that, for no more than four consecutive hours, the chloramine result must be at least 0.2 mg/L.
(ppb)
Amount We Found 11.9
N/A Highest Level Allowed (MCL) LRAA <60
Lowest Amount Detected 7.6
No Violation Highest Amount Detected 15
How it gets in the water: Byproducts of drinking water disinfection
(pCi/L)
Amount We Found 0.44
Samples Collected
Goal (MCLG)
0
Level Allowed (MCL) 5 Lowest Amount Detected 0.14
No Violation Highest Amount Detected 0.44
How it gets in the water: Erosion of natural deposits
(ppm) Amount
(ppb)
Amount
1.1
it gets in the water: Corrosion of plumbing materials
(ppb)
Amount We Found 32.6
Samples Collected
Goal (MCLG)
How it gets in the water: Byproducts of drinking water disinfection
(NTU)
it gets in the water: Soil runoff
Table Notes
3 Radium-228 is an individual alpha particle activity emitter. It is not included in the gross alpha particle activity (Alpha Emitters) and is measured separately. Radium-228 sample results are combined with radium-226 sample results for the purposes of determining compliance.
4 HAA and TTHM are regulated as locational running annual average (LRAA). The Amount We Found represents the highest RAA or LRAA, and the Amount Detected Low-High represents individual sample results.
5 Total Organic Carbon (TOC) is regulated as a quarterly running annual average (RAA). Only January 2023 data was required for compliance due to reclassification of the water treatment plant after which TOC monitoring was not required.
6 Turbidity is measured at the water treatment plant to assess cloudiness of the water as a good indicator of the effectiveness of the filtration process. The highest turbidity result was recorded in December 2023.
(Lowest monthly percent of samples meeting limit)
Year Samples Collected
% Meeting Limit
100
Health Goal (TT) 2023 N/A
Lowest Level Allowed (TT) 95% of samples <0.1
Lowest Amount Detected NA
No Violation Highest Amount Detected NA
How it gets in the water: Soil runoff
Amount
We Found P90=0.15
Year Samples Collected
Health Goal (AL)
N/A
Highest Level Allowed (AL) P90=1.3
Lowest Amount Detected 0.032
No Violation Highest Amount Detected 0.21
How it gets in the water: Corrosion of household plumbing; erosion of natural deposits
Table Notes
Amount We Found 0.90
How it gets in the water: Erosion of natural deposits
Amount We Found P90=2
Year Samples Collected
Health Goal (AL) 2021 N/A
Highest Level Allowed (AL) P90=15
Lowest Amount Detected ND
No Violation Highest Amount Detected 23 How it gets in the water: Corrosion of household plumbing; erosion of natural deposits
7 Copper and lead were measured at residential taps throughout the city in 2021. The Action Level (AL) for lead and copper applies to the 90th percentile (P90) of all samples collected for each contaminant (e.g., 90% of all sample results for copper must be below 1.3 ppm). Amount detected represents the 90th percentile and the Amount Detected Low-High represents individual sample results. One sample exceeded the AL for lead at 23 ppg, which was traced to the homeowner sampling a water faucet that did not meet sampling criteria. The AL was not exceeded for copper at any location.
Some substances present in the drinking water are not strictly regulated because they do not pose a health risk to the general population. We include this information for customers who inquire about water quality data for beer brewing or optimizing aquariums, water softeners, or dishwashers. These test results are for samples collected in 2023.
ANALYTE
CONCENTRATION RANGE
Total Dissolved Solids 209 - 263 ppm
pH (s.u.) 8.4 - 8.8
Conductivity 344 - 451 µS/cm
Alkalinity (as CaCO3) 50 - 64 ppm
Total Hardness (as CaCO3) 109 - 139
(approximately 6 to 8 grains per gallon)

If present, elevated levels of lead can cause serious health problems, especially for pregnant women and young children. It is possible that lead levels at your home may be higher than other homes in the community because of materials used in your home’s plumbing. If you are concerned about lead in your water, you may wish to have your water tested. When your water has been sitting for several hours, you can minimize the potential for lead exposure by flushing your tap for 30 seconds to 2 minutes before using water for drinking, cooking, or preparing baby formula. You can also use a filter certified by the American National Standards Institute to reduce lead in drinking water.
Additional information on lead in drinking water, testing methods, and steps you can take to minimize exposure is available from the Safe Drinking Water Hotline 1-800-426-4791 or at epa.gov/ground-water-and-drinking-water

Some people may be more vulnerable to contaminants in drinking water than the general population. Immunocompromised people such as people with cancer undergoing chemotherapy, people who have undergone organ transplants, people with HIV-AIDS or other immune system disorders, some older people, and infants can be particularly at risk of infections. These people should seek advice about drinking water from their health care providers.
In 2019, the City inspected the water service lines for single-family homes to verify that pipes on either side of the water meter were made of copper and not lead. CDPHE and the EPA have established new rules about needing a second point of verification that there are no lead service lines. As we work with our state partners, you may hear from us as we continue to verify that no lead was found for our single-family residential lines.
Parts Per Million (ppm)
1 drop in a hot tub is equal to 1 ppm
Parts Per Billion (ppb)
1 drop in an Olympic-size swimming pool is equal to 1 ppb
Parts Per Trillion (ppt)
1 drop in a 6-acre lake is equal to 1 ppt
For more information about contaminants and potential health effects, or to receive a copy of the U.S. Environmental Protection Agency (EPA) and the U.S. Centers for Disease Control (CDC) guidelines on appropriate means to lessen the risk of infection by Cryptosporidium and microbiological contaminants, call the EPA Safe Drinking Water Hotline at 1-800-426-4791 or visit cdc.gov/parasites/crypto
The Environmental Protection Agency (EPA) studies pollutants and their impacts to the environment and people to determine the Maximum Contaminant Level (MCL). Every water utility, including Westminster, is required by law to not exceed the MCL.
The Maximum Contaminant Level Goal (MCLG) is the level at which there are no known effects on a person’s health with an additional margin for safety. The MCL is set as close as possible to the goal.
Sometimes the MCL is higher than the MCLG. This is because of one of three possible reasons:
(1) The technology needed to measure such small quantities of the MCLG is not available;
(2) The technology needed to remove the pollutant or reduce it to the MCLG is not available yet; or
(3) The cost of treating the pollutant to the MCLG outweighs the potential benefit of a lowered standard.
To ensure that drinking water is safe, CDPHE prescribes regulations that limit the amounts of certain contaminants in water provided by public water systems. The Food and Drug Administration regulations establish limits for contaminants in bottled water that must provide the same level of protection for public health.
The water sources for tap and bottled water include rivers, lakes, streams, ponds, reservoirs, springs, and wells. As water travels over the surface of the land or underground, it dissolves naturally occurring minerals including potentially radioactive material, and it can pick up substances resulting from the presence of animals or from human activity. Contaminants that may be present in source water include:
Microbiological contaminants: Viruses and bacteria that may come from sewage treatment plants, septic systems, agricultural livestock operations, and wildlife.
Inorganic contaminants: Salts and metals, which can be naturally occurring or result from urban stormwater runoff, industrial or domestic wastewater discharges, oil and gas production, mining, or farming.
Pesticides and herbicides: May come from a variety of sources, such as agriculture, urban stormwater runoff and residential uses.
Radioactive contaminants: Can be naturally occurring or a result of petroleum production and mining activities.
Organic chemical contaminants: Synthetic and volatile organic chemicals, which are byproducts of industrial processes and petroleum production, and also may come from gas stations, urban stormwater runoff, and septic systems.
All drinking water, including bottled water, may be reasonably expected to contain at least small amounts of some contaminants. The presence of contaminants does not necessarily indicate that the water poses a health risk.
For more information about contaminants and potential health effects, call the U.S. EPA’s Safe Drinking Water Hotline at 800-426-4791 or visit epa.gov/ground-water-and-drinking-water
QWhere should I go if I have a question about my drinking water?
AAccess Westminster on the City’s website has a library of topics about water. If you click “Water” under “Topic Areas,” you will find information regarding fluoride in water, home leak detection, reclaimed water, and more. If your question isn’t answered, you may submit your question by clicking “New Issue.” A City staff member will get back to you with an answer. You can find Access Westminster here: bit.ly/AccessWestminster
QWhat if I need help paying my water bill?
AWe understand that financial hardship happens, and we are here to support you with multiple opportunities. Residents can view all programs and apply for assistance online at westminsterco.gov/ WaterBillAssistance or call 303-658-2392 with any questions. Programs include:
Bill Credit Program: This program provides a $240 credit, applied as $20 / month per 12-month period, on your residential water bill for those residents that meet the qualifying income guidelines (listed below). If you already qualify for the Low Income Energy Assistance program (LEAP), then you will automatically qualify for this program.
Hardship Program: This program supports any resident who has short-term difficulties paying their water bill due to a temporary interruption of income, such as job loss, injury or medical emergency. If the water bill has not been paid for at least 35 days from the date of the bill, one-time credits on the water bill are available if program qualifications are met.
Indoor Efficiency Program: This program provides up to two free high-efficiency toilets and free indoor wateruse inspections to income-qualified residents. Residents qualifying for the low-income program automatically qualify for this program.
Leak Repair Program: This program is available free of charge to income-qualified homeowners whose water meter reports a leak. Repairs that eliminate leaks enable homeowners to participate in the City’s other water assistance programs.
Emergency and Essential Repair Program: This program provides up to $5,000 in eligible home repairs to incomequalified, owner-occupied households in Westminster, including plumbing, electrical, furnace repair/replacement, water heater repair/replacement, and accessibility improvements (e.g.,: wheelchair ramps, hand railings, bathroom accessibility).
QAre there PFAS in Westminster’s drinking water?
AWestminster tested untreated source water and treated water for 18 PFAS compounds in March 2020. No PFAS compounds were detected in any of the treated water samples. The City completed the first of four rounds of PFAS sampling in March 2024. The analysis of 29 PFAS compounds is required by the U.S. EPA for the Fifth Unregulated Contaminant Monitoring Rule (UCMR5) revealed the compounds were nondetected at concentrations far below the M CLs finalized on April 10, 2024. More information on this recent regulatory protection of drinking water is available online at www.epa.gov/sdwa/and-polyfluoroalkylsubstances-pfas
PFOA and PFOS are fluorinated organic chemicals that are part of a larger group of chemicals referred to as perfluoroalkyl substances (PFAS). PFOA and PFOS have been the most extensively produced and studied of these chemicals. PFAS have been used to make carpets, clothing, fabrics for furniture, paper packaging for food, and other materials (e.g., cookware) that are resistant to water, grease, or stains. They are also used for firefighting at airfields and in a number of industrial processes. B ecause these chemicals have been used in an array of consumer products, most people have been exposed to them. Between 2000 and 2002, PFOS were voluntarily phased out of production in the U.S. by the primary manufacturer. In 2006, eight major companies voluntarily agreed to phase out their global production of PFOA and PFOA-related chemicals, although there are a limited number of ongoing uses. Scientists have found PFOA and PFOS in the blood of nearly all the people they tested, but these studies show that the levels of PFOA and PFOS in blood have been decreasing. While consumer products and food are a large source of exposure to these chemicals for most people, drinking water can be an additional source in the small percentage of communities where these chemicals have contaminated water supplies. Such contamination is typically localized and associated with a specific facility, such as, an industrial facility where these chemicals were produced or used to manufacture other products or an airfield at which they were used for firefighting.
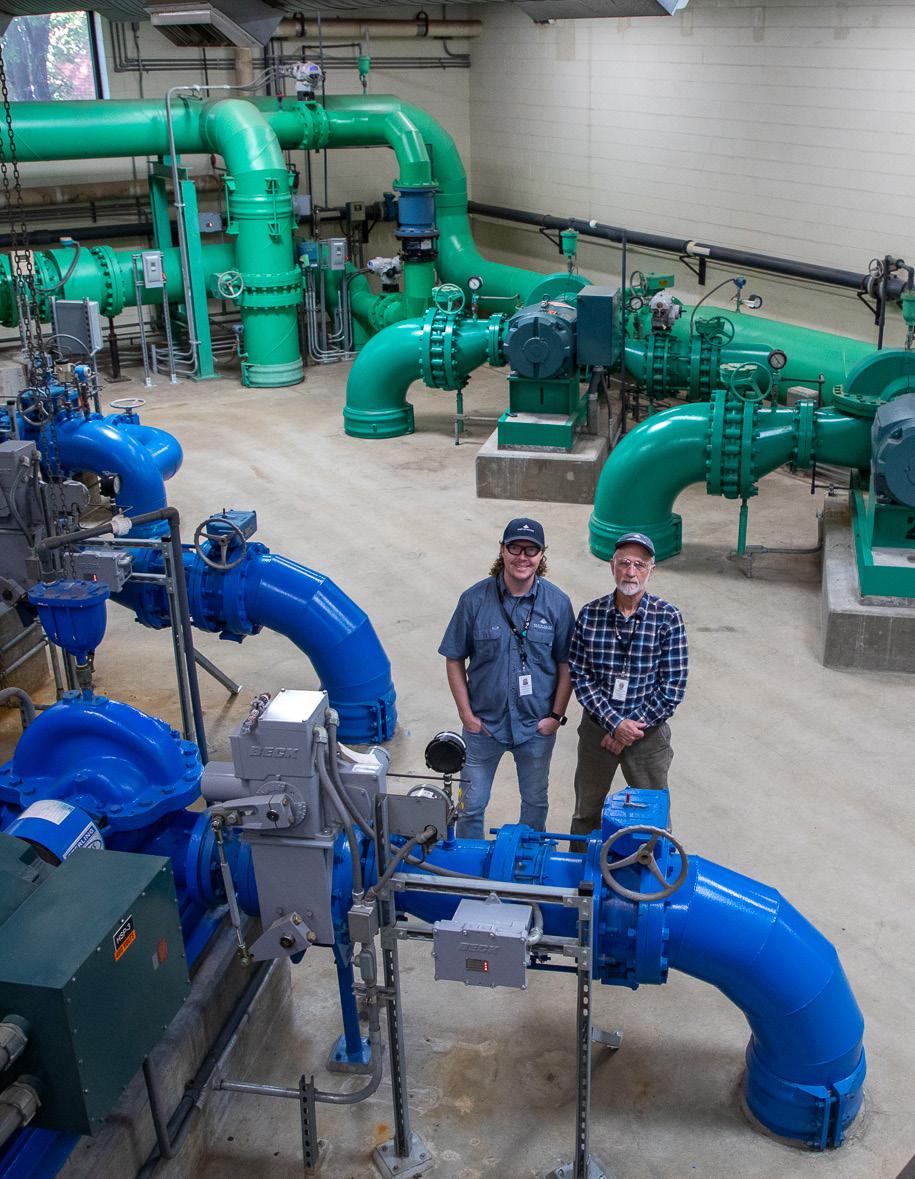
Ryan ( Left) and Tom (Right), our current and recently retired Semper Water Treatment Facility superintendents inside the Northwest Water Treatment Facility.
Although water is a precious and limited resource across the West, it is especially important in Colorado. Our four river basins — the Colorado, South Platte, Rio Grande, and Arkansas — are the water source for 17 downstream states. Thanks to years of careful planning and strategic investments, Westminster has enough water for its current and future water needs as long as development continues in line with the City’s Comprehensive Plan, the Wattenberg Reservoir is completed, and water conservation trends continue.
Drought remains the greatest threat to the city’s water supply. Conservation measures by our residents and businesses continue to be the best way for the city to secure its water supply.
Visit www.westminsterco.gov/conservation to learn more about programs to reduce water usage.
Westminster’s average residential customer uses four times more water in a summer month than in a winter month to water their lawn and other outdoor irrigation needs.
Disposing of your hard-to-recycle items is getting easier. The City of Westminster is partnering with SustainAbility Recycling, a company with a proven track record in Arvada and Broomfield, to open a new one-stop-drop center right here in Westminster. The new facility is now open and is located at 6020 West 91st Avenue.
Residents can now drop off most of your recyclables in an easy, hassle-free way. For singlestream recycling, which is often referred to as “common recycling,” you’ll be able to drive up to the compactor and place your items inside. The compactor will be emptied several times a week and sent to Republic Services for processing. This will help ensure the new venue stays neat and tidy.
If you have hard-to-recycle items, you will take those to a separate area away from the compactor. Employees will collect your goods and make sure they’re sorted into the proper recycling containers, which will be taken inside at the end of each day.
If you have old electronics to recycle, you can use our center with peace of mind. Your unwanted electronics will be sent to certified e-waste recyclers who will break down your items in an ethical manner without compromising any personal data left on the device.
This new center is more than just a central location for Westminster residents to take their recycling. Schools and community groups will be able to tour the center and learn about the environmental benefits of recycling. The dedicated staff members are passionate about protecting the environment and want to share that passion with you.
To learn more about this exciting new sustainability center, please visit westminsterco.gov/sustainabilitycenter
The City has separate sanitary and storm sewer systems. Separate systems have two different pipes. One pipe carries sanitary sewage to the wastewater treatment facility. The other pipe carries stormwater (rain) from storm drains to local streams, rivers and lakes, such as Big Dry Creek with little or no treatment. Therefore, it’s critical you don’t throw anything into the storm sewer.
If you have hazardous materials to dispose of, including various liquid cleaning products and paint, you can take advantage our free home collection program. A worker will come straight to your home to take your unwanted hazardous waste. This helps ensure our waterways stay clean. You can learn more about the program and which items are accepted by visiting bit.ly/HazardousWastePickup
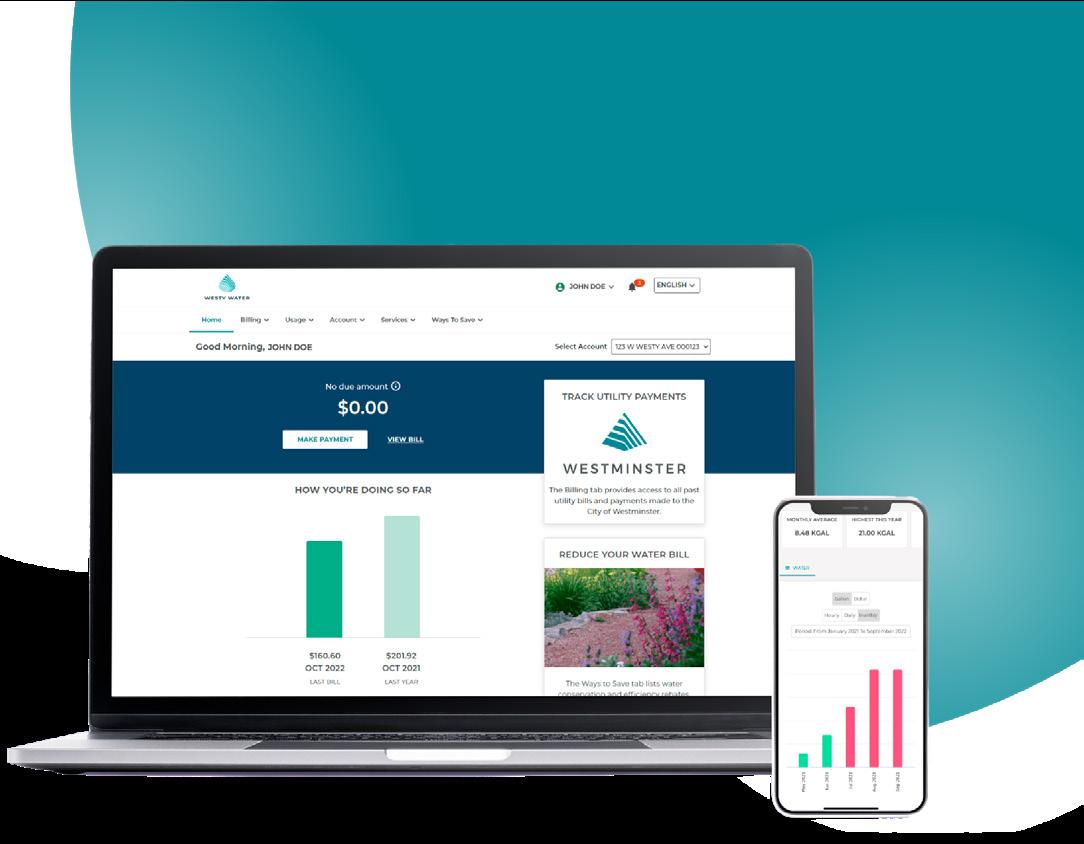
Westminster’s new customer portal offers residents and customers the ability to monitor hourly water consumption and receive emergency leak alerts via email. You can compare past water use, pay your water bill, and learn about water efficiency programs that could help you save water and money.
Have a question or concern? Feel free to reach out directly to the Water Quality team by calling 303-658-2461 or by email at water@westminsterco.gov.
Residents are invited to provide comments about drinking water quality, budgets, and plans during City Council meetings. Westminster City Council meets in regular session on the second and fourth Mondays of each month at 7 p.m. in the Council Chambers at Westminster City Hall, 4800 W. 92nd Avenue. Please refer to the City’s website at www.westminsterco.gov for additional information including new ways to watch the council meetings and submit public comment via email and voicemail.
www.facebook.com/cityofwestminstercolorado
www.nextdoor.com/city/westminster--co/
www.twitter.com/westminsterco
www.instagram.com/westminster.colorado/
www.youtube.com/@WestminsterCO
Infrastructure projects are almost entirely funded by your monthly water bill. To learn about what we are doing to keep our drinking water clean and safe, as well as potential impacts of our construction projects, please visit www.westminsterco.gov/Water
The City of Westminster’s Utilities Operations Division maintains the City’s water mains. If you suspect problems in the water system such as main breaks, service line leaks, frozen meters, or pressure issues, notify us 24/7 at 303-658-2500.
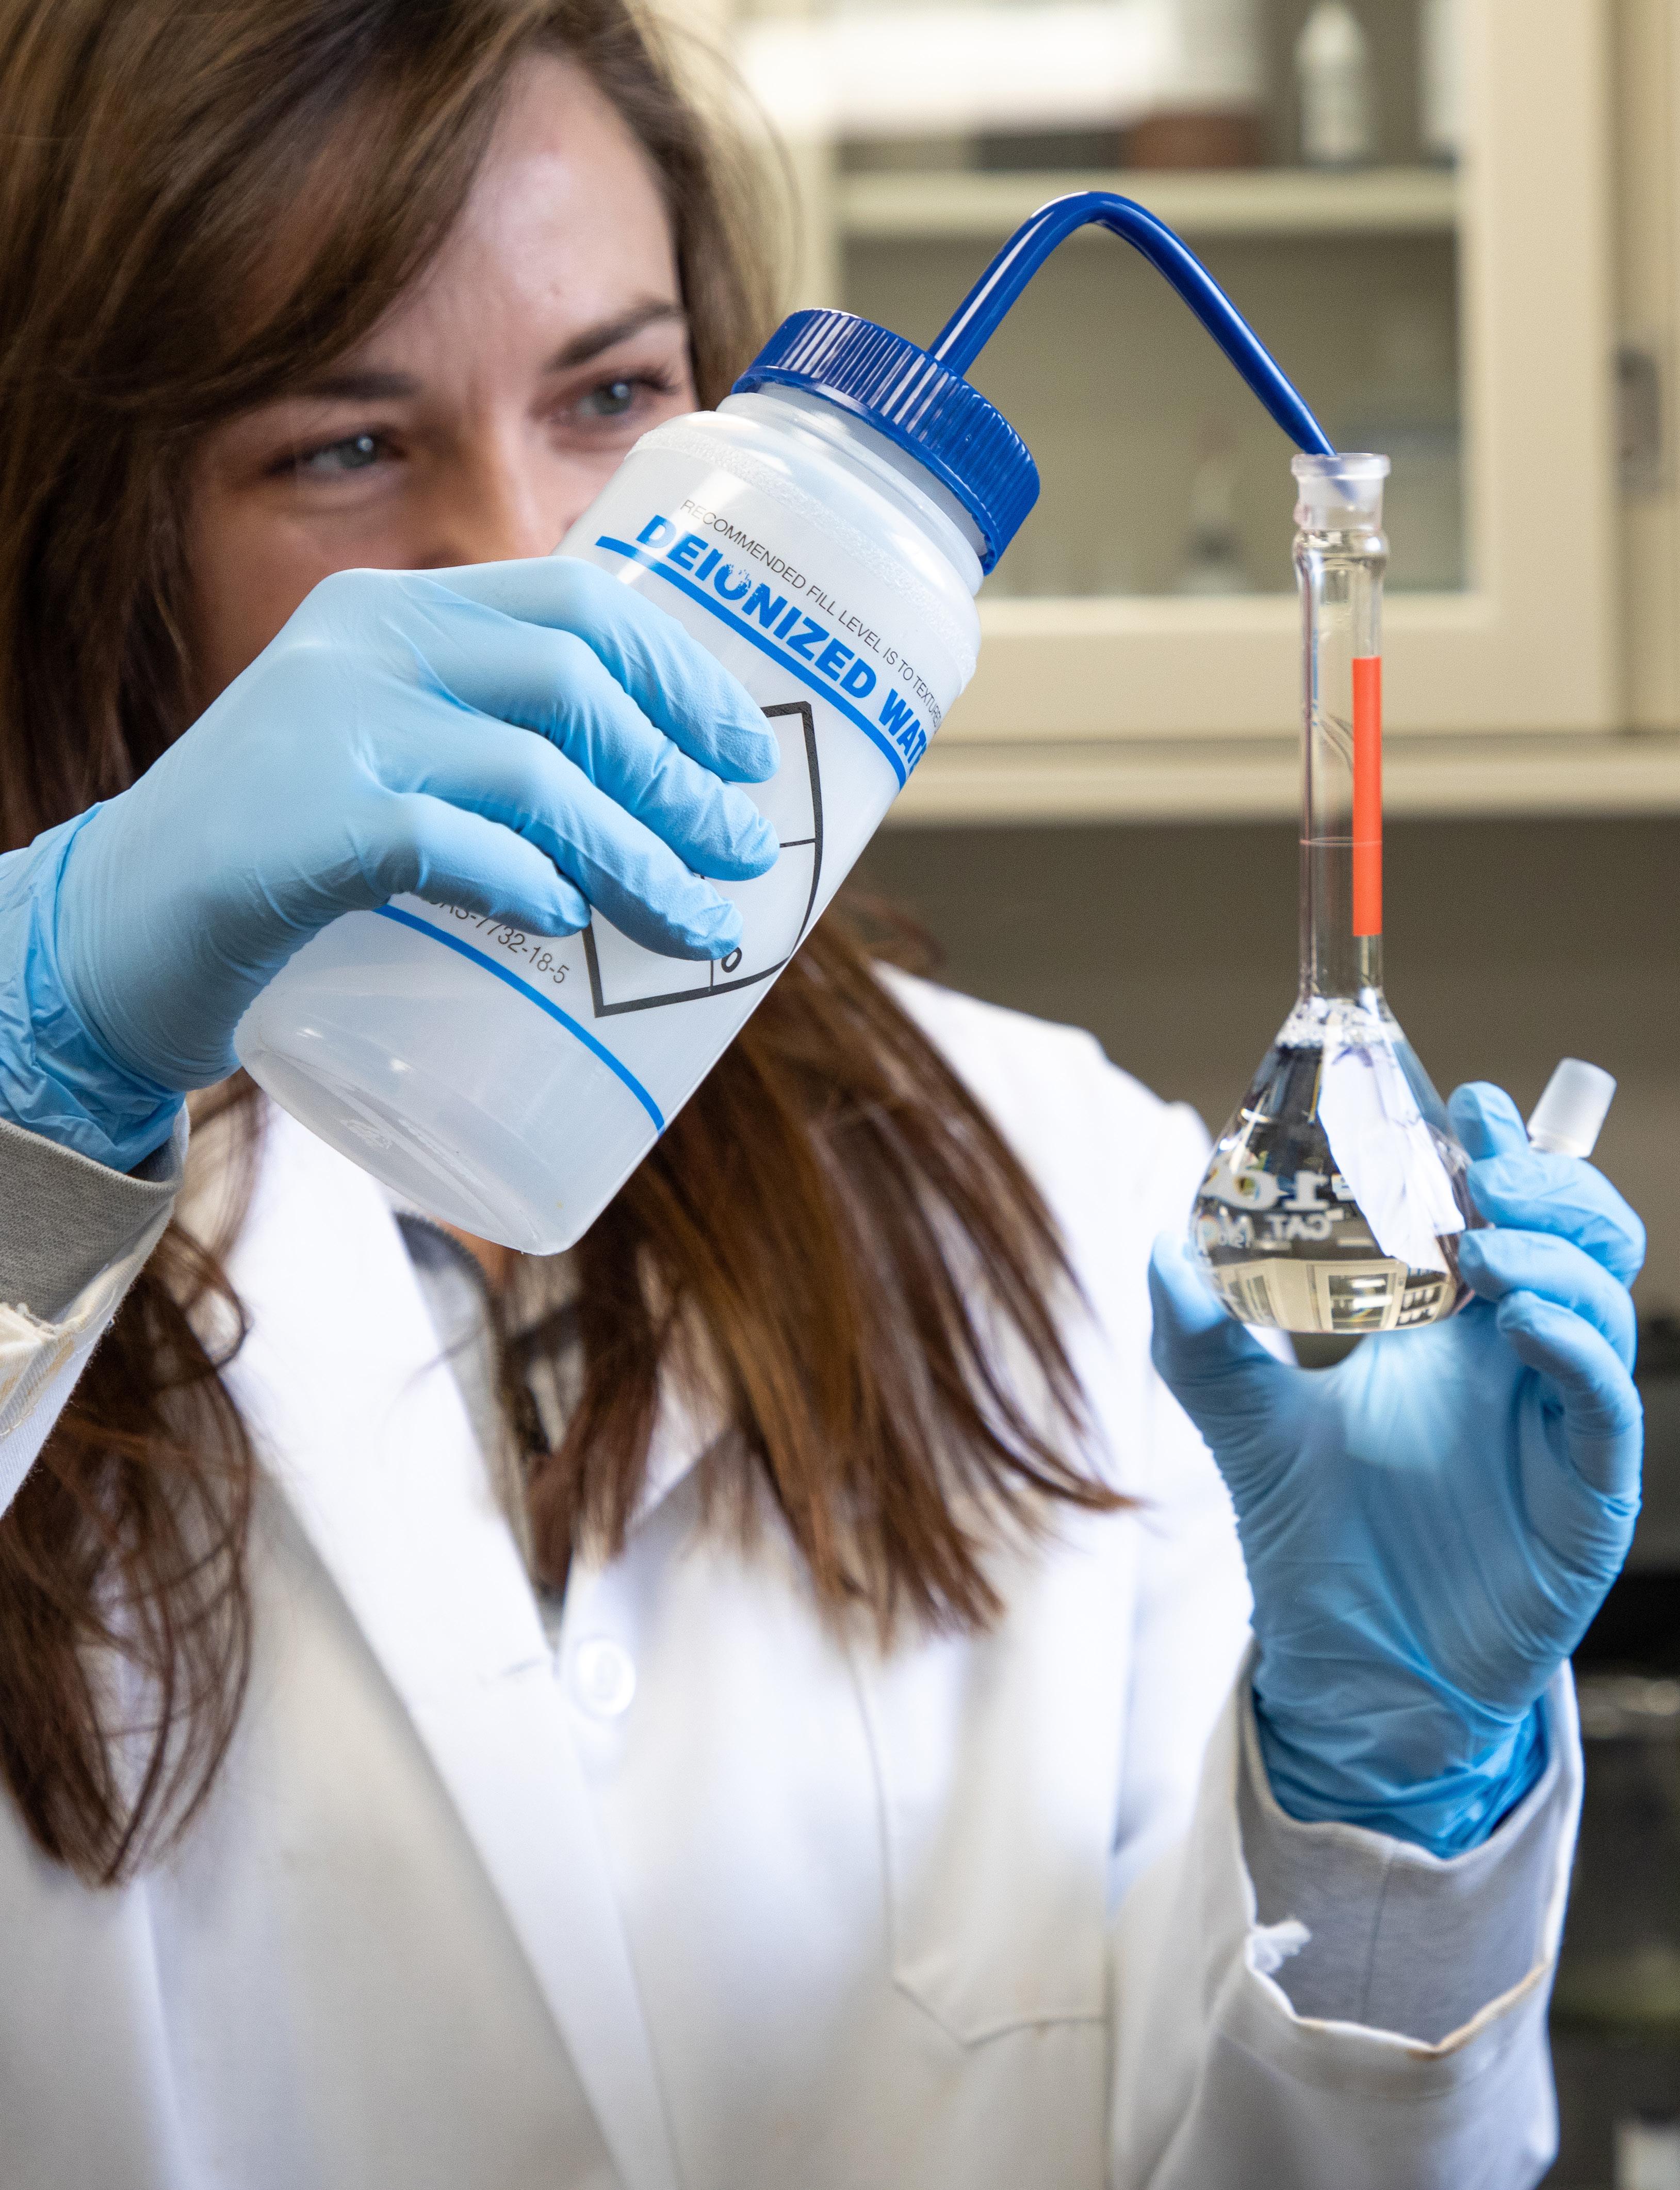 Jessica Senior Water Quality Analyst, Public Works And Utilities
Jessica is analyzing water samples in the lab at the Semper Water Treatment Facility.