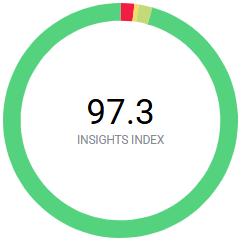
A GREEN background indicates benchmark attained or exceeded
A RED background indicates benchmark missed or not achieved
Gross Rent Arrears
WGHC’s benchmark for gross rent arrears is 1.30%.
Gross rent arrears are the amount of rent owed by both former and current tenants, not including any payments we expect to receive from housing benefit or universal credit.
Gross rent arrears as of 31st March 2025 and declared within our ARC submission were 1.11%
Current Tenants @ 0.97%
Former Tenants @ 0.14%
Anti-Social Behaviour
Incidents of ASB should be resolved within 20 working days. The benchmark for WGHC is that 90% of reported ASB incidents will be resolved within the 20 working days
Of cases resolved within the benchmark of 20 working days, on average, they are resolved within 13.6 working days. Cumulatively for the period reported, i.e. 01/04/24 to 31/03/25, of the 27 cases, 23 were resolved within benchmark, 4 outside
Overall, this meant our resolution rate compared to benchmark was 85%. These figures are declared within our ARC submission
Service Complaints
In the period 1st April 2024 to 31st March 2025, WGHC received the following complaints:
29 Complaints logged, 16 related to customer service, 4 to Housing Management, 9 to Maintenance
Of those, 8 related to staff: 4 to Housing Management and 4 to maintenance All were resolved within SPSO target requirements 23 were upheld in favour of the complainant Stage 1 average = 1.9 days / Stage 2 average = 16.0 days
Tenant Support Visits
WGHC’s benchmark is to visit 24 tenants per quarter, in terms of offering support, or, from a tenant sustainment perspective.
Cumulatively, over the reporting period, 96 visits should have been undertaken.
109 visits were undertaken, far exceeding the benchmark. This is a fantastic achievement for WGHC.


Average Days to Relet a Property
WGHC’s benchmark to relet a property is 14 days (average).
Cumulatively, within the reporting period 01st April 2024 to 31st March 2025, we relet 11 properties. On average, it took us 17 days to relet an empty property.
Of the 11 relets, 9 were allocated to homeless households in accordance with EdIndex requirements. Outwith relets, we also had 9 x ‘successions’ and 1 x ‘mutual exchange’ meaning that in the 12 months, there was actually a turnover of 21 properties.
Void Spend (Per Property)
WGHC’s benchmark for void spend, per unit, is £3,000 with an anticipated / budgeted stock turnover of 24 units per year.
Cumulatively, within the reporting period, 11 properties became void and incurred void work costs.
WGHC’s average void spend, within the reporting period, per property, was £1,396.04 which is well within the benchmark.
(It should be noted, that although we had 11 voids, actual turnover of tenanted properties was recorded at 21: 9 were tenancy successions and 1 was a mutual exchange)
Stair Inspections
WGHC’s benchmark for stair inspections is 3 ‘sets’ per quarter. For the reporting period, 12 should have been undertaken.
WGHC has 13 common stairs, so the benchmark requires that each of the 13 stairs (as a ‘set’) are inspected @ 3 times a quarter Within this cumulative reporting period, 9 x full sets of stair inspections were undertaken.
Therefore, 12 x full sets of stair inspections were completed, meeting the required benchmark.
Estate Management Visits
WGHC’s benchmark for estate management visits is 12 per quarter.
This involves staff visiting each of the 17 streets within the WGHC estate and recording actions to be taken including incidents of vandalism, gardens in need of attention, damage to pavements, abandoned vehicles, collapsed drains, overgrown trees etc.
Within this cumulative reporting period, 884 x estate management visits should have been undertaken, 874 were undertaken. This equates to 99%. As such, having undertaken 52 x estate management visits, the required benchmark has been met


Bi-Annual Asset Management Visits
WGHC’s benchmark for bi-annual management visits is 48 per quarter, or, 192 per year (over 2 years = all WGHC properties)
This benchmark is to ensure that all WGHC properties are visited at least once, every 2 years to assess their condition both internally and externally.
The surveys were not undertaken within quarters 1 and 2. They started in quarter 3. By 31 March 2025, 207 x surveys have been undertaken, exceeding the annual benchmark. They are recorded within tenant files, I-Auditor platform and a centralised spreadsheet.
Average DAYS to complete a non-emergency repair
WGHC’s benchmark for attending a request for a non-emergency repair is an average of 5 working days.
Within the reporting period, i.e. 01st April 2024 to 31st March 2025, a total of 1209 non-emergency repairs were undertaken. These repairs collectively took 5187 days to complete.
Therefore, the average response time to complete non-emergency repairs was 4.3 working days, which is within the required benchmark.
Average HOURS to attend for an emergency repair
WGHC’s benchmark for attending a callout for an emergency repair is an average of 3 hours.
Within the reporting period, we had a total of 119 emergency repairs. These repairs, collectively, took 272 hours to complete.
On average, we attended to an emergency repair within 2 Hours 29 Minutes which is well within the benchmark requirement.
Repairs Inspections
WGHC’s benchmark for pre or post inspections of repairs is 10% of all repairs carried out per quarter.
Cumulatively, during the reporting period, 1328 work orders were raised. As a result, at least 132 post-work inspections should have been undertaken.
Cumulatively for the period between 01st April 2024 and 31st March 2025 a total of 210 inspections were undertaken which equates to 15.8% of the total jobs undertaken, which exceeds the required benchmark


Contractor Management
WGHC’s benchmark for contractor management meetings is 6 per quarter, or 13 per half year. The main purpose of these meetings is to discuss ongoing performance, assess KPIs and maintain working contractual relationships.
We’re pleased to report that in January 2025, 13 x Contractor Management Meetings were undertaken – with the remainder booked for implementation in June and July. £274,885 was spent during the reporting year across our major and minor contractors
Biggest Individual Contractor Spend: Lothian Gas @ £54.9k
Tenant Satisfaction with Quality of home
WGHC survey every tenant in the year, who move into a WGHC property. We ask the tenant how satisfied they are with the quality of their new home. Within reporting period, 200 tenants were surveyed. WGHC’s benchmark for this KPI is 95% of tenants report being satisfied.
PAV results indicate 100% of the new tenants who moved into their home within the reporting period were satisfied with the quality of their home. 95.5% of WGHC have indicated they are either Very or Fairly Satisfied with the quality of their home, meaning this benchmark has been exceeded.
Void Loss
WGHC’s benchmark for void loss is 0.5%.
This is the amount of rent lost due to properties lying empty as a percentage of the total amount of rents due.
For the cumulative reporting period from 01st April through 31st March 2025, WGHC’s void loss was £2,621.00 – which is £5,867.00 better than budget. (61%)
Therefore, the overall void loss was 0.13% which came in 0.07% under the benchmark.
Interest Cover
The benchmark for interest cover is 110%
The interest cover ratio is used to determine a company’s ability to pay interest on its outstanding debt. It measures how many times a business can cover the current interest payments based on the calculated surplus. A ratio of 110% means that a company can cover its loan interest payments 1.1 times over.
Therefore, WGHC’s current interest cover of 592% means that it is making enough of a surplus to pay loan interest payable 5 times over, which far exceeds the required benchmark.


