


2021201920182017201620152014
median firm size shrunk by three workers between 2018-20, a consistent trend that may point to a growing number of worker-owned startups, which tend to be smaller in size.
THE TYPICAL WORKER

Bay Area + Portland, OR + MadisonMinneapolis +Seattle Los Angeles Austin Jackson Olympia Denver + CIncinnati San Diego Anaheim Boulder WORKER COOPERATIVES IN THE UNITED STATES AND DEMOCRATIC WORKPLACES 5,966 WORKERS 612 BUSINESSES MEDIAN SIZE: 6 WORKERS 2:1 TOP-TO-BOTTOM PAY RATIO
COOPERATIVE The
Cooperatives have grown in number
more than 30% since 2019. The 612 worker
workplaces
there are actually 900-1000 worker
of which are startups, and
10,000
Number of Worker Cooperatives

are 64 firms on our list that do not belong to an official Metropolitan Statistical Area (MSA). We have considered these firms rural. Together, the 64 rural firms identified represent the second largest geographic concentration of worker-owned or democratic firms in the U.S.


pay has skyrocketed 1,322% since 1978. In 2020 CEOs at U.S. corporations were paid 351x the typical worker.^ The
top-to-bottom pay ratio at U.S. worker cooperatives points to the prioritization

reducing internal inequality over other compensation goals.

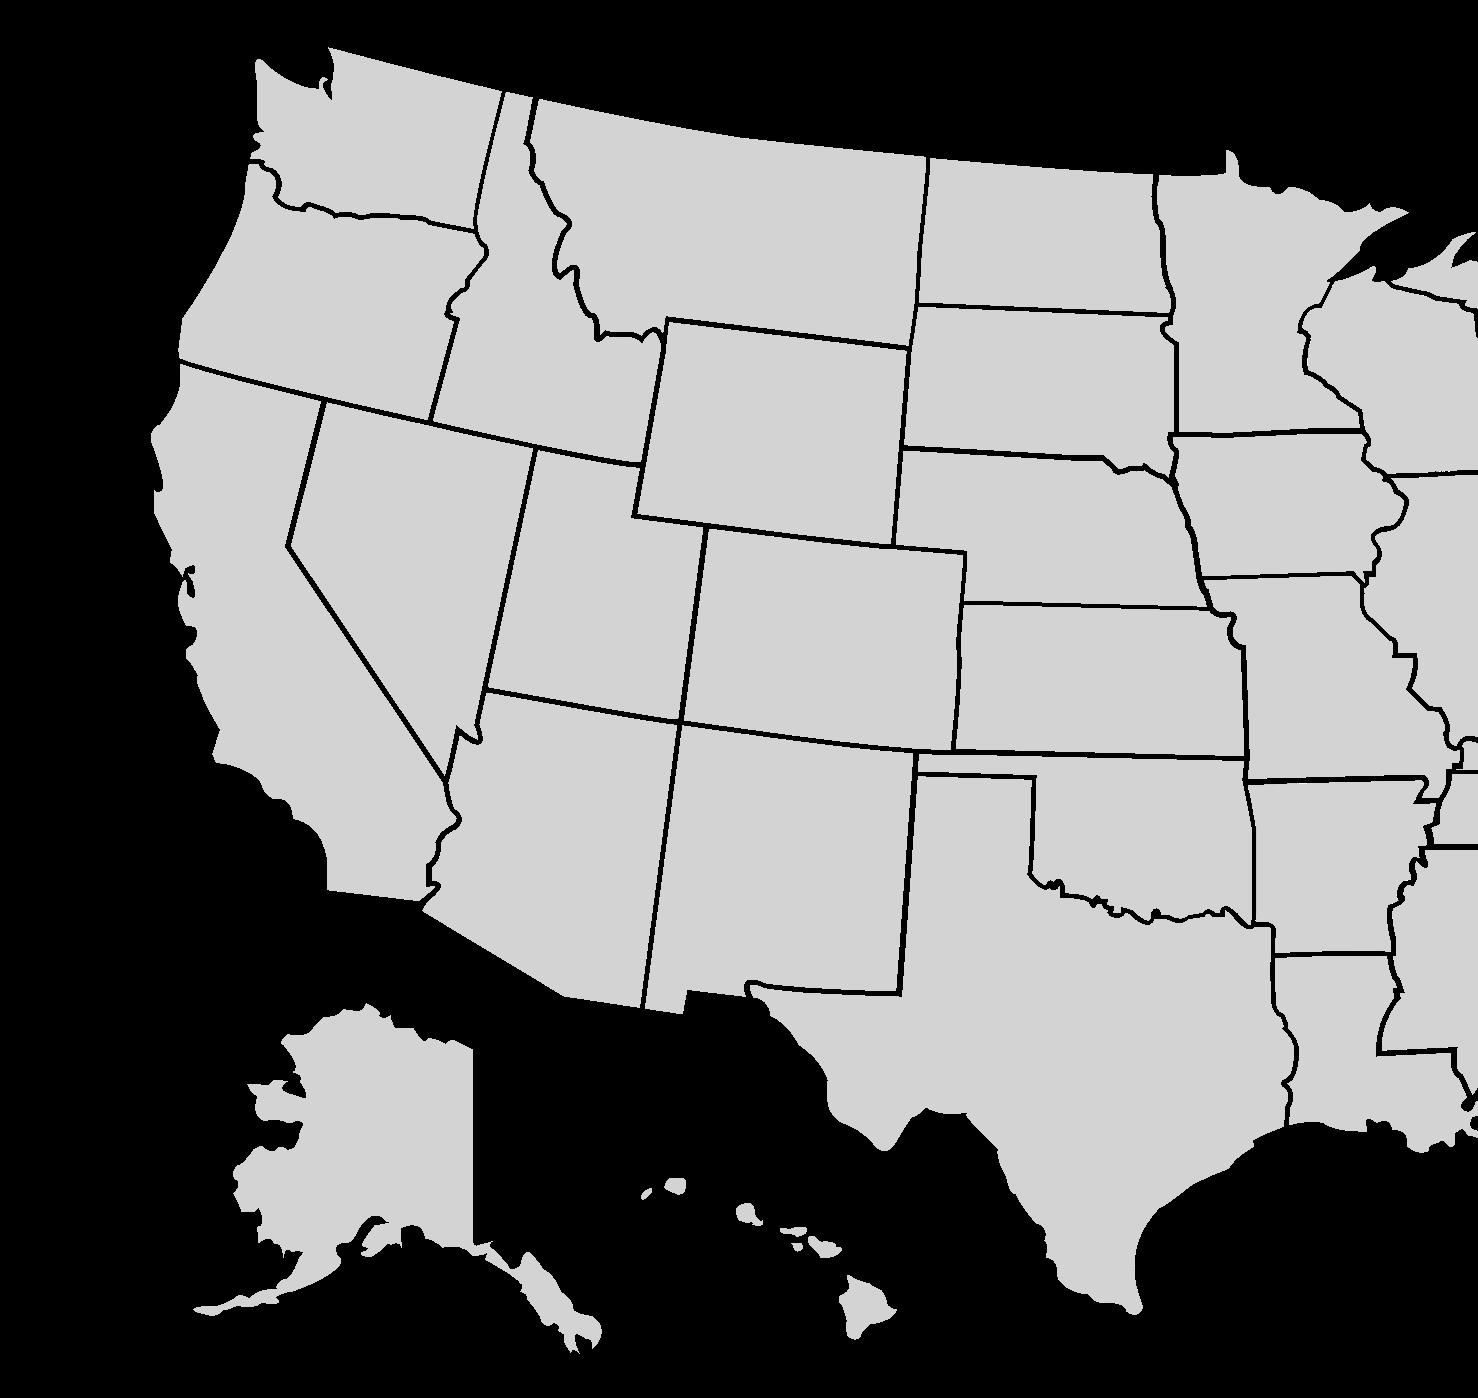
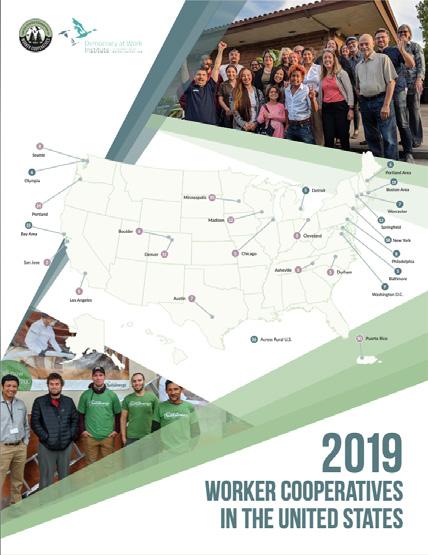
Cleveland This map shows areas with 5 or more verified worker cooperatives.
Circle = presence of verified worker cooperatives or democratic workplaces Circle size = number of verified worker cooperatives or democratic workplaces More than 25 firms 11-25 firms 5-10 firms Green circle = new addition for 2021 + = top 15 Metropolitan Statistical Area Puerto Rico + Asheville + Boston Area + Chicago Madison + New York + Durham Philadelphia + Western MA + Atlanta Central MA + CIncinnati Portland Area Providence Burlington Baltimore Washington D.C. + Rural + 612 BUSINESSES MEDIAN AGE: 5 YEARS OLD Worker
by
cooperatives and democratic
were identified in the 2021 Economic Census. We estimate
cooperatives, many
roughly
workers, in the U.S. $283.17 M GROSS REVENUE $298,016 MEDIAN FIRM REVENUE NATIONAL SNAPSHOT CEO
2:1
of
There
About Worker Cooperatives in the U.S.
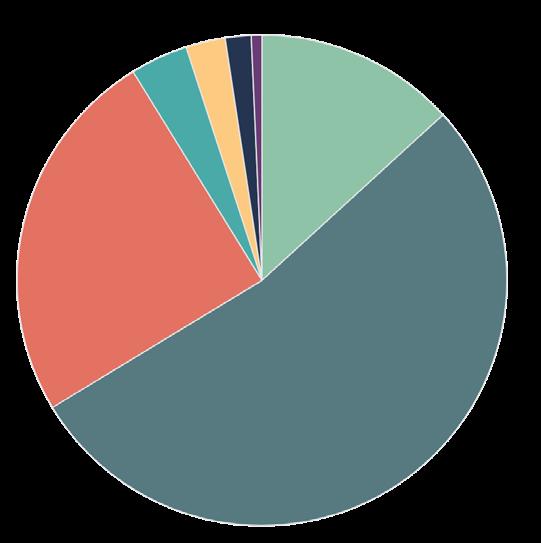
Worker ownership continues to be a movement led by women, home to many workers of color, and a viable option for start-up or ownership transition. The data illustrated here represents the experience of 180 worker cooperatives and democratic workplaces that participated in the bi-annual Economic Census conducted by the Democracy at Work Institute and the U.S. Federation of Worker Cooperatives.
Types of Businesses
Worker cooperatives exist in an array of industries and the rate of new startups remains steady. As shown here, the majority of U.S. worker-owned firms are startups established within the last 10 years.


Age of Cooperatives vs. Conventional Businesses*
Worker Cooperatives Conventional Businesses

Top 5 Workplace Practices
Years
Years
Years
Years
Years
Years
Worker Race and Gender
have ownership pathways for non-members
have an annual budget or business plan
are structured to distribute patronage annually
elect board of directors that is majority members or some democratic governance like committees
maintain indivisible reserves not distributed to members
Common Challenges
We asked worker cooperatives to identify challenges their workpaces face. Selected from a curated list of challenges, the most common issues were benefitrelated. The most frequently identified non-benefits challenge was administrative burdens, followed by financing for business expansion.
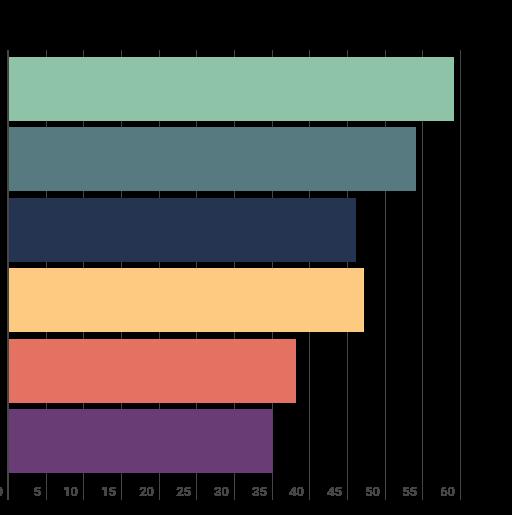
Health Insurance
Other Beneftis
Burdens
Growth
Planning
75%
69%
68%
58%
56%
Self-Startups Ownership Transitions DeveloperAssisted Startups Business Origin Worker Gender 44% Male 4% Non-binary 52% Female
Providing
Providing
Administrative
Financing
Marketing Business
0-5
6-10
11-15
16-20
21-25
26+
Percent of responding businesses 13% Black 53% White 25% Latinx 4% AAPI 3% Mixed Race 2% Middle Eastern/ Arabic 1% Native American 70% 12% 18%
Adaptability in Crisis
Worker cooperatives showed an ability to swiftly change business models and operations in response to crisis, as determined by firms’ collective membership. 50% of firms reported adapting business practices (see below). Some firms expanded childcare options for workers, increased work flexibility, offered extra sick time, and more. Additional business-related changes include:
Moving to virual/remote business
Moving services outdoors
Implementing safety measures
Shifting to provide essential services
Closing brick and mortar locations
Increasing production
COVID-19 and Worker Cooperatives

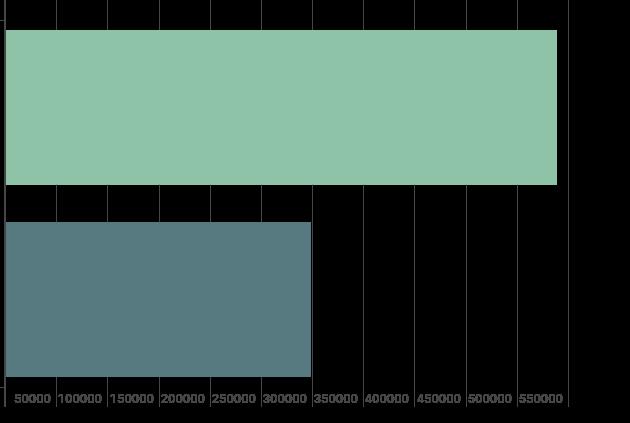
Comparison of Revenue Lost in

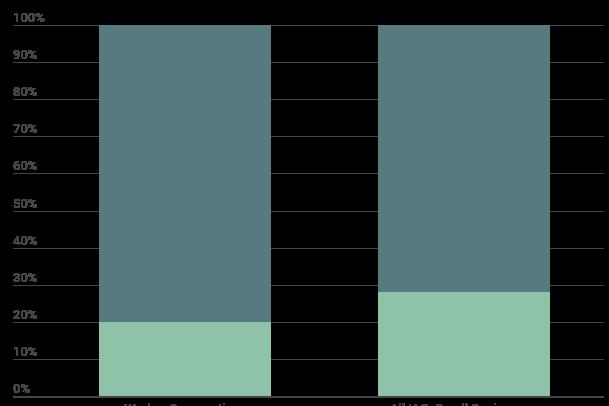
Worker cooperatives
have fared slightly better than conventional firms.
in five worker cooperatives
more than 50% drop in revenue due to the
one-third of all U.S. small businesses lost
Mutual Aid
Worker cooperatives prioritized supporting their community
other cooperatives during the pandemic.
61% worked with local or regional mutual aid networks

offered discounts or resources to meet community needs
Preserving
and Prioritizing
hours in
of
Worker cooperatives prioritized preserving jobs throughout the pandemic (see charts to the right). While surveyed firms experienced reductions in revenue, total hours worked remained nearly flat compared to FY18.
offered resources and discounts to another cooperative during the pandemic
Operations and Staffing
operating
Worker and Community
Jobs
Workers Business For
Benefit
and
73%
60%
may
One
experienced
pandemic. Nearly
more than 50% of their revenue. Lost more than 50% of revenue Lost less than 50% of revenue Worker Cooperatives U.S. Small Businesses 20% 28%
Business Pivots 50% •
•
•
•
•
•
44% Drop from FY18 9% Drop from FY18 FY18 FY20 Median Business Revenue Median Total Hours Worked Steady
spite
declining revenue
2020¥
Remained open for the majority of the pandemic Kept
hours level with pre-pandemic hours 80% Worked to avoid layoffs through reduced hours and furloughs 50% 49% Increased capacity and hours to meet demand35%
Worker Cooperative Map Notes


Our map represents metropolitan statistical areas (MSAs) home to worker cooperatives or democratic workplaces identified through the USFWC verification process or the 2021 Economic Census conducted by DAWIandtheUSFWC.Thesizeofeachcirclerepresentsthenumberofidentifiedfirmsinthe MSA. Our map shows MSAs that are home to at least five firms. The following lists detail our complete list of MSAs and the number of identified firms within them. Inclusion in our list requires that firms are operational, generated revenue during fiscal year 2020, provide paid work for at least three workers, are democratically governed by a majority of paid workers or have a significant degree of democratic participation in governance by paid workers.


Bellingham, WA (4); Boulder, CO (4); Columbus, OH (4); Milwaukee (4); Kingston, RI (3); New Orleans, LA (3); Pittsburgh, PA (3); Poughkeepsie, NY (3); Rochester, NY (3); San Jose, CA (3); Ann Arbor, MI (2); Buffalo, NY (2); Detroit, MI (2); Gainesville, FL (2); Ithica, NY (2); Nashville, TN (2); Nassau County, NY (2); Oklahoma City, OK (2); Riverside, CA (2); Santa Cruz, CA (2); Santa Rosa, CA (2); San Luis Obispo, CA (2); Spokane, WA (2); Syracuse, NY (2); Bloomington, IN (2); Akron, OH (1); Albany, NY (1); Athens, GA (1); Champaign, IL (1), Colorado Springs, CO (1); Chico, CA (1); Duluth, MN (1); Fargo, ND (1); Florence, SC (1); Fort Wayne, TX (1); Gulfport, MS (1); Harrisonburg, VA (1); Hickory, NC (1); Houston, TX (1); Kahului, HI (1); Kansas City, MO (1); Lewiston, ME (1); Louisville, KY (1); Memphis, TN (1); Morristown, TN (1); Palm Beach, FL (1); Pittsfield, MA (1); Phoenix, AZ (1); Raleigh, NC (1); Rockingham County, NH (1); Salem, OR (1); Salt Lake City, UT (1); San Antonio, TX (1); Sacramento, CA (1); San Rafael, CA (1); Santa Maria, CA (1); St. Louis, MO (2); Tucson, AZ (1);


Asheville, NC (10); Denver, CO (10); Worcester, MA (10); Chicago, IL (9); Los Angeles, CA (9); Olympia, WA (9); Cincinnati (8); Seattle, WA (8); Austin, TX (7); Baltimore, MD (7); Durham, NC (7);Burlington, VT (6); Cleveland, OH (6); Portland, ME (6); Atlanta, GA (5); Anaheim (5); Jackson (5); Providence (5); San Diego (5)


^CEO pay ratio reported by Economic Policy Institute *Comparison data represents small businesses in the US with fewer than 500 employees as determined by the US Census Bureau’s Business Dynamics Statistics. ¥U.S. small business revenue data reported by the National Federation of Independent Businesses Fewer than 5 firms (not shown on map) 5-10 Firms Boston (25); Springfield, MA (17); Madison, WI (15); Portland, OR (14); Minneapolis, MN (12); Washington, D.C. (12); Philadelphia (11) 11-25 firms New York, NY (91), Rural (64), Bay Area, CA (60), Puerto Rico (57) More than 25 firms 2 California 3Puerto Rico 8North Carolina 1New York 4 Massachusetts 5 Washington 6Wisconsin 10 Maine 9 Ohio 7 Vermont TOP 10 States and Territories by Firm Count 110 99 57 53 26 25 21 20 20 17 If you know a worker cooperative that’s not represented at www. usworker.coop/directory let us know! Email directory@usworker.coop! Help Us Identify Worker Cooperatives
About This Report
The 2021 State of the Sector: Worker Cooperatives in the United States is published bi-annually by the Democracy at Work Institute (DAWI) and the U.S. Federation of Worker Cooperatives (USFWC). Data published in this report are based on the bi-annual Economic Census of Worker Cooperatives and Democratic Workplaces in the United States and its 180 participating firms. The Census was designed and conducted collaboratively between DAWI and USFWC. Census results were analyzed by Olga Prushinskaya, Metrics and Impact Analyst at DAWI.


This report would not be possible without the participation of worker-owners and democratic workplaces across the country. Surveying was conducted with support from Radiate Consulting NYC. Special thanks are due to our partners who helped distribute our survey and Pablo Benson-Silva for research conducted in Puerto Rico.
More from USFWC and DAWI
Visit www.institute.coop/publications to download


Apply to become a USFWC member at www.usworker.coop/join


