
John & Jane Doe


WEALTH|KC
Collaborative Approach to Wealth Management


SHEAN FLETCHER, AAMS®, AIF® FOUNDER + WEALTH ADVIS0R

WILL COCKING, CFP® WEALTH ADVIS0R + DIRECTOR OF FINANCIAL PLANNING

BRADEN WILSON WEALTH ADVIS0R


BROOKE TWADDLE DIRECTOR OF OPERATIONS
LEAH FLETCHER, M.ED. DIRECTOR OF CLIENT EXPERIENCE
Financial Plan

Financial Plan Delivery
INITIAL RECOMMENDATIONS
QUESTIONS
Bricklayers Pension
Will you retire through Bricklayers and be able to request full distribution?
What does the pension benefit look like? Only cash out option?
Goals
Are we missing any goals or needs?
HIGHEST PRIORITY ITEMS
Dial In Retirement Spending Need
Current projected monthly spending - $479,600 in gross income - withholding of 17% = net income of $398,068 divided by 12 = $33,172 - mortgage of $1400 - car insurance of $916 = $30,856 in net monthly income How much is getting saved vs spent?
At $10k/mo in spending you should have the ability to save about $250k per year or $62k per quarter. $31k per year into the 401(k). $219k per year into your taxable investment account.
Refinance Mortgage and Lower Length of Loan
Recommend you refinance into a 10-year loan The average rate of 6 4% lowers the total cost of the loan from $137,196 to $84,570 and pays off the loan almost 16 years sooner. Increases payment to $1,606 76 from $1,342 13
Additional Opportunities
Correct Life Insurance Situation
Sample does not need LI as she does not have income that is needed to replace Sample’s life insurance analysis revealed a need of $1.826 million to replace 60% of his income until retirement, pay off all debt, and pay for $15k in final expenses
This is too costly to fully insure, at about $222 per month at a minimum Recommend you get $500k in additional coverage for $89 to $160/month. You will save $75/mo by cancelling Sample’s policy.
401(k) Through Work
Recommend you defer as much as possible to this account $31k Limit for 2025 To reach this amount for 2025 set your 401(k) deferrals at 9% We will adjust these back down to about 7% in 2026 for a full year of contributions
Please send us in your investment options and we can construct a portfolio for you.
Right Size the Emergency Fund and Consolidate Accounts into the Market
Recommend you hold about $30k in cash on hand for emergencies The rest should be invested for growth
Additional Opportunities
5-Year Income Plan 5 Years from Retirement
Add’s a layer of protection to your retirement income
See printout
Consider Adjusting Vehicle Expenses
Insurance expense will be a drag on retirement spending ability.
Personal property tax will be a drag on retirement spending ability
Correct Tax Withholding
Effective tax rate for 2024 was 18.2%. Withholding from employer is 11%. Projected income for 2025 is $479,600 The effective tax rate will be 21 5% Increase withholding by 10 5% or about $4,596 per month
Additional Opportunities
Home Insurance
Dwelling coverage $636,300, home value online is estimated at $771k. Should we increase coverage?
Personal Property $504k Is this too high?
Create an Estate Plan - All for no extra charge to you
Create a Trust
Will’s POA’s
Umbrella Policy
Recommend you reduce the coverage from $5 Million to $2 million. Very unlikely someone could win a suit against you for more than $2 Million Save and invest by your reduced premium amount
Social Security Strategy
The highest probability of success is if you both delay to age 70 An increase of 3% and $404k ending portfolio value.
Future Considerations
Roth Conversions In Retirement
If you begin saving as recommended, you will have a large taxable account balance that we can withdraw from to fund your retirement This allows your AGI to be low and then we can convert to Roth at low tax rates. Targeting 22% rate for conversions.
Healthcare Plan
Looks like Sample can qualify for coverage via old employer if Minimum 17 years of service in past 20 years
Sample’s PEERs
Take the single life benefit. It is such a small amount just try to get biggest benefit. Survivor benefit doesn’t move the needle 20% Withdrawal Rate, better than we could do with that money

PLANNING CHECKLIST | Sample Client
N/AorSelfFunded
CASH MANAGEMENT
FUNDAMENTALS
CareerSalaryBenchmark
PositiveFreeMonthlyCashFlows
EmergencyFundorSavings
PROTECTION
LifeInsurance
DisabilityInsurance
UmbrellaPolicy
Long-termCareInsurance
DEBT
Recommendation
FundingShortfall
ESTATE PLANNING
HousingExpense<28%ofGrossIncome
TotalDebtPayments<33%ofGrossIncome
DebtPayoffPlan
OptimizeStudentLoanPaymentOptions
BUILDING WEALTH
SAVINGS
Receiving401(k)match
10%SavingsRate
15%SavingsRate
20%+SavingsRate
INVESTMENT PORTFOLIO
OrganizedandConsolidatedAccounts
TaxDiversifiedSavings(Traditional,Roth,Taxable)
HealthSavingsAccount(HSA)
ClientPassed
Medical+FinancialPowerofAttorney
Will Trust
HomeDeededtoTrust
EstatePlanonfileatWEALTH|KC
EstatePlanreviewedinlast3years
RETIREMENT READY
RETIREMENT INCOME
5YearIncomePlan
SocialSecurityStrategy
PensionStrategy
PLAN SECURITY
85+%ProbabilityofSuccess
StressTest
HealthinsuranceandMedicarePlan
SustainableWithdrawalRate
WEALTH PROTECTION AND LEGACY
LONGEVITY PLANNING
EstateTaxConsiderations
ElderCarePlan
FamilyPlanningMeetingevery3years
TAX DISTRIBUTION STRATEGY
EntirePortfolioAlignedtoPlan Completed
RequiredMinimumDistributions(RMDs)Plan
QualifiedCharitableDistribution(QCD)
Gifting/Charity

RETIREMENT INCOME PLAN
TOTAL INVESTED PORTFOLIO: $2,389,438
5-YR INCOME PLAN PORTFOLIO
$713,166 $262,838 $1,413,434
Marginal Tax Brackets: Ordinar y Income
The marginal tax rate for your ordinar y income is as follows:
to $201,050
Marginal Tax Brackets: Long Term Capital Gains & Qualifed Dividends
Your taxable income of $234,179 includes $911 of long-term gains and qualifed dividends that are taxed at lower rates compared to ordinar y income Long-term gains are added on top of your ordinar y income to determine the tax rates that apply
Schedule B - Income Sources
The tax return listed the following income sources on Schedule B
Let’s take a look at the tax efciency of your investment income
Different types of investment income are taxed differently. For example, non-qualifed dividends and short-term capital gains are taxed as ordinar y income at higher rates, while qualifed dividends and long-term capital gains are taxed at lower preferential rates And depending on your marginal bracket, it may be more tax efcient to use tax-free income vehicles like municipal bonds/bond funds instead of taxable income options.
Schedule C/E - Income Sources
The tax return listed the following businesses and entities on schedules C or E
SCHEDULE C
Net Investment Income Tax Summar y
The Net Investment Income Tax (NIIT) is a 3.8% tax on the lesser of investment income or the amount over the income threshold where the NIIT is triggered which is $200,000 (single flers) or $250,000 (joint flers)
Modifed Adjusted Gross Income (MAGI): Planning Considerations
Certain deductions and tax incentives phase out as income reaches certain levels. The defnition of “income” for these phase outs can be different. The term “Modifed Adjusted Income” (MAGI) is generally used, but there are several defnitions of MAGI that are slightly different from each other
MAGI Defnition 1
Coverdell ESA
$263,407
$190,000 - $220,000 Above Lifetime Learning Credit
$160,000 - $180,000 Above American Opportunity Credit
$160,000 - $180,000 Above Child Tax Credit
Qualifed Adoption Expenses Credit
$400,000 - $400,000 Under
$252,150 - $292,150 Phase Out Savers Credit
$46,000 - $76,500 Above Clean Vehicle Credit (New)
$0 - $300,000 Under Clean Vehicle Credit (Used)
$0 - $150,000 Above MAGI Defnition 2
$263,407
Investment Income Tax $0 - $250,000 Above MAGI Defnition 3
$263,407 Roth IR A Contribution $230,000 - $240,000 Above
Defnition 4
Loan Interest Deduction $165,000 - $195,000 Above
Defnition 5
$263,407 IR A Contribution Deductibility - Covered by Qualifed Plan
IR A Contribution Deductibility - Not Covered/Spouse Covered
MAGI Defnition 6
$123,000 - $143,000 Above
$230,000 - $240,000 Above
$263,407 ACA Premium Credit 1336% of federal poverty limit (48 States and DC)
Deductions & Credits
Deductions reduce the amount of income subject to tax while credits reduce taxes dollar for dollar.
DEDUCTIONS
Qualifed Business Income Deduction
Obser vations
Income exceeds the threshold for the 3 8% Net Investment Income Tax (NIIT) Consider strategies to reduce taxable income and be mindful of realized capital gains.
You are in the 24 0% marginal bracket Depending on your age and income projections, you might consider a Roth conversion
You were charged an underpayment penalty, which arises out of total tax payments lower than a defned threshold and/or insufciently matched payments against the timings of receipt of income You can generally avoid this penalty by paying at least the “safe harbor” amount based on your previous year ’s tax return through withholding or estimated tax payments Consider discussing a penalty proofng approach with a tax professional
The 2025 safe harbor for underpayment penalties is your total tax x 110%, or $46,987 Note that the timing of your payments is also important with respect to avoiding penalties Withholding from a paycheck or retirement account distributions are considered to have happened throughout the year, but estimated tax payments should be timed to correspond with the timing of the income earned A tax professional should be able to help in cases where income is uneven throughout the year
Your Modifed Adjusted Gross Income (MAGI) suggests you are not eligible to contribute directly to a Roth IR A. You do have eligible compensation though, so you might discuss the feasibility of the "Backdoor Roth" strategy
Your tax return suggests you may have business income Depending on your circumstances, you may be able to implement a retirement plan for the business to defer taxes.
Your tax return does not list any HSA contributions If you are eligible to contribute to an HSA, you will get a tax deduction, regardless of whether you itemize or take the standard deduction.
You owed additional taxes beyond any withholding or estimated tax payments If this was due to a one-time event, you may not need to take any action. If not, consider adjusting your withholding to avoid any surprise lump sum payments due at tax time.
This return was prepared by a paid preparer, but there is nothing in Schedule C line 17 for legal and professional ser vices If you paid a tax professional to prepare your return, the cost of the preparation attributable to your business could potentially be deducted on this line.
Schedule C does not include any expenses on line 9, car and truck expenses Do you use a vehicle for any business-related activities?
For the ACA Premium Tax Credit, taxpayers with MAGI of less than 100% of the Federal Poverty Limit (FPL) are not eligible to receive any credits. Generally, taxpayers with MAGI between 100% and 400% of the FPL are eligible to receive the credit on a sliding scale. Taxpayers with MAGI above 400% of the FPL may receive the credit, to the extent the credit will keep the cost of the benchmark plan to no more than 8 5% of household income
Review employer-provided benefts to ensure you are taking full advantage of any pre-tax options.
Your modifed adjusted gross income (MAGI) appears to be low enough to qualify for the new but not the used clean vehicle credit, assuming you purchase such a vehicle and it meets the other eligibility criteria. Note that you may still be eligible for the used vehicle credit based on MAGI, as you can use your MAGI from the year you take deliver y of the vehicle or the year before, whichever is less If your modifed AGI is below the threshold in one of the two years, you can claim the credit
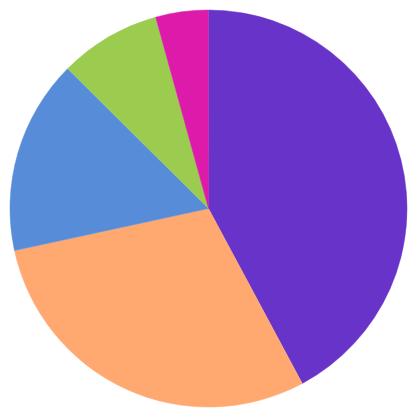
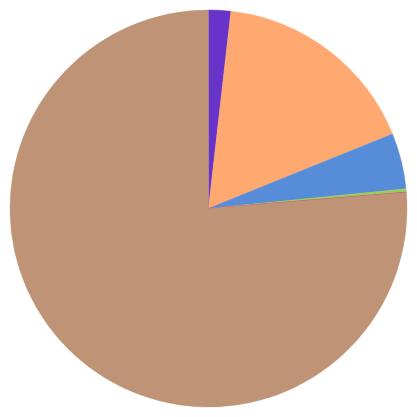
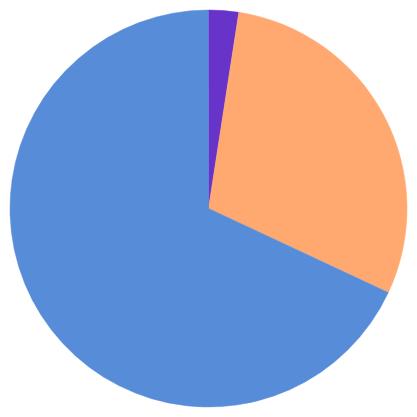
Investment Strategy
.03
GrowthPortfolio
PreparedforSampleClientbySheanFletcheratWealthKC May20,2025
2025YCharts,Inc AllRightsReserved YCharts,Inc ('YCharts')isnotregisteredwiththeUS SecuritiesandExchangeCommission(orwiththesecuritiesregulatoryauthorityorbodyofanystateoranyotherjurisdiction)asan investmentadviser,broker-dealerorinanyothercapacity,anddoesnotpurporttoprovideinvestmentadviceormakeinvestmentrecommendations Thisreporthasbeengeneratedusingdatamanuallyinputbythecreatorofthis reportcombinedwithdataandcalculationsfromYChartscomandisintendedsolelytoassistyouoryourinvestmentorotheradviser(s)inconductinginvestmentresearch Youshouldnotconstruethisreportasanoffertobuyor sell,asasolicitationofanoffertobuyorsell,orasarecommendationtobuy,sell,holdortrade,anysecurityorother
May20,2025
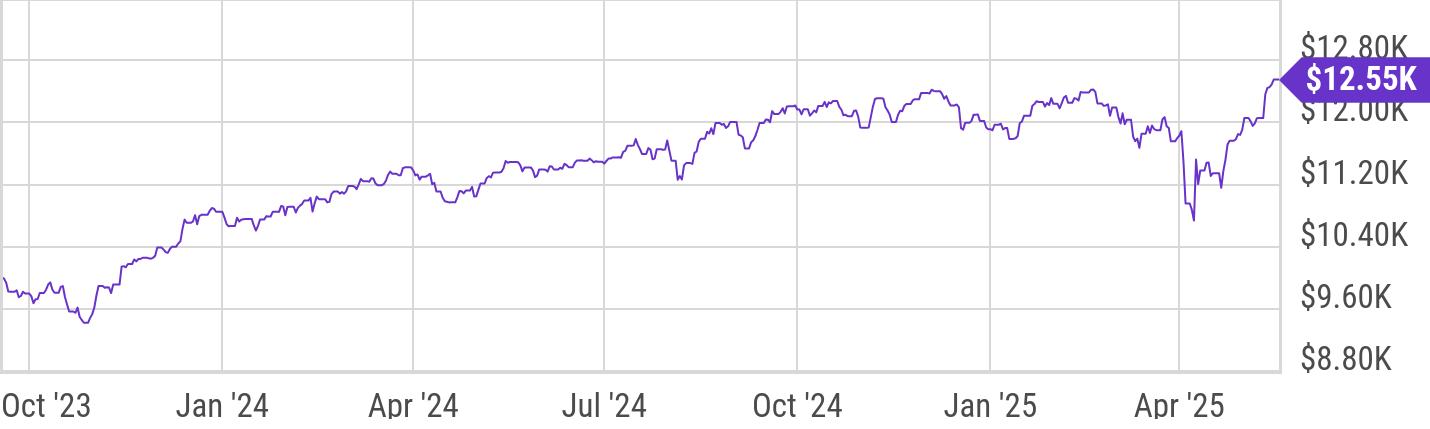
GrowthPortfolio
CumulativeReturn
3-Growth
September18,2023throughMay19,2025
PeriodicReturn
Dataasof:May19,2025
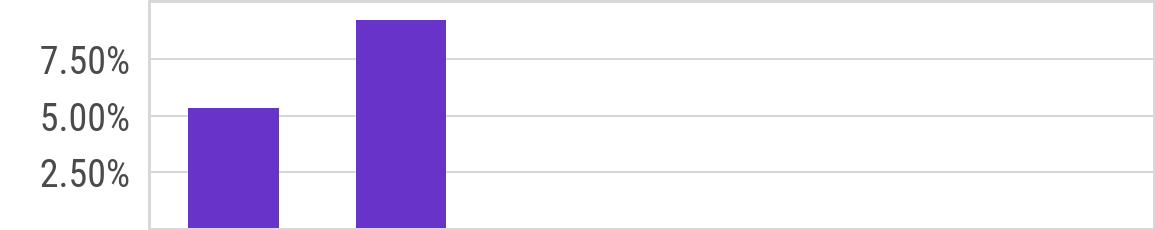
AnnualReturn
BasicInfo
Nodescriptiongiven Benchmark 3-GrowthBenchmark* AdvisoryFee 001%
*Benchmarkinformationdefinedindisclosuresection
KeyStats
Dataasof:May19,2025
Partialyeardatanotshown
Theperformancedataquotedpresentspastperformance;pastperformancedoesnotguaranteefutureresults;theinvestmentreturnandprincipal valueofaninvestmentwillfluctuate;aninvestor’sshares,whenredeemed,maybeworthmoreorlessthantheiroriginalcost;currentperformance maybelowerorhigherthantheperformancedataquoted.Themostrecentmonthendperformancedatacanbeaccessedat https://go.ycharts.com/fundcontactinfo.(SeetheStandardizedReturnssectionofthisreportforstandardizedreturnsinformation).
2025YCharts,Inc AllRightsReserved YCharts,Inc ('YCharts')isnotregisteredwiththeUS SecuritiesandExchangeCommission(orwiththesecuritiesregulatoryauthorityorbodyofanystateoranyotherjurisdiction)asan investmentadviser,broker-dealerorinanyothercapacity,anddoesnotpurporttoprovideinvestmentadviceormakeinvestmentrecommendations Thisreporthasbeengeneratedusingdatamanuallyinputbythecreatorofthis reportcombinedwithdataandcalculationsfromYChartscomandisintendedsolelytoassistyouoryourinvestmentorotheradviser(s)inconductinginvestmentresearch Youshouldnotconstruethisreportasanoffertobuyor sell,asasolicitationofanoffertobuyorsell,orasarecommendationtobuy,sell,holdortrade,anysecurityorother nancialinstrument THEIMPORTANTDISCLOSURESFOUNDATTHEENDOFTHISREPORT(WHICHINCLUDE DEFINITIONSOFCERTAINTERMSUSEDINTHISREPORT)AREANINTEGRALPARTOFTHISREPORTANDMUSTBEREADINCONJUNCTIONWITHYOURREVIEWOFTHISREPORT Forfurtherinformationregardingyouruseofthis reportpleasegoto:https://getychartscom/disclosure/
May20,2025
Dataasof:May20,2025
2025YCharts,Inc AllRightsReserved YCharts,Inc ('YCharts')isnotregisteredwiththeUS SecuritiesandExchangeCommission(orwiththesecuritiesregulatoryauthorityorbodyofanystateoranyotherjurisdiction)asan investmentadviser,broker-dealerorinanyothercapacity,anddoesnotpurporttoprovideinvestmentadviceormakeinvestmentrecommendations Thisreporthasbeengeneratedusingdatamanuallyinputbythecreatorofthis reportcombinedwithdataandcalculationsfromYChartscomandisintendedsolelytoassistyouoryourinvestmentorotheradviser(s)inconductinginvestmentresearch Youshouldnotconstruethisreportasanoffertobuyor sell,asasolicitationofanoffertobuyorsell,orasarecommendationtobuy,sell,holdortrade,anysecurityorother
DEFINITIONSOFCERTAINTERMSUSEDINTHISREPORT)AREANINTEGRALPARTOFTHISREPORTANDMUSTBEREADINCONJUNCTIONWITHYOURREVIEWOFTHISREPORT
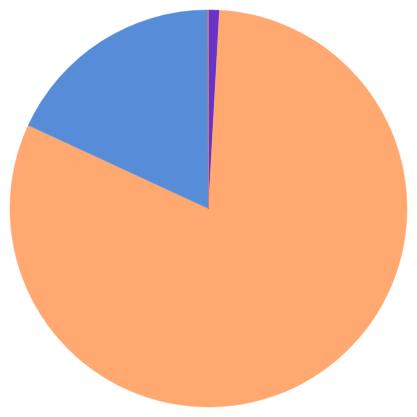
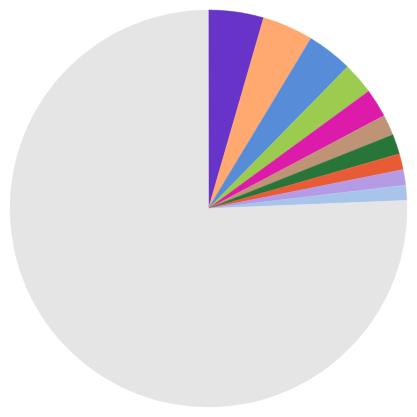
ExpandedRegionExposure
Americas 89.38%
NorthAmerica 8587%
Canada 069%
UnitedStates 8517%
LatinAmerica 351%
Argentina 000%
Brazil 050%
Chile
UnitedArabEmirates 005%
2025YCharts,Inc AllRightsReserved YCharts,Inc ('YCharts')isnotregisteredwiththeUS SecuritiesandExchangeCommission(orwiththesecuritiesregulatoryauthorityorbodyofanystateoranyotherjurisdiction)asan investmentadviser,broker-dealerorinanyothercapacity,anddoesnotpurporttoprovideinvestmentadviceormakeinvestmentrecommendations Thisreporthasbeengeneratedusingdatamanuallyinputbythecreatorofthis reportcombinedwithdataandcalculationsfromYChartscomandisintendedsolelytoassistyouoryourinvestmentorotheradviser(s)inconductinginvestmentresearch Youshouldnotconstruethisreportasanoffertobuyor sell,asasolicitationofanoffertobuyorsell,orasarecommendationtobuy,sell,holdortrade,anysecurityorother nancialinstrument THEIMPORTANTDISCLOSURESFOUNDATTHEENDOFTHISREPORT(WHICHINCLUDE DEFINITIONSOFCERTAINTERMSUSEDINTHISREPORT)AREANINTEGRALPARTOFTHISREPORTANDMUSTBEREADINCONJUNCTIONWITHYOURREVIEWOFTHISREPORT Forfurtherinformationregardingyouruseofthis reportpleasegoto:https://getychartscom/disclosure/
May20,2025
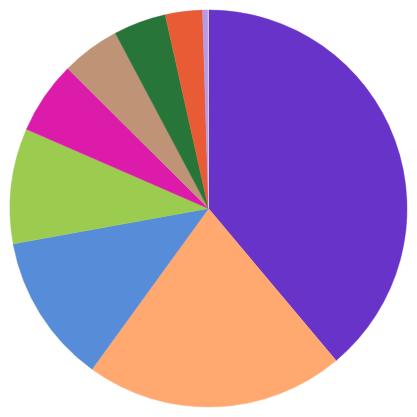
StockSectorExposure
2025YCharts,Inc AllRightsReserved YCharts,Inc ('YCharts')isnotregisteredwiththeUS SecuritiesandExchangeCommission(orwiththesecuritiesregulatoryauthorityorbodyofanystateoranyotherjurisdiction)asan investmentadviser,broker-dealerorinanyothercapacity,anddoesnotpurporttoprovideinvestmentadviceormakeinvestmentrecommendations Thisreporthasbeengeneratedusingdatamanuallyinputbythecreatorofthis reportcombinedwithdataandcalculationsfromYChartscomandisintendedsolelytoassistyouoryourinvestmentorotheradviser(s)inconductinginvestmentresearch Youshouldnotconstruethisreportasanoffertobuyor sell,asasolicitationofanoffertobuyorsell,orasarecommendationtobuy,sell,holdortrade,anysecurityorother
DEFINITIONSOFCERTAINTERMSUSEDINTHISREPORT)AREANINTEGRALPARTOFTHISREPORTANDMUSTBEREADINCONJUNCTIONWITHYOURREVIEWOFTHISREPORT Forfurtherinformationregardingyouruseofthis reportpleasegoto:https://getychartscom/disclosure/
May20,2025
Dataasof:May20,2025
BondCreditQualityExposure
Dataasof:May20,2025
BondMaturityExposure
Dataasof:May20,2025
2025YCharts,Inc AllRightsReserved YCharts,Inc ('YCharts')isnotregisteredwiththeUS SecuritiesandExchangeCommission(orwiththesecuritiesregulatoryauthorityorbodyofanystateoranyotherjurisdiction)asan investmentadviser,broker-dealerorinanyothercapacity,anddoesnotpurporttoprovideinvestmentadviceormakeinvestmentrecommendations Thisreporthasbeengeneratedusingdatamanuallyinputbythecreatorofthis reportcombinedwithdataandcalculationsfromYChartscomandisintendedsolelytoassistyouoryourinvestmentorotheradviser(s)inconductinginvestmentresearch Youshouldnotconstruethisreportasanoffertobuyor sell,asasolicitationofanoffertobuyorsell,orasarecommendationtobuy,sell,holdortrade,anysecurityorother
DEFINITIONSOFCERTAINTERMSUSEDINTHISREPORT)AREANINTEGRALPARTOFTHISREPORTANDMUSTBEREADINCONJUNCTIONWITHYOURREVIEWOFTHISREPORT
reportpleasegoto:https://getychartscom/disclosure/
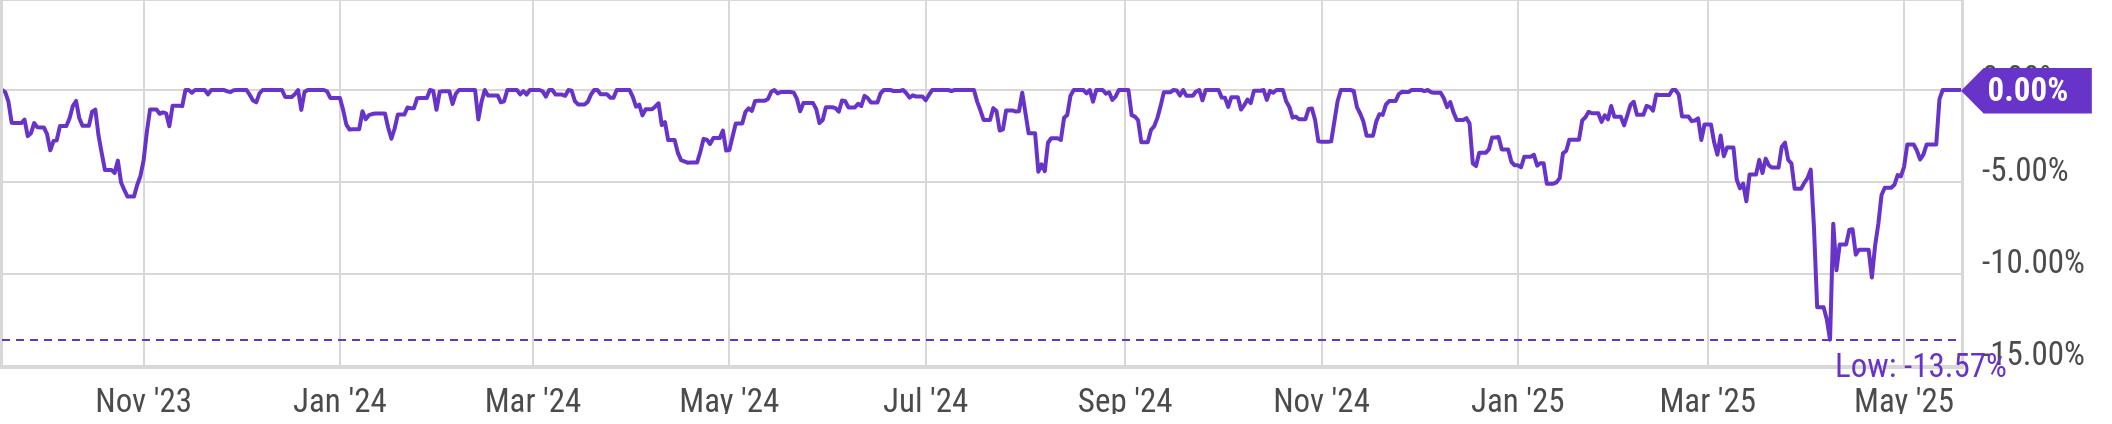
Dataasof:April30,2025
3-GrowthTotalReturn%OffHigh
Dataasof:None
Theperformancedataquotedpresentspastperformance;pastperformancedoesnotguaranteefutureresults;theinvestmentreturnandprincipal valueofaninvestmentwillfluctuate;aninvestor’sshares,whenredeemed,maybeworthmoreorlessthantheiroriginalcost;currentperformance maybelowerorhigherthantheperformancedataquoted.Themostrecentmonthendperformancedatacanbeaccessedat https://go.ycharts.com/fundcontactinfo.(SeetheStandardizedReturnssectionofthisreportforstandardizedreturnsinformation).
2025YCharts,Inc AllRightsReserved YCharts,Inc ('YCharts')isnotregisteredwiththeUS SecuritiesandExchangeCommission(orwiththesecuritiesregulatoryauthorityorbodyofanystateoranyotherjurisdiction)asan investmentadviser,broker-dealerorinanyothercapacity,anddoesnotpurporttoprovideinvestmentadviceormakeinvestmentrecommendations Thisreporthasbeengeneratedusingdatamanuallyinputbythecreatorofthis reportcombinedwithdataandcalculationsfromYChartscomandisintendedsolelytoassistyouoryourinvestmentorotheradviser(s)inconductinginvestmentresearch Youshouldnotconstruethisreportasanoffertobuyor sell,asasolicitationofanoffertobuyorsell,orasarecommendationtobuy,sell,holdortrade,anysecurityorother nancialinstrument THEIMPORTANTDISCLOSURESFOUNDATTHEENDOFTHISREPORT(WHICHINCLUDE DEFINITIONSOFCERTAINTERMSUSEDINTHISREPORT)AREANINTEGRALPARTOFTHISREPORTANDMUSTBEREADINCONJUNCTIONWITHYOURREVIEWOFTHISREPORT Forfurtherinformationregardingyouruseofthis reportpleasegoto:https://getychartscom/disclosure/
May20,2025
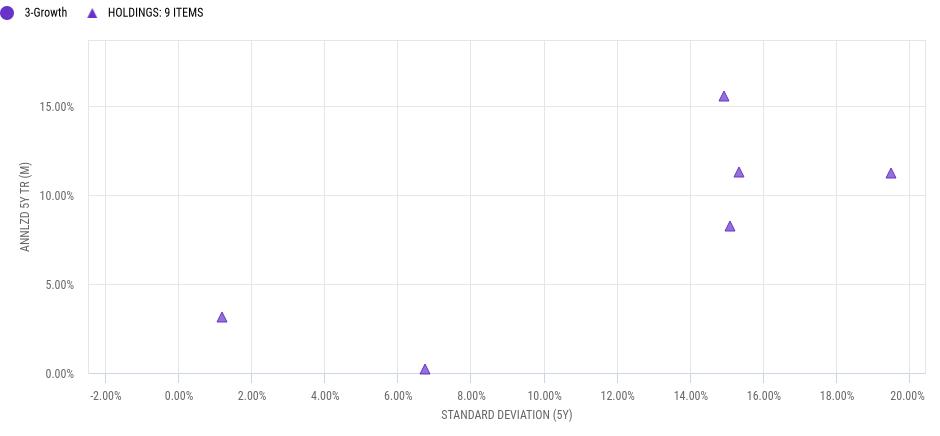
3-Growth
Risk/RewardScatterPlot(5Years)
Dataasof:--
Theperformancedataquotedpresentspastperformance;pastperformancedoesnotguaranteefutureresults;theinvestmentreturnandprincipal valueofaninvestmentwillfluctuate;aninvestor’sshares,whenredeemed,maybeworthmoreorlessthantheiroriginalcost;currentperformance maybelowerorhigherthantheperformancedataquoted.Themostrecentmonthendperformancedatacanbeaccessedat https://go.ycharts.com/fundcontactinfo.(SeetheStandardizedReturnssectionofthisreportforstandardizedreturnsinformation).
2025YCharts,Inc AllRightsReserved YCharts,Inc ('YCharts')isnotregisteredwiththeUS SecuritiesandExchangeCommission(orwiththesecuritiesregulatoryauthorityorbodyofanystateoranyotherjurisdiction)asan investmentadviser,broker-dealerorinanyothercapacity,anddoesnotpurporttoprovideinvestmentadviceormakeinvestmentrecommendations Thisreporthasbeengeneratedusingdatamanuallyinputbythecreatorofthis reportcombinedwithdataandcalculationsfromYChartscomandisintendedsolelytoassistyouoryourinvestmentorotheradviser(s)inconductinginvestmentresearch Youshouldnotconstruethisreportasanoffertobuyor sell,asasolicitationofanoffertobuyorsell,orasarecommendationtobuy,sell,holdortrade,anysecurityorother nancialinstrument THEIMPORTANTDISCLOSURESFOUNDATTHEENDOFTHISREPORT(WHICHINCLUDE DEFINITIONSOFCERTAINTERMSUSEDINTHISREPORT)AREANINTEGRALPARTOFTHISREPORTANDMUSTBEREADINCONJUNCTIONWITHYOURREVIEWOFTHISREPORT Forfurtherinformationregardingyouruseofthis reportpleasegoto:https://getychartscom/disclosure/
May20,2025
Top10Holdings
Dataasof:May20,2025
Theperformancedataquotedpresentspastperformance;pastperformancedoesnotguaranteefutureresults;theinvestmentreturnandprincipal valueofaninvestmentwillfluctuate;aninvestor’sshares,whenredeemed,maybeworthmoreorlessthantheiroriginalcost;currentperformance maybelowerorhigherthantheperformancedataquoted.Themostrecentmonthendperformancedatacanbeaccessedat https://go.ycharts.com/fundcontactinfo.(SeetheStandardizedReturnssectionofthisreportforstandardizedreturnsinformation).
2025YCharts,Inc AllRightsReserved YCharts,Inc ('YCharts')isnotregisteredwiththeUS SecuritiesandExchangeCommission(orwiththesecuritiesregulatoryauthorityorbodyofanystateoranyotherjurisdiction)asan investmentadviser,broker-dealerorinanyothercapacity,anddoesnotpurporttoprovideinvestmentadviceormakeinvestmentrecommendations Thisreporthasbeengeneratedusingdatamanuallyinputbythecreatorofthis reportcombinedwithdataandcalculationsfromYChartscomandisintendedsolelytoassistyouoryourinvestmentorotheradviser(s)inconductinginvestmentresearch Youshouldnotconstruethisreportasanoffertobuyor sell,asasolicitationofanoffertobuyorsell,orasarecommendationtobuy,sell,holdortrade,anysecurityorother nancialinstrument THEIMPORTANTDISCLOSURESFOUNDATTHEENDOFTHISREPORT(WHICHINCLUDE DEFINITIONSOFCERTAINTERMSUSEDINTHISREPORT)AREANINTEGRALPARTOFTHISREPORTANDMUSTBEREADINCONJUNCTIONWITHYOURREVIEWOFTHISREPORT
reportpleasegoto:https://getychartscom/disclosure/
Top10UnderlyingHoldings
Name
Theperformancedataquotedpresentspastperformance;pastperformancedoesnotguaranteefutureresults;theinvestmentreturnandprincipal valueofaninvestmentwillfluctuate;aninvestor’sshares,whenredeemed,maybeworthmoreorlessthantheiroriginalcost;currentperformance maybelowerorhigherthantheperformancedataquoted.Themostrecentmonthendperformancedatacanbeaccessedat https://go.ycharts.com/fundcontactinfo.(SeetheStandardizedReturnssectionofthisreportforstandardizedreturnsinformation).
2025YCharts,Inc AllRightsReserved YCharts,Inc ('YCharts')isnotregisteredwiththeUS SecuritiesandExchangeCommission(orwiththesecuritiesregulatoryauthorityorbodyofanystateoranyotherjurisdiction)asan investmentadviser,broker-dealerorinanyothercapacity,anddoesnotpurporttoprovideinvestmentadviceormakeinvestmentrecommendations Thisreporthasbeengeneratedusingdatamanuallyinputbythecreatorofthis reportcombinedwithdataandcalculationsfromYChartscomandisintendedsolelytoassistyouoryourinvestmentorotheradviser(s)inconductinginvestmentresearch Youshouldnotconstruethisreportasanoffertobuyor sell,asasolicitationofanoffertobuyorsell,orasarecommendationtobuy,sell,holdortrade,anysecurityorother nancialinstrument THEIMPORTANTDISCLOSURESFOUNDATTHEENDOFTHISREPORT(WHICHINCLUDE DEFINITIONSOFCERTAINTERMSUSEDINTHISREPORT)AREANINTEGRALPARTOFTHISREPORTANDMUSTBEREADINCONJUNCTIONWITHYOURREVIEWOFTHISREPORT Forfurtherinformationregardingyouruseofthis reportpleasegoto:https://getychartscom/disclosure/
May20,2025
AllHoldings-3-Growth
Symbol Name
Theperformancedataquotedpresentspastperformance;pastperformancedoesnotguaranteefutureresults;theinvestmentreturnandprincipal valueofaninvestmentwillfluctuate;aninvestor’sshares,whenredeemed,maybeworthmoreorlessthantheiroriginalcost;currentperformance maybelowerorhigherthantheperformancedataquoted.Themostrecentmonthendperformancedatacanbeaccessedat https://go.ycharts.com/fundcontactinfo.(SeetheStandardizedReturnssectionofthisreportforstandardizedreturnsinformation).
2025YCharts,Inc AllRightsReserved YCharts,Inc ('YCharts')isnotregisteredwiththeUS SecuritiesandExchangeCommission(orwiththesecuritiesregulatoryauthorityorbodyofanystateoranyotherjurisdiction)asan investmentadviser,broker-dealerorinanyothercapacity,anddoesnotpurporttoprovideinvestmentadviceormakeinvestmentrecommendations Thisreporthasbeengeneratedusingdatamanuallyinputbythecreatorofthis reportcombinedwithdataandcalculationsfromYChartscomandisintendedsolelytoassistyouoryourinvestmentorotheradviser(s)inconductinginvestmentresearch Youshouldnotconstruethisreportasanoffertobuyor sell,asasolicitationofanoffertobuyorsell,orasarecommendationtobuy,sell,holdortrade,anysecurityorother nancialinstrument THEIMPORTANTDISCLOSURESFOUNDATTHEENDOFTHISREPORT(WHICHINCLUDE DEFINITIONSOFCERTAINTERMSUSEDINTHISREPORT)AREANINTEGRALPARTOFTHISREPORTANDMUSTBEREADINCONJUNCTIONWITHYOURREVIEWOFTHISREPORT Forfurtherinformationregardingyouruseofthis reportpleasegoto:https://getychartscom/disclosure/
Theperformancedataquotedpresentspastperformance;pastperformancedoesnotguaranteefutureresults;theinvestmentreturnandprincipal valueofaninvestmentwillfluctuate;aninvestor’sshares,whenredeemed,maybeworthmoreorlessthantheiroriginalcost;currentperformance maybelowerorhigherthantheperformancedataquoted.Themostrecentmonthendperformancedatacanbeaccessedat https://go.ycharts.com/fundcontactinfo.(SeetheStandardizedReturnssectionofthisreportforstandardizedreturnsinformation). 2025YCharts,Inc AllRightsReserved YCharts,Inc ('YCharts')isnotregisteredwiththeUS SecuritiesandExchangeCommission(orwiththesecuritiesregulatoryauthorityorbodyofanystateoranyotherjurisdiction)asan investmentadviser,broker-dealerorinanyothercapacity,anddoesnotpurporttoprovideinvestmentadviceormakeinvestmentrecommendations Thisreporthasbeengeneratedusingdatamanuallyinputbythecreatorofthis reportcombinedwithdataandcalculationsfromYChartscomandisintendedsolelytoassistyouoryourinvestmentorotheradviser(s)inconductinginvestmentresearch Youshouldnotconstruethisreportasanoffertobuyor sell,asasolicitationofanoffertobuyorsell,orasarecommendationtobuy,sell,holdortrade,anysecurityorother nancialinstrument THEIMPORTANTDISCLOSURESFOUNDATTHEENDOFTHISREPORT(WHICHINCLUDE DEFINITIONSOFCERTAINTERMSUSEDINTHISREPORT)AREANINTEGRALPARTOFTHISREPORTANDMUSTBEREADINCONJUNCTIONWITHYOURREVIEWOFTHISREPORT Forfurtherinformationregardingyouruseofthis reportpleasegoto:https://getychartscom/disclosure/ May20,2025
Definitions
AllocationsandExposureData:Allhypotheticalportfolioattributesarecalculatedasweightedaveragesoftheunderlyingholdingsusingthetarget weightsinputbythecreatorofthisreport Theunderlyingsecurities’attributesarebasedondatainYCharts,Inc providedbyMorningstar,Inc For individualstockpositionstheentireweightisassignedtothecorrespondingsector,marketcapgroup,style,etc
AlphavsCategory:Alphavscategorymetricsarecalculatedovervarioustimeperiodsagainstthecategorybenchmark Theymeasurehowwellan investmenthasperformedrelativetoitscategorybenchmark Positivealphaindicatesthattheinvestmentoutperformedthebenchmark,suggestingthe managerorstrategyaddedvalue,whereasnegativealphaindicatesunderperformancecomparedtothecategorybenchmark
AnnualizedPriceReturn:Annualizedreturnsareperiodreturnsre-scaledtoshowthecompoundannualgrowthrateofthesecurity.Thisallowsinvestors tocomparereturnsofdifferentassetsthattheyhaveownedfordifferentlengthsoftime.Italsogivestheinvestoranideaofthereturnsthattheywould havereturnedperyeariftheyhadbeeninvestedinthesecurityduringthetimeframeoftheannualizedmetric
AnnualizedTotalReturns:AnnualizedTotalreturnsareperiodreturnsre-scaledtoshowthecompoundannualgrowthrateofthesecurity Thisallows investorstocomparereturnsofdifferentassetsthattheyhaveownedfordifferentlengthsoftime Italsogivestheinvestoranideaofthereturnsthatthey wouldhavereturnedperyeariftheyhadbeeninvestedinthesecurityduringthetimeframeoftheannualizedmetric.
AssetAllocation:Assetallocationreflectstheassetclassweightingsofthefundorportfolio TheOthercategoryincludessecuritytypesthatarenot neatlyclassifiedintheotherassetclassesorcannotbeclassifiedbyYChartsasaresultofmissingdata Allocationsmaynotsumto100%dueto rounding
AverageCoupon:AverageCouponistheaveragerateofthecouponsofthebondsinafund,weightedbasedeachbondholding'ssizerelativetothe portfolio Averagecouponindicateswhetherafundiscarryingagreateramountofhighorlowcouponbonds Whilehighercouponbondsoffermore return,theymaycarryadditionalrisk
AverageCreditQualityScore:Shortdef:TheAverageCreditQualityScoreisanaverageofthecreditratingofthebondsheldbyafund Theaverageis calculatedbyassigningavaluetoeachunderlyingbondinthefundbasedontherelativedefaultrate,whichisdeterminedbythecreditratingofthebond. Itassumesthattheoddsofdefaultincreaseasthecreditratingdecreases Theaveragedefaultrateisthenusedtodeterminetheaveragecreditqualityof thefund
AverageMarketCap:Marketcapitalizationrepresentsthetotalvalueofacompanyasdeterminedbymultiplyingitssharepricebythetotalnumberof sharesoutstanding Itiscommonlyusedtoclassifycompaniesbysize,suchaslarge-cap,mid-cap,orsmall-cap Weightedaveragemarketcapitalization reflectstheaveragemarketcapofthesecuritiesinafundorportfolio,weightedbytheirrespectiveproportions.Itprovidesinsightintoafundorportfolio's exposuretodifferentmarket-capsegments,helpingtoassessitsoverallsizeprofileandriskcharacteristics
AveragePrice:Averagepriceindicateswhetherafundfavorsinvestinginbondsbeloworabovefacevalue Ahighervalue(above100)wouldsuggestthe latter
BetavsCategory:Betavscategorymetricsarecalculatedovervarioustimeperiodsagainstthecategorybenchmark Theymeasureaninvestment's sensitivitytotheoverallmovementsofitscategorybenchmark Abetaequalto1indicatesthattheinvestmenttendstomoveinlinewiththebenchmark, suggestingasimilarlevelofrisk,abetagreaterthan1indicatesthattheinvestmentismorevolatilethanthebenchmark,suggestinghigherrisk,anda betalessthan1indicatesthattheinvestmentislessvolatilethanthebenchmark,suggestinglowerrisk AlistofYChartscategorybenchmarkscanbe viewedherehttps://ychartscom/glossary/terms/ychartscategorybenchmarks
2025YCharts,Inc AllRightsReserved YCharts,Inc ('YCharts')isnotregisteredwiththeUS SecuritiesandExchangeCommission(orwiththesecuritiesregulatoryauthorityorbodyofanystateoranyotherjurisdiction)asan investmentadviser,broker-dealerorinanyothercapacity,anddoesnotpurporttoprovideinvestmentadviceormakeinvestmentrecommendations Thisreporthasbeengeneratedusingdatamanuallyinputbythecreatorofthis reportcombinedwithdataandcalculationsfromYChartscomandisintendedsolelytoassistyouoryourinvestmentorotheradviser(s)inconductinginvestmentresearch Youshouldnotconstruethisreportasanoffertobuyor sell,asasolicitationofanoffertobuyorsell,orasarecommendationtobuy,sell,holdortrade,anysecurityorother nancialinstrument THEIMPORTANTDISCLOSURESFOUNDATTHEENDOFTHISREPORT(WHICHINCLUDE DEFINITIONSOFCERTAINTERMSUSEDINTHISREPORT)AREANINTEGRALPARTOFTHISREPORTANDMUSTBEREADINCONJUNCTIONWITHYOURREVIEWOFTHISREPORT Forfurtherinformationregardingyouruseofthis reportpleasegoto:https://getychartscom/disclosure/ May20,2025
Definitions
BondMaturityExposure:BondMaturityExposureprovidesabreakdownofthefixedincomesecuritiesheldwithinaportfoliobasedontheirbondmaturity dates Ithighlightstheallocationofinvestmentsacrossvariousmaturityperiods,indicatingthedistributionofbondsthatareduetomaturewithinspecific timeframes Fixedincomesecuritiesaregroupedintothreecategories-short-term,intermediate-term,andlong-termmaturities Short-termbonds generallyhavematuritiesofonetothreeyears,intermediate-termbondsrangefromfourtotenyears,andlong-termbondshavematuritiesbeyondten years.
BondSectorExposure:Bondsectorexposureshowsthepercentageofaportfolio’slongfixedincomeassetsinvestedineachofsixsectors-Government, Municipal,Corporate,Securitized,Cash&Equivalents,andDerivatives TheGovernmentSectorcomprisesallstandardgovernment-issueddebt,bonds fromaCentralBankorTreasury,andbondsissuedbylocalgovernments,cantons,regions,andprovinces TheMunicipalSectorconsistsoftaxableand tax-exemptdebtobligationsissuedbystates,cities,counties,provinces,andothernon-federalgovernmententities.TheCorporateSectorencompasses bankloans,convertiblebonds,traditionalcorporatedebtsecurities,andpreferredstock.TheSecuritizedSectorcoversalltypesofmortgage-backed securities,coveredbonds,andasset-backedsecurities TheCash&EquivalentsSectorincludesbankcash,certificatesofdeposit,currency,andmoney marketholdings Italsoincludesanyfixed-incomesecuritiesmaturingwithinshorttimeframes,commercialpaper,andrepurchaseagreements The DerivativesSectorencompassescommontypesoffixed-incomederivativecontractssuchasfuturesandforwards,options,andswaps
CreditQualityExposure:Creditqualityexposuremetricsshowthebreakdownofafundorportfolio'sfixedincomesecuritiesacrossvariouscreditrating categories Creditratings,providedbyindependentagencies,guideinvestorsinunderstandingtheriskassociatedwithbondsordebtinstruments Each ratingagencyhasitsownalphabeticaldesignationsandmostrangefromhigh(AAAtoAA),tomedium(AtoBBB),andlow(BB,B,CCC,CC,C,andD) Higherratingsindicatelowerrisk,whilelowerratingssignifyhigherpotentialreturn,higherriskandpotentialfinancialdistress YChartsreceivescredit qualityexposuredataforfundsfromadataproviderwhocalculatesthepercentageforeachratingcategorybyweightingeachholding’screditratingbyits marketvaluethenaveragingbythesumofholdingvalues Anaverageratingiscomputedforholdingsthathavemultipleratings Thedistributionisbased uponavailablecreditratingsfromrecognizedcreditratingagenciessuchasaNationallyRecognizedStatisticalRatingOrganization(NRSRO)intheUS A fulllistofNRSROscanbefoundathttps://www.sec.gov/about/divisions-offices/office-credit-ratings/current-nrsros.
CurrentYield:TheCurrentYieldmetricisavailableformutualfundsandETFsonYCharts Itreflectstheincomeofthebondholdingsinafundrelativeto thefund'sprice CurrentYieldisanannualizedfigureandcanbeinterpretedastheincomeaninvestorcouldexpecttoearnfromthebondholdingsofthe fundifitwasheldforoneyear
DistributionYield:Distributionyieldisafinancialmetricthatmeasurestheincomefromdistributionsrelativetothevalueofaninvestment Itshowshow muchafundorportfoliohaspaidoutindistributionseachyearrelativetoitsprice,NAV(NetAssetValue)orlevel(forportfolios) Distributionyieldis availableforthefollowingsecuritytypesonYCharts:mutualfunds,ETFs,closedendfunds,andportfolios
DividendYield:Dividendyieldisafinancialmetricthatmeasurestheincomefromdividendsrelativetothevalueofaninvestment.Itshowshowmucha company,fund,orportfoliohaspaidoutindividendseachyearrelativetoitsprice,NAV(NetAssetValue)orlevel(forportfolios).Dividendyieldis availableforthefollowingsecuritytypesonYCharts:stocks,mutualfunds,ETFs,ClosedEndFunds(CEFs),andportfolios
EffectiveDuration:Effectivedurationisameasureofriskforfundsthatholdbondswithembeddedoptions ItestimatestheamounttheNAVofafundwill fallwheninterestratesriseby1%orwillincreasewheninterestratesfallby1% Thisactsasameasureoftheinterestratesensitivityofafund,andtakes intoaccountput,call,andprepaymentoptions.
HistoricalSharpeRatio:TheSharpeRatiomeasurestherisk-adjustedreturnofasecurity Thisisausefulmetricforanalyzingthereturnyouarereceiving onasecurityincomparisontotheamountofvolatilityexpected Thehistoricalsharperatiouseshistoricalreturnstocalculatethereturnandstandard deviation
2025YCharts,Inc AllRightsReserved YCharts,Inc ('YCharts')isnotregisteredwiththeUS SecuritiesandExchangeCommission(orwiththesecuritiesregulatoryauthorityorbodyofanystateoranyotherjurisdiction)asan investmentadviser,broker-dealerorinanyothercapacity,anddoesnotpurporttoprovideinvestmentadviceormakeinvestmentrecommendations Thisreporthasbeengeneratedusingdatamanuallyinputbythecreatorofthis reportcombinedwithdataandcalculationsfromYChartscomandisintendedsolelytoassistyouoryourinvestmentorotheradviser(s)inconductinginvestmentresearch Youshouldnotconstruethisreportasanoffertobuyor sell,asasolicitationofanoffertobuyorsell,orasarecommendationtobuy,sell,holdortrade,anysecurityorother nancialinstrument THEIMPORTANTDISCLOSURESFOUNDATTHEENDOFTHISREPORT(WHICHINCLUDE DEFINITIONSOFCERTAINTERMSUSEDINTHISREPORT)AREANINTEGRALPARTOFTHISREPORTANDMUSTBEREADINCONJUNCTIONWITHYOURREVIEWOFTHISREPORT Forfurtherinformationregardingyouruseofthis reportpleasegoto:https://getychartscom/disclosure/
May20,2025
Definitions
MarketCapExposure:Marketcapitalizationexposureshowshowaportfolio’sstockholdingsaredistributedacrosscompaniesofdifferentsizes,based ontheirmarketcapitalization Giant-capcompaniesarethelargestinthemarketandareusuallyindustryleaderswithasignificantglobalpresence Largecapcompaniesarealsowell-establishedandwidelyrecognizedbutaregenerallysmallerthangiant-capfirms Medium-capcompaniesarelargerandmore establishedthansmall-capcompaniesbuthavemoregrowthpotentialcomparedtolarge-capcompanies.Small-capcompaniesareconsideredriskierbut havethepotentialforsignificantgrowth.Micro-capcompaniesarethesmallestpubliclytradedcompanies,andusuallyhavelimitedfinancialresources andlessliquidityintheirstocks
MarketClassification:Reflectsafundorportfolio’sexposuretodevelopedandemergingmarkets
MaxDrawdown:Maxdrawdownisanindicatoroftheriskofaportfoliochosenbasedonacertainstrategy.Itmeasuresthelargestsingledropfrompeak tobottominthevalueofaportfoliobeforeanewpeakisachieved
NetExpenseRatio:Theexpenseratiorepresentsthecostofowningafund Itexpressesthepercentofassetsdeductedeachfiscalyeartocovervarious fundexpenses,including12b-1fees,managementandadministrativecharges,operationalexpenditures,andallothercoststiedtomanagingandoperating afund,lessanyfeewaiversorotherrebates.Transactionfees,brokeragecostsandsaleschargesarenotreflectedintheexpenseratio.Incontrast,the grossexpenseratiodoesnotincorporateanyfeewaiversorotheradjustmentsthatwereineffectduringthetimeperiod.Itisimportanttolookatboththe expenseratioandgrossexpenseratiowhenevaluatingafund Forexample,ifafundhasanexpenseratioof2%andagrossexpenseratioof3%,1%of potentialfeesorotherexpenseswerewaived Thereisnoguaranteethattheserebatesorreimbursementswillcontinueinthefuture,andiftheyare discontinued,thecostofowningthefundrepresentedbytheexpenseratiowouldbe3%
Numberofbondholdings:Totalnumberofuniquebondholdingsofafund.
Numberofholdings:Numberofholdingsisthesumofalltheuniqueholdingsofafund,equity,fixedincome,derivative,oralternativeinvestments included It'simportanttonotethatifamutualfundholdsbothcommonandpreferredstockofacompanythenumberofholdingswouldbe2
Numberofstockholdings:Totalnumberofuniquestockholdingsofafund.It'simportanttonotethatifafundholdsbothcommonandpreferredstockof acompany,thecompanywouldbecountedtwice
Price:Thepriceofasecuritymeasuresthecosttopurchase1shareofasecurity Foracompany,pricecanbemultipliedbysharesoutstandingtofindthe marketcapitalization(valueofthecompany)
RegionExposure:Reflectstheexposureofafundorportfolio'sinvestmentstotheindicatedgeographicarea(s)
RegionalExposure:Thisdatasetprovidesadetailedbreakdownofaninvestment'scountryexposure Eachcountry'sexposureispresentedasa percentageofnon-cashequityassetsheldbythefund
SortinoRatio:TheSortinoRatioisnamedafterFrankSortino,whoiswidelyrecognizedforhisuseofdownsiderisk TheSortinoratioisverysimilartothe Sharperatiointhatitistryingtocapturetheriskofaninvestmentoveracertainperiod However,theSortinoRatiodoesthisbycapturingthe"downside" risk,byignoringtheupsidevolatility Thetheorybeinginvestorsshouldonlybeconcernedwithharmful(negative)volatility
2025YCharts,Inc AllRightsReserved YCharts,Inc ('YCharts')isnotregisteredwiththeUS SecuritiesandExchangeCommission(orwiththesecuritiesregulatoryauthorityorbodyofanystateoranyotherjurisdiction)asan investmentadviser,broker-dealerorinanyothercapacity,anddoesnotpurporttoprovideinvestmentadviceormakeinvestmentrecommendations
Thisreporthasbeengeneratedusingdatamanuallyinputbythecreatorofthis reportcombinedwithdataandcalculationsfromYChartscomandisintendedsolelytoassistyouoryourinvestmentorotheradviser(s)inconductinginvestmentresearch Youshouldnotconstruethisreportasanoffertobuyor sell,asasolicitationofanoffertobuyorsell,orasarecommendationtobuy,sell,holdortrade,anysecurityorother nancialinstrument THEIMPORTANTDISCLOSURESFOUNDATTHEENDOFTHISREPORT(WHICHINCLUDE DEFINITIONSOFCERTAINTERMSUSEDINTHISREPORT)AREANINTEGRALPARTOFTHISREPORTANDMUSTBEREADINCONJUNCTIONWITHYOURREVIEWOFTHISREPORT Forfurtherinformationregardingyouruseofthis reportpleasegoto:https://getychartscom/disclosure/
May20,2025
Definitions
StandardDeviation:Standarddeviationmeasureshowmuchaninvestment'sreturndeviatesfromitsaverageoveraspecificperiod Higherstandard deviationindicatesmorevolatility,whilelowerstandarddeviationsignifiessteadierreturns YChartsmakesfivetypesofstandarddeviationmetricsover differenttimeperiodsavailable:daily,monthly,quarterly,annualizedmonthly,andannualizedquarterly
StockSectorExposure:Showsthebreakdownofafundorportfolio'slongequityassetsacrosselevenmajorindustrygroupsandhowtheyrolluptothree broadsectors-cyclical,sensitiveanddefensive
StockStyleExposure:StockStyleExposureshowshowaportfolio'sholdingsaredistributedacrosscompaniesofdifferentsizes(basedontheirmarket capitalization)andinvestmentstyles(value,blendorgrowth).YChartscalculatesthestockstyledatabasedonthecalculationmethodsseenbelow:Stock sizeiscalculatedbyfirsttakingtheconstituentsoftheRussell3000andsortingbymarketcap.Theyarethenbrokenintosizebasedontheirpercentileof overallmarketcap Largecapismadeupofthelargest70%ofstocksintheRussell3000,stockswithamarketcapgreaterthanthe70%cutoffare groupedintolargecap Stocksinthenext15%aregroupedintomidcap Stocksinthebottom15%aregroupedintosmallcap Stockstyleiscalculated usingtheaverageZ-Scoreof6metrics:1 PricetoBookValue(3YMean)2 PERatio(3YMean)3 PSRatio(3YMean)4 ReturnonEquity(3YMean)5 Revenue(3YGrowth)6 DividendYieldEacharecomparedtoanindexbasedontheirstockssize,LargeCaparecomparedtotheS&P500,MidCapare comparedtotheS&P400,andSmallCaparecomparedtotheS&P600 TheZ-ScoreiscalculatedusingtheformulaZ-Score=[(StockValue-Index Average)/IndexStandardDeviation]forthefirst5metrics.DividendYieldZ-ScoreiscalculatedasDividendYieldZ-Score=[((StockValue-IndexAverage) /IndexStandardDeviation)-1] OncetheZ-Scorehasbeencalculatedforall6metrics,theaverageistakenandthefollowingbreakpointsareused:1 ZScore>03=Growth2 Z-Score<-03=Value3 Z-Scorebetween-03and03=Core
TotalReturn:TheTotalreturnisthechangeinpriceoveraspecificperiodoftimethatincludesdividendsanddistributionspaid
TotalReturnLevel:Thetotalreturnlevelallowsinvestorstoviewtheperformanceofasecurityinclusiveofbothpriceappreciationand dividends/distributions Totalreturnlevelisseenasthemostaccuratecalculationthatproducesreturnsconsistentwithmostothersources
ValueAtRisk(VaR):TheVaRcalculatesthepotentiallossofaninvestmentwithagiventimeframeandconfidencelevel Forexample,ifasecurityhasa 5%DailyVaR(All)of4%:Thereis95%confidencethatthesecuritywillnothavealargerlossthan4%inoneday Sincethismetricsays(All)weare calculatingthisusingallavailablepricehistoryforthesecurity.Inanotherexample,ifasecurityhasaMonthlyVaR1%(3YLookback)of15%:Thereis99% confidencethatthesecuritywillnothavealargerlossthan15%inonemonth Thisiscalculatedusingthepast3yearsofhistoricalprices Keepinmind thatVaRdoesnotgiveyouanyinformationaboutthemagnitudeofthepotentiallossinexcessoftheVaR Foracalculationthatgiveyouthisinformation youcanviewExpectedShortfall
WeightedAverageDebttoCapital:Theweightedaveragedebt-to-capitalratiomeasurestheproportionofafund'stotaldebtinrelationtoitstotalcapital witheachunderlyingholdingbeingtakenintoaccountbasedonweightinthefund'sportfolio.Thisratiohelpsassessthefund'soverallfinancialleverage anditspotentialriskexposurestemmingfromitsdebtobligations
WeightedAveragePERatio:Aweightedaverageofeachunderlyingholding’ssharepricerelativetothesalespershare StocksthathaveRevenueper Share<0areexcludedinthiscalculation
WeightedAveragePricetoBookRatio:Theweightedaverageprice-to-bookratioforafundisameasurethatquantifiesthevaluationofthefund's holdingsrelativetotheirbookvalues,whileaccountingfortheproportionofeachholdinginthefund'stotalportfolio Itiscalculatedbymultiplyingthe price-to-bookratioofeachindividualholdingbyitsportfolioweight,summingtheseproductsacrossallholdings,andthendividingbythetotalportfolio weight
2025YCharts,Inc AllRightsReserved YCharts,Inc ('YCharts')isnotregisteredwiththeUS SecuritiesandExchangeCommission(orwiththesecuritiesregulatoryauthorityorbodyofanystateoranyotherjurisdiction)asan investmentadviser,broker-dealerorinanyothercapacity,anddoesnotpurporttoprovideinvestmentadviceormakeinvestmentrecommendations
Thisreporthasbeengeneratedusingdatamanuallyinputbythecreatorofthis reportcombinedwithdataandcalculationsfromYChartscomandisintendedsolelytoassistyouoryourinvestmentorotheradviser(s)inconductinginvestmentresearch Youshouldnotconstruethisreportasanoffertobuyor sell,asasolicitationofanoffertobuyorsell,orasarecommendationtobuy,sell,holdortrade,anysecurityorother nancialinstrument THEIMPORTANTDISCLOSURESFOUNDATTHEENDOFTHISREPORT(WHICHINCLUDE DEFINITIONSOFCERTAINTERMSUSEDINTHISREPORT)AREANINTEGRALPARTOFTHISREPORTANDMUSTBEREADINCONJUNCTIONWITHYOURREVIEWOFTHISREPORT Forfurtherinformationregardingyouruseofthis reportpleasegoto:https://getychartscom/disclosure/ May20,2025
Definitions
WeightedAveragePricetoSalesRatio:Theweightedaverageprice-to-salesratioofaportfolioisafinancialmetricthatgaugestheoverallvaluationofthe assetswithinaportfolioinrelationtotheircombinedsalesrevenue Thiscalculationconsidersthemarketvalueofeachasset,assigningmoreinfluenceto largerholdings,andcomputestheaveragevaluationrelativetothetotalsalesgeneratedbyallassets
WeightedMedianReturnonAssets:ReturnonAssets(ROA)measureshowefficientlyacompanyisusingitsassetstogenerateprofits Itindicateshow muchprofitisbeingearnedforeachdollarofassetsowned ItismeasuredasNetIncome/AverageTotalassetsofthelast5quarters WeightedMedian ROAofaportfolioiscalculatedbytakingintoaccountboththeindividualROAofeachinvestmentanditsweightintheoverallportfolio
WeightedMedianReturnonEquity:ReturnonEquity(ROE)isanindicationofhowwellacompanyisusingitsshareholders'moneytogenerateprofits.Itis measuredasNetIncome/AverageTTMShareholder’sEquity.WeightedMedianROEiscalculatedbytakingintoaccountboththeindividualROEofeach investmentanditsweightintheoverallportfolio ItisthemiddlevalueoftheROEsofeachindividualportfolioassetwhenarrangedinascendingorder afterbeingmultipliedbytheirrespectiveweights
YieldtoMaturity:Yieldtomaturityistheinternalrateofreturnearnedwhenbuyingthebondtodayatthemarketprice,assumingthebuyerholdsthebond tomaturity,andallthecouponandprincipalpaymentsaremade.Itisexpressedasanannualizedfigure.YChartscalculatesYieldtoMaturityforbond fundsbyweightingtheremainingcouponandprincipalpaymentsrelativetothesizeoftheportfolio.
2025YCharts,Inc AllRightsReserved YCharts,Inc ('YCharts')isnotregisteredwiththeUS SecuritiesandExchangeCommission(orwiththesecuritiesregulatoryauthorityorbodyofanystateoranyotherjurisdiction)asan investmentadviser,broker-dealerorinanyothercapacity,anddoesnotpurporttoprovideinvestmentadviceormakeinvestmentrecommendations
Thisreporthasbeengeneratedusingdatamanuallyinputbythecreatorofthis reportcombinedwithdataandcalculationsfromYChartscomandisintendedsolelytoassistyouoryourinvestmentorotheradviser(s)inconductinginvestmentresearch Youshouldnotconstruethisreportasanoffertobuyor sell,asasolicitationofanoffertobuyorsell,orasarecommendationtobuy,sell,holdortrade,anysecurityorother nancialinstrument THEIMPORTANTDISCLOSURESFOUNDATTHEENDOFTHISREPORT(WHICHINCLUDE DEFINITIONSOFCERTAINTERMSUSEDINTHISREPORT)AREANINTEGRALPARTOFTHISREPORTANDMUSTBEREADINCONJUNCTIONWITHYOURREVIEWOFTHISREPORT Forfurtherinformationregardingyouruseofthis reportpleasegoto:https://getychartscom/disclosure/
ImportantDisclosure
ThisreportdoesnotreflecttheperformanceofanyaccountactuallymanagedbyyourAdviser Thisissupplementalmaterial,andwhenapplicable, shouldbeaccompaniedbyaprospectusorequivalentdocument
2025YCharts,Inc AllRightsReserved YCharts,Inc ('YCharts')isnotregisteredwiththeUS SecuritiesandExchangeCommission(orwiththesecuritiesregulatoryauthorityorbodyofanystateoranyotherjurisdiction)asan investmentadviser,broker-dealerorinanyothercapacity,anddoesnotpurporttoprovideinvestmentadviceormakeinvestmentrecommendations
Thisreporthasbeengeneratedusingdatamanuallyinputbythecreatorofthis reportcombinedwithdataandcalculationsfromYChartscomandisintendedsolelytoassistyouoryourinvestmentorotheradviser(s)inconductinginvestmentresearch Youshouldnotconstruethisreportasanoffertobuyor sell,asasolicitationofanoffertobuyorsell,orasarecommendationtobuy,sell,holdortrade,anysecurityorother nancialinstrument THEIMPORTANTDISCLOSURESFOUNDATTHEENDOFTHISREPORT(WHICHINCLUDE DEFINITIONSOFCERTAINTERMSUSEDINTHISREPORT)AREANINTEGRALPARTOFTHISREPORTANDMUSTBEREADINCONJUNCTIONWITHYOURREVIEWOFTHISREPORT Forfurtherinformationregardingyouruseofthis reportpleasegoto:https://getychartscom/disclosure/
May20,2025