Dit is WDP
Strategie
ESG
Prestaties 2020
Governance
Jaarrekening
WDP Jaarverslag 2020
69
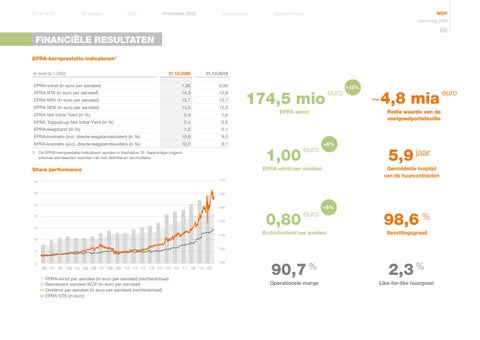
FINANCIËLE RESULTATEN EPRA-kernprestatie-indicatoren1 in euro (x 1.000)
31.12.2020
31.12.2019
EPRA-winst (in euro per aandeel)
1,00
0,93
EPRA NTA (in euro per aandeel)
14,3
12,8
EPRA NRV (in euro per aandeel)
15,7
13,7
EPRA NDV (in euro per aandeel)
13,5
12,2
5,4
5,6
EPRA Net Initial Yield (in %) EPRA Topped-up Net Initial Yield (in %)
5,4
5,6
EPRA-leegstand (in %)
1,5
2,1
EPRA-kostratio (incl. directe leegstandskosten) (in %)
10,6
9,5
EPRA-kostratio (excl. directe leegstandskosten) (in %)
10,2
9,1
1 De EPRA-kernprestatie-indicatoren worden in hoofdstuk 10. Rapportage volgens erkende standaarden voorzien van hun definitie en reconciliatie.
174,5 mio
euro
EPRA-winst
1,00
euro
+8%
30
5,9 jaar Gemiddelde looptijd van de huurcontracten
1.20
35
~4,8 mia Reële waarde van de vastgoedportefeuille
EPRA-winst per aandeel
Share performance
+15%
1.00
25
0.80
20 0.60 15 0.40
0,80
euro
+8%
98,6 %
Brutodividend per aandeel
Bezettingsgraad
90,7 %
2,3 %
Operationele marge
Like-for-like huurgroei
10 0.20
5
0.00
0
’00 ’01 ’02 ’03 ’04 ’05 ’06 ’07 ’08 ’09 ’10 ’11 ’12 ’13 ’14 ’15 ’16 ’17 ’18 ’19 ’20
EPRA-winstper peraandeel aandeel(in (ineuro europer per aandeel) aandeel) (rechterschaal) (rechterschaal) EPRA-winst Beurskoersaandeel aandeelWDP WDP(in (ineuro euro per per aandeel) aandeel) Beurskoers Dividendper peraandeel aandeel(in (ineuro europer peraandeel) aandeel) (rechterschaal) (rechterschaal) Dividend EPRA NAV (in euro) EPRA NTA (in euro)
euro