This is WDP
Strategy
ESG
2020 perfomance
Governance
Financial statements
WDP 2020 Annual Report
91
PROPERTY REPORT
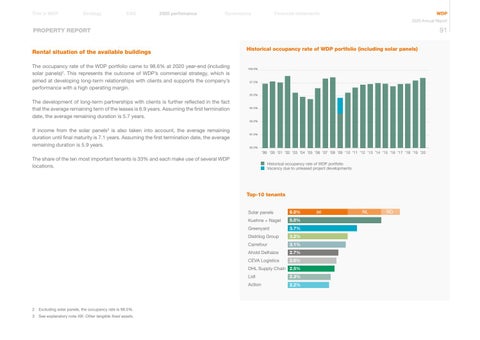
Rental situation of the available buildings The occupancy rate of the WDP portfolio came to 98.6% at 2020 year-end (including solar panels)2. This represents the outcome of WDP’s commercial strategy, which is aimed at developing long-term relationships with clients and supports the company’s performance with a high operating margin.
Historical occupancy rate of WDP portfolio (including solar panels)
100.0%
97.5%
95.0%
The development of long-term partnerships with clients is further reflected in the fact that the average remaining term of the leases is 6.9 years. Assuming the first termination date, the average remaining duration is 5.7 years.
92.5%
90.0%
If income from the solar panels3 is also taken into account, the average remaining duration until final maturity is 7.1 years. Assuming the first termination date, the average remaining duration is 5.9 years.
87.5%
85.0%
’99 ’00 ’01 ’02 ’03 ’04 ’05 ’06 ’07 ’08 ’09 ’10 ’11 ’12 ’13 ’14 ’15 ’16 ’17 ’18 ’19 ’20
The share of the ten most important tenants is 33% and each make use of several WDP locations.
Historical occupancy rate of WDP portfolio Vacancy due to unleased project developments
Top-10 tenants Solar panels
6.0%
Kuehne + Nagel
5.0%
Greenyard
3.7%
Distrilog Group
3.2%
Carrefour
3.1%
Ahold Delhaize
2.7%
CEVA Logistics
2.6%
DHL Supply Chain 2.5%
2 Excluding solar panels, the occupancy rate is 98.5%. 3 See explanatory note XIII. Other tangible fixed assets.
Lidl
2.3%
Action
2.2%
BE
NL
RO