The professional analysis and advice in this report has been prepared by Whirika Consulting Limited for the use of the party or parties to whom it is addressed (the addressee) and for the purposes specified in it. This report is supplied in good faith and reflects the knowledge, expertise and experience of the consultants involved. Whirika Consulting Limited accepts no responsibility whatsoever for any loss occasioned by any person acting or refraining from action as a result of reliance on the report, other than the addressee.
In preparing this report Whirika Consulting Limited has endeavoured to use what it considers the best information available at the date of publication, including information supplied by the addressee. Unless stated otherwise, Whirika Consulting Limited does not guarantee the accuracy of any forecast or prediction in this report.
Document Version History
V1 13 August
V2 17 October
V3 6 January
V4 17 January
V5 10 March
Niki Bould Solis Norton
Niki Bould and Solis Norton Rhys Millar
Niki Bould and Solis Norton Carla Muller
Niki Bould and Solis Norton
Niki Bould
Warren King
Food production data and corresponding appendices added
Client draft for review
Changes made from client review. Added in overview of Hamilton City, Waikato District and Waipā District and changes from 2002 - 2024
Changes made from client review
Minor edits made in Exec summary
Executive Summary
Access to affordable nutritious food plays a critical role in society by improving the health, physical and mental well-being, and productivity of people in the community. As food systems have changed over the decades many improvements have been made to food access, but more improvements could be made.
The Waikato Wellbeing Project is a regional initiative aimed at improving the social, economic, environmental, and cultural wellbeing of the Waikato region in Aotearoa New Zealand. Aligning with the United Nations' Sustainable Development Goals (SDGs), the Waikato Wellbeing Project seeks to create a sustainable future for the region by focusing on long-term outcomes across areas such as health, education, environment, housing, and employment. The project brings together local government, businesses, community organisations, and iwi to collaborate on goals that reflect the community’s values and priorities.
The Waikato Kai Challenge is a part of the Waikato Wellbeing Project and focuses on creating a more sustainable and resilient food system in the Waikato Region. It aims to ensure that everyone in the community has access to healthy, affordable, and locally sourced food, while also addressing food waste, sustainability, and local food production. The Waikato Wellbeing project has commissioned Whirika Consulting (Whirika) to produce a baseline foodshed analysis for the Waikato Region, with a summary of three districts (Hamilton City, Waikato District and Waipā District) and a comparison of changes to food producing land from 2002 to 2024 in the same three districts
A foodshed analysis is a report that provides information on the current estimated amount of food needed to feed the population residing within the study area and compares it to the estimated amount of food produced within the study area. This high-level overview of the relativity between food produced and consumed in a region helps those in the region understand its capacity to produce, process, and distribute food locally, supporting food security, sustainability, and economic development. A foodshed analysis can identify gaps, guide land use and resource management, and inform policies to build a resilient and efficient local food system.
The baseline foodshed analysis for the Waikato Region is based on a methodology developed in the Otago Food Economy Report (Millar et al., 2016). In essence the methodology estimates the amount of a variety of food types consumed in a given area, the food types produced in that area and compares the two using a mass balance. The baseline foodshed analysis for the Waikato Region uses 2024 data from AgriBase® (a product of AsureQuality Limited1) and is informed by current, industry-specific publications. The latter enables assumptions to be made to calculate the amount of food produced in the region that may be exported overseas.
The baseline foodshed analysis for the Waikato Region does not capture where food is sent for processing or for final consumption. It is also important to note that the modelling for the food
1 AgriBase® spatially maps almost every farm in the country. Providing each with its own traceable ID, it holds information on approximately 144,500 live (current) New Zealand rural properties. These include properties involved in livestock farming, arable cropping, horticulture, viticulture, or forestry. Lifestyle blocks and conservation estate are also included in AgriBase®. However, there are limitations with the dataset, see Appendix Two for more details.
production is based on the commercial food economy. The amount of food production within the informal food economy, such as backyard production2 , hunted meat or mahinga kai3 is unknown.
The analysis shows three key results. Firstly, the baseline foodshed analysis for the Waikato Region shows an estimated 300,000 tonnes of food per year (across 10 different food types) is needed to feed the region’s current population of 522,600 people. Secondly, there is a high amount of productive agricultural land. The total area of the Waikato Region is 2.5 million hectares, with 1.4 million hectares being food producing land (57% of overall land area). The analysis shows there is a wide variety of different food types grown in the region, however, there are significant amounts of milk (6.5 million tonnes per year) and red meat (200,000 tonnes per year) produced, which reflects the export-focused nature of Aotearoa New Zealand’s primary production. In the Waikato Regional foodshed, red meat production is 51% of the land use, with cattle for dairy milk production being 46%, all the other food types are under 1% of the food producing land area. Horticultural production is 0.4% of food producing land and produces approximately 200,000 tonnes of fruit, vegetable, nuts and legumes per year Horticulture production, particularly root and above-ground vegetables, demonstrates some of the highest yields per hectare compared to other food categories Chicken meat production has the highest output per hectare, surpassing all other food types
Thirdly, the mass balance between local food production and community needs reveals a surplus of dairy products, red meat, vegetables, and poultry (both meat and eggs), while most other food types show a deficit. Only 4% of the dairy products produced in the Waikato Region are needed to meet local demand, leaving a surplus of 1.6 million tonnes annually. Nationally, 95% of milk4 is exported, meaning the remaining dairy production in the Waikato closely aligns with local consumption needs. Similarly, just 7% of the region's red meat production would be needed to meet local demand, resulting in a surplus of 180,000 tonnes per year. After accounting for the estimated 90–95% of red meat grown for export, the mass balance reaches 1.08, indicating that red meat production is almost equal to regional demand.
Poultry meat, vegetables, and eggs are also produced in surplus, with 14%, 43%, and 21% of current production required for local consumption, respectively. Once export volumes are removed, Waikato produces 5.5 times the poultry meat, 4.4 times the eggs, and 1.5 times the vegetables needed for its population. In contrast, several food types remain in deficit, with grain crops being the most significant, requiring 55,000 tonnes annually while producing none for human consumption.
A high-level analysis of Hamilton City, Waikato District, and Waipā District reveals two distinct patterns of food production and consumption. As the primary urban centre of the Waikato Region, Hamilton City consumes more food than it produces. In contrast, the more rural Waikato and Waipā Districts exhibit higher levels of food production. Waikato District produces a surplus of red meat, dairy, eggs, and vegetables relative to the needs of its current population. In Waipā District, the production of red meat
2 Residents may grow food for their own consumption without selling it commercially
3 Mahinga kai/mahika kai literally means 'to work the food' and relates to the traditional value of food resources and their ecosystems, as well as the practices involved in producing, procuring, and protecting these food resources.
4 Milk tonnages differ from dairy tonnages. Milk is measured as a raw product in tonnes, and dairy is estimated by dividing milk tonnages by four to account for the fact that most dairy products are concentrated forms of milk to varying degrees.
and fruit aligns closely with estimated consumption levels. However, production of all other food types, apart from dairy, falls short of meeting the dietary requirements of the district's population.
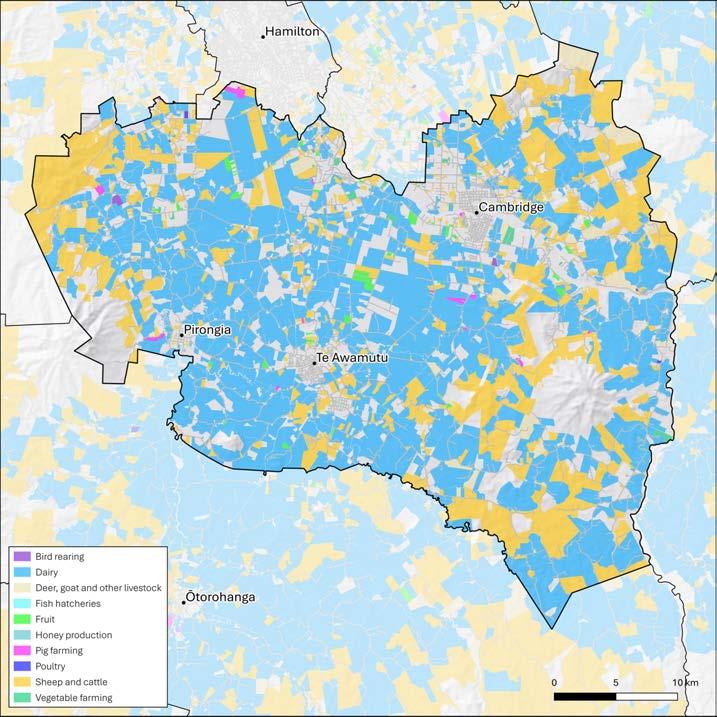
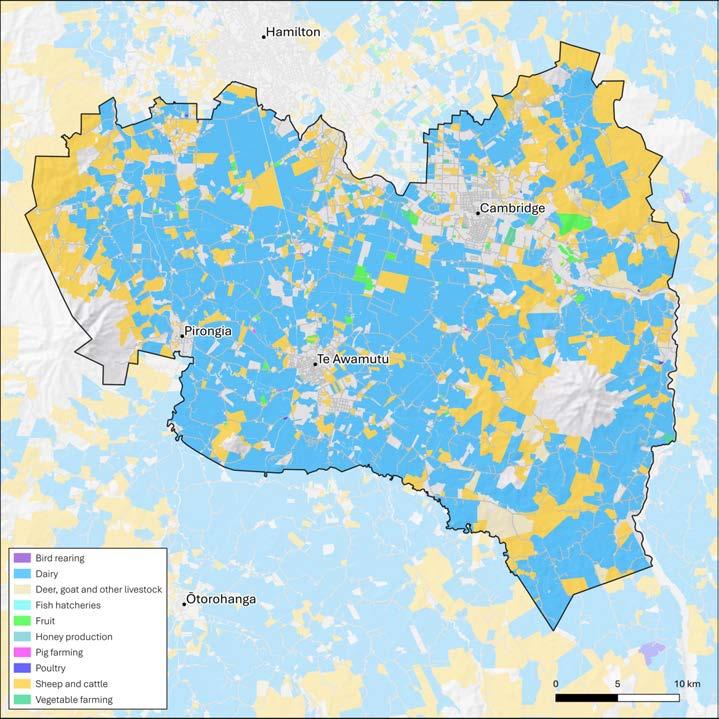
A high-level comparison between maps of food production in the region in 2002 and in 2024 shows the biggest change is the reduction of vegetable and fruit growing land in Hamilton City An increase in dairy, and sheep and cattle farming in the Waikato District and a reduction in pig farming and poultry in Waipā District is also evident
The foodshed analysis highlights a significant overrepresentation of red meat and dairy production; however, after accounting for exports, the Waikato Region’s overall food production closely aligns with local consumption (mass balance: 1.03). A more detailed examination reveals distinct surpluses and deficits, with red meat and dairy production now more balanced, surpluses in poultry, vegetables, and eggs likely redistributed nationwide and deficits in pork, grain crops, legumes, nuts, aquaculture, and fruit. The export of certain foods, such as kiwifruit and aquaculture products, where initial supply was already insufficient, further reduces availability within the region. To achieve the Waikato Kai Challenge’s goal of ensuring healthy, affordable, and locally sourced food for the community, a shift in land use would be required. Given the region’s favourable conditions for primary production, implementing economic and planning incentives could support the transition towards a more diverse and resilient local food system.
Origins of the Report
At the beginning of 2024, Whirika Consulting Ltd was contracted by Waikato Wellbeing Project to undertake a baseline foodshed analysis for the Waikato Region, a short summary of the baseline foodshed analysis for Hamilton City, Waikato District and Waipā District and a comparison of changes to food producing land from 2002 to 2024 for the same three districts. Waikato Wellbeing Project contracted Whirika Consulting’s Dr. Niki Bould as the researcher to undertake this research with support from Waikato Kai Challenge advisory group. Dr. Bould worked with Dr. Norton and other colleagues within Whirika to calculate the foodshed. Enquiries about the research can be directed to niki.bould@whirika.co.nz.
Structure of the Report
The report is organised into four key sections to provide a comprehensive baseline foodshed analysis of the Waikato Region.
Section 1 introduces the concept of the Waikato Regional Foodshed and defines the geographic scope of the study.
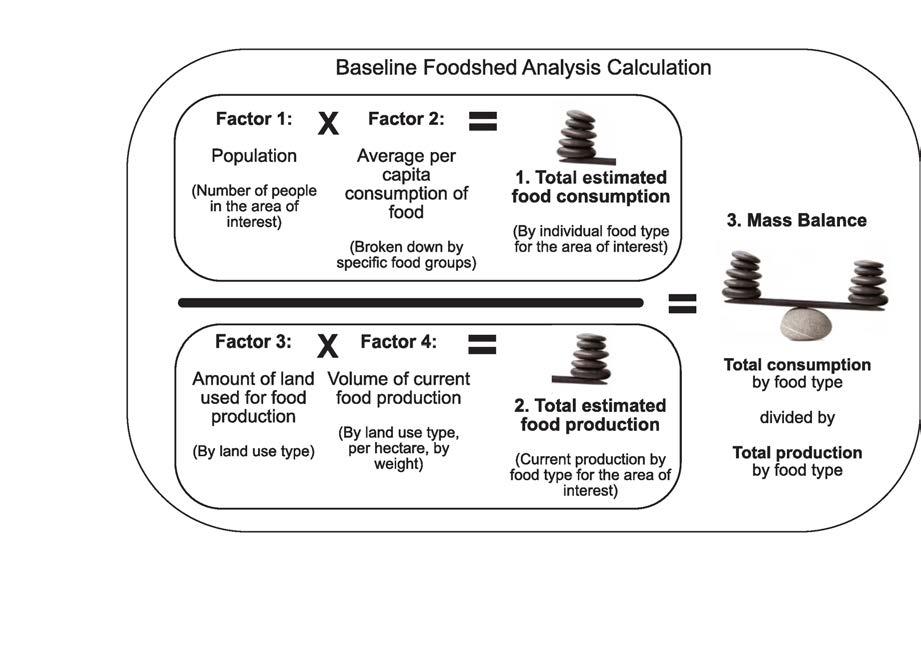
Section 2 provides a comprehensive baseline foodshed analysis for the Waikato Region, evaluating the balance between food consumption and production. It is divided into three key parts: total estimated food consumption (calculated by multiplying population size by average per capita consumption), total estimated food production (determined by multiplying the amount of food-producing land by current production volumes), and a mass balance comparison to assess overall self-sufficiency, as shown in the diagram in Figure 1
provides a foundational understanding of the Waikato Region’s baseline regional self-sufficiency.
Section 3 focuses on Hamilton City, Waikato District, and Waipā District, applying the same foodshed analysis framework at a more localised level. It estimates food consumption and production for each district, providing insights into their individual contributions to the regional foodshed.
Section 4 examines changes in food-producing land from 2002 to 2024 within Hamilton City, Waikato District, and Waipā District, highlighting potential shifts in agricultural land use over time.
The appendices are provided to explain (1) the detailed methodology for how the baseline foodshed analysis is calculated, explaining data sources, assumptions and limitations of data related to the four factors, and (2) the GIS-based spatial evaluation of land use, including data specifications, farm classifications, and dataset limitations.
Glossary of Terms
Food Group: A food group comprises foods with similar nutritional properties or biological classifications. Nutrition guides commonly categorise foods into distinct groups, for example, Aotearoa New Zealand Ministry of Health (MOH) discusses five key food groups (vegetables, fruits, proteins, grains, and milk products).
Foodshed: A ‘foodshed’ is a defined geographic area (within this report the “Waikato Regional foodshed” is referred to). However, the term foodshed is also used to describe the food that is produced and consumed within that specific geographic area and to indicate what potential that specific geographic area has in order to meet the food needs of its population.
Food System: A food system is the processes and infrastructure involved in feeding a population, for example growing, harvesting, processing, packaging, transporting, marketing, retailing, and disposal.
Food Type: For the purposes of the research, a food type is a way to describe specific foods categorised within a food group. For example, meat or red meat, poultry meat, pork meat and fish are all food types that are part of the protein food group.
Local Food: Raw food (fruit, vegetables, meat, eggs, milk, fish) that is produced or grown close to the place where it is sold, and is lightly processed food (sausages, pies, drinks, jams, chutneys, dairy produce, and baked goods) where the main ingredient is supplied from nearby. Within this report, local food means raw food and lightly processed food grown and processed within the Waikato Region.
Local Food Economy: Local food economies encompass the economic and social systems involved in growing, processing, distributing, and consuming food within a specific locality.
Acronyms
FAO: Food and Agriculture Organisation
FAOSTAT: United Nations Food and Agriculture Organisation Statistical Database
MOH: Ministry of Health
MPI: Ministry for Primary Industries
OECD: Organisation for Economic Co-operation Development
SDGs: United Nations' Sustainable Development Goals
TA: Territorial Authority
TDS: Total Diet Study
1 The Waikato Regional Foodshed
1.1 Introduction
Access to affordable, nutritious, and healthy food is essential for supporting the health, well-being, and productivity of individuals within a community. While significant improvements have been made to food systems over the years, further progress is still possible. Local food economies, which encompass the processes of growing, processing, distributing, and consuming food within a specific area, play a crucial role in strengthening these systems. Research shows that through collaborative efforts, local food economies can foster community cohesion and enhance consumer understanding of food and farming practices (Millar, et al. 2016). This, in turn, has the potential to bridge social divides between Aotearoa New Zealand’s rural and urban populations.
The Waikato Kai Challenge, part of the Waikato Wellbeing Project, focuses on creating a more sustainable and resilient food system in the Waikato region. The initiative aims to ensure that all members of the community have access to healthy, affordable, and locally sourced food, while also addressing issues related to food waste, sustainability, and local food production. To support the goals of the Waikato Kai Challenge, the Waikato Wellbeing Project has requested a baseline foodshed analysis for the Waikato Region
A baseline foodshed analysis is the first step in understanding a local food economy. A foodshed assesses what is currently grown in a region compared to the food required to meet the needs of its population. This report focuses on this initial analysis.
The second step in understanding a local food economy is to examine the food system itself, exploring how food moves into and out of the region. The third step involves interpreting the findings from both the foodshed and food system analyses to understand their implications for the region. These aspects are not covered in this report.
Additionally, the Waikato Wellbeing Project has requested a summary of the baseline foodshed analysis for the three districts of Hamilton City, Waikato District, and Waipā District. This includes comparing changes in food-producing land from 2002 to 2024 across these districts. The following report presents the foodshed analysis for the Waikato Region, along with the requested deliverables.
1.2 Defining a Boundary for the Research: The Waikato Regional Foodshed
A foodshed is a defined area, often described by either geographic features, district or regional boundaries. The aim is to define an area for research purposes. Once defined, it provides a reference that encompasses sources of food grown in the area as well as the number of people residing in the same area.
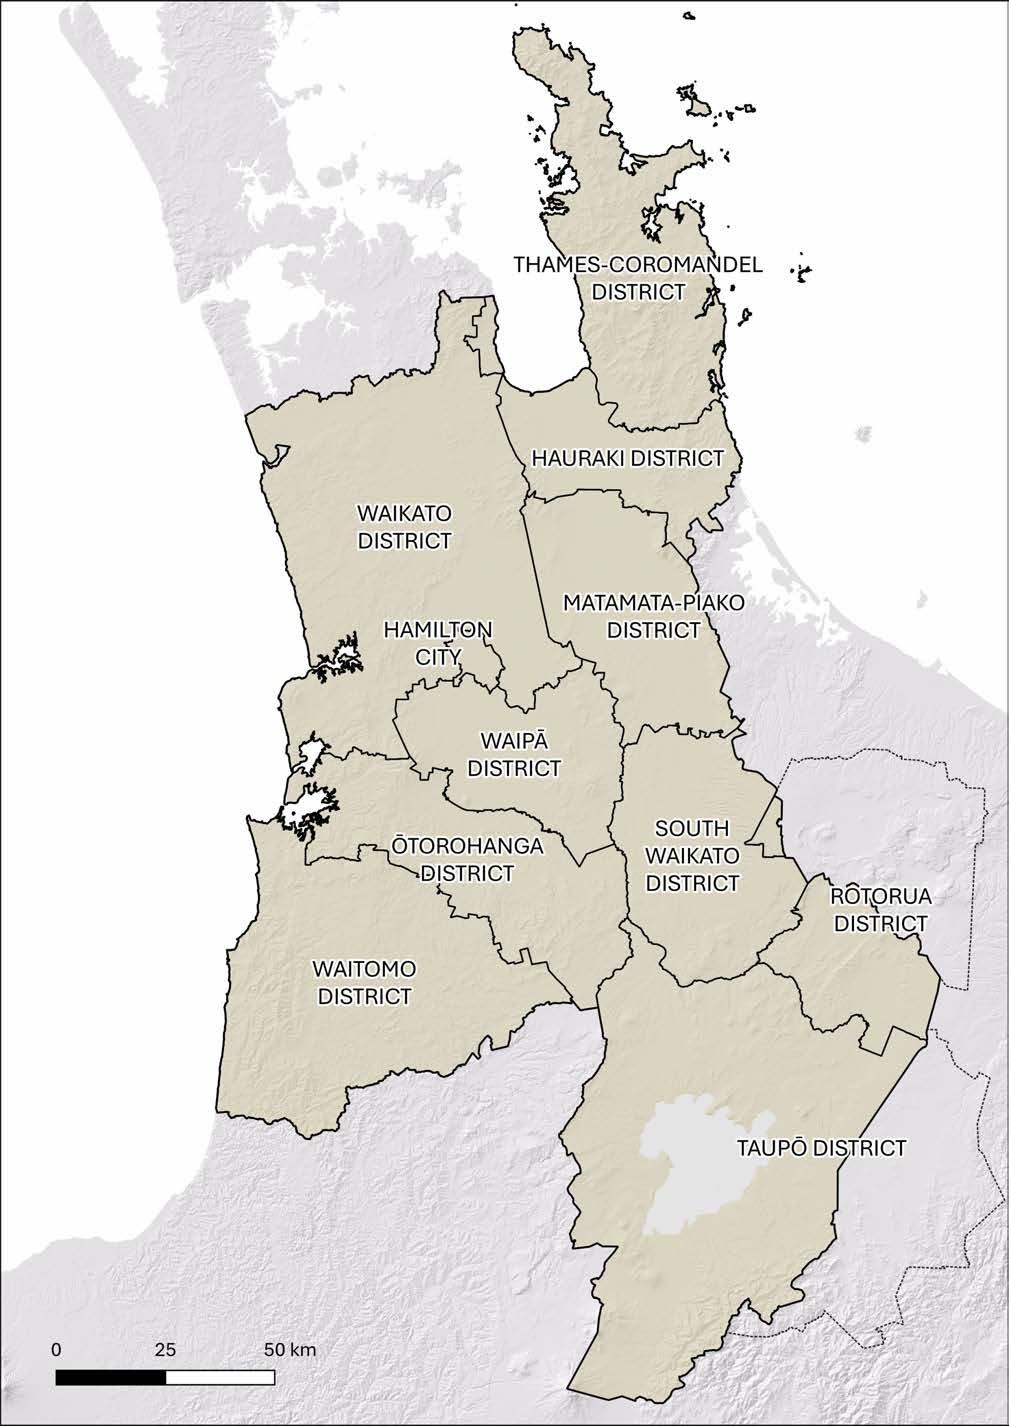
For the Waikato Wellbeing Project, the foodshed is defined as the Waikato Region, encompassing eleven Territorial Authorities as shown in the map in Figure 2.
fit the regional boundary)
Figure 2: Map showing the Waikato Regional foodshed and each Territorial Authority (adjusted to
If the area is calculated by each of the eleven Territorial Authorities of the Waikato Region, then the land area is 2.7 million hectares.
According to New Zealand Statistics (StatsNZ 2023) the total land area of the Waikato Region is 2.47 million hectares (Table 1). The difference is due to Rotorua District and Taupō District, which sit between Waikato Region and other neighbouring regions (see the dotted line in the map in Figure 2 showing Rotorua and Taupō Districts sitting across other regional boundaires). Once the land area is adjusted to represent just the Waikato Region, then the land area is 2.47 million hectares.
Table 1: Land area by Territorial Authority within the Waikato Region (StatsNZ)
Territorial Authority
Total area in hectares (ha)
From StatsNZ (Total district land area)
Rotorua District and Taupō District adjusted for Waikato Regional boundary (ordered by size from largest to smallest)
Figure 2 (page 2) and Table 1 shows the 2,471,34- hectare land area of the Waikato Regional foodshed, split into the eleven Territorial Authorities.
Taupō District remains the largest of the districts by land area once adjusted to fit the regional boundary. Rotorua District becomes the second smallest district by land area, being approximately 27,000 hectares smaller than Hauraki District and nearly 88,000 hectares larger than the smallest of the Territorial Authorities, Hamilton City.
2 Completing a Baseline Foodshed Analysis for the Waikato Region
Analysis of the foodshed requires an understanding of the mass balance of each food type consumed within the Waikato Region. Determining the mass balance shows whether there is surplus, or deficit of specific food types currently grown within the region. There are four factors, under two headings, that equal the mass balance equation, shown in Figure 3
consumption of food provides one part existing land use and food production that is occurring within the Waikato Region provides an estimate of what food is being produced in the area per year and is the second part of the equation The equation provides a number that shows the surplus or deficit of each food type. More details regarding the methodology for the baseline foodshed analysis can be found in Appendix One: Methodology of the Baseline Foodshed Analysis and Appendix Two: GIS Spatial Evaluation of Land Use
The following sections explore the four main factors, in two parts: “Total Estimated Food Consumption” and “Total Estimated Food Production”.
2.1 Total Estimated Food Consumption
The first two factors to address when considering the likely total estimated food consumption within the Waikato Region are the size of the population, and the population’s estimated average food consumption (see Appendix One: Methodology of the Baseline Foodshed Analysis for full details of how estimated average food consumption is calculated).
2.1.1 Factor I: Population of Waikato Region
According to New Zealand Statistics (2023) in the Waikato Region the population is estimated to be 522,6005, however, across the eleven Territorial Authorities the population is estimated to be 597,120 6 , a difference of 74,520. Rotorua District and Taupō District are split across the Waikato Regional boundary and others. Information gathered from the Waikato Regional Council indicates that there is only a relatively sparsely populated part of the Rotorua District in the Waikato Region. Furthermore, the part of Taupō District that is outside the region is relatively unpopulated, meaning the population for Taupō District stays the same Advice from the Waikato Regional Council states that the sum of all the other Territorial Authorities should be close to the regional figure. Meaning, once Rotorua District is removed the difference is 3,680, therefore this amount of the population is estimated as residing in the part of Rotorua District that is in the Waikato Region (Table 2).
Table 2: Population estimate data from Territorial Authorities in the Waikato Region (Infoshare at StatsNZ 20237)
Territorial Authority
Population estimates at 30 June 2023
Calculated for each district Rotorua district population adjusted for sparsely populated part of the Rotorua District in Waikato Region (highest to lowest)
The estimated resident population is based on the Census resident population count. It is adjusted for residents missed or counted more than once by the census (net Census undercount); residents temporarily overseas on Census night; and births, deaths, and net migration between Census night and the date of the estimate. The table shows that Hamilton City is by far the largest of the Territorial
5 Estimated Resident Population for Regional Council Areas, at 30 June (1996+) (Annual-Jun)
6 Estimated Resident Population for Territorial Authority Areas, at 30 June(1996+) (Annual-Jun)
Authorities in terms of population, the second largest is the Waikato District (less than half the population of Hamilton City).
If the population is broken down into children, adults and older people (based on children and older people eating less than the average adult), there are slightly more young males (0-14 years) than young females, and there are slightly more females aged over 70+ years, (Figure 4).
Population of Waikato region by age and gender
Female Male
4: StatsNZ 30 June 2023 population data breakdown of gender and age
The population data can be broken down further to show gender and age across each of the eleven Territorial Authorities (adjusted for Waikato regional boundary) (shown in Figure 5) and is used for calculating the estimated food consumption
Population by gender across districts, adjusted for Waikato Region
Girls: 0-14 years
Males: 15-69 years
Boys: 0-14 years Females: 15-69 years
Figure 5: StatsNZ 30 June 2023 population data breakdown of gender and age across the eleven Territorial Authorities, from highest to lowest
Figure
Notably, Figure 5 shows Hamilton City has a significantly larger population compared to the other ten districts, and highlights this is where most of the adult residents reside.
Table 3: Population density for Waikato Region
km2) highest to
Table 3 shows the population density of each of the districts within the Waikato Region, which is illustrated in the graph in Figure 6 and shows population compared to the land area.
Figure 6: Population density (population from largest to smallest compared to land area) in Waikato Region
Figure 6 shows that Taupō District has far more land area than all of the other districts and fourth largest population (23% of Hamilton City population), meaning they have eight people per km2. However, Waitomo District has the fewest people per km2 at three people.
Hamilton City has significantly more people than land area (1,679 people per km2) and Waikato District (second largest populated area) has the second largest land area. Waipā District has the second largest density at 42 people per km2, after Hamilton City.
2.1.2 Estimating Food Consumption for an Average Person
Determining average food consumption considers several sources of information:
• Recent research on food trends including:
o Kantar Better Futures Report (2020 and 2022).
o New Zealand Adult Nutrition Survey data (2008/09).
o Beef + Lamb statistics on meat consumption (2020).
o OECD-FAO Agricultural Outlook (2020)
• FAOSTAT estimated national food supply figures for Aotearoa New Zealand (2020).
• Ministry of Health’s (MOH) recommended average food consumption (2020).
• Ministry of Primary Industries (MPI) New Zealand Total Diet Study (2016).
These are summarised below and explained in detail in Appendix One: Methodology of the Baseline Foodshed Analysis
Research on recent food trends
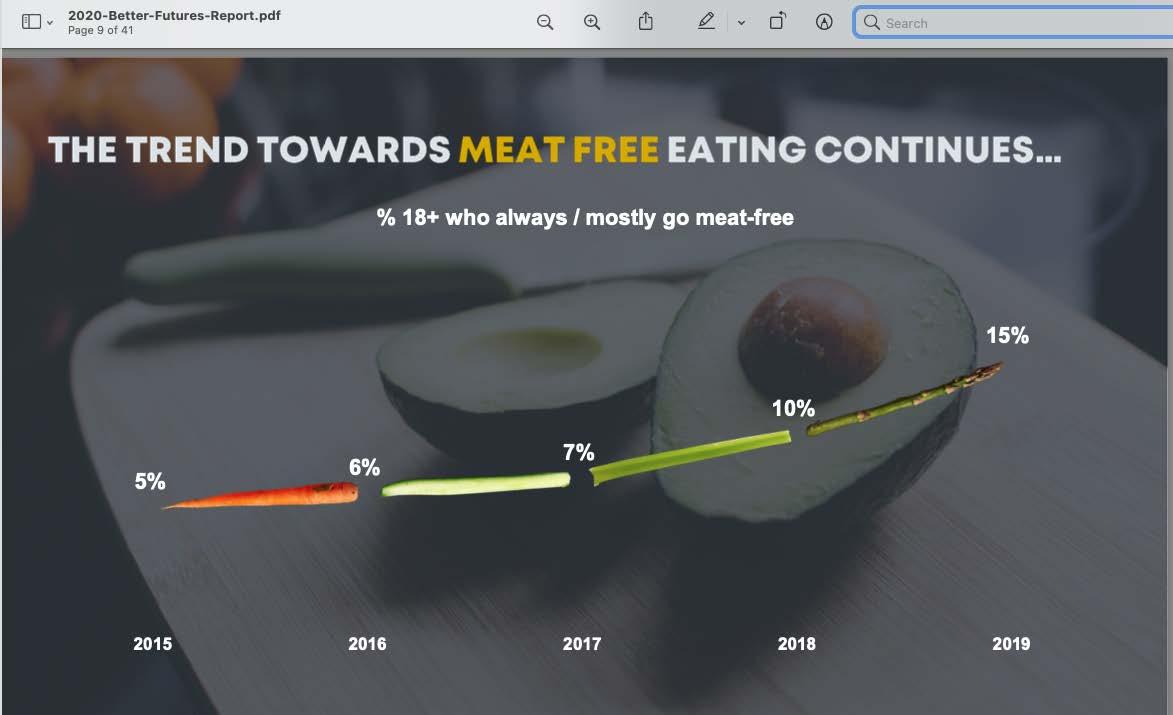
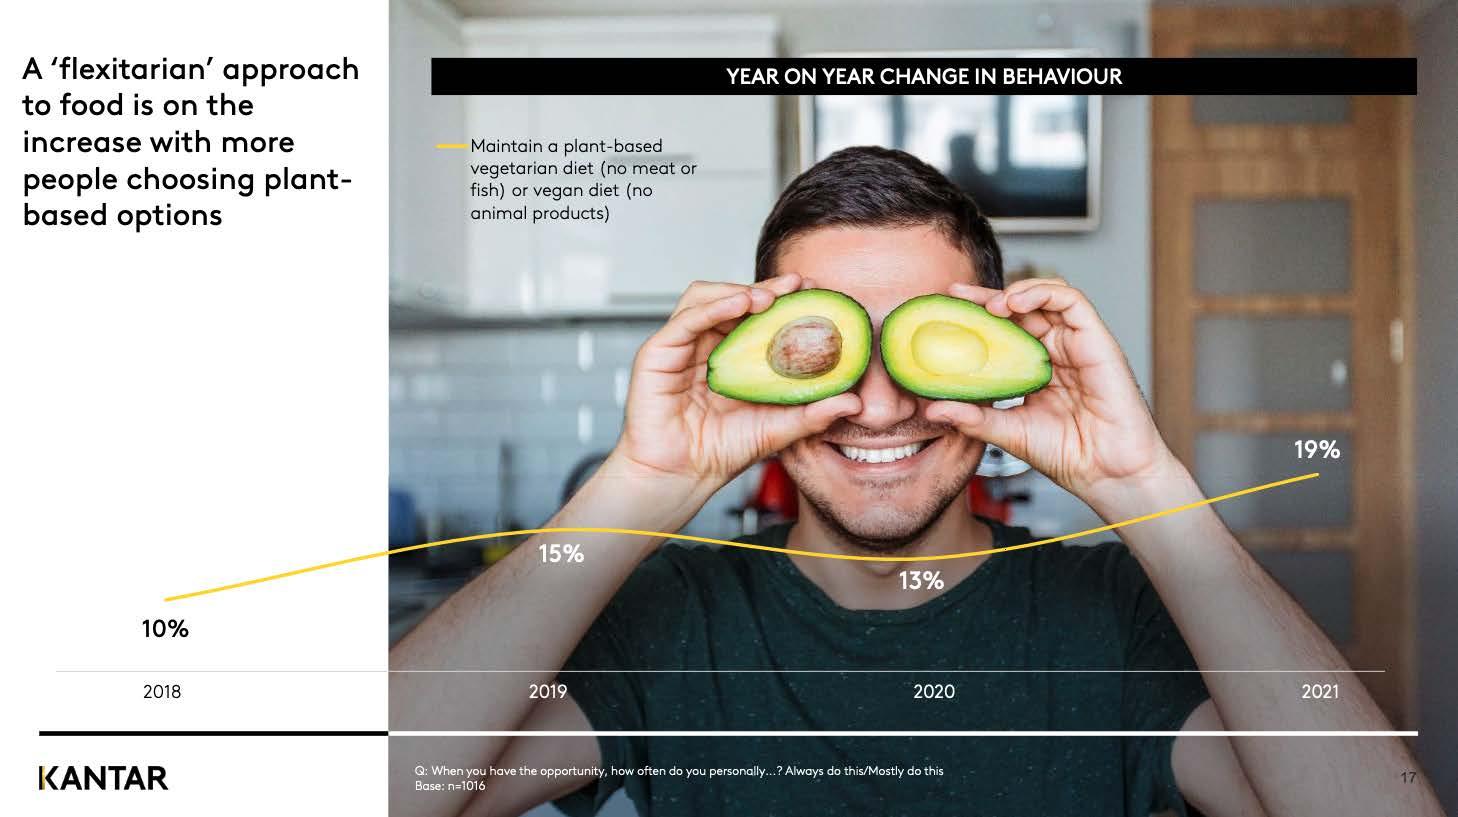
Recent food trend reports, such as Kantar’s Better Futures Reports (2020 & 2022), indicate a growing shift towards vegetarianism, veganism, and flexitarian diets in Aotearoa New Zealand. The 2020 report noted an increase in meat-free eating from 5% in 2015 to 15% in 2019, while the 2022 report found that 19% of respondents self-identified as vegetarian or vegan. However, nutritional researchers in Aotearoa New Zealand (Greenwell, et al. 2023) suggest that these self-reported figures may not align with stricter definitions of vegetarianism, as 93% of New Zealanders still consume red meat, with only 2% classified as true vegetarians and 0.7% as true vegans. This discrepancy highlights the complexity of selfidentification versus actual dietary behaviour
Historical dietary data further emphasise the continued significance of meat in the Aotearoa New Zealand diet. The New Zealand Adult Nutrition Survey (last complete in 2008/09) found that 94.5% of adults had consumed red meat in the four weeks prior to the survey, with Beef + Lamb NZ (2020) reporting an average weekly intake of 400 grams of beef and lamb at that time. The more recent OECD-FAO Agricultural Outlook8 (2020) estimate annual per capita consumption at 3.4 kg of sheep meat and 11.5 kg of beef, translating to approximately 284 grams per week. These findings suggest that while plantbased eating is gaining attention, red meat remains a central component of most New Zealanders’ diets.
FAOSTAT average food consumption
FAOSTAT, the global Food and Agriculture Organisation’s statistical database, provides long-term food consumption data for 245 countries, including Aotearoa New Zealand. The Otago Food Economy report (Millar, et al. 2016) used FAOSTAT data to estimate food consumption in Dunedin and Wānaka, utilising national food supply figures expressed in kilograms per capita per year. While FAOSTAT is a valuable resource, it has limitations, such as including food consumed by tourists while excluding home grown,
8 The OECD-FAO Agricultural Outlook 2020-2029 is a collaborative effort of the Organisation for Economic Co-operation Development (OECD) and the Food and Agriculture Organisation (FAO) of the United Nations, incorporating expertise from collaborating member countries and international commodity organisations. It provides market projections for national, regional, and global supply and demand of major agricultural commodities, biofuel and fish.
mahinga kai 9 , or hunted food, potentially underestimating actual consumption. Despite these gaps, FAOSTAT remains a preferred dataset due to its raw, loss-adjusted primary weights, making it useful for foodshed calculations.
In the Waikato Regional foodshed analysis, food supply data from 2012 to 2020 10 is examined and explained in detail in Appendix One, for ease a graph summarising that data is shown in Figure 7.
Aotearoa New Zealand Food supply quantity comparison of data from 2012 to 2020
Figure 7 shows a general decline in red meat consumption, from 45 kg per capita in 2012 to 32 kg in 2020, with a temporary spike in 2016. Overall meat consumption also declined by about 10% over the period, while egg consumption increased from 9 kg to 12 kg per capita. Dairy consumption fluctuated, peaking at 164 kg per capita in 2013 before dropping to 115 kg in 2020. Interestingly, vegetable and fruit consumption also declined, contradicting the trend of decreasing meat intake. The dataset also tracks grains, legumes, nuts, and seeds, which remained relatively stable.
FAOSTAT includes categories like beverages and non-essential foods (not shown), but these are excluded from foodshed calculations due to their minimal impact on staple food availability. For the remainder of the report, the FAOSTAT 2019 dataset is used as the closest available dataset by date to time of writing of the report, but also to avoid any potential COVID-19 disruptions (such as may be seen in 2020).
According to FAOSTAT 2019 data, the estimated food supply quantity per person is 615 kg covering various food types, with dairy comprising multiple products, including milk, cheese, and butter, as shown in Figure 8.
9 The traditional (in Māori culture) way of gathering, protecting and processing a wide variety of food
10 FAOSTAT 2021-2024 datasets were not published at the time of researching
Figure 7: FAOSTAT data from 2012 to 2020
nuts, seeds
FAOSTAT Aotearoa New Zealand Food supply quantity data 2019
8: FAOSTAT for 2019, showing estimated food supply quantity for Aotearoa New Zealand Ministry of Health recommended average food consumption
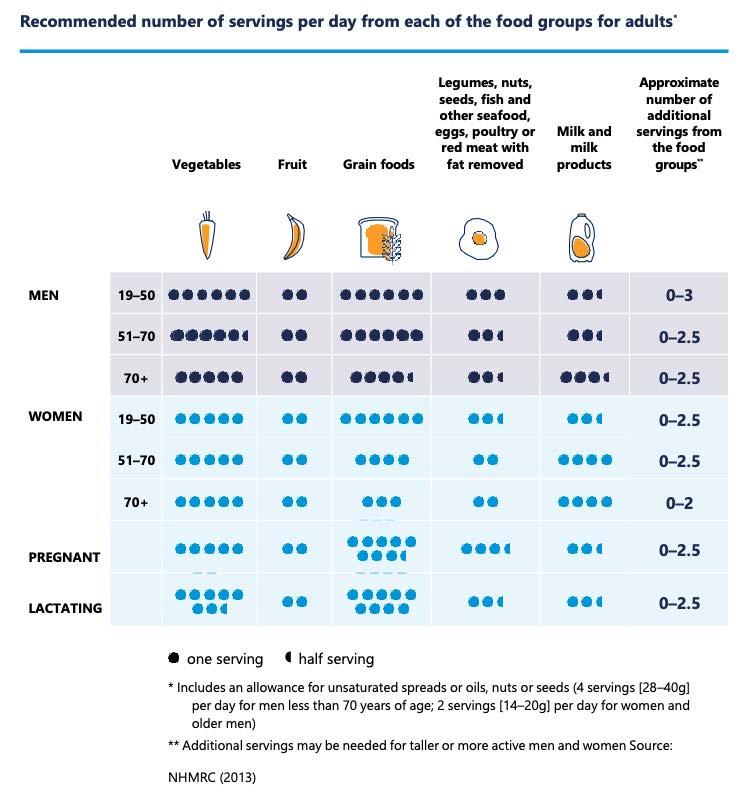
The Aotearoa New Zealand Ministry of Health (MOH) provides dietary recommendations in its Eating and Activity Guidelines for New Zealand Adults (2020), which outline serving sizes for different food groups based on age and gender. Unlike FAOSTAT data, which reflects actual food supply, MOH guidelines represent ideal dietary intake. Dairy recommendations focus on low- or reduced-fat options, including milk, yogurt, and cheese, but exclude high-fat dairy products like butter and cream, which are included in FAOSTAT figures. The protein group encompasses nuts, seeds, legumes, fish, eggs, and various meats. MOH guidance also specifies variations by demographic groups, such as higher dairy intake for women over 50 to support bone health, and reduced grain consumption for people over 70. To facilitate comparisons with population data, four key age groups are identified: tamariki (0-14 years), wahine (1569 years), tāne (15-69 years), and kaumātua/kuia (70+ years) and is shown in Figure 9 (see Appendix One for further methodology and detailed explanation).
genders
Based on MOH recommendations, estimated annual food consumption varies by age and gender, with tamariki consuming 463-519 kg per year, wahine 589-668 kg, tāne 594-705 kg, and kaumātua/kuia 598670 kg. These figures account for additional servings suggested for each group, which can alter total intake by 11-16%. In summary, it is estimated that average food consumption based on the MOH recommended diet ranges from 463 kg per year (for children) to 705 kg per year for adult males.
Overall, dietary patterns remain relatively consistent across groups, except for increased dairy intake in adult females and older adults, and reduced grain consumption for seniors. These guidelines provide a
Figure
Figure 9: Approximate percentage of different food groups required for all people across different ages and
framework for assessing dietary needs but differ from actual food supply figures used in other datasets like FAOSTAT.
Ministry of Primary Industries Total Diet Study
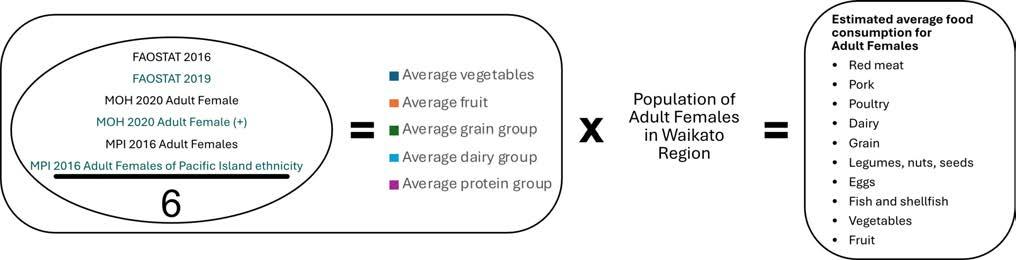
A Total Diet Study (TDS) is an extensive project designed to analyse dietary intake and exposure to various chemicals across a population’s food consumption. It is globally recognised as a reliable and costeffective method for estimating dietary exposure, while also allowing flexibility to address risks specific to the country conducting the study. The research provides per capita estimates of the total diet, detailed in an appendix, with food types categorised by grams consumed per person, differentiated by gender.
Using the Ministry of Primary Industries (MPI) 2016 TDS, data is categorised into the same broad food types used by FAOSTAT, thereby providing a comparative dataset. MPI TDS data is sorted by the following groups of people, Adult Females, Adult Females of Pacific Island ethnicity, Adult Males, Adult Males of Pacific Island ethnicity and Young Adult Males The graph in Figure 10 shows adult diets for the groups listed above.
The graph in Figure 10 shows a range of different consumption patterns across five groups of people Young adult males and adult males of Pacific Island ethnicity consume more food than the other groups.
Overall, the annual amount consumed per person shows 438 kg for adult females to 639 kg for young adult males.
Comparing FAOSTAT, MOH and MPI datasets
To compare key aspects of datasets, the food types are merged into food groups (as defined by MOH). The following graphs show a comparison of the three datasets with respect to wahine / adult females (Figure 11) and to tāne / adult males (Figure 12). When comparing these datasets, it is important to remember that MOH is a recommended diet.
Figure 10: Ministry of Primary Industries New Zealand Total Diet Study (MPI TDS 2016)
MPI 2016 Total Diet Study (TDS) Adult
Wahine / Adult Females across all datasets
MPI 2016 Adult Females
FAOSTAT 2016
MOH 2020 Adult Female
MPI 2016 Adult Females of Pacific Island ethnicity
FAOSTAT 2019
MOH 2020 Adult Female (+)
Figure 11: Three datasets compared across the years 2016-2020 for Wahine / Adult Females only
Figure 11 highlights variations in food group consumption for wahine (adult females) across the three datasets. MPI data indicates lower consumption of vegetables and dairy, while FAOSTAT figures generally fall between the other two datasets, except for protein, where it reports the highest intake per person per year. The MOH data recommends a higher intake of both fruit and dairy. However, it's important to note that the MOH dataset excludes high-fat dairy products such as full-fat milk, yogurt, cream, and butter, whereas both MPI and FAOSTAT do not differentiate between full-fat and low-fat dairy products.
Tāne / Adult Males across all datasets
MPI 2016 Adult Males
MPI 2016 Young Adult Males
FAOSTAT 2019
MOH 2020 Adult Man (+)
MPI 2016 Adult Males of Pacific Island ethnicity
FAOSTAT 2016
MOH 2020 Adult Man
Figure 12: Three datasets compared across the years 2016-2020 for Tāne / Adult Males only
The first three bars of the graph (Figure 12) are for adult males from the MPI study (and includes young adult males). The MPI data has less vegetables than both the FAOSTAT and MOH recommended diet, more fruit than FAOSTAT but less than MOH recommendations, and significantly more grain than FAOSTAT and MOH advise. The MOH dataset includes more dairy than both the MPI and FAOSTAT data.
2.1.3 Factor II: Estimated Food Consumption for an Average Person in the Waikato Region
Based on the methodology detailed in Appendix One, the estimated food consumption for an “average person” in the Waikato Region is defined, as shown in Figure 13.
Estimated food consumption for an average person based in Waikato Region
per person per year
13: Waikato Region estimated average food consumption across food types (in kg per person per year)
The Waikato Region’s average food consumption model incorporates meat (red meat, pork and chicken meat), so is more in line with average omnivore food consumption (as opposed to only plant-based proteins). Using this approach considers variations in dietary preferences, acknowledging that some individuals may not consume meat while others may consume more than the recommend amounts. Overall, the Waikato Regional foodshed’s average food consumption for a year for an average person, is estimated as 566 kg.
2.1.4 Factor I x Factor II = Total Estimated Consumption
Based on an estimated 522,600 people living in the Waikato Region (Factor i), it is estimated that 300,000 tonnes of food are consumed every year (calculated from Factor ii). This number represents the estimated total amount of food that needs to be produced to feed the population every year.
Table 4 shows the Waikato Regional foodshed’s total estimated food consumption by food type per capita per year (left column) and total food needs for the foodshed population in tonnes per year (right column). Due to rounding, some figures may not sum precisely.
Figure
Table 4: Waikato Regional foodshed consumption estimates, by food type
Red meat Pork
Poultry
Dairy Grain Legumes, nuts, seeds Eggs Fish and shellfish
2.2 Total Estimated Food Production
The two remaining factors to consider in the mass balance of food within the Waikato Region are current land use and the food produced on that land (detailed in Appendices One and Two). This information is sourced from the AgriBase® dataset (AgriBase® data is a product of AsureQuality Limited), which offers the most comprehensive overview of land use by farm type across various primary production sectors in Aotearoa New Zealand. Additionally, data and advice from industry bodies (e.g., dairy or poultry sectors) help refine this overview with the most up-to-date and accurate information available, including personal communications
2.2.1 Factor III: Land Use Analysis
High level overview of data from AgriBase® dataset
Using the AgriBase® dataset, the Waikato Region is mapped and classified into main land use types including food production. Non-productive uses or unconfirmed and urban areas are also classified. Table 5 provides detail about the number of farms associated with each land use, the area of land use, and the total land area of the Waikato Region.
Table 5: Land use in in the Waikato Region from AgriBase® dataset (details for each type included in appendix two 6.1.2)
Land use types are directly from AgriBase® data, but some have been grouped together for ease of reading (e.g. DAI – Dairy Cattle Farming + DRY – Dairy Dry Stock are combined as both are required for rearing dairy cattle). “Non-food production uses” includes sawmills, showgrounds, flowers, hop growing, sports grounds, and tourism (i.e. camping ground, motel), etc. Poultry farming is meat and eggs. The farm type “ARA – Arable” is assumed to produce feed for animal consumption only as there is no evidence grains for human consumption are grown in the Waikato Region, therefore it is included in the calculations for animal rearing (food production) but not included in arable land for growing grain crops for human consumption.
The results in Table 5 are a high-level analysis of the land identified through the AgriBase® dataset and should be considered indicative rather than definitive due to underlying limitations in the data explained in Appendix Two.
In summary, at 2.47 million hectares, the land area of the Waikato Region represents approximately 9% of the area of Aotearoa New Zealand. Of this, 1.4 million hectares (57%) is used for food production while urban areas, waterbodies, road reserves, native bush, plantation forestry, and non-food production uses account for the other 1.1 million hectares.
Figure 14 provides a graphical breakdown of all the land use (listed in Table 5 above) across the Waikato Region. 13% is urban areas, waterways, road reserves, etc. 12% is native bush, 10% is forestry and 2% is lifestyle blocks (which could be small scale sheep and beef production, but also various other uses, such as horses or native forest restoration or unused). The remaining 6% is idle farmland, non-food production uses (golf clubs, saleyards, cold store, mines), non-productive animals, viticulture or of unknown use (classified as ‘unconfirmed area’).
Unconfirmed area (new record, unspecified), Viticulture, 0.00% Urban areas, waterways, road reserves, etc, 12.74%
Forestry, 10.32% Lifestyle use, 1.60%
Native bush, 12.36%
Non-food production uses, 0.36%
Non-productive animals, 0.33%
Not farmed (idle), 4.69%
Food producing land, 56.92%
Figure 14: All land use type and percentage of area in the Waikato Region
Figure 14 shows over half of the land is used for food production.
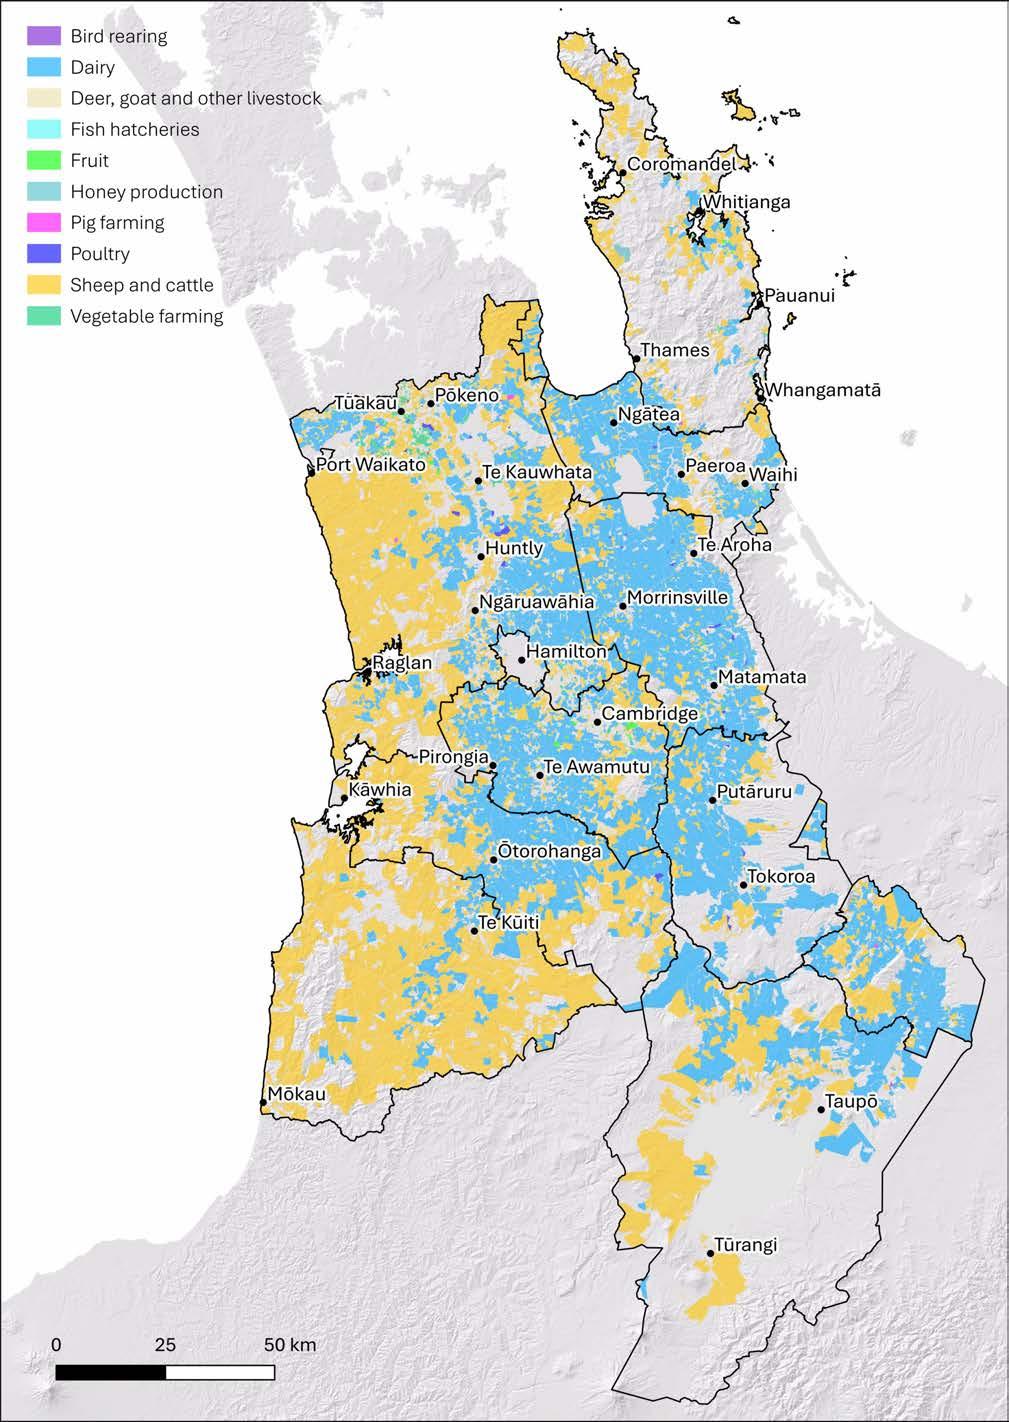
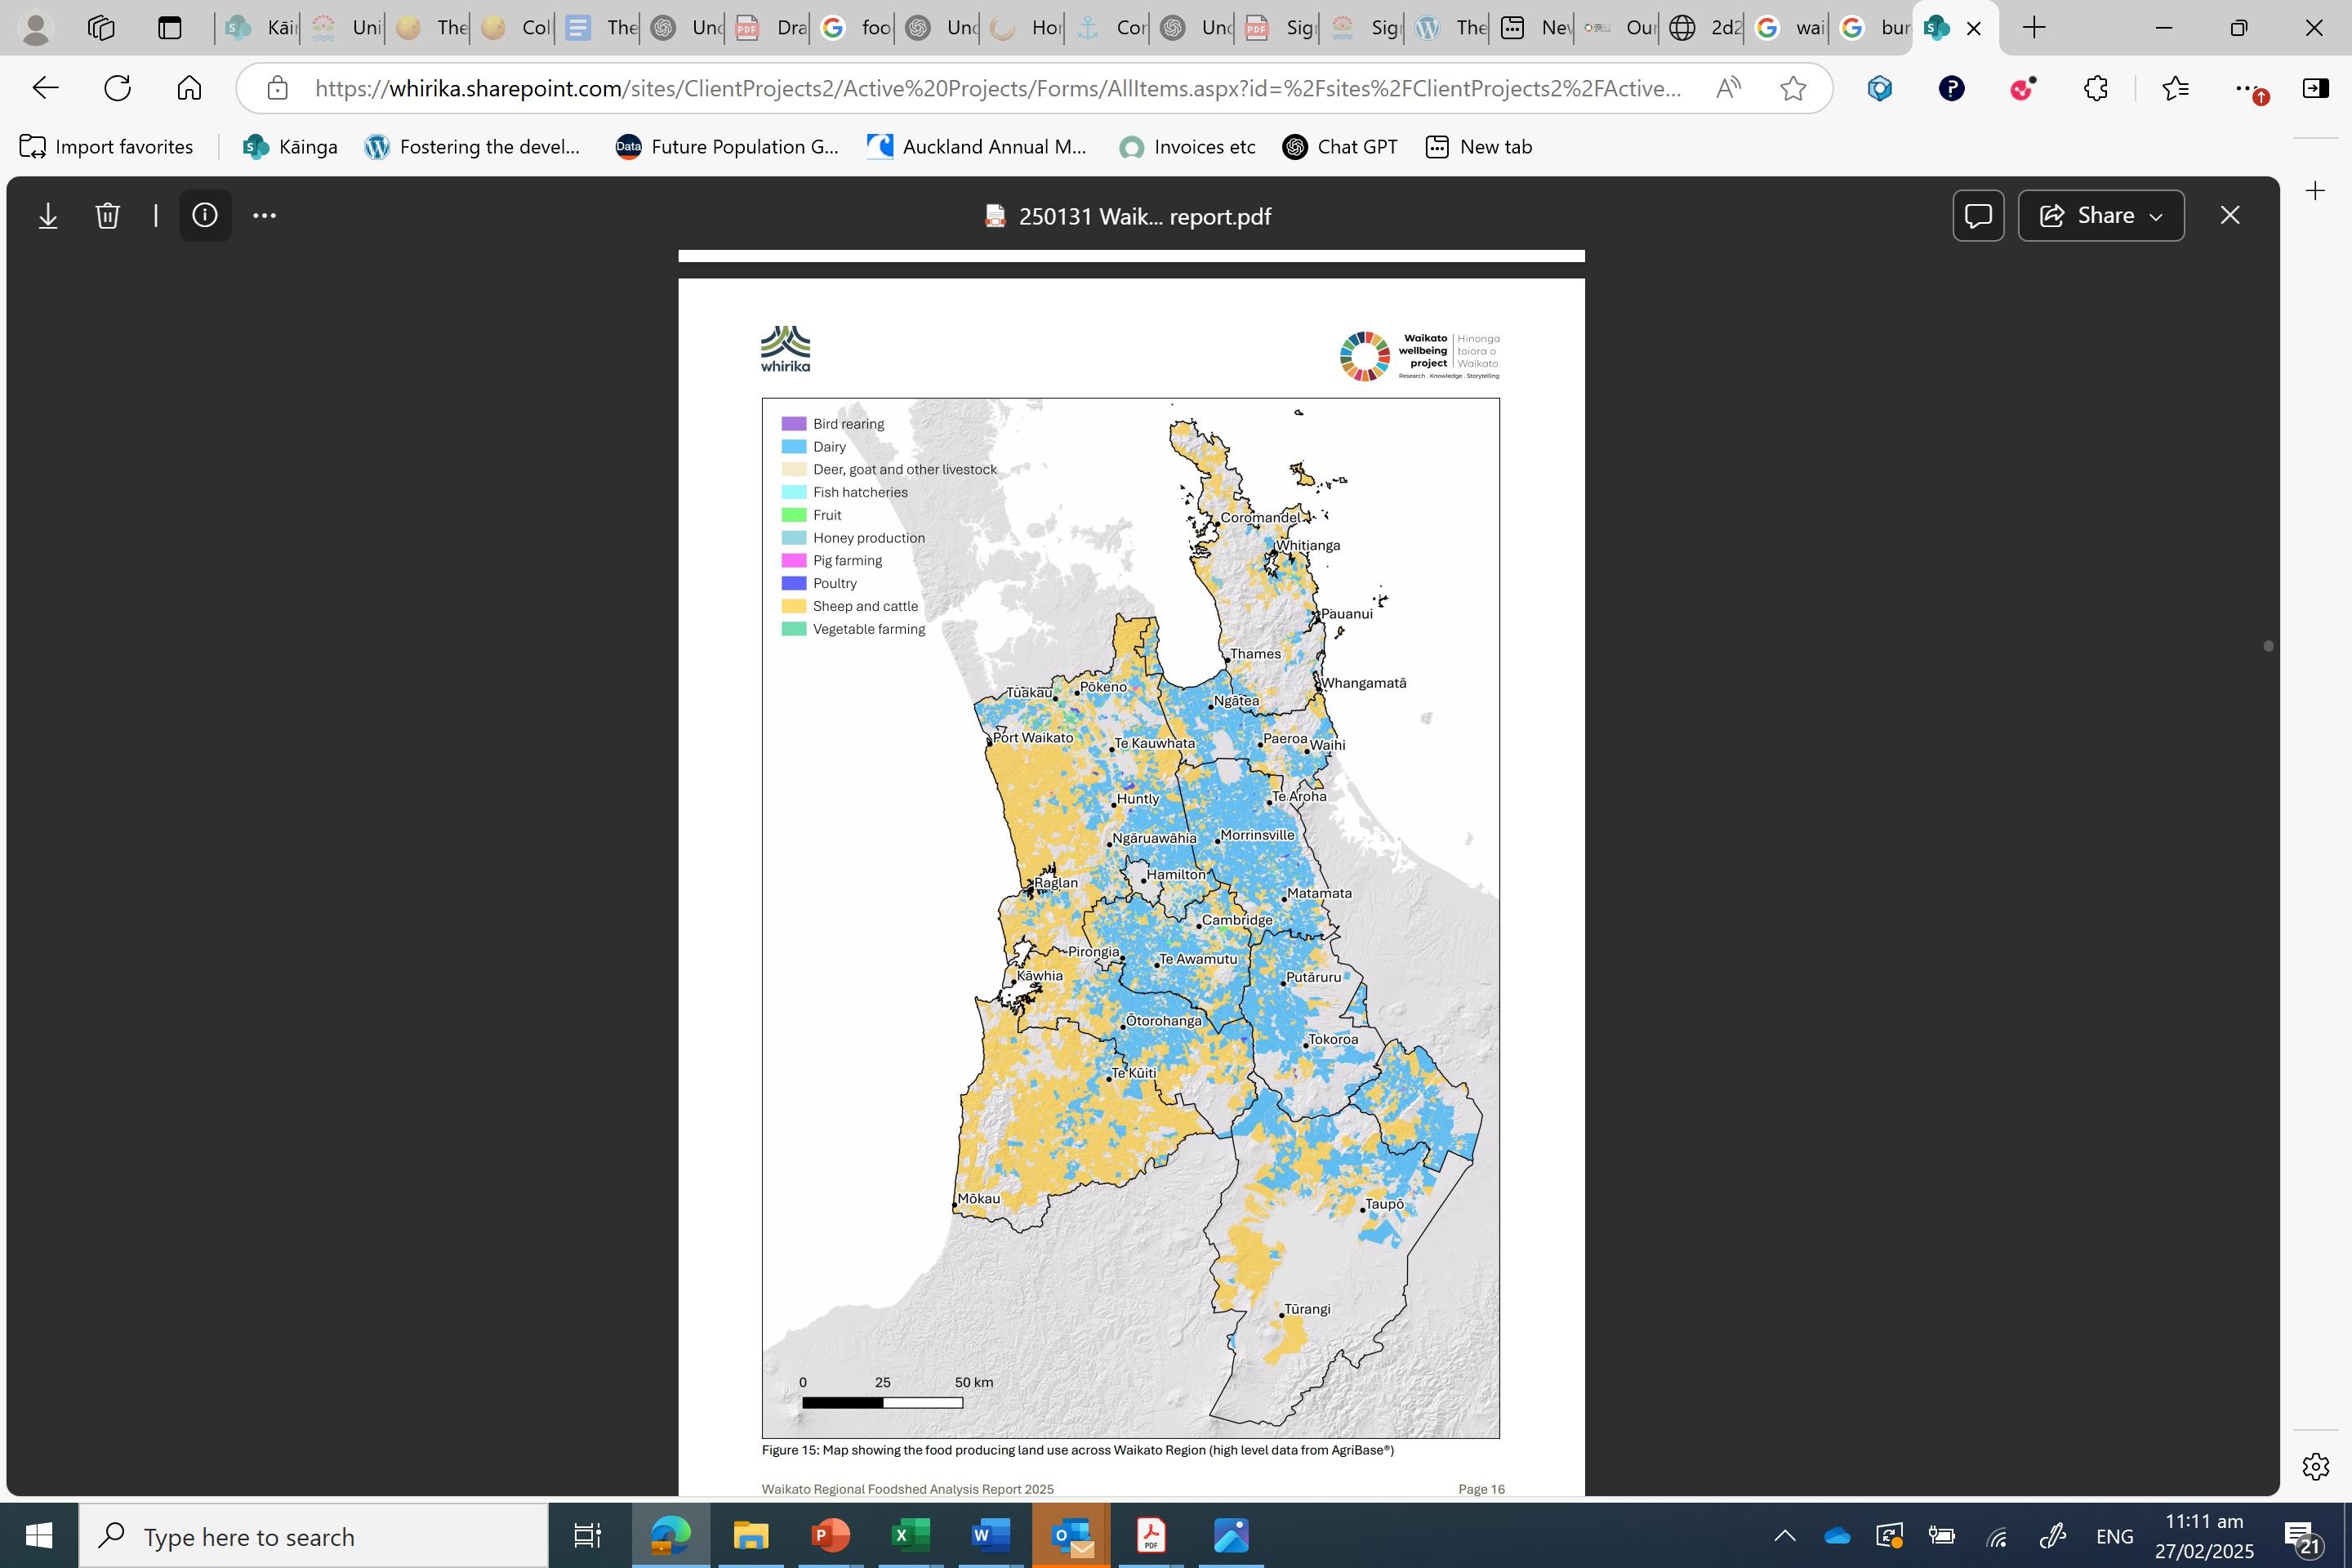
The food producing land is shown in the AgriBase® data map, Figure 15 (page 16). The land use types are grouped into the main food producing categories, e.g. Dairy is Dairy and Dairy dry stock.
Figure 15: Map showing the food producing land use across Waikato Region (high level data from AgriBase®)
Land use used in the modelling
After analysing industry specific publications and personal communications with industry body representatives, the total land use for some industries have been adjusted. Therefore, Table 6 shows the corrected land use that is used for the modelling.
The table shows a total adjustment of 4,835 hectares has been made, with most adjustments being made to separate out the dairy sheep and dairy goat farming and to determine the poultry for eggs and for meat distinctions The table identified that sheep and cattle farming (715,780 hectares) is 51% of the land area of the total food producing area, with dairy cows (47%) being the second largest land use in the region. Everything else is less than 1% of the total land area.
2.2.2 Factor IV: Food Production
The goal of the food production component of this study is to determine the types and amount of primary food production that occur within this foodshed. The food types produced are quantified by hectare and yield (weight).
The modelling and the groupings are explained in detail in Appendix One: Methodology of the Baseline Foodshed Analysis, see Section Factor IV: Food Production Estimates on page 59 This is total food production and does not distinguish between export and use within New Zealand.
Table 6: The food producing area used for the Waikato Regional foodshed modelling
Table 7: Food production modelling data for the Waikato Region by food type in kg per hectare per year
The modelling data in Table 7 are used for determining the total production of food in the Waikato Region below. Chicken meat production has an extraordinarily higher output per hectare.
2.2.3 Factor III x Factor IV = Total Estimated Production
To estimate total production, the area of type of food production within the Waikato Region is determined (Factor iii) and multiplied by the yield from the respective food system (Factor iv).
Total annual estimated food production
Table 8: Annual estimated food production from the Waikato Region (from largest to smallest)
(predominantly kiwifruit, avocados, pip
Grain crops (no crops for human consumption are recorded)
Figure 16 provides a graphical breakdown of the estimated food production (listed in Table 8) across the Waikato Region
per year Annual estimated food production for Waikato Regional foodshed (from largest to smallest)
Figure 16: Total estimated production within the Waikato Regional foodshed in tonnes per annum
Overall, by far the highest mass of a single food product from the foodshed is milk at 6.5 million tonnes per year, despite sheep and/or beef cattle farming utilising over 50% of the food producing land. Dairy is an efficient form of food production, utilising 46% of the food producing land to produce approximately 93% of the foodshed’s total output. However, chicken production is still a far higher output per hectare.
Total annual estimated food production without milk
Due to the high mass of milk production relative to other food products, the graph in Figure 16 is reproduced in Figure 17 without the milk production. The reproduced graph provides a better understanding of the other food types estimated to be grown in the Waikato Regional foodshed
Annual estimated food production for Waikato Regional foodshed without MILK (from largest to smallest)
17: Total estimated production within the Waikato Regional foodshed in tonnes per annum excluding milk production
Figure
Red meat is estimated as the second-largest food produced in the foodshed, following milk. Vegetable production ranks third, at approximately 159,026 tonnes per year, while chicken for meat is fourth, with an estimated 80,190 tonnes per year. Legumes and nuts are the smallest food production category, at around 437 tonnes per year. No grain crops are recorded for human consumption.
Total annual estimated food production with assumed export removed
As Aotearoa New Zealand is a food exporting country, the graph in Figure 16 is reproduced in Figure 18 with assumed export data removed. Export data is gathered from a variety of sources including StatsNZ, Dairy NZ, Beef + Lamb, Horticulture NZ, Onions New Zealand Inc, Potatoes New Zealand and MPI. For example, according to Dairy NZ, Beef + Lamb, and MPI in 2023, 95% of milk and between 90-95% of red meat was exported overseas. The data used is national export data and not specific to the Waikato Region, see Export data assumptions in Appendix One for more details.
It is important to note that despite research available showing percentages of food exported out of the country, the food that is produced in the Waikato Region remains the same. The following graph shows total annual estimated food production in the region, once estimated export volumes are removed (from largest to smallest).
Annual estimated food production for Waikato Regional foodshed with assumed export totals removed (from largest to smallest)
Tonnes per year
The graph in Figure 18 shows the annual estimated food production for the Waikato Region once total export yields are removed. The data still highlights the dominance of milk production in the region, with an estimated 324,000 tonnes per year, significantly outpacing other food categories. Once red meat exports are removed, however, red meat moves to sixth largest food producer, behind milk, vegetables, poultry meat, fruit and eggs.
As noted in the introduction, this analysis is the first stage of understanding a local food economy and does not extend to describing how food is transported within or externally into or out of the foodshed for processing and redistribution. A full food system analysis would show how much food stays within the region and how much is distributed across the country.
Figure 18: Total estimated production in Waikato Region in tonnes per annum with assumed export volumes removed
2.3 Mass Balance of Food Consumption and Production
The ‘mass balance’ is a way of comparing total food production against total food consumption for those items produced in the foodshed. Based on the total estimated food consumption data (defined above) and the total estimated food production data available (defined above), assumptions can be made to ascertain the mass balance. However, it does not account for items such as bananas, which are frequently consumed but not grown in this region. Furthermore, honey is not included in the mass balance figures due to it being a sweetener and not being included in the consumption data
It is also important to note the difference in consumption and production of dairy. Production is calculated in milk (approximately 6.5 million tonnes per annum), however for a more realistic measure when comparing to consumption, the milk production has been re-calculated to represent consumption of both milk and other dairy, such as cheese (which condenses milk to approximately one tenth of its original mass, according to DairyNZ). Therefore, to reflect that milk is consumed both in liquid and in other dairy products the milk data total is modelled as ‘Dairy’ (milk production divided by four) and shows 1.6 million tonnes per year, as shown in Table 9.
2.3.1 Mass Balance for the Waikato Regional Foodshed
The overall mass balance along with the surplus or deficit is also shown in Table 9, based on the total food production and does not distinguish between export and use within New Zealand.
The mass balance analysis reveals significant variations between food production and consumption in Aotearoa New Zealand. Overall, the mass balance shows that approximately seven times the amount of food required in the Waikato Region is grown in the region, however, that is not the case for all food types. For example, red meat and dairy products have a mass balance of 14.36 and 22.76 respectively, meaning production far outweighs the consumption of the foodshed by 184 thousand tonnes and 1.56 million tonnes per year (respectively). The previous section identified that 90-95% of red meat and dairy could potentially be grown for export. Vegetables, poultry meat and eggs have significant surplus of
Table 9: Waikato Regional foodshed Mass Balance
approximately 90 thousand tonnes, 69 thousand tonnes and 15 thousand tonnes per year (respectively). Research shows each of these food types are also grown nationally for export. Conversely, pork, legumes and nuts, finfish and shellfish, and fruit are in deficit by approximately 8 thousand tonnes, 4.8 thousand tonnes, 3.7 thousand tonnes and 8.7 thousand tonnes (respectively). Aquaculture and kiwifruit exports are nationally significant at 80-85% Due to grains not being produced in the region for human consumption, the mass balance shows zero, meaning the whole amount of the grain requirement is in deficit (approximately 55 thousand tonnes per year).
Estimated Consumption and Production of Food within the Foodshed
Figure 19 is a graph of Table 9 and shows the total estimated current food production and the total estimated food consumed by the population of the Waikato Region (export volumes are NOT removed).
Total estimated consumption and total estimated production of food within the Waikato Regional foodshed Total estimated food consumption
estimated current food production
Figure 19: Total estimated consumption and total estimated production of food within the Waikato Regional foodshed
The graph in Figure 19 shows that dairy is the largest producer of food within the Waikato Regional foodshed by an enormous amount
Estimated Consumption and Production of Food within the Foodshed without Dairy
The same information in Figure 19 is reproduced below without the dairy data (Figure 20).
Total estimated consumption and total estimated production of food within the Waikato Regional foodshed without DAIRY
Total estimated food consumption
estimated current food production
Figure 20: Total estimated consumption and total estimated production of food without dairy
Red meat Pork meat Poultry meat Dairy products Grain crops Legumes and nuts Eggs Aquaculture Vegetables Fruits Tonnes of food per year
Red meat Pork meat Poultry meat Grain crops Legumes and nuts Eggs Aquaculture Vegetables Fruits
The graph in Figure 20 shows that more red meat, poultry meat, vegetable and egg production are grown than required to meet the consumption needs of the population. Grain crops, legumes / nuts and fruit do not have enough to meet the requirement of the population.
2.3.2 Mass Balance for the Waikato Regional Foodshed with Assumed Export Removed
Due to the high national export volumes of some specific food types, Table 9 is reproduced in Table 10 with the assumed export amounts removed.
Table 10: Waikato Regional foodshed mass balance with assumed export volumes removed
This second mass balance analysis, after removing export quantities, indicates an overall balance of 1.03, meaning total food production equals total food requirements in the Waikato Region. However, significant variations exist between different food types. With 90-95% of red meat and milk products exported, the remaining production of these items in the region aligns closely with estimated annual consumption (mass balances of 1.08 and 1.14, respectively).
Table 10 highlights poultry meat, which shows the largest surplus of 52,556 tonnes, 5.5 times the regional consumption demand. Similarly, egg production exceeds regional needs by 4.4 times. Vegetable production, with 85% of onions and 25% of potatoes exported, is 1.5 times the required amount. In contrast, several food groups face deficits, including pork (-8,014 tonnes), finfish and shellfish (-9,254 tonnes), legumes and nuts (-4,831 tonnes), and fruit (-25,480 tonnes), indicating a reliance on imports to the region to feed the community Notably, grain production is zero, reflecting a dependence on imported grains.
Estimated Consumption and Production of Food within the Foodshed with Assumed Export Removed
Figure 21 is a graph of Table 10 and shows the total estimated current food production and the total estimated food consumed by the population of the Waikato Regional foodshed in tonnes per annum with assumed export volumes removed.
Total estimated consumption and total estimated production of food within the Waikato Regional foodshed with assumed export products removed
Total estimated food consumption Total estimated current food production
Figure 21: Total estimated consumption and total estimated production of food with assumed export products removed
Excluding export volumes, the Waikato Region's total estimated food production closely matches the estimated local consumption (mass balance: 1.03). However, Figure 21 offers a more detailed comparison of individual food types, highlighting the surpluses and deficits of local production versus local population needs.
Red meat and dairy production are now more balanced, while significant surpluses exist in poultry, vegetables, and eggs. These excess products are likely distributed across Aotearoa New Zealand to supply high-population areas or regions less suited for poultry or vegetable cultivation.
Conversely, the Waikato Region faces substantial deficits in pork, grain crops, legumes and nuts, aquaculture, and fruit, indicating a reliance on imports from other regions. Nationally, approximately 80% of kiwifruit is exported, and in the Waikato Region, an estimated 56% of total fruit production is kiwifruit. The export of this single fruit has reduced the region’s fruit mass balance from 0.81 to 0.45. Similarly, with approximately 85% of aquaculture products exported nationally, the Waikato Region’s aquaculture mass balance has declined from 0.64 to 0.10.
The most pronounced deficit is in grain crops, as there is no recorded production for human consumption, resulting in a complete reliance on imports to meet demand.
Red meat Pork meat Poultry meat
products Grain crops Legumes and nuts Eggs Aquaculture Vegetables Fruits
3 Overview of Hamilton City, Waikato District and Waipā District
To provide further detail to the foodshed analysis, a high-level summary of three districts was requested by the Waikato Wellbeing Project. The three specified districts are Hamilton City, Waikato District and Waipā District.
3.1
Total Estimated Food Consumption
3.1.1 Factor I: Population of Hamilton City, Waikato District and Waipā District
According to New Zealand Statistics (2023) in the Hamilton City, Waikato District and Waipā District the population is 336,500 (Table 11).
Table 11: Population estimate data from Territorial Authorities in the Waikato Region (Infoshare at StatsNZ 2023)
Authority
estimates at 30 June 2023
Hamilton City is by far the largest of the Territorial Authorities in terms of population, the second largest is the Waikato District (less than half the population of Hamilton City) and third is Waipā District
If the population is broken down into gender and age, it can be shown as a graph for the three districts (Figure 22).
Population by gender across three districts
Girls: 0-14 years
Figure 22: StatsNZ 30 June 2023 population data breakdown of gender and age across the three districts, from highest to lowest
Hamilton City
Waikato District
Waipā District
City
density Population (People) Land area (Hectares)
23: Population density (population compared to land area) for three districts
Figure 23 shows that Hamilton City has significantly more people than land area (1,679 people per km2) and Waikato District (second largest populated area) has the second largest land area. Waipā District has the second largest density at 42 people per km2, after Hamilton City.
3.1.2 Factor II: Estimated Food Consumption for an Average Person in the Waikato Region
Figure 13 (repeated below for ease in Figure 24) shows a graph of the food consumption data for an “average person” in the Waikato Region, which will be used to represent consumption for each of the three specific districts
Estimated food consumption for an average person based in Waikato Region
food types (in kg per person per year)
3.1.3 Factor I x Factor II = Total Estimated Consumption
Based on the population for each of the specified districts (Factor i), it is estimated that 104,880 tonnes of food are consumed every year for Hamilton City, 50,997 tonnes of food for Waikato District and 34,583 tonnes of food for Waipā District (calculated from Factor ii). These numbers represent the estimated total amount of food that needs to be produced to feed their population every year (Table 12)
Figure
Figure 24: Waikato Region estimated average food consumption across
Hamilton
Waikato District Waipā District
Table 12 shows the total estimated food consumption by food type per capita per annum (left column in kg) and total food needs for Hamilton City, Waikato District and Waipā District in tonnes per year. Due to rounding, some figures may not sum precisely. This data is shown in the graph in Figure 25
Total Estimated Consumption for
Kg per person per year
Figure 25 shows that, due to the size of the population in Hamilton City, double the amount of food is required to feed the population compared to Waikato District and three times as much as Waipā District.
Table 12: Food consumption estimates, by food type for Hamilton City, Waikato District and Waipā District
Figure 25: Total estimated food consumption by food type per capita per annum for Hamilton City, Waikato District and Waipā District
Red meat Pork Poultry Dairy Grain Legumes, nuts, seeds Eggs Fish and shellfish Vegetables Fruit
Hamilton City, Waikato District and Waipā District
Hamilton City Waikato District Waipā District
3.2 Total Estimated Food Production for Selected Districts
3.2.1
Factor III: Land Use Analysis
Hamilton City
The land use that is used for the modelling for Hamilton City is shown in Table 13 and Figure 26.
Table 13: The food producing area used for Hamilton City modelling
The table shows that sheep and cattle farming (747 hectares), dairy cow farming (1,093 hectares), poultry is 3 hectares and 3 hectares for orchard fruit are the only food produced in the district Table 13 is shown in a graph in Figure 26.
Food production type for Hamilton City
26: Land use in hectares used in the Food Production Modelling for Hamilton City
Figure
Waikato District
The land use that is used for the modelling for Waikato District is shown in Table 14
Table 14: The food producing area used for Waikato District modelling
The table shows that sheep and cattle farming (201,514 hectares) and dairy cow farming (109,459 hectares) are the largest food producing areas in the district Table 14 is shown in a graph in Figure 27
Figure 27: Land use in hectares used in the Food Production Modelling for Waikato District
Food production type in Waikato District
Waipā District
The land use that is used for the modelling for Waipā District is shown in Table 15 and Figure 28
Table 15: The food producing area used for Waipā District modelling
The table shows that sheep and cattle farming (201,514 hectares) and dairy cow farming (109,459 hectares) are the largest food producing areas in the district. Table 15 is shown in a graph in Figure 28.
Figure 28: Land use in hectares used in the Food Production Modelling for Waipā District
Food production type in Waipā District
3.2.2 Factor IV: Food Production for Selected Districts
The food production component is taken from the food production modelling data for the Waikato Region by food type in kg per hectare per year, as shown in Table 7 on page 18 and is used for determining the total estimate production of food in Hamilton City, Waikato District and Waipā District below.
3.2.3 Factor III x Factor IV = Total Estimated Production
To estimate total production, the area of type of food production in each of the three districts is determined (Factor iii) and multiplied by the yield from the respective food system as determined over the Region (Factor iv).
Hamilton City: Total annual estimated food production
Table 16: Annual estimated food production from Hamilton City
Figure 29 provides a graphical breakdown of the estimated food production across Hamilton City.
Figure 29: Total estimated production within Hamilton City in tonnes per annum
Annual estimated food production for Hamilton City
Overall, milk is the most productive food product produced from Hamilton City at 20,361 tonnes per year. The dairy sector utilises 59% of the food producing land to produce approximately 97% of the food produced per year.
Hamilton City: Total annual estimated food production without milk
Due to the high level of milk production, the graph in Figure 29 is reproduced in Figure 30 without the milk production. The reproduced graph provides a better understanding of the other food types estimated to be grown in Hamilton City.
In the reproduced graph, the other food types produced in Hamilton City can be interpreted more clearly. Red meat is estimated as the second largest food type produced (behind milk production) at approximately 266 tonnes per year. Egg production is estimated to be the third largest food produced at approximately 206 tonnes per year. Fruit (predominantly kiwifruit and pip fruit) are the fourth largest food production at approximately 126 tonnes per year. Chicken grown for meat is the smallest of the food production types at approximately 20 tonnes per year.
Waikato District: Total annual estimated food production
Figure 30: Total estimated production within Hamilton City in tonnes per annum excluding milk production
Table 17: Annual estimated food production from Waikato District
Annual estimated food production for Hamilton City without MILK
Figure 31 provides a graphical breakdown of the estimated food production across Waikato District.
Overall, milk is the highest-yielding food from Waikato District at approximately 937,471 tonnes per year, despite sheep and/or beef cattle farming occupying 62% of the land used for food production The dairy cow sector occupies 33% of the land used for food production and accounts for approximately 73% of the total annual yield
Waikato District: Total annual estimated food production without milk
Due to the high level of milk production, the graph in Figure 31 is reproduced in Figure 32 without the milk production. The reproduced graph provides a better understanding of the other food types estimated to be grown in Waikato District.
Annual estimated food production for Waikato District without MILK
Figure 31: Total estimated production within Waikato District in tonnes per annum
Figure 32: Total estimated production within Waikato District in tonnes per annum excluding milk production
In the reproduced graph, the other food types in Waikato District are more clearly represented. Vegetables are the second-largest category after milk, with an estimated annual yield of 212,640 tonnes. Red meat follows at approximately 51,373 tonnes per year, with eggs ranking fourth at around 43,105 tonnes per year.
Waipā District: Total annual estimated food production
Milk (predominantly from cows, 0.18% from goat or other livestock)
meat (sheep, beef, goat, venison)
(predominantly kiwifruit and pip fruit)
Figure 33 provides a graphical breakdown of the estimated food production across Waipā District.
Overall, milk is the highest-yielding food from Waipā District, with an annual output of approximately 824,350 tonnes. The dairy cow sector occupies 69% of the land used for food production and accounts for about 91% of the total yearly yield.
Table 18: Annual estimated food production from Waipā District
Figure 33: Total estimated production within Waipā District in tonnes per annum
Annual estimated food production for Waipa District
Waipā District: Total annual estimated food production without milk
Due to the high level of milk production, the graph in Figure 33 is reproduced in Figure 34 without the milk production. The reproduced graph provides a better understanding of the other food types estimated to be grown in Waipā District.
In the reproduced graph without milk, the other food types in Waipā District are more clearly represented. Fruit is the second-largest category after milk, with an estimated annual yield of 47,880 tonnes. Red meat follows at approximately 16,052 tonnes per year, while vegetables rank fourth at around 15,463 tonnes per year.
3.3 Total Estimated Consumption and Total Estimated Production of Food for Selected Districts
3.3.1 Hamilton City
Figure 35 shows the estimated current food production and the estimated food consumed by the population of Hamilton City.
Figure 34: Total estimated production within Waipā District in tonnes per annum excluding milk production
Annual estimated food production for Waipa District without MILK
Total estimated consumption and total estimated production of food within Hamilton City Total estimated food consumption
Figure 35: Total estimated consumption and total estimated production of food within Hamilton City
The graph shows that more food is consumed than is produced in Hamilton City.
3.3.2 Waikato District
Figure 36 shows the estimated current food production and the estimated food consumed by the population of Waikato District.
Total estimated consumption and total estimated production of food within the Waikato District
estimated food consumption
estimated current food production
Figure 36: Total estimated consumption and total estimated production of food within Waikato District
The graph shows that more red meat, dairy, eggs, and vegetable production are grown than required to meet the consumption needs of the population in Waikato District. Pork and poultry meat, grain crops, legumes / nuts, aquaculture and fruit do not have enough to meet the requirement of the population.
3.3.3 Waipā District
Figure 37 shows the estimated current food production and the estimated food consumed by the population of Waipā District.
Figure 37: Total estimated consumption and total estimated production of food within Waipā District
The graph shows that a similar amount of red meat and fruit is consumed and produced in Waipā District. Whilst more dairy is grown than required to meet the consumption needs and the remainder of the food types do not have enough to meet the requirement of the population in Waipā District
4 Changes to Food Producing Land from 2002 to 2024 in Selected Districts
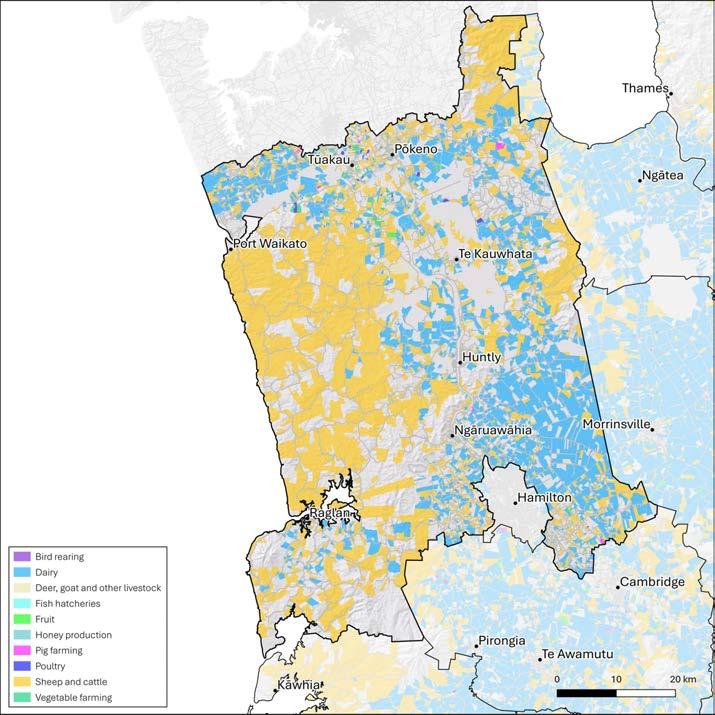
A high-level analysis of the land use from 2002 to 2024 is shown in the following section for reference. These changes should be interpreted with caution as they may reflect increasing completeness of the AgriBase® dataset, rather than actual land use change. For example, Figure 39 (page 39) shows the Waikato District and a substantial amount of in-fill of sheep and cattle farming occurring on land parcels in the eastern part between 2002 and 2024. These in-filled parcels were probably sheep and cattle farming in 2002 too so do not represent land use change. On this basis it is not recommended to draw any significant conclusions from this comparison.
Waipa District
4.1 Food
Producing
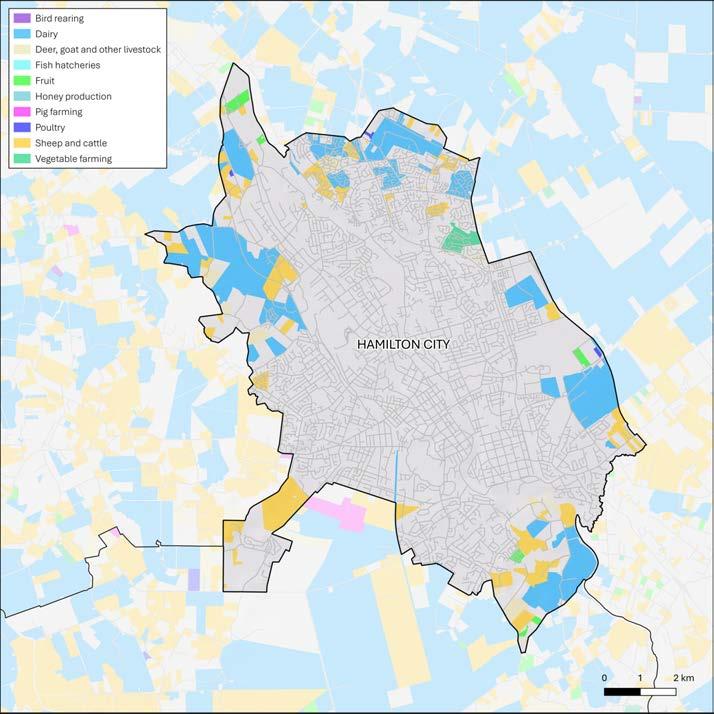
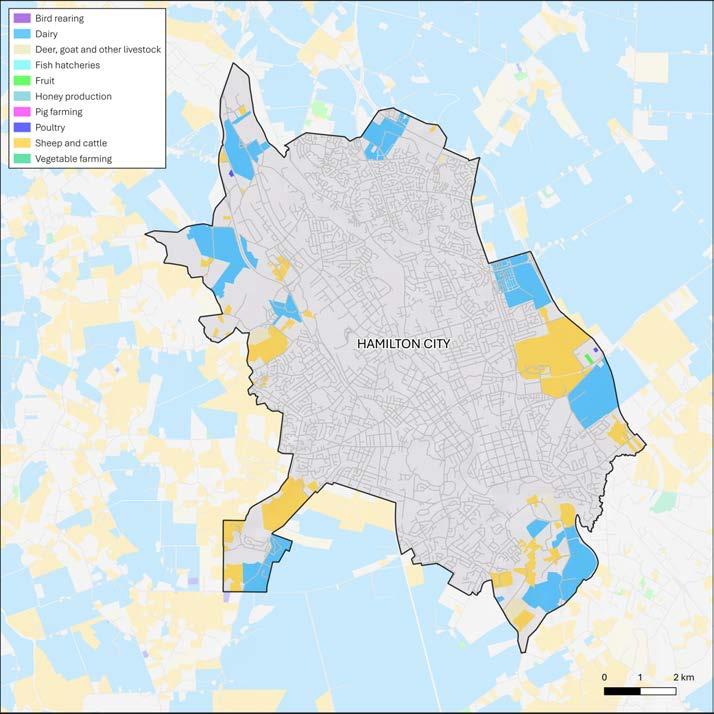
Land in Hamilton City from 2002 to 2024
The maps from 2002 and 2024 show changes over the 22 years. The biggest change is the reduction of vegetable and fruit growing land (shown in green), and the change of land use in dairy, and sheep and cattle.
Figure 38: Maps showing the food producing land use across in Hamilton City (high level data from AgriBase®). Left: 2002. Right: 2024
4.2 Food Producing Land in Waikato District from 2002 to 2024
The maps from 2002 and 2024 show changes over the 22 years. The biggest change is the increase in dairy, and sheep and cattle farming.
Figure 39: Maps showing the food producing land use across in Waikato District (high level data from AgriBase®). Left: 2002. Right: 2024
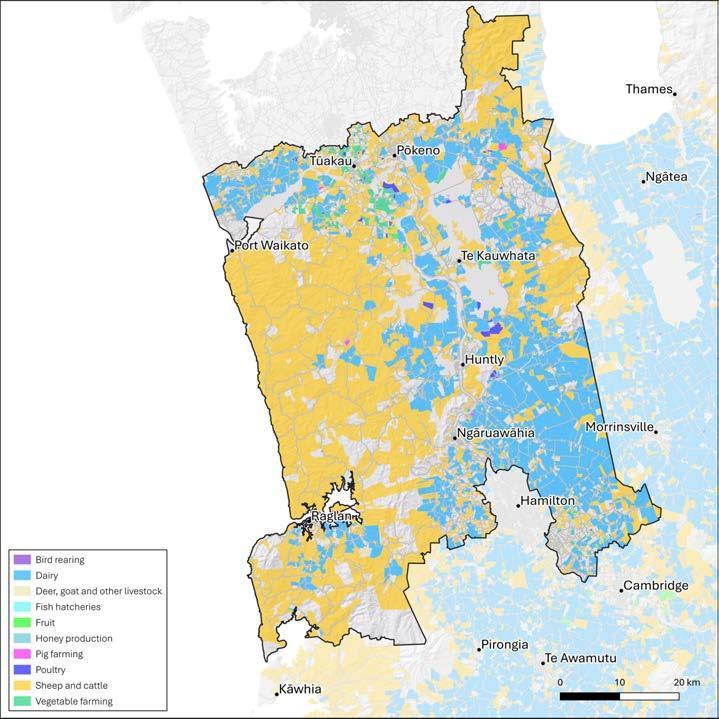
4.3 Food Producing Land in Waipā District from 2002 to 2024
The maps from 2002 and 2024 show changes over the 22 years. The most obvious change is the reduction of pig farming and bird rearing.
Figure 40: Maps showing the food producing land use across in Waipā District (high level data from AgriBase®). Left: 2002. Right: 2024
5 Appendix One: Methodology of the Baseline Foodshed Analysis
5.1 Factor I: The Size of a Foodshed’s Population
The populations of each territorial authority within the Waikato Region are calculated from Statistics New Zealand estimate for the population as of 30 June 2023 and corrected by Waikato Regional Council staff to ensure Taupō and Rotorua districts are correctly adjusted.
Using the estimate for the population, as opposed to the usual resident population, is a statistical projection or estimation of the population size at a given point in time, typically between official census years. These estimates are based on a variety of data sources and statistical methods, including birth and death registration, migration data, and demographic modelling. Estimates are essential for providing up-to-date population figures between census years. They are subject to periodic revisions to improve accuracy and reliability.
The usual resident population refers to the total number of people who reside in a specific geographical area, such as a country, region, city, or district. It includes both permanent residents and long-term temporary residents who have established their residence in that area. The resident population is typically determined through official census counts, which are conducted at regular intervals, such as every five or ten years in many countries. Census data provides a comprehensive and accurate count of the population at a particular point in time.
5.2 Factor II: Working out Estimated Average Food Consumption
There are multiple datasets that provide annual per capita data on food supply (FAO), or Total Diet Studies (MPI), and the Ministry for Health published a recommended diet for Aotearoa New Zealand. However, each is slightly different to the other. Therefore, different datasets are compared to produce a set of numbers that could be extrapolated out to create the average food consumption for the Waikato Regional foodshed.
5.2.1 Explaining the Research and Datasets used in Estimating Average Food Consumption
Research into food trends
Kantar Better Futures Reports from 2020 & 2022
Recent food trends, according to the Kantar report (previously Colmar Brunton), show an increase in vegetarianism and veganism. Kantar have been producing Better Futures Reports since 2017. These are freely available reports that provide key insights into consumer perspectives on sustainability and social and environmental issues that are important to the people of Aotearoa, and how these change over time. The average number of participants in the surveys is approximate 1,000
In the 2020 report, Kantar states that since 2015 the trend towards meat free eating is increasing, growing from 5% to 15% of respondents by 2019 (Figure 41)
It is important to note that there is a lack of data that proves vegetarian or vegan diets are on the increase.
In the 2022 Kantar report, they documented an increase in a “flexitarian” approach to food with 19% of respondents stating they maintain a vegetarian or vegan diet (Figure 42).
However, these results are significantly different to the latest analysis of data from the New Zealand Health Survey published in Public Health Nutrition (Greenwell, et al. 2023), which has stricter definitions of vegetarianism. The research shows:
• 93% percent of Aotearoa New Zealanders eat red meat,
• 2.9% do not eat red meat, but do eat seafood and poultry,
• 1.4% are pescatarians (no red meat or poultry, but do eat fish),
Figure 42: Kantar Better Future Report 2022, p.17
• 2% are true vegetarians (no meat or seafood at all) and
• 0.7% are true vegans (no meat, seafood, or animal-derived products such as dairy).
The research team found that for surveys where people label themselves vegetarian, they may not actually count as vegetarian with the new strict parameters. For example, when one of the research team was interviewed about the new findings, they stated, "You really can't ask people how they identify… I've had people tell me, when they find out what I'm interested in and what I research… they say, 'Oh, yeah, I'm vegetarian.' And I said, 'Isn't that bacon you're eating in your sandwich?' They said, 'Oh, yeah. I mean, I eat bacon but, you know”11 .
New Zealand Adult Nutrition Survey data from 2008/09
The New Zealand Adult Nutrition Survey (University of Otago & Ministry of Health, 2011) provides a comprehensive insight into the dietary habits, nutritional status, and health outcomes of adults in Aotearoa New Zealand. The survey underscores the significance of meat consumption in the Aotearoa New Zealand diet, particularly the consumption of beef and lamb, which serve as important sources of protein, vitamins, and minerals for most adults.
The study showed that most adult New Zealanders (94.5%) reported eating red meat in the previous four weeks.
Beef + Lamb NZ (2020)
According to Beef + Lamb NZ (2020, p.30), at the time of the last national nutrition survey (2008/9), average beef and lamb intakes in Aotearoa New Zealand were reported to be around 400 grams per week.
OECD-FAO Agricultural Outlook (2020)
The Organisation for Economic Co-operation Development (OECD) and the Food and Agriculture Organisation (FAO) Agricultural Outlook 12 (OECD-FAO, 2020) claims that the average Aotearoa New Zealander now consumes approximately 3.4 kilograms of sheep meat and 11.5 kilograms of beef per capita annually (OECD-FAO, 2020). This translates to roughly 63 grams per week for sheep meat and 221 grams per week for beef, 284 grams total.
FAOSTAT average food consumption data
The Food and Agriculture Organisation Corporate Statistical Database (FAOSTAT) by the United Nations is a global web-based platform, that disseminates statistical data collected and maintained by the Food and Agriculture Organisation (FAO). FAOSTAT data are provided as a time-series from 1961 in most domains for 245 countries.
12 The OECD-FAO Agricultural Outlook 2020-2029 is a collaborative effort of the Organisation for Economic Co-operation Development (OECD) and the Food and Agriculture Organisation (FAO) of the United Nations, incorporating expertise from collaborating member countries and international commodity organisations. It provides market projections for national, regional, and global supply and demand of major agricultural commodities, biofuel and fish.
Using FAOSTAT
The Otago Food Economy report completed in 2016 (Millar, et al. 2016), estimated the amount of food consumed by the foodshed residents (those living in Dunedin and Wānaka, Otago) using the United Nations FAOSTAT data (2011). The dataset provided estimated national food supply figures. The food supply quantity is based on kilograms per person per year (kg/capita/yr) and is a measurement used to represent the average amount of food available for consumption per person in a given country or region over the course of one year. This figure is typically expressed in kilograms per capita per year.
The top-down reporting method FAOSTAT has limitations of accuracy because it includes food consumed within the country by tourists and because food that is not purchased (e.g. home grown, mahinga kai13, or hunted food) is excluded.
As a result, the FAOSTAT food figures could be an underestimation depending on the amount of noncommercial food that is consumed by Aotearoa New Zealanders. While there are several gaps in the FAOSTAT data it remained the dataset of choice for the creation of the Otago Food Economy report because the food data are presented as raw (loss-adjusted primary weights) rather than processed food. Using raw foods is the preferred way to calculate estimated food consumption by food types. As a result, the FAOSTAT data is included in this report for the total food consumed by Aotearoa New Zealanders.
To determine which year’s data set to use from FAOSTAT, the years from 2011 to the latest available (2020) are compared in Figure 43.
Aotearoa New Zealand Food supply quantity (kg/capita/yr) comparison of data from 2011 to 2020
Figure 43 shows a pattern across the food supply data from FAOSTAT across the years 2011 to 2020. There is one obvious outlier, which is the dairy products for 2011 (251 kg per person per year), which is nearly double the amount of dairy supplied for the following years (for example 2012 is 112 kg per person
13 The traditional (in Māori culture) way of gathering, protecting and processing a wide variety of food.
Figure 43: FAOSTAT data from 2011 to 2020
per year). The cause of this anomaly is unknown. Therefore, two sets of data are used below, one that averaged data between 2012 and 2020, and the other in the year 2019 (due to 2020 being COVID year).
Food consumption analysis
Over the span of nine years, data from the United Nations FAOSTAT reveals a decline in red meat consumption, dropping from 45 kg per person per year in 2012 to 32 kg per person per year in 2020, with a notable exception in 2016 (see Figure 44). A trend in line with the Kantar reports and the Beef + Lamb NZ findings.
New Zealand Meat supply quantity (kg/capita/yr) from 2012 to 2020
It is interesting to note that fish consumption also experienced a slight decrease during this period. Pork consumption shows a generally upward trend with some fluctuations. The consumption of poultry presents a challenge in terms of clear trends, as it appears to fluctuate throughout the nine-year duration.
When the collective meat figures are examined together (Figure 45) an overarching pattern emerges –overall meat consumption has been on a decline, starting from 113 kg per person per year in 2012 and reducing to 102 kg per person per year in 2020, representing a decrease of around 10%.
Aotearoa New Zealand all meat (combined) supply quantity (kg/capita/yr) from 2012 to 2020
2012 and 2020
However, it's worth noting the anomaly in 2016 (Figure 45) when there is a notable surge in red meat consumption after an annual decline from 2012.
Figure 44: FAOSTAT shows estimate supply quantity of red meat, pork, poultry and fish
Figure 45: FAOSTAT shows an estimated overall decline in meat consumption between
Red meat Pork Poultry Fish and shellfish
Aotearoa
FAOSTAT shows an increase in egg consumption from 2012-2020 (9 kg per person per year to 12 kg per person per year) (Figure 46). Dairy consumption fluctuates somewhat increasing in 2013 to 164 kg per person per year then decreasing in 2020 to 115 kg per person per year.
Figure 46: FAOSTAT showing an increase in egg consumption, and some large fluctuations in dairy consumption
Interestingly, FAOSTAT shows there has also been a reduction in vegetable and fruit consumption over the nine-year period (Figure 47). This seems at odds with the decreasing meat consumption and stated national food consumption trends.
Aotearoa New Zealand non-animal supply quantity (kg/capita/yr) from 2012 to 2020
47: FAOSTAT showing grain, legumes/nuts/seeds, vegetables and fruit consumption
Figure 47 shows legumes, nuts and seeds vary very little, and grain increases slight over the years.
FAOSTAT average food consumption
The FAOSTAT data includes ‘Beverages’ (such as tea, coffee, cocoa, wine, beer, and other fermented drinks) as well as ‘Other’ (which include foods hard to incorporate into the other food types, such as oils, fats, offal meat, sweeteners, confectionery, and spices). Foodshed calculations typically focus on staple foods and core dietary requirements (e.g., fruits, vegetables, grains, proteins) to assess food consumption or food production. Beverages and items in the ‘Other’ category are often luxury or nonessential items in dietary terms. Their production and consumption are less critical to the basic
Figure
Aotearoa New Zealand Egg & Dairy supply quantity (kg/capita/yr) from 2012 to 2020
functionality of the foodshed. Therefore, the categories of ‘Beverages’ and ‘Other’ are not included in the foodshed calculations and are not included in any graphs in the remainder of this report.
According to FAOSTAT 2019 data, the estimated food supply quantity per person is 615 kg comprising the food types shown in Figure 48.
FAOSTAT Aotearoa New Zealand Food supply quantity data 2019
Dairy includes liquid milk, cheese, butter, yogurt, cream and ice creams.
MOH Dataset
The New Zealand Ministry of Health’s Eating and Activity Guidelines for New Zealand Adults (Ministry of Health, 2020b) and the information sheet on serving sizes (Ministry of Health, 2020a) provides recommendations on how much food one person would eat to maintain a healthy diet.
They define ‘healthy diet’ as one which provides sufficient energy for the person plus ten key nutrients of protein, thiamine, vitamin A, vitamin C, folate, calcium, iodine, iron, magnesium, and zinc.
The serving size estimates are given in grams but are based on the energy content of the food type and their key nutrient content.
The weight of a serving of vegetables (~75g/serve) is less than half the weight of a serving of milk and milk products (~250g for a cup of milk). So, an adult consuming the recommended servings of 5 vegetables and 3 milk products will eat 375g/day and 700g/day of these food types respectively.
The food group referred to as “Legumes, nuts, seeds, fish and other seafood, eggs, poultry, and/or red meat with the fat removed” in (Figure 49) is often called the “protein group”, because this food group provides many important nutrients, such as protein, iron, zinc, B vitamins.
Figure 48: FAOSTAT for 2019, showing estimated food supply quantity for Aotearoa New Zealand
Red meat Pork
Poultry
Dairy Grain
Legumes, nuts, seeds
Eggs Fish and shellfish
Vegetables Fruit
Figure : The recommended number of servings per day from each of the food groups for adults in different age groups (Ministry of Health, 2020a, p.5)
To determine average food consumption, the recommended number of servings per day from each of the food groups for men and women in the aged groups 19 ) are multiplied by the standard serving weights provided for different types of food within each food group within the same document (Ministry of Health, 2020a).
For example, in the protein group, a standard serving is 500–600 kJ, and is explained as being about the same as:
• 1 cup (150 g) cooked or canned beans, lentils chickpeas, or split peas (preferably with no added salt)
• 170 g tofu
• 30 g nuts, seeds, peanut or almond butter or tahini or other nut or seed paste (no added salt)
• 100 g cooked fish fillet (about 115 g raw) or one small can of fish
• 2 large (2 x 60g=120g) eggs
• 80 g cooked lean chicken (100 g raw)
• 65 g cooked lean meat such as beef, lamb, pork, veal (90–100 g raw) – no more than 500 g cooked (700–750 g) red meat each week.
Taking the weights listed above, the raw food weight is always used and where there are two or more weights, the weight is averaged out and multiplied with the number of servings per day, and then averaged across the food group, thus determining MOH’s recommended average food consumption.
Aotearoa New Zealand Ministry of Health (MOH) provides “Eating and Activity Guidelines for New Zealand Adults” (Ministry of Health, 2020b), with “New serving size advice” that explains serving sizes from each food group for different age ranges and gender (Ministry of Health, 2020a). It is important to note that the data from MOH is not directly comparable to other data as it is a ‘recommended’ food consumption and not consumed (e.g. FAOSTAT).
Dairy products are described as low or reduced fat fresh milk, UHT (Ultra High Temperature) long-life milk, reconstituted powdered milk or buttermilk, or calcium-fortified plant-based milk alternatives, lowor reduced-fat yogurt and cheese. It does not include foods made from milk that have little calcium and a high fat content, such as cream cheese, sour cream, cream, and butter (all of which are included in the FAOSTAT data and cannot be separated out).
The protein group includes a wide range of food categories: nuts and seeds (including nut butters), legumes (such as beans, lentils, chickpeas, split peas), fish, eggs, chicken, lamb, beef and pork.
MOH advice is quite specific for different genders and ages, therefore, it is possible to separate out different groups based on eating habits. For example, tamariki (children 0-14 years) of both genders are similar and eat less than adults, people over the age of 70 years (both genders) are encouraged to eat more dairy (for the calcium) and less grains, whilst adult males and females are different and eat encouraged to eat different amounts of the different food groups. An exception is the amount of milk products (low fat liquid milk, cheese and yogurt) recommended for over 50-year-old women, which is nearly double the recommended amount compared to women under 50 (2.5 servings for under 50 and 4 servings for over 50), which carries through into the over 70-year category. “Increased consumption of milk and milk products is recommended for women over the age of 50 to help maintain bone density and reduce the risk of osteoporosis after menopause” (Ministry of Health, 2020a). Therefore, to compare these categories with population data, the following groups of people are used:
• Tamariki / Children (0-14 years).
• Wahine / Adult females (15-69 years).
• Tāne / Adult males (15-69 years).
• Kaumātua & Kuia / Senior people (over 70 years).
Calculations based on the MOH advice regarding the serving size and number of servings per person shows the approximate percentage of different food groups required for all people across different ages and genders and is shown in Figure 50.
Percent of consumption of food group by gender and age
Figure 50: Approximate percentage of different food groups required for all people across different ages and genders
Figure 50 shows that the patterns of consumption for the five different food groups are relatively similar, with dairy increasing for adult females and those over the age of 70 years. Grain consumption reduces for over 70-year-olds.
MOH also includes additional serving data for each group, show in Figure 51 as (+).
MOH recommended food consumption by gender and age group with additional serving data (+)
Figure 51: Data calculated from MOH with additional serves (+) shown in kg per person per year
With the additional servings added (see Appendix One for further detail on additional servings, Figure 49), the total amounts for each of the groups of people can vary by 11-16%. This additional data makes up the “+” amounts in the graph, as follows:
• Tamariki / Children = 463-519 kg/yr.
• Wahine / Woman = 589-668 kg/yr.
• Tāne / Men = 594-705 kg/yr.
• Kaumātua & Kui / Senior people = 598-670 kg/yr.
In summary, it is estimated that average food consumption based on the MOH recommended diet ranges from 463 kg per year (for children) to 705 kg per year for adult males.
MPI TDS Dataset
The simulated diet created in the MPI Total Diet Study (TDS) is designed to reflect the typical food consumption patterns of New Zealanders. The process for developing this "total diet" involves several key steps to ensure the quantities of food items (in grams) are as accurate and representative as possible. MPI bases the food selection and portion sizes on national dietary intake surveys, such as the
Wahine/Women
Tāne/Men Kaumātua & Kui / Over 70 Yrs
Tamariki Tamariki (+) Wahine Wahine (+)
Tāne
Tāne (+)
Kaumātua / Kui Kaumātua / Kui (+)
New Zealand Adult Nutrition Survey (2008/09) and Children's Nutrition Survey. These surveys gather detailed information on the types and amounts of foods eaten by different population groups over time. The data includes what people eat daily, including how much of each food type (e.g., vegetables, meat, dairy) they consume.
Next, the foods are grouped into categories that reflect common eating patterns. For example, bread, cereals, vegetables, fruits, dairy products, meat, fish, and beverages are typical food groups. Within these categories, specific foods are selected based on popularity and representativeness of the diet.
Once representative food items are selected, the portion sizes (in grams) are calculated based on:
1.1. Average consumption data from the national dietary surveys.
1.2. Adjustments to represent all age groups in the population, typically dividing the population into demographic groups (e.g., children, adults, elderly).
1.3. Inclusion of common preparation methods (e.g., cooked vs. raw), which might affect the weight of certain foods.
In the TDS, the foods are collected, analysed, and reported in “composite” samples. Composite samples combine several individual food items into one analytical sample. This allows for an average assessment of contaminants, nutrients, and residues. For instance, the "vegetables" category might combine different vegetables based on their relative consumption in the diet. The specific grams per food item listed in the appendices of the TDS represent an average daily intake for each food category. These are calculated from the survey data and are meant to reflect real-world consumption. For example, if the average adult consumes 200g of bread daily, that amount is included in the diet for analysis. This approach ensures that the total diet closely mirrors what New Zealanders typically eat.
To account for varying dietary needs across different age groups (e.g., children, adolescents, adults, elderly), MPI uses weighted averages to ensure that the quantities of food in the study reflect each demographic’s contribution to the total diet.
The accuracy of these calculations depends on:
1.4. Regular updates to dietary surveys, which ensure the food consumption data reflects current trends.
1.5. Robust sampling methods, where foods are sourced from different regions to account for variability in food availability and consumption across New Zealand.
1.6. Food preparation methods that reflect typical practices (e.g., peeling, cooking), ensuring the study matches real-life scenarios as closely as possible.
It is important to note that the TDS includes some foods such as ‘pizza’, or ‘sushi’ as well as cooked biscuits and other baked goods that are not included in other datasets. As they are predominantly grainbased products, they are included in the ‘grains’ category, which could be artificially inflating the category.
A note on fish and shellfish consumption
Data on fish and shellfish consumption comes from the same datasets as the rest of the food types. However, fish and shellfish data can also be validated against the FAO report on The State of World
Fisheries and Aquaculture (2020)14 It is noted that the figure of 20-30 kg per capita per year for Aotearoa New Zealand is published in a report by the FAO.
Fish consumption per capita for the Waikato Region is estimated at 20 kg per person per year. This figure is based on the average of the three datasets examined (FAOSTAT, MOH and MPI’s TDS)
5.2.2 Comparing FAOSTAT, MOH and MPI Datasets
When comparing these datasets, it is important to remember that MOH is a recommended diet, FAOSTAT is the food supply quantity for the country and the MPI TDS is an estimated diet created for five different groups of people. Due to the way the datasets are published, the MPI data can be categorised into the same food types as the FAOSTAT data and can be directly compared, refer to Figure 52
MPI 2016 Adult Females of Pacific Island ethnicity
MPI 2016 Adult Males of Pacific Island ethnicity
MPI 2016 Young Adult Males FAOSTAT 2016 FAOSTAT 2019
The biggest difference between MPI and FAOSTAT datasets can be seen in the categories of vegetables, dairy (milk, cheese and yogurt), and grain in Figure 52 above.
FAOSTAT datasets are higher for vegetables, showing 55 kg per person per year more than the MPI dataset (Adult Males of Pacific Island ethnicity). Also, FAOSTAT 2019 is 37 kg per person per year more for dairy than the highest amount from the MPI dataset (Adult Males).
It is important to note there is the most variation in what is included in the dairy category than other categories, it is expected that differences between datasets will be seem. The grain category is lower by 53 kg per person per year for FAOSTAT than MPI’s Young Adult Males.
Figure 52: MPI TDS 2016 compared to FAOSTAT 2016 and 2019 dataset
Red meat Pork Poultry
milk, cheese, yogurt
butter, cream Grain Legumes, nuts, seeds Eggs Fish and shellfish Vegetables Fruit Kg
Table 19: MPI and FAOSTAT datasets estimated total annual food consumption in kg
Dataset / group of people / year
Adult Females 2016
Table 19 shows relatively similar estimated total consumption figures with the lowest being MPI’s Adult Females (438 kg) and the highest being MPI’s Young Adult Males (639 kg). FAOSTAT fit somewhere in between both these groups of people.
To compare the MOH data with these datasets, some of the food types need to be merged into food groups. The following graphs show a comparison of the three datasets with respect to Wahine (Figure 53) and to Tāne (Figure 54).
MPI 2016 Adult Females
FAOSTAT 2016
MOH 2020 Adult Female
MPI 2016 Adult Females of Pacific Island ethnicity
FAOSTAT 2019
MOH 2020 Adult Female (+)
53: Three datasets compared across the years 2016-2020 for Adult Females only
Figure 53 shows some variations between the datasets in all five of the food groups. MPI data shows less vegetables and less dairy is consumed. FAOSTAT data is averaged between the other two datasets except for the protein group, where it shows more than both other datasets is consumed per person per year. The graph shows MOH data being higher in categories of fruit and dairy (this is a recommended diet). It is important to note, the dairy category for MOH datasets does not include high fat products (full fat milk, yogurt, cream or butter) whilst both MPI and FAOSTAT do not differentiate between full or lowfat dairy products.
Figure
Wahine / Adult Females across all datasets
Tāne / Adult Males across all datasets
MPI 2016 Adult Males
MPI 2016 Young Adult Males
FAOSTAT 2019
MOH 2020 Adult Man (+)
MPI 2016 Adult Males of Pacific Island ethnicity
FAOSTAT 2016
MOH 2020 Adult Man
Figure 54: Three datasets compared across the years 2016-2020 for Adult Males only
The first three bars of the graph (Figure 54) are for adult males from the MPI study (and includes young adult males).
The MPI data has less vegetables than both the FAOSTAT and MOH data, more fruit than FAOSTAT but less than MOH, and significantly more grain than FAOSTAT and MOH data. The MOH dataset includes more dairy than both the MPI and FAOSTAT data.
To calculate the food requirements for the Waikato Region’s populations, the three databases from FAOSTAT, MOH and MPI (described above) have been averaged for female/wahine and for male/tāne. The data from FAOSTAT provides food supply quantities which can be used as a measurement to represent the average amount of food available for consumption per person in a given country or region over the course of one year. This figure is typically expressed in kilograms per capita per year. In 2020, the MOH provided serving size advice in combination with eating and activity guidelines for each food group for different age ranges and gender. MPI’s Total Diet Study (2016), provides per capita estimates of typical diets for different groups of people and gender.
Both MPI and MOH datasets have at least two sets of data for male and for female. FAOSTAT do not distinguish between male and female. For FAOSTAT the 2016 and 2019 datasets are similar but not the same. Therefore, to calculate the composition of the five main food groups for adult females, six datasets are used (two from FAOSTAT, two from MOH and two from MPI) and multiplied by the population of the adult females in the Waikato Region. Four datasets (two from MOH, and two from MPI) are used to work out the percentage of each food type in the protein group and applied to the adult female composition for protein, which provided an average estimated food consumption for adult females in the Waikato Region, see the diagram in Figure 55
Adult males are treated similarly, however, three datasets from MPI are used as young adult males are part of the adult male group, combined with the two datasets from MOH and FAOSTAT an estimated average male food consumption figure is determined.
Children under 15 years old and seniors over 70 years old are worked out slightly differently, due to the available data. Both are based on the MOH data, which focuses on different age ranges and gender, the difference between children and adults is worked out as a percentage of the combined average adult estimate food consumption by food type. Then the percentage of children in the Waikato Region (by male and female) is applied to the figures for male and female adult estimated figures (described above) and multiplied by the percentage difference for children for each food type. The same is done for the seniors. Therefore, the estimated food consumption for four different groups of people is shown in Figure 56.
Estimated average food consumption built from three datasets (MPI, MOH and FAOSTAT)
56: Estimate average food consumption for the four groups of people determined from three datasets
Children are estimated to consume 457 kg per person per year, adult females 569 kg, adult males 625 kg and those over 70 years 572 kg per person per year (accounting for the significant increase in dairy consumption recommended by MOH).
To create an estimated average food consumption across food types that can be used to calculate total food consumption, the data for a child is multiplied by the percentage of children (0-14 years) in the Waikato Region, the adult females, males and seniors are multiplied by the percentage of adult females,
Figure 55: Example of working out the estimated average food consumption for the adult females in the Waikato Region
Figure
Average Tamariki Average Wahine Average Tāne Average Kaumātua / Kui
males and seniors across the Waikato Region. This provides one figure that can be used as the estimated average food consumption per capita per year for the Waikato Region (Table 20).
Table 20: Estimated average food consumption for tamariki, wahine, tāne, kaumātua/kui and average person per year for the Waikato Region (due to rounding, the numbers may not sum perfectly)
5.2.4 Validating Waikato Region’s Estimated Average Food Consumption
Our estimate of food consumption per year for a person in the Waikato Region was compared with food consumption estimates from four other data sets:
1. OECD-FAO - Meat consumption data only 2020.
2. MPI Total Diet Study (for five different groups of people) 2016.
These datasets can be compared as the data is formatted similarly and is shown in Figure 57.
Comparison across all datasets
OECD-FAO Meat consumption data 2020
MPI 2016 Adult Females of Pacific Island ethnicity
MPI 2016 Adult Males of Pacific Island ethnicity
FAOSTAT 2016
Otago Food Consumption 2016
Figure 57: Comparison between multiple datasets
MPI 2016 Adult Females
MPI 2016 Adult Males
MPI 2016 Young Adult Males
FAOSTAT 2019
Waikato Food Consumption 2024
Figure 57 compares the results of four other datasets across the ten food types. Included in the graph is the “Waikato Food Consumption 2024” dataset (in red), which is described in the section above and illustrated in Figure 13 (page 13).
The aim of the comparison is to see how the “Waikato Food Consumption 2024” compares to the other datasets. The “Waikato Food Consumption 2024” sits within the range created by the other datasets.
Note that the MOH datasets (described above) and data from the New Zealand Adult Nutrition Survey 2008/2009 are not used in this comparison, as the data is not presented in a similar format. The data from OECD-FAO (2020) shows meat consumption in the country only, so is only the first three bars of the graph.
5.2.5 Limitations
of the Food Consumption Data
This research utilises a diverse of range of data sets describing food consumption. While there are differences between them, our methodology of combining them provides more balanced results than using any one source of them in isolation. The nature of the data sources did not enable statistical analysis to determine error bounds for our estimate so instead estimates for different groups were established: e.g. children and adults, and by gender. Nevertheless, the data used in this report has limitations, the main ones of which are listed here:
Inaccuracies in data sources: National data submitted to the FAOSTAT excludes food that is not purchased (home grown, mahinga kai or traded for example) but includes food consumed by tourists (not local population).
Difference between milk products and dairy products: FAOSTAT and MPI TDS both include all products within the dairy family, such as liquid milk, cream, and butter. MOH excludes high fat dairy products, such as cream and butter. Our approach to matching dairy and milk products from these sources was imperfect but the impact of this on our results will be insignificant.
Exclusion of "beverages" and "other": The exclusion of "beverages" and "other" categories in the MOH data could contribute to inaccuracies in the data. Oils are included in the MOH “additional servings” but have not been separated out in in this report. These categories may also include items like tea, coffee, cocoa, wine, beer and fermented drinks, oils, fats, offal meat, confectionary, sweeteners, and spices, that are part of the FAOSTAT total food supply but are not included in the ‘Total Estimated Consumption’ dataset, due to them being too difficult to calculate.
Data sources: Different data sources, methodologies, and assumptions are used to compile the ‘Total Estimated Consumption’ data. The MOH's dietary recommendations are based on nutritional guidelines but do not separate out all the different food types required to create a comprehensive ‘Total Estimated Consumption’ dataset. The FAOSTAT dataset has a few anomalies (such as the 2011 double amount of dairy consumed) which also makes it unreliable as the sole ‘Total Estimated Consumption’ dataset. The MPI TDS is potentially the most reliable of data sources as each food group is separated out into grams per person per day for groups of people of different ethnicities. However, TDS includes cooked meal anomalies such as pizza (11-18 g per day) and sushi (3-5 g per day), where all other datasets focus on raw food only.
Food consumption from people of different ethnicities: The MPI TDS has food consumption data for Pacific Island ethnicity as well as a generic data set. However, due to the way the Waikato regional food consumption is worked out (based on the number of children, females, males and over 70-year-olds there are in the region), the ethnicity data has been included in our calculations but not separated out as stand-alone results.
Exclusion of processed foods: MOH and FAOSTAT do not include processed food, which is included in the Adult Nutrition Survey data. Processed foods must be made from raw ingredients, both the MOH and FAOSTAT data present results of raw food only.
Differences in years: Data from the Adult Nutrition Survey is from 2008/2009, which is ten years difference to the FAOSTAT data (2019) and 12 years different to the MOH 2020 recommendations, this can result in variations due to changing consumption patterns over time.
Types of meat: Data from OECD-FAO and the Adult Nutrition Survey highlight variations in meat consumption patterns among different types of meat, such as beef, sheep (lamb and mutton), pork, and poultry, whilst MOH groups all protein products together. The process of analysing the data could have resulted in errors whilst trying to match types of meat across datasets.
Research results differ: Data on vegan, vegetarian and meat-eating diets has been published in Public Health Nutrition (Greenwell, et al. 2023). According to the latest analysis of data from the New Zealand Health Survey, 93% of Aotearoa New Zealanders eat red meat, 2.9% do not eat red
meat, but do eat seafood and poultry, 1.4% are pescatarians (no red meat or poultry, but do eat fish), 2% are true vegetarians (no meat or seafood at all) and 0.7% are true vegans (no meat, seafood or animal-derived products such as dairy). These figures are significantly different to the Kantar reports (2020 and 2022).
Mahinga kai, hunted, gathered and homegrown food: As indicated above, FAOSTAT data may not fully capture food grown at home, whether on farms or in back gardens, nor does it capture any information on the amount of mahinga kai or food hunted or gathered from land or ocean. Mahinga kai and homegrown produce often falls outside the scope of official statistics, which could lead to an underestimation of the FAOSTAT total food supply.
5.3 Factor III: Evaluation of the Different Land Use Types
The AgriBase® land-use dataset is used to spatially evaluate land use across the project area. The AgriBase® dataset is selected as the most appropriate and reliable dataset for this research and is purchased from AsureQuality Limited accordingly (note, there are limitations with the dataset, as outlined in Limitations on page 67).
The AgriBase® dataset is imported into ArcInfo, a fully featured Geographic Information System (GIS). The dataset overlaid existing topographic information sourced from the publicly available Google Earth data. Adjustments are made to the GIS layers, ensuring accuracy of alignment of the two layers.
5.4 Factor IV: Food Production Estimates
Factor IV is the approximate food weight produced from the primary production systems in the Waikato Region.
5.4.1 Animal Production Systems Analysed
The weight of food produced is estimated by creating eight models, one for each of the main primary types of animal production in the region, including eggs and aquaculture
The following sources of food production are modelled:
• Dairy cow farming
• Sheep and beef farming
• Beef farming
• Deer farming
• Poultry farming for eggs and meat
• Pig farming
• Dairy goats and sheep
• Aquaculture
Production data provided by various industry bodies within the primary sector is the primary source of information where available. AgriBase® data provided areas of production if no area was provided in the industry statistics. Animal numbers are cross checked with StatsNZ data.
The following sections describe each of the production models.
Dairy cow farming system
The dairy farming model is based on owner-operated seasonal supply dairy farms which make use of a run-off dairy grazing block. Dairy farm productivity information and cow numbers are drawn from Livestock Improvement Corporation15 and Dairy NZ16 Dairy cow numbers are compared with those from StatsNZ 17 Stock units and farm production are calculated across the total farm area rather than the effective area because these non-productive areas are an intrinsic part of the overall farm.
Characteristics of the dairy model are shown in Table 21
Table 21: Dairy farm productivity information
Dairy products have been analysed as kilograms of milk liquid. This differs from the common milksolids measurement which relates to the solid fraction of fat and protein remaining after the water fraction is removed from milk.
The replacement rate on dairy farms is assumed to be 22% and the cows culled are assumed to weigh 480kg and are included in the figure of red meat produced. Calves that are surplus to replacement requirements are assumed to be sold to beef farms.
Sheep and beef farming system
The commercial sheep and beef cattle farming system is dependent on farmer’s managing a herd of breeding animals, which are only culled for consumption at a time when they are considered to be unfit for purpose. That is, the breeding livestock are normally retained for breeding, rather than for consuming. Primarily, it is the offspring of these breeding stock that are sold each year for consumption.
The sheep and beef farm model is based on production information from the Beef and Lamb Economic Service Farm Survey data for class 4 hill country in the northern North Island (Northland, Waikato, and Bay of Plenty) 18 . Production information is applied to the area of farmland identified in AgriBase® as “extensive sheep and beef farming” and “extensive sheep farming”, collectively 517,615 total ha.
An assumed 85% of this extensive farming area is “effective”, i.e. carried livestock, and 15% is un-grazed such as forest, scrub, or areas unable to be grazed. This “effective” land is stocked at 8 stock units per hectare with a 30:70 mix of stock units for sheep and cattle. The breakdown of stock units for each stock type is shown in Table 22
Table 22: Stock units for pastoral farming models
An assumed death rate of 4% in lambs and calves and 3% in adult stock is used.
An assumed dress out percentage for carcasses is 45% for lambs, 40% for cull sheep, and 53% for beef based on a review of dressing out percentage in New Zealand livestock 19 .
An assumed 70% of the carcass weight for sheep and for beef is recoverable meat based on the figure of 75% for beef20 .
Farm production characteristics are shown in Table 23 Stock units and farm production are calculated across the total farm area rather than the effective area because these non-productive areas are an intrinsic part of the overall farm
Table 23: Sheep and beef cattle farm productivity information
Beef farming system
The beef farm model is based on production information from the Beef and Lamb Economic Service Farm Survey data for class 4 hill country in the northern North Island (Northland, Waikato, and Bay of Plenty) 21 . Production information is applied to the area of farmland identified in AgriBase® as “extensive beef farming”; 162,076 total ha.
An assumed 90% of this extensive farming area is “effective” and 10% is un-grazed such as forest, scrub, or areas unable to be grazed. An assumed stocking rate of 12SU per total hectare, carcass weight of 500kg, carcass dress out percentage of 53% and that 70% of the carcass is recoverable meat.
In essence, this resulted in 266 beef cattle per 100 hectares, half of which would be processed in a year (R2) and the other half (R1) processed the following year.
Deer farming system
The deer farm model is based on stock units22 and production levels23 available from Deer Industry New Zealand 24 . It was assumed to have both a venison production system and a velvet antler production system, each representing 50% of the total stocking rate of 12SU/total hectare Weaner deer are assumed to be processed at 105kg liveweight, have carcass weights 55% of liveweight and a recoverable meat fraction of 70% of carcass weight.
In AgriBase®, the area used for deer farming and the area used for goat farming are combined into a single figure for ‘deer and goats’. Due to research available, the deer model is applied to the single figure for deer and goats Goat farming is not represented as a specific model. On this basis the assumption that the production of meat from goat farms is the same as from deer farms.
Poultry farming system
Poultry production for both broiler and egg production is sourced from the New Zealand Poultry Association 25 to model the industry structure of breeding and finishing birds and the total amount of chicken meat and eggs produced. Turkeys and ducks are identified in the AgriBase® data but at such small numbers relative to chickens that they have not been included in our analysis
Pig farming system
Pork production information is sourced from New Zealand Pork26 and AgriBase® data. Data includes the number of sows in the region, the reproductive performance of the sows, and the liveweight and dress out percentage of progeny at slaughter. It is assumed that the meat fraction of the carcass is 70%.
The number of dairy goats, the area used for farming them, and per animal productivity are sourced from the Dairy Goat Cooperative.27
For dairy sheep, an assumed figure, similar to dairy goats is used, as the Dairy Sheep industry has not responded to requests for information.
Aquaculture
In terms of aquaculture, it seems that the region has developed high-value marine farming activities, and while finfish aquaculture is still growing, the shellfish production dominates.
Aquaculture production is based on the Waikato Regional Aquaculture Strategy where the region produced $91.6 million in aquaculture exports in 202328 . The report shows 300 hectares consented for fin fish and 1,572 hectares consented for shellfish (Figure 58) Output from the region is reported as 26% of the mussels and 23% of the oysters produced by New Zealand. The weight of these food products is derived from national seafood statistics 29 . The remainder of aquaculture value from the region is assumed to be finfish. A mass for this is estimated by dividing the remaining export value (after subtracting the value of oysters and mussels) by the average export value of aquaculture produce of $14/kg Figure
Fruit production is calculated for kiwifruit, an important product for the region and for which comprehensive industry information is available30 The weight of other types of food production is based on an average yield per hectare for avocado, citrus, and pip fruit from Fresh Facts which is summary production information produced by New Zealand’s fresh fruit and vegetable industry31 . This average yield is applied to the number of hectares indicated in AgriBase® as disaggregated production land32 that are fruit production other than kiwifruit.
Vegetable production
Vegetable production is calculated based on two types of vegetable. The first type is root vegetables, represented by potatoes and onions, the second type is vegetables grown above the ground, represented by pumpkins, lettuces, and broccoli. The average yield per hectare for each of these types33 is multiplied by the respective hectares (disaggregated) in AgriBase®. This methodology is used to reflect a middle ground between the fact that yields vary between vegetable types and the fact that set rotations of vegetables are often followed. This latter fact means that numerous types of vegetable could be present on a land parcel depending on the year and that the exact amount could not be determined with accuracy.
Legume production
The yields and areas of beans and peas are from Fresh Facts32 and are used as a generic estimate for the production of legumes, acknowledging that neither Fresh Facts nor AgriBase® specify the exact type of legume being produced.
Nut production
Yield estimates for hazel nuts34 (50% of the weight removed for shell), macadamia nuts35, and walnuts36 (50% of the weight removed for shell), are obtained and applied to the land area (disaggregated) reported in AgriBase®.
Grain crop production
From the AgriBase® data, assumption have been made that there is no arable land (grain crops) for human consumption within the Waikato Region, as industry-specific publications show no grains are
32 Disaggregated production land is the area of land planted with a crop, rather than the surrounding non-productive area assumed to be covered by tracks, sheds, etc., that found within a farm
produced in the Waikato Region. All arable land is used to grow grain crops for animal consumption (which is essential to produce dairy) and therefore arable land is combined in the dairy land use.
Honey Production
Honey is not actually included in the report, in the end, as it is not included in the food consumption data. Honey production is calculated using data from MPI’s 2020 Apiculture Monitoring Programme 37 which provides yields as 27.1 kg of honey per hive for the North Island (10-year average), overall yield for the North Island and the number of hives in the Waikato/King Country/Taupō area. The yields for the Waikato/King Country/Taupō are calculated based on the 2017 MPI report38 .
5.4.3 Export data assumptions
Dairy NZ says 95% milk is exported, see https://www.dairynz.co.nz/media/ddab00hj/inside-dairy-aprilmay-2023-web.pdf and https://www.dairynz.co.nz/media/3hcbhi0v/fontier-farm-fact-sheet-november2022-reduced.pdf
Beef and lamb NZ and MPI state: 90-95% of all red meat produced is exported annually (around 90 percent of beef and 95 percent of sheepmeat exported) see https://beeflambnz.com/markets/trade/trade-policy
“80% of our fruit is exported and about 80% plus of our vegetables are for domestic consumption,” said spokesperson for Horticulture NZ Andrew Bristol.
70-80% of honey produced is exported see MPI https://figure.nz/chart/jPhn59ZSuhXHZh7vtHnSNrSaz64TPTur
5% of eggs produced in New Zealand are exported see StatsNZ: https://figure.nz/chart/Y5S57y7mWR5oDWrX-oVO54QQfyvThSvNl
Approximately 20-30% of the chicken meat produced in New Zealand is exported see NZSTATS https://www.stats.govt.nz/topics/imports-and-exports
85% of the seafood caught in New Zealand being exported (https://www.seafood.co.nz/news-andevents/news/detail/record-export-revenue-for-seafood and https://www.aquaculture.org.nz/newsarticle/record-mussel-salmon-exports-2023)
New Zealand exports approximately 85% of the onions grown in New Zealand. https://www.onionsnz.com/about-onions-nz/facts-and-figures/?utm_source=chatgpt.com
Around 25% of the total potato crop is exported, with a significant portion of these exports being frozen processed products, particularly to Australia, which accounts for over 75% of New Zealand's frozen processed potato exports https://potatoesnz.co.nz/exporting/export-statistics/
6 Appendix Two: GIS Spatial Evaluation of Land Use
The GIS spatial evaluation of land use across the project area usedthe dataset widely regarded as the industry standard within the primary sector. The following data is supplied as part of the purchased AgriBase® dataset.
6.1 Data Supply Specifications
6.1.1 Farm Identification
Each farm within the study area is allocated an identification character, and has total farm size quantified, and the predominant land use categorised, these are shown in Table 24.
farm_id Unique farm identifier assigned by AsureQuality Limited
size_ha Total area of the property in hectares as reported by farmer/occupier, rounded to one decimal place type The predominant land use on the property (refer to the Farm Type Descriptions in Table 25)
6.1.2 Farm Type Descriptions
Based upon information that the landowner submits to AsureQuality Limited, each farm is assigned a farm type code. The farm type code represents the predominant land use on that property. The codes are described in Table 25
Table 25: Farm Type Descriptions Farm Type Code Description
ALA Alpaca and/or Llama breeding
API Beekeeping and hives
ARA Arable cropping or seed production
BEF Beef cattle farming
CAR Calf Rearing
DAI Dairy cattle farming
DEE Deer farming
DOG Dogs
DPL Dairy Plant/Factory
DRY Dairy dry stock
EMU Emu bird farming
FIS Fish, marine fish farming, hatcheries
FLO Flowers
FOR Forestry (harvested)
FRU Fruit growing
Farm
Type Code Description
GOA Goat farming
GRA Grazing other people’s stock
HOP Hop Growing
HOR Horse farming and breeding
LIF Lifestyle block
MPL Manufacturing Plant
MTW Meat slaughter premises
NAT Native bush (not harvested)
NEW New record - unconfirmed farm type
NOF Not farmed (ie idle land or non-farm use)
NUR Plant nurseries
OAN Other livestock (not covered by other types)
OPL
Other planted types (not covered by other types)
OST Ostrich bird farming
OTH Enterprises not covered by other classifications
PIG Pig farming
PKH Packhouse
POU Poultry farming
RAB Rabbit breeding and farming
RES Residential livestock on property
RET Retail
SAW Sawmill
SHP Sheep farming
SHW Showgrounds
SLY Salesyard
SNB Mixed Sheep and beef farming
SPO Sport Grounds
TOU Tourism (ie camping ground, motel)
TRD Transport / truck depot
UNS Unspecified (ie farmer did not give indication)
VEG Vegetable growing
VIT Viticulture, grape growing and wine
ZOO Zoological gardens
6.2 Dataset Limitations
AgriBase® data is the most comprehensive source of spatial information for the primary sector at the national scale, but it has several limitations. Data is collected via a questionnaire. Interpretation of the questionnaire varies, especially in determining the dominant farm type with multiple land uses. For example, criteria for determining the dominant farm type poses challenges, such as economic return, land area, or the landowner's preference for classification, are not clearly defined. Despite improvements in the questionnaire over the years, significant omissions persist, including details on grazing stock owned by others and discrepancies in stock numbers provided. Respondents provide
varying levels of detail, with inconsistencies like a farm specified as predominantly sheep (SHP) having more beef cattle than sheep.
Crop turnover creates problems as each year can be different and if this information is not kept up to date, then horticultural crops are immediately incorrect.
Updates from AsureQuality have not been provided, and after ground truthing some large properties, not every farm is updated. Moreover, AgriBase® is found to have overlapping polygons, potentially leading to double counting, with errors or shared land use by different enterprises. These are corrected as much as possible for the Waikato Region, however, there could be errors with the AgriBase® data.
7 References
Beef + Lamb NZ. (2020). The Role of Red Meat in Healthy and Sustainable New Zealand Diets. March 2020. Foodcom
Beef + Lamb NZ. (2022). Red Meat Report. December 2022. Issues 05. Meat Industry Association
FAO. (2020). The State of World Fisheries and Aquaculture: Sustainability in Action https://www.fao.org/documents/card/en/c/ca9229en (accessed on 24th September 2024)
FAOSTAT. (2023). TradeSTAT http://www.fao.org/faostat/en/#data/FBS (accessed on 18 August 2023)
Greenwell, J., Grant, M., Young, L., Mackay, S., Bradbury, KE. (2023). The prevalence of vegetarians, vegans and other dietary patterns that exclude some animal-source foods in a representative sample of New Zealand adults. Public Health Nutrition. 2023:1-24. doi:10.1017/S1368980023002677
Millar, R., Lawton, E., and Bould, N. (2016). The Otago Food Economy. Ahikā Consulting and Otago Polytechnic
Ministry of Health. (2020a). New serving size advice for New Zealand Adults. November 2020. Wellington: Ministry of Health
Ministry of Health. (2020b). Eating and Activity Guidelines for New Zealand Adults: Updated 2020. Wellington: Ministry of Health
Ministry of Health. (2022). Adults’ Dietary Habits – Findings from the 2018/19 and 2019/20 New Zealand Health Survey. Wellington: Ministry of Health
Ministry for Primary Industries (MPI). (2022). Apiculture monitoring data. Retrieved from https://www.mpi.govt.nz/resources-and-forms/economic-intelligence/farm-monitoring/#apiculture (accessed 18 September 2023)
Ministry for Primary Industries (MPI). (2016). 2016 New Zealand Total Diet Study (NZTDS). Retrieved from http://www.mpi.govt.nz/news-and- resources/publications/ (accessed 28th August 2024). Ministry for Primary Industries, PO Box 2526, Wellington 6140, New Zealand
Ministry for the Environment. (2007) Environment New Zealand 2007 - second national state of the environment report. Ministry for the Environment (MfE), Manatū Mō Te Taiao, PO Box 10362, Wellington, New Zealand
OECD-FAO. (2020). OECD-FAO Agricultural Outlook 2020-2029. OECD Publishing. Paris. https://doi.org/10.1787/08801ab7-en (accessed on 26 September 2023)
University of Otago and Ministry of Health. (2008/2009). New Zealand Adult Nutrition Survey data tables 2008/2009. From A Focus on Nutrition: Key findings of the 2008/09 New Zealand Adult Nutrition Survey Wellington: Ministry of Health, 2011.
Waikato Regional Foodshed, 2024
300,000
566kg
Estimated annual food quantity per person for a healthy diet.
4%
Of dairy produced in the Waikato is needed to meet local demand, leaving a surplus of 1.6 million tonnes.
Chicken meat
Has the highest output per hectare among all food types.
93%
Of all food produced in the Waikato, by tonnage, is milk.
All statistics are estimated on an annual basis, unless stated otherwise.
Of agricultural land use is for dairy production. 46%
7m
Tonnes of all foods the Waikato region produces every year.
Of Waikato’s land (1.4 million hectares) is used for food production. 57%
Tonnage of food per year needed to feed Waikato’s 522,600 residents.
7%
Of the region’s red meat production would be needed to meet local demand, resulting in a surplus of 180,000 tonnes per year.
Waikato does not produce
Enough grain, legumes, nuts, fruit, pork, and aquaculture to meet local demand.
51%
Of agricultural land use is for red meat production.
0.4%
Of food-producing land is used for fruit, vegetables, nuts, and legumes.
2.5m
The total area of the Waikato Region (hectares).
A foodshed analysis is a report that provides information on the current estimated amount of food needed to feed the population residing within the study area and compares it to the estimated amount of food produced within the study area.
Map showing the food producing land use across Waikato Region (high level data from AgriBase®