THE GROUP ANNUAL REPORT
36–39 Administration report
40 Consolidated income statement and other comprehensive income for the Group
41–42 Consolidated statement of financial position for the Group
43 Report on changes in equity for the Group
44 Consolidated statement of cash flows for the Group
45 Supplement to consolidated statement of cash flows for the Group
46 Income statement for the Parent company
47–48 Financial position for the Parent company
48 Report on changes in equity for the Parent company
49 Cash flow statement for the Parent company
49 Supplement to the cash flow statement for the Parent company
50–64 Accounting principles and notes to the accounts
63 Pledged assets and contingent liabilities for the Group and the Parent company
64 Signatures 66-67 Auditor’s report
68 Key figures and definitions
71 Addresses
35
ANNUAL REPORT
ADMINISTRATION REPORT
The business in brief
The Group Volito AB (556457-4639) is the Parent company in a Group that conducts operations in the business areas Real Estate, Industry and Portfolio Investments.
Volito Fastigheter owns and manages commercial and residential properties in the Malmö region. Business Area Industry consists today of Volito Automation, an operation that invests in companies within, among other things, industrial automation. Within Business Area Portfolio Investments, Volito has significant ownership interests in both listed and unlisted companies.
The year in brief
The year was characterised by major challenges, mainly linked to the global economy and the continuing turbulent geopolitical situation. High interest rates, driven by inflation, have also had a negative effect on the business climate.
Despite this, Volito can look back on a year of stable development in which Volito’s business areas have been able to focus on further strengthening their positions and continuing to pursue their set expansion plans.
For Volito Fastigheter, the year entailed reduced market values, but also strong leasing and continued high demand. Work also continued on reducing the company’s climate impact. The economic situation led to challenges in the form of high inflation and rising interest rates.
Volito Industry continued its expansion and sums up a year with a high inflow of orders, increased turnover and enhanced financial results. Expansion in Finland brought a further acquisition, as a platform for continued development in electrification.
Overall, the companies in Volito’s investment portfolio have shown good development. Despite a challenging year, each of the companies reports satisfactory financial results and a good financial position.
At year-end, the Volito Group’s adjusted equity amounted to SEK 5 078.6 million (4 949.9).
Income
The Group’s turnover amounted to SEK 1 029.4 million (864.9). The operating profit was SEK 152.3 million (127.2). The increase in both turnover and operating profit was mainly attributable to the Volito Industry group where acquisitions in 2022 and 2023 made a positive contribution. In addition to this, organic growth was good in both the Swedish and Finnish operations.
The profit after financial income and expense was SEK 187.7 million (513.0). Volito’s profit participation in Bulten amounted to SEK 25.0 million (14.1). The result from other financial income and expense includes dividends, mainly from Peab and EQT, SEK 69.8 million (86.3), realised income and write-downs SEK -3.2 million (27.1), mainly from shares in Annehem Fastigheter and the EQT funds, as well as unrealised changes in value in the EQT funds SEK 88.6 million (323.8).
Taking into account the year’s investments and rebuilding, the unrealised change in value of Volito Fastigheter’s portfolio was SEK -146.9 million (-97.7).
Interest rate swaps are used for protection against interest rate risks relating to Volito Fastigheter’s borrowings. These are measured at fair value in the statement of financial position and unrealised changes in fair value of interest rate swaps of SEK -50.5 million (103.1), were reported in the profit or loss for the year.
The loss before tax for the Group amounted to SEK -9.7 million (518.4).
The value development of the Group’s portfolio investments led to a change in value of the holdings of SEK 15.9 million (-1 279.4) in other comprehensive income, as well as SEK 88.6 million (323.8) in the result from financial income and expense. The market values of the holdings are outlined in Note 33.
Financial position and cash flow
The Group’s balance sheet total amounted to SEK 8 624.6 million (8 644.8) and equity relating to the Parent company’s owners amounted to SEK 4 859.6 million (4 928.3).
The Group’s total cash flow amounted to SEK -52.6 million (+44.4). The cash flow from operating activities generated a surplus of SEK 119.9 million (114.7). The year’s net investments amounted to SEK -123.3 million (4.6). The net outflow from financing activities amounted to SEK -49.2 million (-74.9).
The Parent company
Operations
The Volito Group’s Business Area Portfolio Investments is administered and reported in Volito AB. Besides this, the Parent company manages group-wide functions for administration and finance.
Income
The turnover of SEK 7.2 million (5.5) relates primarily to the sale of services to other companies within the Group. The operating loss was SEK -53.2 million (-31.9).
The loss after financial income and expense was SEK -152.3 million (51.4). The weaker result mainly relates to write-downs of financial assets and increased interest rate costs.
The loss before tax amounted to SEK -104.6 million (75.4).
Financial position and cash flow
The balance sheet total amounted to SEK 3 235.6 million (3 371.9) and equity to SEK 1 788.5 million (1 936.5).
The total cash flow for the Parent company amounted to SEK -38.3 million (+37.8), of which the cash flow from operating activities amounted to SEK -56.2 million (65.9). The year’s net investments amounted to SEK 8.5 million (6.0), of which the largest investments concerned continued investment in EQT funds, SEK 21.9 million (24.8). In addition, included here are changes in the Group account at the bank. The cash flow from financing activities amounted to SEK 9.5 million (-34.1).
Real Estate Operations
Volito Fastigheter owns and manages properties in the Malmö region. The group’s strategy is to create a balanced property portfolio with a focus on attractive locations in the city centre.
Despite an economic situation with high inflation and rising interest rates, Volito Fastigheter can look back on a year of strong leasing and continuing high demand. Through long-term investments in our property portfolio and good customer relations, we create a secure basis for future profitability.
We see strong demand for flexible office solutions in which attractive shared spaces encourage cooperation and spontaneous interaction, but also an increasing need for smaller spaces for both online meetings and individual work.
Volito Fastigheter works actively to reduce the company’s climate impact. Our internal sustainability management includes operational optimisation and material selection.
Volito Fastigheter owns, together with Peab, the Hyllie Point group, which is operated as a joint venture.
The market value of Volito Fastigheter’s property portfolio was evaluated at year-end by an external assessor at SEK 3 408.6 million (3 485.0).
The vacancy rate at year-end was 11.9% (13.2%).
Income
Volito Fastigheter’s turnover amounted to SEK 192.3 million (166.0). The operating profit amounted to SEK 112.1 million (86.0).
The profit after financial income and expense was SEK 47.3 million (61.8). The income from participations in joint ventures, SEK -3.8 million (13.2), decreased. This was attributable to the market value of properties and
36
derivatives. Increased interest expense led to a net interest expense for 2023 of SEK -60.9 million (-40.1).
The result after changes in value for the year of investment properties and derivatives amounted to SEK -150.1 million (67.1). Adjusted for investments and rebuilding, the unrealised change in value of Volito’s own properties amounted to SEK -146.9 million (-97.7). Volito Fastigheter uses interest rate swaps as protection against interest rate risks relating to borrowings. These are measured at fair value in the statement of financial position and unrealised changes in the fair value of interest rate swaps amounting to SEK -50.5 million (103.1), were reported in the profit or loss for the year.
Financial position and cash flow
The balance sheet total amounted to SEK 4 028.5 million (4 209.3) and equity amounted to SEK 1 821.3 million (1 957.7). Operating activities generated a positive cash flow of SEK 67.5 million (35.4). The year’s net investments amounted to SEK -27.9 million (-15.2) and the cash flow from financing activities amounted to SEK -39.6 million (-20.1). Volito Fastigheter paid a dividend to Volito AB of SEK 9.0 million (9.0).
Industry Operations
Volito Industry, via the subgroup Volito Automation, acquires companies in industrial automation. The group’s ambition is to be the market leader in the Nordic region. Volito Automation has subsidiaries focused on hydraulics within several application areas. Using Volito Automation as a model, Volito Industry is to be expanded and diversified within the framework of the current expansion plan.
Business Area Industry continued its expansion and strengthened its position as a system integrator in automation, electrification and digitalisation. The year entailed a high inflow of orders, increased turnover and significantly enhanced financial results, but also challenges in the form of inflation, rising interest rates and major geopolitical turmoil.
In recent years, Volito Industry has considerably increased its market presence. In addition to our main areas in hydraulics, we have successfully expanded in new and emerging sectors such as electrification and control systems, and today the business area has 255 employees.
During the year, 100% of the Finnish company Lohjan Sähkö ja Automaatio, LSA, was acquired.
LSA, with operations in Lohja and Tampere, is a supplier of automation and electrical systems for industry. The investment marks a further milestone for Volito Automation and strengthens our role as a significant player in industrial automation solutions. LSA’s expertise in electrical automation complements our existing operations and the acquisition represents a strategic step in our growth plan. By integrating LSA in our portfolio, we can offer a more complete solution to our customers, and we regard LSA as a platform for continued expansion in Finland. The company contributed SEK 31.1 million to the group’s turnover and SEK 3.3 million to the group’s profit after tax in 2023. For further financial information, see Note 28.
Volito AB owns 95% and the Volito Industry group’s Managing Director owns the remaining 5% of the shares in the Volito Industry group.
Income
Compared with the previous year, turnover increased by 20% and for 2023 amounted to SEK 842.4 million (700.2).
The operating profit before depreciation was SEK 96.3 million (76.0) and after depreciation SEK 92.9 million (72.5). Volito Industry generated a profit after financial income and expense of SEK 80.0 million (57.7).
Financial position and cash flow
The balance sheet total amounted to SEK 631.9 million (648.4) and equity to SEK 159.5 million (100.0).
Operating activities generated a positive cash flow of SEK 59.5 million (8.0). The year’s net investments amounted to SEK -34.0 million (-71.1) and cash flow from financing activities amounted to SEK -39.9 million (+69.7). The total cash flow for the year was SEK -14.4 million (+6.6).
Portfolio Investments
Within Business Area Portfolio Investments, Volito has significant ownership interests mainly in listed companies. Volito has an ownership philosophy of involvement that focuses on stable, long-term growth. The Group strives for active ownership with involvement on the companies’ boards. The portfolio consists of Volito’s holdings in Peab AB (publ), Annehem Fastigheter AB (publ), Bulten AB (publ), Avensia AB (publ), EQT AB (publ) and EQT’s funds.
Peab AB (publ)
Peab is one of the leading construction and civil engineering companies in the Nordic region, operating in Construction, Civil Engineering, Industry and Project Development. The company’s share is listed on Nasdaq Stockholm.
Volito’s holding in Peab amounted to 16 700 000 shares on 31 December 2023, of which 15 200 000 are class B shares, which corresponds to 5.64% of the capital and 4.99% of the votes. Volito has a long-term involvement in Peab and is one of the company’s major owners.
The market value of Volito’s total holding at year-end was SEK 953.6 million (987.0). During the year, Volito received a dividend of SEK 66.8 million (83.5).
Annehem Fastigheter AB (publ)
Annehem owns and manages commercial properties in attractive locations in Nordic growth areas.
Volito’s holding in Annehem Fastigheter amounted to 4 900 000 shares on 31 December 2023, of which 4 600 000 are class B shares, which corresponds to 8.3% (8.3%) of the capital and 6.2% (6.2%) of the votes.
The market value of Volito’s total holding at year-end was SEK 83.1 million (97.0).
Bulten AB (publ)
Bulten is one of the largest suppliers of fasteners for the international automotive industry. The product offering encompasses a broad range of standard products and customised fasteners. Bulten also offers a full-service concept or parts thereof. The company’s share is listed on Nasdaq Stockholm.
Volito is the largest owner of Bulten AB with a holding of 5 100 000 shares on 31 December 2023, which corresponds to 24.3% of the capital and votes.
The market value of Volito’s total holding at year-end was SEK 408.0 million (303.4). Bulten is consolidated as an associated company. The Volito Group’s profit participation amounted to SEK 25.0 million (14.1) and is reported in net financial income/expense. Reported at Volito was SEK -11.4 million (31.2) from Bulten’s other comprehensive income. The groupwise value of the participations amounted to SEK 470.0 million (470.0). Volito received a dividend of SEK 12.8 million (11.4).
EQT AB (publ)
EQT is a purpose-driven global investment organisation focusing on active ownership. EQT manages and advises funds and investment units that invest worldwide. The company manages capital in 36 active funds divided between two business segments, Private Capital and Real Assets. The company’s share is listed on Nasdaq Stockholm.
Volito’s holding in EQT on 31 December 2023 amounted to 1 000 000 shares (1 000 000), which corresponds to 0.08% of the capital and votes (0.08%).
The market value of Volito’s holding at year-end was SEK 285.0 million (220.6). Volito received a dividend of SEK 3.0 million (2.8).
EQT funds
Volito has interests in 18 of EQT’s funds. At year-end, the value of these amounted to SEK 2 332.5 million (2 217.7).
EQT has a long-term, responsible and sustainable approach to its investments and has strong and close relations with all its portfolio companies. EQT offers key expertise in strategic business development, structural changes and financial analysis. A strict model of corporate governance is applied at all the majority-owned companies.
37
ANNUAL REPORT
Avensia AB (publ)
Avensia is a leading e-commerce company that supplies complete omnichannel solutions to companies with high ambitions and requirements for their operations. Avensia has extensive experience of e-commerce projects and helps customers with the implementation of systems, consulting and business development in e-commerce.
Volito’s holding in Avensia on 31 December 2023 amounted to 400 000 shares (400 000). The market value of the holding amounted to SEK 3.8 million (5.0).
Other holdings
The combined value of other holdings at year-end was SEK 11.4 million (8.5).
Expectations concerning future developments
The Group
After a long period marked by challenging economic conditions, we now observe a downward inflation trend. Within Volito, we will remain prepared for new challenges, while a changed economic landscape will form the basis for a favourable investment climate and new, exciting business opportunities.
The coming year marks the end of Volito’s five-year expansion plan and work has commenced on drawing up guidelines for a new strategy period. Volito’s strategy remains in place and the same applies to our targets.
Many of Volito Fastigheter’s buildings have a history and Volito has an ambition to preserve the buildings’ original values through prudent management and judicious modernisations. Volito Fastigheter is continuing its long-term maintenance work according to the set plan. At the same time, further energy-saving measures are being implemented. The focus of sustainability management covers the climate and Volito’s carbon dioxide footprint, prudent management of Volito’s buildings from different periods, boosting biodiversity, and consideration for people.
Volito Industry is aiming for continued long-term sustainable expansion and transformation, through add-on acquisitions and the acquisition of new operations, focusing on well-established and knowledgeintensive companies. The aim is to continue strengthening its market position through sustainable solutions in automation, electrification and digitalisation.
Group information
The company is a subsidiary of AB Axel Granlund, org.no. 556409-6013 with registered office in Malmö. AB Axel Granlund owns 88.0% (88.0%) of the capital and votes in the Volito Group and draws up consolidated financial statements for the largest group.
Information on risks and uncertainty factors
The Group Volito’s income, cash flow and financial position are affected by a number of factors that are to varying degrees influenced by the company’s own actions.
Risk management
Exposure to risks is a natural part of a business enterprise and this is reflected in Volito’s approach to risk management. This aim is to identify risks and prevent and limit the adverse consequences that arise as a result of these risks. Management of the operational risks is a continuous process. The operational risks are managed within the organisation by the respective business areas. The financial risks are linked to the organisation’s tied-up capital and capital requirements, mainly in the form of interest rate risks and refinancing risks. See Note 43.
Material risks
Changes in the value of properties depend partly on Volito Fastigheter’s own ability, through changes and refinements to properties as well as agreement and customer structures, to increase the properties’ market value, and partly on external factors that affect property supply and demand. In general, property value is less volatile for concentrated portfolios of property in good locations. Volito’s properties are predominately concentrated in the central and most expansive parts of Malmö. Most of Volito Fastigheter’s long-term lease agreements contain an index clause that means annual rent adjustments are based either on changes in the consumer price index or on a fixed percentage increase.
Property valuations are calculations made according to established principles based on certain assumptions and affect the Group’s financial results considerably. For more information on property valuations, see the Valuation principles section in Note 22.
Credit risks
Credit risks refer to the risk of losing money due to another party being unable to fulfil their obligations.
Vacancy risks and credit risks in accounts receivable – trade Demand for premises is affected by changes in general business conditions. Volito Fastigheter’s activities are concentrated in Malmö, which is deemed to be attractive in the long term regarding location, population growth, employment and general communications. A broad portfolio of contracts reduces the risk of large fluctuations in vacancies. Leases are divided between commercial properties 91% (89%) and residential 9% (11%). The commercial rental revenue is divided between 143 (146) contracts within a number of different sectors. A combination of good local knowledge, active involvement and a high level of service creates conditions for long-term rental relations and thereby a reduced risk of new vacancies. A certain level of vacancies provides opportunities in the form of new leases and flexibility for existing tenants who want to expand or reduce their premises. Furthermore, Volito Fastigheter bears the risk that tenants are unable to make rent payments. Regular followups are carried out on the tenants’ credit ratings in order to reduce exposure to credit losses. A credit rating of tenants is carried out for all new leases, and, if required, the lease agreement is complemented with personal guarantees, rent deposit or bank guarantee. All rents are paid quarterly or monthly in advance.
Within Volito Industry, risks are linked to project management. Many projects are customised and Volito Industry bears the risk that customers cannot fulfil their obligations. Customers make advance payments on major projects in order to reduce the risk of credit losses.
Financial risks
In its business activities, the Volito Group is exposed to various types of financial risks. Financial risks relate to changes in exchange rates and interest rates that affect the company’s cash flow, financial results and thereby associated equity. The financial risks also include credit and refinancing risks.
The Group’s finance policy for managing financial risks has been designed by the Board and creates a framework of guidelines and rules in the form of risk mandates and limits for the business. Responsibility for the Group’s financial transactions and risks is managed centrally by the Group’s Finance department, which is within the Parent company. The overall aim of the Finance department is to provide cost-efficient financing and to minimise negative effects on the Group’s financial results that stem from market risks. Reporting is conducted on a regular basis to the CEO and the Board, which have overall responsibility for financial risk management. See Note 43.
Liquidity and financing risks
Liquidity and financing risks refer to risks of not being able to fulfil payment obligations as a result of insufficient liquidity or difficulties in arranging new loans. Volito is to be able to carry through business transactions when the opportunity arises and always be able to fulfil its obligations. Refinancing risks increase if the company’s credit rating deteriorates or a large part of the debt portfolio becomes due on a single, or relatively few, dates.
Liquidity risks are managed through both regular liquidity forecasts and Volito’s access to credit or liquid assets that can be raised at short notice in order to even out fluctuations in payment flows.
Borrowing risks refer to risks that financing is unavailable or available on unfavourable conditions at a certain time. In order to limit financing risks, Volito strives to spread final due dates regarding credit over the longest possible period allowed by prevailing market conditions.
Part of Volito’s borrowing is linked to fulfilling financial ratios (covenants) in the form of the interest coverage ratio, loan-to-value ratio and equity ratio, which is customary for this type of borrowing. These ratios are followed up continuously and make up a part of the management’s framework for financial planning of the business.
38
Currency exposure
The Volito Group’s exposure to risks relating to exchange rate changes has increased due to operations in the Finnish market.
Interest rate exposure
The Volito Group is exposed to changes mainly in short-term interest rates through its involvement in the Volito Fastigheter group. The Parent company, Volito AB, also has risk exposure relating to short-term interest rates. Volito’s policy regarding interest rates is that fixed rate terms for the portfolio shall be well balanced and adjusted to the company’s current view of the fixed income market at that time.
Interest rate expense is the largest single expense item for Volito Fastigheter. How much and how fast a change in interest rates makes an impact on financial results depends on the chosen fixed interest term. A rise in interest rates is often initiated by higher inflation. In commercial rental contracts, it is normal that the rent is index-adjusted upwards for inflation.
A combination of loans with short fixed-interest terms and utilisation of financial instruments in the form of interest rate swaps enables flexibility to be achieved, and the fixed-interest term and interest rate level to be adjusted so that the aim of the financing activity can be achieved with limited interest rate risk. This is without underlying loans needing to be renegotiated. In order to manage the interest rate risks and achieve even development of net financial income/expense, the average fixed interest term for Volito’s interest-bearing liabilities is adjusted according to the assessed risk level and interest rate expectations. Interest rate derivatives are valued at fair value. If the agreed interest rate for the derivative deviates from the expected future market interest rate during the derivative’s duration, a change in value arises that affects the company’s statement of financial position and income statement, but not the cash flow. The risk reduction in interest payments from long fixedinterest terms often creates a larger risk in derivative value, due to the time factor. When the term of the derivative has expired, the value of the interest rate derivative is always zero.
Overall, the Volito Group’s total loans exposed to short-term interest rates amount to SEK 1 864.6 million (2 100.0). Hedging relating to 63.7% (49.8) of the debt portfolio of the Volito Fastigheter group, corresponding to 38.3% (30.4) for the entire Volito Group, is managed with swaps, something that gives the company a higher degree of flexibility in terms of future debt management.
The nominal amount of Volito Fastigheter’s outstanding interest rate swaps on 31 December was SEK 1 157.0 million (919.0). On 31 December the fixed interest rates varied from 0.33% (0.33%) to 3.68% (2.60%) and the floating interest rates are STIBOR 3-months with a supplement for a margin relating to borrowing in SEK.
Refinancing risks
The Volito Group depends on a functioning credit market. The Group has a need to continuously refinance parts of its business, see Note 40. The Group has a satisfactory equity ratio and borrowing capacity. It is therefore Volito’s assessment that there is at present no problem concerning the credit that is due for refinancing.
Taxes
Volito’s current tax expense is higher than the nominal tax on the pre-tax profit or loss, which is due to:
Changes in value relating to investment properties, shares in listed companies and derivatives are not included in the taxable profit or loss. Tax deductible depreciation for buildings does not affect the Group results.
Directly tax-deductible amounts relating to certain rebuilding investments for properties do not affect the Group results.
• Fiscally utilised deficit deduction does not affect the Group results. See Note 19.
Operational risks
Good internal control procedures for important processes, fit-forpurpose administrative systems, professional development and reliable valuation models and principles are methods for reducing operational risks. Volito works continuously to monitor, evaluate and improve the company’s internal control procedures.
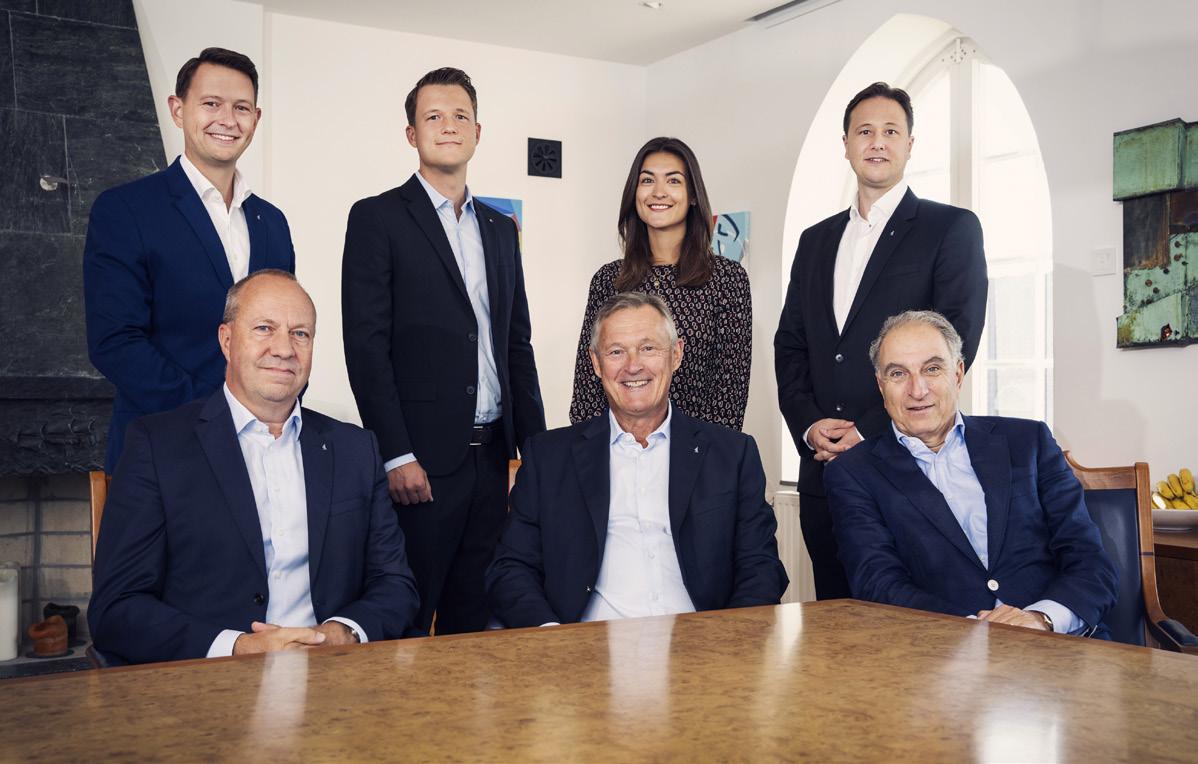
Volito’s staff
The Volito Group is an organisation that handles large amounts of capital. In view of this, the well-being and development of the staff are of vital importance for the long-term development of the Group.
Volito primarily uses employment conditions as a competitive factor for attracting skilled staff with suitable profiles. Different events are regularly organised within the Group’s various companies to further strengthen team spirit and company loyalty.
Proposed allocation of the company’s profit
The Board of Directors and CEO propose that the unappropriated earnings, SEK 1 523 485 267.09 are allocated as follows:
Dividend, [2 440 000 * SEK 15.00 per share] 36 600 000 Retained earnings carried forward 1 486 885 267
Total 1 523 485 267
Other appropriations of profit
The Group’s equity has been calculated in accordance with the EU-developed IFRS standards and interpretations of these (IFRIC), and in accordance with Swedish law through the application of the Swedish Financial Accounting Standards Council reporting recommendation RFR 1 Supplementary reporting rules for groups.
The Parent company’s equity has been calculated in accordance with Swedish law through the application of the Swedish Financial Accounting Standards Council reporting recommendation RFR 2 Reporting for legal entities. The proposed dividend reduces the Parent company’s equity ratio from 55.28% to 54.14%. The equity ratio is prudent, in view of the fact that the company’s activities continue to operate profitably. Liquidity in the Group is expected to be maintained at a similarly stable level.
The Board’s understanding is that the proposed dividend will neither hinder the company from carrying out its obligations in the short or long term nor from conducting necessary investments. The proposed dividend is thus defensible with consideration to what is stated in ABL chapter 17, section 3, paragraph 2-3 (prudence principle).
For further information on the company’s financial results and position, refer to the following income statements and statements of financial position, and related notes to the financial statements.
39
ANNUAL REPORT
40
other
Note Amounts in SEK K 2023 2022 3 Net sales 1 029 427 864 897 4 Other operating income 17 915 1 712 5 1 047 342 866 609 Operating expenses Raw materials and consumables -475 865 -405 947 Real estate expenses -49 805 -54 323 6 Other external expenses -71 569 -54 649 7 Personnel expenses -257 793 -199 865 8 Depreciation and amortisation of tangible and intangible fixed assets -39 649 -23 965 9 Other operating expenses -409 -700 Operating profit 152 252 127 160 Profit or loss from financial income and expense 11 Profit or loss from participations in joint ventures -3 824 13 202 12 Profit or loss from participations in associated companies 26 127 22 601 13 Profit or loss from other financial income and expense 155 163 440 908 14 Interest income and similar profit/loss items 4 655 1 497 15 Interest expense and similar profit/loss items -146 683 -92 345 Profit after financial income and expense 187 690 513 023 16 Change in value of investment properties -146 946 -97 715 17 Change in value of derivatives -50 485 103 078 Profit or loss before tax -9 741 518 386 19 Taxes 13 402 -24 025 Profit for the year 3 661 494 361 20 Other comprehensive income Items that have been or can be transferred to profit or loss for the year Translation differences from translation of foreign operations for the year -3 913 19 432 Participations in other comprehensive income of associated companies and joint ventures -11 421 31 235 Items that cannot be transferred to profit or loss for the year Change in fair value of equity instruments measured at fair value via other comprehensive income for the year 15 877 -1 279 351 Tax attributable to items that cannot be transferred to profit or loss for the year -10 151 73 991 Other comprehensive income for the year -9 608 -1 154 693 Total comprehensive income for the year -5 947 -660 332 Profit or loss for the year attributable to: Owners of Parent company 2 498 493 934 Holdings with non-controlling interest 1 163 427 Profit for the year 3 661 494 361 Total comprehensive income for the year attributable to: Owners of Parent company -6 960 -661 561 Holdings with non-controlling interest 1 013 1 229 TOTAL COMPREHENSIVE INCOME FOR THE YEAR -5 947 -660 332
Consolidated income statement and
comprehensive income for the Group
Cash flow statement for the Parent company
Supplement to cash flow statement for the Parent company
49
Amounts in SEK K 2023 2022 Operating activities Profit or loss after financial income and expense -152 345 51 379 Adjustments for items not requiring an outflow of cash 130 696 -395 -21 649 50 984 Income taxes – 540 Cash flow from operating activities before changes in working capital -21 649 51 524 Cash flow from changes in working capital Increase(-)/Decrease(+) in operating receivables 14 101 17 184 Increase(+)/Decrease(-) in operating liabilities -48 684 -2 797 Cash flow from operating activities -56 232 65 911 Investing activities Acquisition of tangible fixed assets -13 –Divestment of tangible fixed assets – 5 Investments in financial assets -24 747 -98 311 Divestment/reduction of financial assets 33 215 104 282 Cash flow from investing activities 8 455 5 976 Financing activities Proceeds from borrowings 1 080 094 46 793 Amortisation of borrowings -1 043 413 -33 689 Dividends paid -27 174 -47 174 Cash flow from financing activities 9 507 -34 070 Cash flow for the year -38 270 37 817 Liquid funds at start of the year 38 277 460 Liquid funds at year-end 7 38 277 Amounts in SEK K 2023 2022 Interest paid and dividends received Dividends received 91 550 106 979 Interest received 18 060 7 638 Interest paid -74 610 -39 241 Adjustments for items not requiring an outflow of cash Depreciation and write-downs of tangible assets 123 130 Other write-downs 151 655 41 684 Capital gains or losses from divestment of fixed assets – -5 Capital gains or losses from divestment of financial assets -21 082 -42 204 130 696 -395 Liquid funds The following components are included in liquid funds Cash and bank balances 7 38 277 Unutilised credit facilities Unutilised credit facilities amount to SEK 213.3 million (250.0).
ANNUAL REPORT
Accounting principles and notes to the accounts
Amounts are in SEK thousands (K), unless otherwise stated.
Note 1 Significant accounting principles
Agreement with standards and laws
The consolidated financial statements have been drawn up in accordance with International Financial Reporting Standard (IFRS) issued by the International Accounting Standards Board (IASB) as well as interpretations from the IFRS Interpretations Committee such as have been enacted by the EU. Furthermore, the consolidated financial statements have been drawn up in accordance with the Swedish Financial Accounting Standards Council recommendations RFR 1 Supplementary accounting rules for groups.
The Parent company’s annual accounts are drawn up in accordance with the same principles as the Group’s with the exception of cases noted below in the section “The Parent company’s accounting principles”.
The consolidated financial statements and annual accounts of Volito AB (Parent company) for the financial year 2023 were approved by the Board and CEO on 7 March 2024 and will be presented to the Annual General Meeting on 15 May 2024 for adoption. The Parent company is a Swedish limited company with registered office in Malmö.
Valuation basis applied in the drawing up of the Parent company’s and Group’s financial statements
Assets and liabilities are reported at historical acquisition value, except investment properties and certain financial assets and liabilities that are measured at fair value. Financial assets and liabilities that are measured at fair value comprise derivative instruments, listed and unlisted shares and holdings in mutual funds.
Functional currency and reporting currency
The Parent company’s functional currency is SEK, which is also the reporting currency for the Parent company and the Group. This means that the financial statements are presented in SEK. All amounts are rounded to the nearest thousand, unless otherwise stated.
Changed accounting principles
Changes in IFRS applied as of 1 January 2023 have not had a significant effect on the Group’s accounting.
New IFRS that have not yet come into effect
The new or changed IFRS that come into effect during the coming financial year have not been applied in advance in the drawing up of these financial statements. There are no plans to apply in advance new standards or changes that will apply in the future. New and changed IFRS for application in the future are not expected to have a significant effect on the Group’s financial statements.
Consolidated financial statements
Subsidiaries
Subsidiaries are reported according to the acquisition method.
Conditional purchase prices are reported at fair value from the acquisition date. In cases where the conditional purchase price is classified as an equity instrument, no revaluation and regulation are reported in equity. For other conditional purchase prices, revaluation is done for each reporting period and the change in value is reported under other operating income in profit or loss for the year.
Acquisitions from holdings with non-controlling interest
Acquisitions from holdings with non-controlling interest are reported as a transaction within equity, i.e. between the Parent company’s owners (within retained earnings) and the holding with non-controlling interest.
Sales to holdings with non-controlling interest
Sales to holdings with non-controlling interest, in which the controlling interest remains, are reported as a transaction within equity, i.e. between the Parent company’s owners and the holding with non-controlling interest.
Participations in joint ventures
Participations in joint ventures in accounting terms are those companies for which the Group, through cooperation agreements with one or more parties, has a joint controlling interest over operational and financial management. From the point when the joint controlling interest is gained, participations in joint ventures are reported in accordance with the equity method in the consolidated financial statements.
Associated companies
Associated companies are those companies in which the Group has a significant interest, but not a controlling interest, over operational and financial management, generally through shareholdings with between 20% and 50% of the votes. From the point when the significant influence is gained, participations in associated companies are reported in accordance with the equity method in the consolidated financial statements.
The equity method
The equity method means that the book value of joint ventures and associated companies reported in the Group corresponds to the Group’s share of the joint venture’s or associated company’s equity, as well as group-wise goodwill and any other residual value in the groupwise surplus value or under value. The Group’s participation in the respective companies’ profit after tax and expenses adjusted for any amortisation, write-downs or resolution of acquired surplus or under value is reported in the profit or loss for the year under “Participations in joint ventures’ profit or loss” and “Participations in associated companies’ profit or loss”. These profit participations less received dividends from joint ventures and associated companies make up the main changes in the book value of participations in joint ventures and associated companies. The Group’s participation in other comprehensive income in associated companies is reported in a separate line in the Group’s other comprehensive income.
Acquisition of property via a company
The company acquisitions regarding properties that have taken place since the formation of the Group have been treated as asset acquisitions.
Revenue
Rental revenue
Rental revenue from investment properties with notification in advance is reported linearly in the profit or loss for the year based on the conditions in the leasing agreement. Included here is the customary debiting of rent including index as well as supplementary debiting for investments and property tax. Rents and rent rebates that are only debited during a certain part of a contract’s duration have been allocated over the respective contract’s entire duration.
Rental contracts relating to investment properties are considered as operational leasing agreements. These agreements are reported in accordance with the principles for revenue recognition above. Volito has one property that is leased out through a financial leasing agreement, see Note 35.
Sales of goods and services
Recognition of revenue other than rental revenue from property management is done in accordance with IFRS 15 Revenue from contracts with customers. Revenue from sales of goods and services is recognised in the profit or loss for the year when control of the goods or services has been transferred to the buyer. Revenue is reported net after discounts. Advances from customers are reported as a debt until the goods have been delivered or the service has been carried out. The most common payment terms within the Volito Group vary between 30-90 days.
Expense
Real estate expenses
The term real estate expenses covers all expenses for the investment properties. This includes direct property expenses, such as expenses for operation, maintenance, ground rent and property tax. The term also covers indirect property expenses, such as expenses relating to leasing and property administration.
Financial income and expense
Interest rate swaps are used for hedging against interest rate risks linked to the Group’s borrowings. The Group does not at present apply hedge accounting for these instruments. Interest rate swaps are measured at fair value in the statement of financial position. In the profit or loss for the year, the interest rate coupon component is reported continuously as a correction of interest expense. Unrealised changes in the fair value of interest rate swaps are reported in a specific line in the profit or loss for the year.
Taxes
In the valuation of fiscal deficit deduction, an assessment is made of the probability that the deficit can be utilised. The basis for deferred tax assets includes established deficit deductions to the extent that they can with certainty be utilised in relation to future profits. Deferred taxes are reported at the nominal applicable tax rate without discounting.
Intangible assets
Goodwill
Goodwill is valued at the acquisition value minus any accumulated write-downs. Goodwill is designated to cash generating units and is tested for write-down requirements annually or as soon as indications arise which show that the asset in question has fallen in value. Goodwill that has arisen in the acquisition of joint ventures and associated companies is included in the book value for participations in joint ventures and associated companies.
Other intangible assets
Intangible assets that are acquired by the company are reported at the acquisition value minus accumulated depreciation and write-downs.
Depreciation is linear over the asset’s period of utilisation and reported as expense in the income statement. Depreciation begins from the date when assets become available for use. The estimated periods of utilisation are:
The Group The Parent company Software 3-5 years 5 years Other intangible assets 5 years –
An assessment of an asset’s period of utilisation and residual value is carried out annually.
Tangible fixed assets
Tangible assets that are acquired by the company are reported at the acquisition value less accumulated depreciation and any write-downs.
Depreciation principles for tangible fixed assets
Depreciation according to plan is based on the original acquisition value reduced by the calculated residual value. Depreciation is linear over the period in which the asset is expected to be utilised.
The following depreciation periods are applied: The Group The Parent company Industrial buildings 20-25 years –Plant and machinery 5-10 years –
3-5 years 3-5 years
Industrial buildings account for a negligible amount and depreciation for various parts is over a period of 20-25 years.
50
Equipment, tools
Computer equipment
and installations 5 years 5 years
Investment properties
Most of the properties in the Group are classified as investment properties, as they are owned with an aim to generate rental revenue or value increases, or a combination of the two. Investment properties are reported initially at acquisition value, which includes expenditure directly attributable to the acquisition. Thereafter, investment properties are reported at fair value in the statement of financial position, in accordance with IAS 40. Changes in value are reported in a specific line in the income statement. The Group’s properties are reported in the statement of financial position as fixed assets. As the properties are reported at fair value, depreciation is not reported for these properties in the consolidated financial statements. The investment properties are valued annually by an independent external appraiser with recognised and relevant qualifications. The applied calculation model is based on long-term return evaluation, which factors in the present value of future payment streams with differentiated return requirements per property, depending on aspects such as location, purpose, condition and standard.
Unrealised and realised changes in value are reported in profit or loss for the year. Rental revenue is reported in accordance with the principles described in the revenue recognition section.
Additional expenditure – investment properties reported according to the fair value method
Additional expenditure is added to the book value only if it is probable that the future economic benefits associated with the asset will be gained by the company and the acquisition value can be calculated in a reliable way. All other additional expenditure is reported as expense in the period it arises. A decisive factor in assessing when additional expenditure is added to the book value is if the expenditure refers to the exchange of identified components, or parts thereof, which activates such expenditure. Expenditure for any newly created components is also added to the book value. Expenditure for repairs is expensed in the period it arises.
Properties under construction that are intended for use as investment properties when the work is completed are also classified as investment properties.
Note 22 contains further information on the external property valuation and a statement on classification of the property portfolio and its book value.
Inventories
Inventories are valued at the lowest of either the acquisition value or the net realisable value. The acquisition value is calculated according to the first-in, first-out principle and includes expenditure that has arisen in the acquisition of inventory assets and transport of these to their present location and condition. The Group applies an obsolescence scale for goods that have not been sold for two years or more.
Net realisable value is the estimated sales price in the current operations, after deductions for estimated costs for completion and to achieve a sale.
Financial instruments
Financial instruments that are reported in the statement of financial position include on the asset side; liquid funds, accounts receivable – trade, participations in funds, listed and unlisted shares, derivatives and other receivables. On the liability side are accounts payable – trade, borrowings and derivatives.
Holdings of unlisted funds
The Group has participations in unlisted funds. The participations in funds do not fulfil the criteria for equity instruments and the cash flows from the funds do not consist solely of payments of principals and interest. The funds are therefore measured at fair value via the profit or loss.
Holdings of unlisted shares
The Group’s holdings of shares and participations in unlisted companies (that are not subsidiaries, associated companies or joint ventures) are measured at fair value via the profit or loss.
Holdings of listed shares
The holdings of listed shares are measured at fair value via other comprehensive income.
Derivative assets
Derivatives that have a positive fair value for Volito are reported as assets in the statement of financial position and measured at fair value via the income statement. Derivatives are made up of interest rate swaps that are used to financially hedge interest rate risks. Changes in value are reported in a specific line in profit or loss for the year. Volito does not apply hedge accounting.
Other financial assets
All other financial assets are reported at the amortised cost.
Classification and subsequent measurement of financial liabilities
Financial liabilities are classified as being measured at amortised cost or measured at fair value via the profit or loss. The financial liabilities that are measured at fair value via the profit or loss consist of derivatives that have a negative fair value for Volito. Changes in value are reported in a specific line in profit or loss for the year. Derivatives are made up of interest rate swaps that are used to financially hedge interest rate risks. Volito does not apply hedge accounting. All other financial liabilities are reported at the amortised cost with the application of the effective interest method.
Write-downs
Write-down tests for tangible and intangible assets, and participations in subsidiaries, joint ventures, associated companies etc.
If there is an indication that a write-down is required, the asset’s recoverable amount is calculated in accordance with IAS 36. For goodwill and other intangible assets that are not yet ready for use, the recoverable amount is also calculated annually.
Write-down tests for financial assets
The Group reports a loss allowance for expected credit losses on financial assets measured at amortised cost. The loss allowance for accounts receivable – trade is measured at an amount that corresponds to the expected losses for the remaining duration. For other receivables, the loss allowance is measured at an amount that corresponds to 12 months of expected credit losses, provided that the credit risk has not increased significantly since the time when the receivable was first reported. If the credit risk has increased significantly since the time when the receivable was first reported, the loss allowance is instead measured at an amount that corresponds to the expected credit losses for the remaining duration.
Remuneration to employees
Remuneration to employees in the form of salaries, paid holiday, paid sick leave, etc. is reported at the rate that it is earned. Regarding pensions and other remuneration after employment ends, these are classified as contribution-based or benefit-based plans. The commitment regarding the contribution-based plans is fulfilled through contributions to independent authorities or companies that administer the plans. A number of employees in the Volito Group have ITP plans with rolling payments to Alecta/Collectum. In accordance with IFRS, these are classified as benefit-based plans that cover several employers. As there is not sufficient information to report these as benefit-based plans, they are reported as contribution-based plans.
The Parent company’s accounting principles
The Parent company has drawn up its annual accounts in accordance with the Swedish Annual Accounts Act (1995:1554), and the Swedish Financial Accounting Standards Council recommendation, RFR 2 Accounting for a legal entity. RFR 2 means that the Parent company in the annual accounts for the legal entity shall apply all of the EU-developed IFRS and pronouncements as far as this is possible within the framework of the Annual Accounts Act, the law on safeguarding pension commitments, and with consideration taken for the connection between accounting and taxation. The recommendation states the exceptions and additions to IFRS that are to be made.
Changed accounting principles
The Parent company’s accounting principles are unchanged compared with the previous financial year.
Differences between the Group’s and Parent Company’s accounting principles
The differences between the Group’s and Parent Company’s accounting principles are given below.
Classification and format
The Parent company’s income statement and statement of financial position are drawn up according to the Annual Account Act’s scheme. The differences compared with IAS 1, Presentation of financial statements, which have been applied in the presentation of the Group’s financial statements, are principally reporting of financial income and expense, fixed assets, equity and the presence of provisions as a specific heading in the statement of financial position.
Financial instruments
The Parent company does not apply IFRS 9 as a legal entity.
In the Parent company, financial assets are measured at acquisition value minus any writedown, and financial current assets according to the lowest value principle. The acquisition value for interest-bearing instruments is adjusted for the allocated difference between what was paid originally, after deductions for transaction expenses, and the amount that was paid on the due date.
Subsidiaries, participations in associated companies and jointly controlled companies
Participations in subsidiaries, associated companies and jointly controlled companies are reported in the Parent company according to the cost method. This means that acquisition expenditure is included in the book value of participations in subsidiaries.
The book value is reviewed continuously against the fair value of assets and liabilities in the subsidiaries, associated companies and jointly controlled companies.
Financial guarantees
The Parent company’s financial guarantee agreements consist mainly of guarantees for the benefit of subsidiaries, associated companies and jointly controlled companies.
In the reporting of financial guarantee agreements, the Parent company applies one of the Swedish Financial Accounting Standards Council’s permitted exemptions compared with the rules in IFRS 9.
Group contributions
Paid and received group contributions are reported as appropriations.
Shareholders’ contribution
The shareholders’ contribution is taken up directly against equity at the recipient and activated in shares and participations at the donor, to the extent that write-downs are not required.
Leased assets
In the Parent company, all leasing fees are reported as an expense linearly over the leasing period.
Financial assets
In the Parent company, all financial assets are reported at the acquisition value with deductions for any write-downs.
Taxes
In the Parent company, untaxed reserves are reported including deferred tax liabilities. However, in the consolidated financial statements, untaxed reserves are divided between deferred tax liabilities and equity.
51
ANNUAL REPORT
Real estate
Note 2 Important estimates and assessments
The company management and the Board have discussed the development, choice and information regarding the Group’s important accounting principles and estimates, as well as the application of these principles and estimates.
Certain important accounting-related estimates that have been used in the application of the Group’s accounting principles are described below.
The sources of uncertainty in the estimates stated below refer to those that involve a risk that the value of the assets or liabilities may need an adjustment to a significant extent in the coming financial year.
Investment properties
Investment properties are reported in accordance with the options in IAS 40 at fair value. This value is established by company management based on the properties’ market value at accounting year-end, with changes in fair value reported in the profit or loss. Therefore, the profit or loss can be considerably affected by changes in the fair value of investment properties. The fair value has been calculated by an independent appraisal institution in accordance with good appraisal practice. Important assessments have therefore been made regarding aspects such as the cost of capital and yield requirement that are based on the appraisal institutions’ experience of assessing the market’s yield requirements for comparable properties. The assessments of cash flow for operation, maintenance and administration costs are based on actual costs, but consideration has also been given to experiences relating to comparable properties. Future investments have been assessed based on the actual needs that exist and with the support of the investment plans that have been drawn up. See Note 22 for a more detailed description of assumptions and assessments connected with the appraisal process.
Write-down testing of goodwill
The Group’s total goodwill amounts to SEK 233 125 K (228 400). In the calculation of the cash-generating units’ recoverable amounts for assessment of any write-down requirement for goodwill, several assumptions about future conditions and estimates of parameters have been made. A description of these is presented in Note 21. As can be understood from the description, changes exceeding what can reasonably be expected in 2024 relating to these assumptions and estimates could have an effect on the value of goodwill. However, this risk is very low as the recoverable amounts exceed to a great extent the book value in those cases where the goodwill values are a significant amount.
Taxes
Changes in fiscal legislation and changed practice in the interpretation of tax laws may significantly affect the size of reported deferred taxes. For more information on taxes, see Note 19 and 34.
Note 3 Net sales by type of revenue
The Group has contract liabilities in the form of advance payments from customers, which are reported in other short-term liabilities. The amount is SEK 5 630 K (4 699). The Group has no significant contract assets. For information on accounts receivable – trade, see Note 43.
Order book
The order book within Volito Industry companies amounted at year-end to SEK 183 666 K (235 786). The orders will be delivered in 2024. For information on the durations in Volito Fastigheter’s contract portfolio, see Note 22.
Note 4 Other operating income
Note 5 Leasing revenue relating to operational leasing Rental and leasing revenue is based on rental and leasing agreements that are regarded as operational leasing agreements in which the Group is the lessor.
One property in the Volito Fastigheter group is leased out through a financial leasing agreement, see Note 35.
Rental revenue from investment properties with notification in advance is reported linearly in the profit or loss for the year based on the conditions in the leasing agreement. Included here is the customary debiting of rent including index as well as supplementary debiting for investments and property tax. Rents and rent rebates that are only debited during a certain period of a contract’s duration have been allocated linearly over the respective contract’s entire duration. Of rental revenue, SEK 5 026 K (1 000) consists of turnover-based premises rents.
Rental revenue in the Volito Fastigheter group according to the contract portfolio at year-end was divided between 91% (89%) commercial premises and 9% (11%) residential. The commercial rental revenue was divided between 143 (146) contracts within a number of different sectors. With the aim of limiting exposure to credit losses, regular follow-ups are made of tenants’ credit ratings. No sector or tenant accounts for more than 10% of the rental revenue.
For information on the durations in Volito Fastigheter’s contract portfolio, refer to Note 22.
Note 6 Auditing: fees and expenses
Audit assignments refer to the scrutiny of the annual accounts, accounting, and the Board’s and CEO’s administration, as well as other tasks that fall to the company’s auditor to carry out, and consultation or other assistance resulting from observations of such scrutiny or the carrying out of such other tasks. Tax consultations include consultations concerning income tax and valued added tax. Other assignments refer to consultations that are not applicable to any of the above-named service categories.
Note 7 Staff and personnel costs
1) Of the Parent company’s pension costs, SEK 1 874 K (1 019) refers to the company’s Board and CEO. The company has no outstanding pension obligations to them.
2) Of the Group’s pension costs, SEK 7 330 K (5 470) refers to the subsidiaries’ Boards and CEOs. Outstanding pension obligations to them amount to SEK 34 K (11).
52
2023 2022 The Group Revenue from contracts with customers Sales of goods 842 447 700 223 Administration revenue 2 779 2 222 Leasing revenue Rental revenue 184 201 162 452 Net sales 1 029 427 864 897 The Parent company Revenue from contracts with customers Administration revenue 7 091 5 453 7 091 5 453 Contract liabilities and assets
2023 2022 The Group Capital gains on divestment of fixed assets 1 167 –State support 4 699 378 Reversed additional purchase price 11 867 –Capital gains on receivables/liabilities relating to operations 181 780 Other 1 554 17 915 1 712 The Parent company State support 63 –Other – 23 63 23
2023 2022 The Group kpmg Audit assignments – 40 Tax consultations – –Other assignments – 52 ernst & young Audit assignments 1 707 1 406 Tax consultations 9 12 Other assignments 138 139 other auditors Audit assignments 23 21 Other assignments – –The Parent company ernst & young Audit assignments 536 405 Other assignments 108 108
Average number of employees 2023 Of which, men 2022 Of which, men The Parent company Sweden 5 40% 6 33 % Subsidiaries Sweden 148 85% 136 87 % Finland 108 93% 82 91 % Total in subsidiaries 256 88% 218 89 % Group total 261 87% 224 87 % 2023 2022 Gender distribution in company management Percentage of women Percentage of women The Group Board of Directors 0 % 0 % Other senior executives 50 % 50 % Expenses and remuneration to employees 2023 2022 The Group Salaries and remuneration etc 157 192 139 644 Pension costs, contribution-based plans 17 776 19 445 Social security expenditure 43 467 33 629 218 435 192 718 2023 2022 Salaries, other remuneration and social security expenses Salaries and remuneration Social security expenses Salaries and remuneration Social security expenses The Parent company 29 311 12 080 13 155 7 285 (of which, pension costs) 1) (2 674) 1)(1 937) Subsidiaries 155 953 55 499 126 489 45 789 (of which, pension costs) (15 102) (17 508) Total for the Group 185 264 67 579 139 644 53 074 (of which, pension costs) 2) (17 776) 2)(19 445)
Salaries and other remuneration by senior executives and other employees in the Parent company 2023 2022
The Parent company
senior executives (6 people, ceo and board)
Salaries and other remuneration
25 505 9 248
(of which, bonuses and similar) (16 000) (–)
9 842 4 889
Social security expenses
(of which, pension costs) (1 874) (1 019)
other employees
Salaries and other remuneration
3 806 3 907
(of which, bonuses and similar) (–) (100)
2 238 2 396
Social security expenses
(of which, pension costs) (800) (918)
The Parent company, total
Salaries and other remuneration
29 311 13 155
(of which, bonuses and similar) (16 000) (100)
Social security expenses 12 080 7 285
(of which, pension costs) (2 674) (1 937)
Salaries and other remuneration by senior executives and other employees in the Group 2023 2022
The Group
senior executives
Salaries and other remuneration
50 311 28 584
(of which, bonuses and similar) (19 017) (2 188)
Social security expenses 21 854 14 871
(of which, pension costs) (7 330) (5 470)
other employees
Salaries and other remuneration 134 953 111 060
(of which, bonuses and similar) (2 819) (3 925)
Social security expenses 45 725 38 203
(of which, pension costs) (15 818) (13 975)
The Group, total
Salaries and other remuneration
185 264 139 644
(of which, bonuses and similar) (21 836) (6 113)
67 579 53 074
Social security expenses
(of which, pension costs) (23 148) (19 445)
Remuneration to senior executives
Principles
The Chairman of the Board receives no remuneration. The other Board members receive a fee of SEK 350 K according to the Annual General Meeting’s decision. There is no agreement concerning future pension/severance pay for either the Chairman of the Board or other Board members. Remuneration to the CEO and other senior executives consists of basic salary, other benefits and pension. There is an agreement with the CEO of the Parent company regarding a bonus scheme and severance pay corresponding to one year’s salary.
Remuneration and other benefits
Other benefits refer to company cars. Pension costs refer to the costs that affect the profit or loss for the year. For the CEO and other senior executives, premium-based pension plans apply, and the retirement age is 65. Costs for the CEO’s pension consist of a premium of 35% of the pension-qualifying salary during the period of employment. For other senior executives, ITP plans or equivalent apply, and the retirement age is 65.
Other senior executives
On termination of employment from the company’s side, other senior executives have the right to severance payments amounting to between six months’ and 12 months’ salary.
Note 8 Depreciation of tangible and intangible
Note
53
2023 2022
Intangible assets -13 249 -430 Right-of-use assets -22 884 -19 336 Machinery and other technical fixed assets -513 -528 Equipment, tools and installations -3 003 -3 671 -39 649 -23 965 The Parent company Intangible assets -104 -104 Equipment, tools and installations -19 -26 -123 -130
9 Other operating expenses 2023 2022 The Group Capital gains/losses – -51 Credit losses -298 -275 Other -111 -374 -409 -700 Note 10 Profit or loss from participations in subsidiaries 2023 2022 The Parent company Dividends 9 000 9 000 Write-downs of paid shareholders’ contributions -48 701 -35 536 -39 701 -26 536 Note 11 Profit or loss from participations in joint ventures 2023 2022 The Group Profit or loss from participations in joint ventures for the year -3 824 13 202 -3 824 13 202
12 Profit or loss from participations in associated companies 2023 2022 The Group Profit or loss from participations in associated companies for the year 26 127 14 253 Reversed write-downs – 8 348 26 127 22 601 The Parent company Dividends 12 750 11 419 Reversed write-downs – 8 348 12 750 19 767
13 Profit or loss from other financial income and expense 2023 2022 The Group Other dividends 69 800 87 377 Capital gains from divestments 22 207 34 888 Write-downs -26 019 -6 964 Reversed write-downs 599 1 792 Change in value 88 576 323 815 155 163 440 908 The Parent company Other dividends 69 800 86 560 Capital gains from divestments 21 082 33 855 Write-downs -102 954 -6 714 Reversed write-downs 599 –-11 473 113 701
fixed assets
The Group
Note
Note
Note
14 Interest income and similar profit/loss items 2023 2022 The Group Interest income, other 1 133 245 Leasing revenue 1 175 1 252 Exchange profits 2 347 –4 655 1 497 The Parent company Interest income, subsidiaries 16 249 6 608 Interest income, other 847 151 Exchange profits 191 12 079 Guarantee-related income, subsidiaries 964 879 18 251 19 717 All interest income is attributable to instruments measured at amortised cost.
15 Interest expenses and similar profit/loss 2023 2022 The Group Interest expenses, subsidiaries -1 304 -486 Interest expenses, other -140 147 -81 061 Set-up fees -2 078 -2 734 Credit charges and commissions -3 154 -3 463 Exchange losses – -4 601 -146 683 -92 345 The Parent company Interest expenses, subsidiaries -15 461 -7 674 Interest expenses, other -58 272 -29 558 Set-up fees -2 078 -2 734 Credit charges and commissions -3 154 -3 429 -78 965 -43 395 Of interest expenses, SEK 159 664 K (73 968) is attributable to instruments measured at amortised cost and SEK -19 517 K (7 093) to instruments measured at fair value. ANNUAL REPORT
Note
Note 16 Change in value of investment properties
The Group Change in value of property portfolio, 31 December -146 946 -97 715 Volito Fastigheter has not acquired or divested any properties during the year
At every year-end all properties are valued externally. Malmöbryggan Fastighetsekonomi AB carried out a valuation of Volito’s properties on 31 December 2023. The properties’ values are individually assessed to correspond to the fair value of each property.
Note 22 includes a description of the valuation methods, valuation basis, market parameters etc. that are used in the valuation of the property portfolio.
Note 17 Change in value of derivatives
Derivatives are financial instruments that according to IFRS 9 are measured at fair value in the statement of financial position. Changes in the value of interest rate derivatives are reported under the heading “Change in value of derivatives” in the income statement. If the agreed interest rate for the derivative deviates from the expected future market interest rate during the derivative’s duration, a change in value is entered in Volito’s statement of financial position and income statement but does not affect the cash flow. The reduced risk in interest payments through long fixed interest rates often creates a larger risk in derivative value due to the time factor. When the duration of the derivative has expired, the value of the interest rate derivative is always zero.
Note 18 Group contribution
Note 19 Taxes
The Group reports current tax of SEK -10 930 K (-12 774). Current tax is calculated on the fiscal results of the companies included in the Group. This is higher than the Group’s reported profit or loss before tax, which is mainly because:
Changes in value relating to investment properties, shares in listed companies and derivatives are not included in the taxable profit or loss.
Tax deductible depreciation for buildings does not affect the Group results.
Directly tax-deductible amounts relating to certain rebuilding investments for properties do not affect the Group results.
Fiscally utilised deficit deduction does not affect the Group results.
The nominal tax rate is 20.6% in Sweden, 20.0% in Finland, 22.0% in Denmark and
in Switzerland.
In addition to what is reported above, there is also within the Group a
to components in other comprehensive income amounting to
The Group 2023
The Group 2022 Before
Note 20 Scope of other comprehensive income and other reserves
The foreign exchange reserve includes all currency differences that arise in translation of financial statements from foreign subsidiaries and associated companies that have drawn up their financial statements in currencies other than the currency used in the Group’s financial statements. When foreign subsidiaries are wound up or divested, this part of the foreign exchange reserve is transferred to profit or loss for the year.
The fair value reserve includes changes in value of equity instruments measured at fair value via other comprehensive income.
Note 21 Intangible fixed assets
54
2023 2022
2023 2022 Group contribution received 49 263 24 003 Group contribution paid -1 561 –47 702 24 003
2023 2022 The Group Current tax -10 930 -12 774 Deferred tax 24 332 -11 251 Total reported taxes for the Group before other comprehensive income 13 402 -24 025 The Parent company Deferred tax 16 412 -1 808 Total reported taxes for the Parent company 16 412 -1 808 Reconciliation of effective tax 2023 2022 Per cent Amount Per cent Amount The Group Profit or loss before tax -9 741 518 386 Tax according to the current tax rate for the Parent company 20.6% 2 007 20.6 % -106 788 Effect of other tax rates for foreign subsidiaries 2.3% 224 0.0 % 72 Other non-deductible expenses -277.0% -26 982 2.9 % -14 868 Tax-exempt income 357.3% 34 802 -18.5 % 95 724 Tax relating to previous years -6.0% -587 0.1 % -331 Previously non-valued deficit deduction 5.6% 542 0.0 % 30 Temporary differences -35.7% -3 479 0.5 % -2 639 Adjustment of tax attributable to profit or loss from joint ventures and associated companies 47.2% 4 596 -1.1 % 5 656 Other 23.4% 2 279 0.2 % -881 Reported effective tax 137.6% 13 402 4.6 % -24 025 Reconciliation of effective tax 2023 2022 Per cent Amount Per cent Amount The Parent company Profit or loss before tax -104 643 75 382 Tax according to the current tax rate for the Parent company 20.6% 21 556 20.6 % -15 529 Non-deductible expenses -26.2% -27 431 21.5 % -16 216 Tax-exempt income 21.3% 22 302 -39.7 % 29 951 Tax relating to previous years 0.0% -15 0.0 % -14 Reported effective tax 15.7% 16 412 2.4 % -1 808
7.8%
tax expense attributable
SEK
151 K (+73
-10
991).
Before tax Tax After tax Translation differences
translation
overseas businesses for the year -3 913 – -3 913 Participations in associated companies’ other comprehensive income -11 421 – -11 421 Change in fair value of equity instruments measured at fair value via other comprehensive income for the year 15 877 -10 151 5 726 Other comprehensive income 543 -10 151 -9 608
in
of
tax Tax After tax Translation differences in translation of overseas businesses for the year 19 432 – 19 432 Participations in associated companies’ other comprehensive income 31 235 – 31 235 Change in fair value of equity instruments measured at fair value via other comprehensive income for the year -1 279 351 73 991 -1 205 360 Other comprehensive income -1 228 684 73 991 -1 154 693
Goodwill 2023-12-31 2022-12-31 The Group Accumulated acquisition value At start of the year 229 756 190 089 Acquisition of subsidiaries 18 648 31 344 Exchange rate differences for the year -1 204 8 323 At year-end 247 200 229 756 Accumulated depreciation according to plan At start of the year -1 356 -1 144 Exchange rate differences for the year 8 -212 At year-end -1 348 -1 356 Accumulated write-downs At start of the year – –Write-downs for the year -12 727 –At year-end -12 727 –Book value at end of period 233 125 228 400 Other intangible assets 2023-12-31 2022-12-31 The Group Accumulated acquisition value At start of the year 8 062 7 306 Other investments 683 563 Divestments and disposals -241 -68 Exchange rate differences for the year -28 261 At year-end 8 476 8 062 Accumulated depreciation according to plan At start of the year -7 162 -6 547 Divestments and disposals 241 68 Depreciation according to plan for the year -522 -430 Exchange rate differences for the year 14 -253 At year-end -7 429 -7 162 Book value at end of period 1 047 900 Total intangible assets 2023-12-31 2022-12-31 The Group Accumulated acquisition value At start of the year 237 818 197 395 Acquisition of subsidiaries 18 648 31 344 Other investments 683 563 Divestments and disposals -241 -68 Exchange rate differences for the year -1 232 8 584 At year-end 255 676 237 818
Accumulated depreciation according to plan
At start of the year -8 518 -7 691
Divestments and disposals 241 68
Depreciation according to plan for the year -522 -430
Exchange rate differences for the year 22 -465
At year-end -8 777 -8 518
Accumulated write-downs
At start of the year – –
Write-downs for the year -12 727 –
At year-end -12 727 –
Book value at end of period 234 172 229 300
2023-12-31 2022-12-31
Other intangible assets
The Parent company
Accumulated acquisition value
At start of the year 745 745
At year-end 745 745
Accumulated depreciation according to plan
At start of the year -564 -460
Depreciation according to plan for the year -104 -104
At year-end -668 -564
Book value at end of period 78 182
Write-down testing of goodwill in cash-generating units
The Volito Group’s financial position on 31 December 2023 includes goodwill of SEK 233 125 K (228 400). The entire amount is attributable to acquisitions within the Volito Industry group.
During the year, BluePac AB merged with ETP Kraftelektronik AB. The goodwill item in BluePac AB has thereby been transferred to ETP Kraftelektronik AB.
2023-12-31 2022-12-31
The Group
HydX AB 43 148 43 148
HydSupply AB 14 558 14 558
ETP Kraftelektronik AB 44 464 34 625
Blue Pac AB – 9 839
Mobile Integrator AB 21 046 21 046
HydSupply Oy 69 826 70 030
ProTest Oy 12 017 24 393
Peimarin Hydrauliikka Oy 10 730 10 761
Lohjan Sähkö ja Automaatio Oy 17 336 –
At year-end 233 125 228 400
Write-down of goodwill
During 2023, the Group made a write-down of goodwill in ProTest Oy of SEK 12 727 K (0).
For other cash-generating units where a calculation of the recoverable amount was carried out and no write-down requirement was identified, it is the company management’s assessment that no reasonable possible changes in important assumptions would cause the recoverable amount to fall below the book value.
Method for calculating recoverable amounts
For all goodwill values, the recoverable amount has been measured through a calculation of the value in use for the cash-generating unit. The calculation model is based on a discounting of future forecast cash flows that are set against the unit’s book value. The future cash flows are based on 3-year forecasts compiled by the management of the respective cash-generating unit. In testing of goodwill, an infinite horizon has been assumed and extrapolation of the cash flow for years after the forecast period has been based on a growth rate from year 4 of approx. 2%.
Important variables for calculating value in use:
The following variables are significant and common for all cash-generating units in the calculation of value in use.
turnover:
The competitiveness of the business, expected business climate trend for the hydraulic sector, general socio-economic development, interest rates and local market conditions.
operating margin:
Historical profitability level and efficiency of the business, access to key people and qualified workforce, ability to cooperate with customers, access to internal resources, cost trends for salaries and materials.
operating capital requirements:
An assessment on a case-by-case basis of whether the operating capital level reflects the business’s requirements or needs to be adjusted for the forecast periods. For future development, a cautious assumption is that it follows growth in turnover. A high level of internally developed projects may mean a greater need for operating capital.
investment requirements:
The investment needs of the business are assessed based on the investments required to reach forecast cash flows at the base level, i.e. without investments in expansion. In normal cases, the investment level has corresponded to the depreciation rate on tangible fixed assets.
discount rate of interest:
The discount rate of interest is determined through a balanced average cost of capital for the hydraulic sector and reflects current market assessments of the money’s time value and the risks that apply in particular to the asset for which the future cash flows have not been adjusted. For cash-generating units, a discount rate of interest estimated as a WACC of 14.01% (10.97%) is used.
Note 22 Investment properties
The greater part of the Volito Group’s properties has been classified as investment properties. Investment properties are properties held with an aim to generate rental revenue or value growth, or a combination of the two. Investment properties are reported in the statement of financial position at fair value.
Volito rents offices in Malmö in its own properties. The rental value for internal renting makes up a negligible part of the respective property’s total rental value, which is why no classification as real estate used in business operations has been made for these properties.
Volito holds no property that has been acquired or rebuilt for subsequent immediate sale, which is why no property has been classified as a property held for resale.
Investments for the year amounted to SEK 70.5 million (13.4) and refer to completed investments during the year and fixed assets under construction, see Note 27.
Calculation of fair value
On 31 December 2023, the company carried out an external market valuation of the Group’s properties. The fair value of the investment properties has been assessed by external, independent property appraisers with relevant professional qualifications and experience of both current market areas and the type of property that is being valued. Volito has used Malmöbryggan Fastighetsekonomi AB.
The valuation has been done in accordance with the guidelines applied in the SFI/IPD Swedish Real Estate Index. Fair value has been estimated through the application of the present value method, which is calibrated against comparable purchases and other available, relevant market information. The present value method is based on the present value calculation of future actual cash flows that is successively market-adjusted, normally over five to eight years, and the present value of assessed residual value at the calculation period’s end. Valuation of the investment properties has been categorised as belonging to level three in the fair value hierarchy, as non-observable input data used in the valuation has a significant effect on the assessed value. The properties’ values are individually assessed to correspond to the fair value of the respective property.
The value is calculated as an average yield of 4.75% (4.45).
Reconciliation of property valuation
Properties’ value according to external appraiser
The amount includes fixed assets under construction of SEK 2 316 K (3 987).
Summary
Valuation date
In normal cases, five years for most properties. However, certain properties have other calculation periods due to the length of contracts.
Assessed yield requirement, residual value. Between 3.10 and 6.35% Between 2.85 and 7.00
Long-term
Operating and maintenance costs
Assessed normalised cost levels SEK 295-591/m2 (SEK 271-1 308/m2) based on outcome 2019-2022, forecast 2023 and budget 2024.
Inflation forecast CPI assessed to rise by 4.0% for 2024 and thereafter by 2.0% per year.
Accrued rebuilding expenses regarding properties classified as investment properties are reported under the item “Fixed assets under construction and advances relating to tangible fixed assets”, Note 27. 2023-12-31
The Group 2 316 3
55
2023-12-31 2022-12-31
3 408 600 3 485 000
Change in book value for the year 2023-12-31 2022-12-31 Book value at start of the year 3 481 013 3 566 000 Investments 29 738 2 689 Reclassifications 42 479 10 039 Change in value of remaining properties at year-end -146 946 -97 715 Book value 3 406 284 3 481 013
2023-12-31 2022-12-31
5-8 years
Calculation period 5-7 years
vacancy rate 1.0-7.8% 1.0-7.0%
2022-12-31
ANNUAL REPORT
987
Investment properties – Effect on profit or loss for the period
The Group Rental revenue
Direct costs for investment properties that generated rental revenue during the period (operating and maintenance costs, property tax and ground rent) -49 805 -54 323
The durations in the contract portfolio for commercial premises within the Volito Group on 31 December 2023 expire according to the table below. Stated amounts refer to contracted closing annual rents in the portfolio: 2023-12-31
or loss
Counterparty risks in rental revenue
According to the contract portfolio at year-end, rental revenue was divided between 91% (89%) commercial properties and 9% (11%) residential. The commercial rental revenue was divided between 143 (146) contracts in a number of different sectors. With the aim of limiting exposure to credit losses, regular follow-ups are made of tenants’ credit ratings. No sector or tenant accounts for more than 10% of the rental revenue.
Note 23 Industrial premises
Note 24 Leasing agreements
Leasing agreements in which the company is the lessee
The Group’s tangible fixed assets consist of owned and leased assets. Leased assets consisting of investment properties are reported as a financial leasing agreement in a specific item.
The Group Right-of-use
not investment properties
The Group leases several types of assets. No leasing agreements contain covenants or other limitations in addition to security for the leased asset. Right-of-use assets Properties Vehicles Equipment
The Group Depreciation during the year -18 340 -4
Balance carried forward 31 Dec 2023
Addition to right-of-use assets in 2023 amounted to SEK 32 343 K (24 820). This amount includes the acquisition value of newly acquired right-of-use assets during the year as well as additional amounts from the review of leasing liabilities due to altered payments as a result of the leasing period having changed.
Leasing liabilities
Leasing liabilities included in the statement of financial
For duration analysis of leasing liabilities, see Note 43, Financial instruments and financial risk management in the section on liquidity risks.
Property leasing
The Group leases buildings for its office premises. The leasing agreement for office premises normally has a duration of one to three years. All agreements contain an option to renew the leasing agreement at the end of the leasing period by a further period of the same duration.
Certain leasing agreements contain leasing fees based on changes in local price indexes or the Group’s turnover in the leased premises during the year. Certain leasing agreements require that the Group pays fees connected with the property taxes that apply to the lessor. These amounts are determined annually.
Extension and termination options
Leasing agreements contain extension and termination options that the Group can utilise or not utilise up to one year before the expiry of the non-cancellable leasing period. When it is practical, the Group tries to include such options in new leasing agreements, as they contribute to operative flexibility. The options can only be utilised by the Group, not the lessor. Whether it is reasonably certain that an extension option will be utilised or not is determined on the leasing agreement’s start date. The Group reviews whether it is reasonably certain that an extension option will be utilised or not in the event of an important event or significant change in circumstances that lies within the Group’s control.
The Group’s rental agreements for both office premises and other premises consist mainly of non-cancellable periods of one to three years that are extended by further periods of one to three years, if the Group does not terminate the agreement with a six-month to one-year period of notice. The agreements contain no definitive end date. For agreements that have shorter non-cancellable periods than five years, it is assessed that it is reasonably certain that a further period will be utilised, resulting in leasing periods of up to six years. The reported leasing liability for this amounts to SEK 47 743 K (43 506).
Significant changes may occur in the future in the event of a review of the leasing period being carried out regarding one of the Group’s significant property agreements.
Other leasing agreements
The Group leases vehicles and equipment with leasing periods of three years in normal cases. In certain cases, the Group has the option to purchase the asset at the end of the leasing period. In other cases, the Group guarantees the leased asset’s residual value at the end of the leasing period. Extension options occur only to a limited extent.
Estimated residual value guarantees are reviewed at each accounting year-end in order to revalue the leasing liability and right-of-use asset. The estimated value on 31 December 2023 was SEK 10 962 K (8 764).
In some individual cases, machinery and IT equipment are also leased with leasing periods of one to three years. These leasing agreements and/or leases are of low value. The Group has chosen not to report the right-of-use assets and leasing liabilities for these leasing agreements.
Leasing agreements in which the company is the lessor
Financial leasing agreements
Within the Group is a property that is leased out via a financial leasing agreement, see Note 34. The Group classifies the sub-leasing agreement as a financial leasing agreement, as the sub-lease extends over the main leasing agreement’s entire remaining leasing period.
The
The Parent company’s leasing agreement has been extended and runs up to and including 30 June 2026, with no specific restrictions and with an option to extend. Other agreements relating to leasing are divided between small agreements and consist of negligible amounts.
56
2023-12-31 2022-12-31
184
201 162 131
The Group Within one year 18 351 12 970 Between one and five years 145 388 139 883 Later than five years 5 810 6 830 169 549 159 683
2022-12-31
2023-12-31 2022-12-31 The Group Accumulated acquisition value At start of the year 10 644 10 644 Divestments
disposals -10 644 –– 10 644 Accumulated depreciation according
plan At start of the year -7 252 -7 252 Depreciation according to plan for the year 7 252 –– -7 252 Book value at end of period – 3 392
land The Group Accumulated acquisition value – 598
and
to
Of which,
2023-12-31 2022-12-31
67
59
assets,
064
952
Total
340 -204 -22 884
48
204 67
067 18 793
064
2023-12-31 2022-12-31 The
Short-term leasing liabilities 26 118 22 201 Long-term leasing liabilities 40 614 36 266
Group
position 66 732 58 467
Amount reported
2023 2022 The Group Depreciation -22 884 -19 336 Interest on leasing liabilities -2 004 -1 392 Amount reported in statement of cash flows 2023 2022 Total cash outflows attributable to leasing agreements Leasing fees -22 722 -20 110
in profit
Parent company
leasing payments 2023 2022 Within one year 3 037 3 108 Between one and five years 4 556 8 197 7 593 11 305 Expensed payments for leasing agreements 2023 2022 Minimum lease payments 3 108 3 007
Non-cancellable
Note 25 Machinery and other technical fixed assets
The Group
Note 27 Fixed assets under construction and advances relating
Note 26 Equipment, tools and installations
expenses No
Note 28 Participations in subsidiaries
Note 28 (cont.) Specification of the Parent company’s and Group’s holdings of shares in subsidiaries
Subsidiary / Corp. ID No. / Registered office
Volito Aviation AB, 556603-2800, Malmö
Volito Fastigheter AB, 556539-1447, Malmö
Volito Fastighetsutveckling AB, 556375-6781, Malmö
Volito Fastighetsförvaltning AB, 556142-4226, Malmö
HB Ran Förvaltning, 916766-5224, Malmö
Volito Fastighetskupolen AB, 556629-1117, Malmö
Fastighets AB Centralposthuset i Malmö, 556548-1917, Malmö
Volito Leisure AB, 556541-9164, Malmö
Volito Mosippan AB, 556631-7979, Malmö
Volito Delfinen AB, 556630-7988, Malmö
Volito Proveniens AB, 556758-2415, Malmö
Volito Sankt Peter AB, 556658-6904, Malmö
Volito Claus AB, 556758-3090, Malmö
Volito Laxen AB, 556758-3975, Malmö
Volito Stjärnan AB, 556758-3074, Malmö
Volito Södra Porten AB, 556758-3108, Malmö
Volito Söderhavet AB, 556758-3561, Malmö
Volito Visenten AB, 556749-9636, Malmö
Volito Elefanten AB, 559125-9766, Malmö
Volito Industri AB, 556662-5835, Malmö
Volito Automation AB, 556669-2157, Malmö
HydX AB, 556791-5326, Ystad
HydSupply AB, 556718-2091, Malmö
ETP Kraftelektronik AB, 556589-7609, Partille
Mobile Integrator Sweden AB, 556803-0174, Halmstad
Mobile Integrator Denmark ApS, 39314967, Brøndby, Denmark
Hyd Partner A/S, 913929616, Krokkleiva, Norway
Hydsupply Oy, 0606351-2, Jyväskylä, Finland
ProTest Engineering Oy,2311605-7, Jyväskylä, Finland
Peimarin Hydrauliikka Oy, 2427274-8, Piikkiö, Finland
Lohjan Sähkö ja Automaatio Oy, 2267267-6, Lojo, Finland
Volito Kapital AB, 556671-0140, Malmö
1) Refers to the ownership share of the capital, which also agrees with the proportion of votes for the total number of shares.
57
2023-12-31 2022-12-31
Accumulated acquisition value
start of the year 6 807 7 807 New acquisitions 169 98 Acquisition of subsidiaries 126 –Divestments and disposals -162 -1 083 Reclassifications – -15 Exchange rate differences for the year -4 –6 936 6 807
depreciation according to plan At start of the year -4 932 -5 432 Divestments and disposals 130 1 028 Depreciation according to plan of acquisition value for the year -513 -528 -5 315 -4 932 Book value at end of period 1 621 1 875
At
Accumulated
2023-12-31 2022-12-31
Group Accumulated acquisition value At start of the year 47 123 47 768 Acquisition of subsidiaries 207 404 New acquisitions 2 961 3 070 Divestments and disposals -519 -5 212 Reclassifications -31 15 Exchange rate differences for the year -68 1 078 49 673 47 123 Accumulated depreciation according to plan At start of the year -34 022 -34 468 Acquisition of subsidiaries – -120 Divestments and disposals 127 4 893 Reclassifications 31 –Depreciation according to plan of acquisition value for the year -3 003 -3 671 Exchange rate differences for the year 66 -656 -36 801 -34 022 Book value at end of period 12 872 13 101 2023-12-31 2022-12-31 The Parent company Accumulated acquisition value At start of the year 4 214 4 214 New acquisitions 13 –4 227 4 214 Accumulated depreciation according to plan At start of the year -1 459 -1 433 Depreciation according to plan of acquisition value for the year -19 -26 -1 478 -1 459 Book value at end of period 2 749 2 755
The
to tangible fixed assets 2023-12-31 2022-12-31 The Group At start of the year 4 049 3 301 Reclassifications to investment properties -42 479 -10 039 Investments 40 746 10 787 Book value at end of period 2 316 4 049
activated interest
acquisition value
Borrowing
is included in the
2023-12-31 2022-12-31
At start of the year 712 200 676 664 Paid shareholders’ contribution 48 701 35 536 760 901 712 200 Accumulated write-downs At start of the year -363 518 -327 982 Write-downs for the year -48 701 -35 536 -412 219 -363 518 Book value at end of period 348 682 348 682
Accumulated acquisition value
2023-12-31 2022-12-31
No. of shares Shares in % 1) Book value Book value
10 000 100.0 23 088 23 088
423 000 100.0 312 014 312 014
100.0
100.0
100.0
100.0
100.0
100.0
100.0
100.0
100.0
100.0
100.0
100.0
100.0
100.0
100.0
100.0
100.0
85 500 95.0 13 460 13 460
100.0
100.0
100.0
100.0
100.0
100.0
100.0
100.0
100.0
100.0
100.0
1 000 100.0 120 120
348 682 348 682 ANNUAL REPORT
Acquisitions in 2023
On 1 June 2023, the Group acquired 100% of the shares in the Finnish company Lohjan Sähkö ja Automaatio Oy (LSA).
Effects of acquisitions in 2023
Volito Industry continues its journey to meet customers’ increased needs for automation, electrification and control and measurement technology. Lohjan Sähkö ja Automaatio (LSA) was acquired during the year. The acquisition strengthens Volito Industy’s position and increases its reach within the electrification area. LSA, which operates from Lohja and Tammerfors in Finland, offers field services, component sales and complete solutions for electrical automation.
The acquired company contributed SEK 31.1 million to the group’s turnover and SEK 3.3 million to the Group’s profit after tax. If the acquisition had been completed on 1 January 2023, the company management estimates that the Group’s revenue would have increased by a further SEK 22.2 million and the period’s profit after tax would have been SEK 2.4 million higher.
Specification of the Parent company’s and Group’s holdings of shares in joint ventures Joint
ID no., Registered
Indirectly owned Point Hyllie Holding AB, 559023-4034, Malmö
in joint ventures’ revenue and expenses, as well as assets and liabilities.
Note 29 Receivables from subsidiaries
Note 31 Participations in associated companies
Directly
58 Holdings with non-controlling interest Subsidiary Country Business segment 2023-12-31 2022-12-31 Volito Industri AB Sweden Industry 5 % 5 % Volito Industri AB (group) Subsidiaries 2023 2022 Net sales 842 447 700 223 Profit or loss 23 260 8 535 Other comprehensive income -2 918 16 044 Total comprehensive income 20 342 24 579 Attributable to acquisitions with non-controlling interest 1 013 1 229 Fixed assets 249 679 248 075 Current assets 382 210 400 300 Provisions -2 277 -657 Long-term liabilities -255 359 -140 716 Short-term liabilities -214 772 -406 989 Net assets 159 481 100 013 Attributable to acquisitions with non-controlling interest 7 974 5 001 Cash flow from: Operating activities 59 549 7 991 Investing activities -33 974 -71 109 Financing activities -39 932 69 674 Cash flow for the year -14 357 6 556
Net assets of
acquired
Acquired assets and liabilities: Group goodwill 18 648 Tangible fixed assets 321 Inventories 2 766 Operating receivables 10 880 Liquid funds 7 976 Total assets 40 591 Borrowings 2 685 Operating liabilities 9 733 Total provisions and liabilities 12 418 Purchase price 28 173
the
operation
2023-12-31 2022-12-31 The Parent company Book value at start and end of year 107 997 107 997 Note 30 Participations in joint ventures 2023-12-31 2022-12-31 The Group Accumulated acquisition value At start of the year 395 196 381 994 Participations in joint ventures’ profit or loss for the year -3 824 13 202 391 372 395 196 2023-12-31
venture/Corp.
Shares/ number in % Equity share’s value in the Group Book value at Parent company Indirectly owned Point Hyllie Holding AB, 559023-4034, Malmö 50.0 391 372 –Book value at end of period 391 372 –2022-12-31 Specification of the Parent company’s and Group’s holdings of shares
venture/Corp.
Shares/ number in % Equity share’s value in the Group Book value at Parent company
office
in joint ventures Joint
ID no., Registered office
50.0 395 196 –
end of period 395 196 –
is
participations
Hyllie Point group 2023 2022 Revenue 52 437 42 411 Expenses -37 148 -29 980 Change in value of properties -16 807 -4 139 Change in value of derivatives -2 307 4 910 -3 825 13 202 Assets 938 584 952 675 Liabilities -547 212 -557 479 Net assets 391 372 395 196
Book value at
Below
a specification of the group-wise value relating to owned
2023-12-31 2022-12-31 The Group Accumulated acquisition value At start of the year 498 874 457 350 Purchases – 3 662 Participations in associated companies’ profit or loss for the year 26 127 14 253 Participations in associated companies’ other comprehensive income for the year -11 421 31 235 Exchange rate differences for the year -1 001 3 635 Transactions relating to equity Dividends -12 750 -11 419 Transactions with owners 98 158 Book value at end of period 499 927 498 874 The Parent company Accumulated acquisition value At start of the year 249 968 246 306 Purchases – 3 662 Book value at end of period 249 968 249 968 2023-12-31 Specification of the Parent company’s and Group’s Equity holdings of shares in associated companies Shares/ share’s Book value number value in at Parent Associated company/Corp. ID no, Registered office in % the group Company Directly owned Bulten AB (publ), 556668-2141, Gothenburg 24.3 470 948 249 968 Nordkap Holding AG, CHE - 110.234.439, Zug, Switzerland 40.0 0 0 Indirectly owned Volito Aviation AG, CHE - 111.972.238, Zug, Switzerland 49.0 25 069 –Kiinteistöy Oy, 1107347-5, Porin Pienteollisuustalo, Finland 42.0 3 910 –499 927 249 968 2022-12-31 Specification of the Parent company’s and Group’s Equity holdings of shares in associated companies Shares/ share’s Book value number value in at Parent Associated company/Corp. ID no, Registered office in % the group Company
owned Bulten AB (publ), 556668-2141, Gothenburg 24.3 469 976 249 968 Nordkap Holding AG, CHE - 110.234.439, Zug, Switzerland 40.0 0 0
owned Volito Aviation AG, CHE - 111.972.238, Zug, Switzerland 49.0 24 967 –Kiinteistöy Oy, 1107347-5, Porin Pienteollisuustalo, Finland 42.0 3 931 –498 874 249 968
Indirectly
Below is a specification of the group-wise value relating to owned participations in associated companies’ revenue and expenses, as well as assets and liabilities.
Note 32 Receivables from associated companies
Note 35 Financial
59
Bulten AB (publ) Volito Aviation AG Kiinteistöy Oy 2023 2022 2023 2022 2023 2022 Revenue 1 411 587 1 094 211 1 534 660 559 –Expenses -1 386 558 -1 080 117 -426 -501 -569 –Acquired profit participation – – – – – –25 029 14 094 1 108 159 -10 –Assets 1 179 036 1 058 513 26 496 26 404 3 915 3 963 Liabilities -740 892 -621 341 -1 427 -1 437 -5 -32 Acquired surplus value 32 804 32 804 – – – –Net assets 470 948 469 976 25 069 24 967 3 910 3 931
2023-12-31 2022-12-31 The Group and Parent company Accumulated acquisition value At start of the year – 11 189 Regulated receivables – -12 615 Exchange rate differences for the year – 1 426 – –
long-term securities holdings 2023-12-31 2022-12-31 The Group Shares and participations 3 669 339 3 535 838 Book value at year-end 3 669 339 3 535 838 Changes relating to other long-term securities holdings for the year 2023-12-31 2022-12-31 The Parent company Accumulated acquisition value At start of the year 2 390 917 2 391 686 Additional assets 24 747 32 043 Divested assets -12 133 -32 812 2 403 531 2 390 917 Accumulated write-downs At start of the year -15 025 -8 877 Write-downs for the year -102 954 -6 148 -117 979 -15 025 Book value at year-end 2 285 552 2 375 892 2023-12-31 2022-12-31 List of securities The Group The Parent company The Group The Parent company Peab AB (publ) 953 570 449 825 986 970 449 825 Annehem Fastigheter AB (publ) 83 104 83 104 97 020 164 049 EQT AB (publ) 285 000 67 000 220 600 67 000 EQT-fonder 2 332 504 1 672 344 2 217 727 1 684 585 Avensia AB (publ) 3 792 1 932 5 000 1 932 Other 11 369 11 347 8 521 8 501 3 669 339 2 285 552 3 535 838 2 375 892 Note 34 Deferred tax asset/tax liability Deferred tax asset Deferred tax liability Net The Group 2023 Accelerated depreciation Machinery and equipment – 790 -790 Tax allocation reserves – 975 -975 Fair value Investment properties – 316 891 -316 891 Swaps – 2 859 -2 859 Temporary differences 1 955 45 291 -43 336 Leasing agreements 315 – 315 Deficit deduction 8 – 8 Other – 1 104 -1 104 Net deferred tax liability 2 278 367 910 -365 632 Deferred tax asset Deferred tax liability Net The Group 2022 Accelerated depreciation Machinery and equipment – 569 -569 Tax allocation reserves – 1 355 -1 355 Fair value Investment properties – 292 774 -292 774 Swaps – 13 259 -13 259 Temporary differences 1 064 71 440 -70 376 Deficit deduction 270 – 270 Other 283 1 986 -1 703 Net deferred tax liability 1 617 381 383 -379 766 Deferred tax asset Deferred tax liability Net The Parent company 2023 Temporary differences 818 – 818 Deficit deduction 8 – 8 Net deferred tax liability 826 – 826 Deferred tax asset Deferred tax liability Net The Parent company 2022 Temporary differences – 15 856 -15 856 Deficit deduction 270 – 270 Net deferred tax liability 270 15 856 -15 586 Unreported deferred tax assets 2023-12-31 2022-12-31 Fiscal deficit – 905 The fiscal deficit is attributable to Swedish companies.
Note 33 Other
leasing agreements
of the properties in the Volito Fastigheter group is leased out through a financial leasing agreement 2023-12-31 2022-12-31 The Group Reconciliation of the gross investment and the present value of receivable relating to future minimum leasing fees: Gross investment 26 930 27 201 Less: Unearned financial income -8 657 -7 482 Present value of receivable relating to future minimum leasing fees 18 273 19 719 On 31 December, the breakdown of the remaining durations was as follows: Gross investment Within one year 2 538 2 538 Later than one but within two years 2 538 2 538 Later than two but within three years 2 538 2 538 Later than three but within four years 2 539 2 539 Later than four but within five years 2 539 2 539 Later than five years 14 238 14 509 26 930 27 201 Less: Unearned financial income -8 657 -7 482 Net investment in financial leasing agreements 18 273 19 719 Present value of receivable relating to future minimum leasing fees Within one year 1 462 1 364 Later than one but within two years 1 446 1 446 Later than two but within three years 1 532 1 532 Later than three but within four years 1 625 1 625 Later than four but within five years 1 724 1 724 Later than five years 10 484 12 028 18 273 19 719 Variable component of leasing fee included in profit or loss for the period 289 289 Variable fees change according to the CPI, in accordance with the rental agreement. ANNUAL REPORT
One
Note 36 Other long-term receivables
The Group and Parent company
2023-12-31
The Group’s derivative instruments consist of interest rate swaps, which are utilised to cover risks of changes in interest rates. Derivative instruments are reported continuously at fair value in accordance with IFRS 9. The change in value of interest rate derivatives is reported in the income statement on a separate line “Change in value of derivatives.” The change in value for the year amounts to SEK -50.5 million (103.1). 2023-12-31
value IFRS 7, level 2
2023-12-31
Note 37 Prepaid expenses and accrued income
Note 38 Liquid funds
Liquid funds consist of cash and bank balances, SEK 1.6 million (15.6). Unutilised bank overdraft facilities that are not included in liquid funds amount to SEK 213.3 million (250.0), of which in the Parent company SEK 213.3 million (250.0).
Note 39 Equity
shares have the same
Other contributed capital Refers to equity that is contributed by the owners. This includes premiums paid in connection with share issues.
Reserves
Foreign exchange reserve
The foreign exchange reserve includes all the exchange rate differences that arise from translating financial statements in a currency other than the currency used to present the consolidated financial statements. The Parent company and the Group present their financial statements in SEK. Furthermore, the foreign exchange reserve includes the exchange rate differences that arise in expanded investment in foreign businesses as well as reloans from foreign businesses.
Fair value reserve
The fair value reserve includes the accumulated net change in fair value after tax of equity instruments that are reported at fair value via other comprehensive income.
Retained earnings including profit or loss for the year
Retained earnings including profit or loss for the year consists of profits from the Parent company and its subsidiaries, jointly controlled companies and associated companies.
The Parent company Reserve fund
The aim of the reserve fund has been to save a part of the net profit that is not designated for covering losses carried forward. The reserve fund also includes amounts that, prior to 1 January 2006, were transferred to the premium reserve. The reserve fund is not to be reduced through paying a dividend.
Retained earnings
Includes the previous year’s profit or loss brought forward after paying a dividend. Constitutes together with profit or loss for the year the total non-restricted equity, i.e. the amount that is available for dividends to shareholders.
Proposed allocation of the company’s profit
The Board of Directors and CEO propose that the unappropriated earnings, SEK 1 523 485 267.09 are allocated as follows:
Dividend, [2 440 000 * 15.00 kronor per
Information on allocation of profit
The Group’s equity has been calculated in accordance with the EU-developed IFRS standards and interpretations of these (IFRIC), and in accordance with Swedish law through the application of the Swedish Financial Accounting Standards Council reporting recommendation RFR 1 Supplementary reporting rules for groups.
The Parent company’s equity has been calculated in accordance with Swedish law through the application of the Swedish Financial Accounting Standards Council reporting recommendation RFR 2 Reporting for legal entities. The proposed dividend reduces the Parent company’s equity ratio from 55.28% to 54.14%. The equity ratio is prudent, in view of the fact that the company’s activities continue to operate profitably. Liquidity in the Group is expected to be maintained at a similarly stable level.
The Board’s understanding is that the proposed dividend will not hinder the company from carrying out its obligations in the short or long term, nor from conducting necessary investments. The proposed dividend is thus defensible with consideration to what is stated in ABL chapter 17, section 3, paragraph 2-3 (prudence principle).
Note 40 Interest-bearing liabilities
Note 41 Bank
60
2022-12-31
Accumulated
At start of the year 61 985 44 Additional receivables 3 109 61 985 Market valuation, swaps -49 770 –Reclassifications – -44 Book value at year-end 15 324 61 985
acquisition value
2022-12-31
At start of the year 64 365 -38 713 Market valuation, swaps -50 485 103 078 Book value at year-end 13 880 64 365
Swaps
2022-12-31 The Parent Company At start of the year – –Additional receivables 3 094 –Book value at year-end 3 094 –
2023-12-31 2022-12-31 The Group Prepaid expenses 6 030 3 859 Borrowing costs allocated to period 6 645 5 391 Accrued income 123 1 305 12 798 10 555 The Parent company Prepaid expenses 1 379 1 304 Borrowing costs allocated to period 4 435 2 922 5 814 4 226
Number of issued shares Fully paid Not fully paid Quota value Class B shares 2 440 000 – 100 All
voting
vote per share.
rights, one
36 600 000 Retained earnings carried forward 1 486 885 267 Total 1 523 485 267
share]
2023-12-31 2022-12-31 The Group Due date, up to 1 year from accounting year-end 627 196 1 211 614 Due date, 1-5 years from accounting year-end 2 455 418 1 858 329 Due date, more than five years from accounting year-end 5 670 7 560 3 088 284 3 077 503 The Parent company Due date, up to 1 year from accounting year-end 36 681 1 043 413 Due date, 1-5 years from accounting year-end 1 043 413 –1 080 094 1 043 413 Long-term liabilities 2023-12-31 2022-12-31 The Group Bank loans 2 420 474 1 829 623 Leasing liabilities 40 614 36 266 2 461 088 1 865 889 The Parent company Bank loans 1 043 413 –Short-term liabilities 2023-12-31 2022-12-31 The Group Bank loans 564 397 1 189 413 Bank overdraft facilities 36 681 –Leasing liabilities 26 118 22 201 627 196 1 211 614 The Parent company Bank loans – 1 043 413 Bank overdraft facilities 36 681 –36 681 1 043 413 2023-12-31 2022-12-31 The Group Borrowings at start of the year 3 077 503 3 115 495 Additional borrowings 1 176 497 706 611 Regulated borrowings -1 208 379 -690 676 Change in bank overdraft facilities 36 681 -24 330 Borrowings relating to acquired operations 2 685 –Change in leasing liabilities 4 348 3 331 Change in value of derivatives – -38 713 Exchange rate differences -1 051 5 785 3 088 284 3 077 503 The Parent company Borrowings at start of the year 1 043 413 1 067 743 Change in bank overdraft facilities 36 681 -24 330 1 080 094 1 043 413
facilities 2023-12-31 2022-12-31 The Group and Parent company Granted credit limit 250 000 250 000 Unutilised part -213 319 -250 000 Unutilised credit amount 36 681 –
overdraft
Note 42 Measurement of financial assets and liabilities at fair value
For a description of how the Group’s financial assets and financial liabilities are classified under IFRS 9, see Note 1 “Significant accounting principles”. The table below shows the book value compared with the assessed fair value per type of financial asset and liability.
The fair value of listed shareholdings has been calculated according to the closing rate at accounting year-end. The fair value of fund participations is based on the Net Asset Value (NAV) that has been provided by the administering institution. For other holdings of unlisted holdings, the acquisition value is considered to essentially correspond to the fair value. The fair value of interest rate swaps is based on the present value of future cash flows discounted with a market rate of interest for remaining durations.
For the Group’s interest-bearing liabilities, the book value is considered to be a reasonable approximation of the fair value. The same applies for other items that are not measured at fair value in the statement of financial position, such as accounts receivable – trade and accounts payable – trade.
The effects of measuring financial instruments
Fair value
Fair value is determined though categorisation based on three levels.
Level 1: according to the quoted price in an active market for the same instrument.
Level 2: based on direct or indirect observable market data that is not included in level 1.
Level 3: based on input data that is not observable in the market.
The table below shows the division by level of the financial assets and liabilities that are reported at fair value in the statement of financial position.
Total
and
* Reported in profit or loss from other financial income and expense in the income statement.
Sensitivity analysis for level 3 holdings Fund holdings
For holdings of unlisted funds, the Group does not have access to the input data used by the administering institution in the valuation of fund participations. A sensitivity analysis that shows the effects of reasonable possible changes in input data can therefore not be provided.
61
Measured at fair value via profit or loss Measured at fair value via other comprehensive income Valued at amortised cost Total book value Total fair value Amounts in SEK M 2023 2022 2023 2022 2023 2022 2023 2022 2023 2022 The Group Financial assets Other long-term securities holdings 2 343.9 2 226.2 1 325.5 1 309.6 0.0 0.0 3 669.4 3 535.8 3 669.4 3 535.8 Interest-bearing long-term receivables 0.0 0.0 0.0 0.0 0.0 0.0 0.0 0.0 0.0 0.0 Other long-term receivables 0.0 62.0 0.0 0.0 18.3 19.7 18.3 81.7 18.3 81.7 Accounts receivable – trade 0.0 0.0 0.0 0.0 124.1 121.0 124.1 121.0 124.1 121.0 Interest-bearing short-term receivables 0.0 0.0 0.0 0.0 1.4 0.0 1.4 0.0 1.4 0.0 Prepaid expenses and accrued income 0.0 0.0 0.0 0.0 12.8 10.6 12.8 10.6 12.8 10.6 Other short-term receivables 1.7 2.0 0.0 0.0 3.8 5.1 5.5 7.1 5.5 7.1 Cash and bank balances 0.0 0.0 0.0 0.0 1.6 53.9 1.6 53.9 1.6 53.9 Total financial assets 2 345.6 2 290.2 1 325.5 1 309.6 162.0 210.3 3 833.1 3 810.1 3 833.1 3 810.1 Measured at fair value via profit or loss Valued at amortised cost Total book value Total fair value Amounts in SEK M 2023 2022 2023 2022 2023 2022 2023 2022 Financial liabilities Interest-bearing financial liabilities 0.0 0.0 2 461.1 1 865.9 2 461.1 1 865.9 2 461.1 1 865.9 Other long-term liabilities 0.0 0.0 23.7 29.9 23.7 29.9 23.7 29.9 Interest-bearing short-term liabilities 0.0 0.0 590.5 1 211.6 590.5 1 211.6 590.5 1 211.6 Accounts payable – trade 0.0 0.0 72.9 71.4 72.9 71.4 72.9 71.4 Accrued expenses and deferred income 0.0 0.0 29.7 21.8 29.7 21.8 29.7 21.8 Other short-term liabilities 0.0 0.0 51.8 36.6 51.8 36.6 51.8 36.6 Total financial liabilities 0.0 0.0 3 229.7 3 237.2 3 229.7 3 237.2 3 229.7 3 237.2
fair value is included in the Groups’ profit or loss with a total of SEK 38.1 million (426.9) and relates to the market value of interest rate swaps and fund
at
participations.
Level 1 Level 2 Level 3 Total Amounts in SEK M 2023 2022 2023 2022 2023 2022 2023 2022 The Group Financial assets Other long-term securities holdings Market listed 1 325.5 1 309.6 0.0 0.0 0.0 0.0 1 325.5 1 309.6 Fund holdings 0.0 0.0 0.0 0.0 2 332.5 2 217.7 2 332.5 2 217.7 Other securities holdings 0.0 0.0 0.0 0.0 11.3 8.5 11.3 8.5 Other long-term receivables - swaps 0.0 0.0 12.2 62.0 0.0 0.0 12.2 62.0 Other short-term receivables - swaps 0.0 0.0 1.6 2.4 0.0 0.0 1.6 2.4 Total financial assets 1 325.5 1 309.6 13.8 64.4 2 343.8 2 226.2 3 683.1 3 600.2 Financial liabilities Other long-term liabilities Interest rate swaps 0.0 0.0 0.0 0.0 0.0 0.0 0.0 0.0 Other short-term liabilities Interest rate swaps 0.0 0.0 0.0 0.0 0.0 0.0 0.0 0.0 Total financial liabilities 0.0 0.0 0.0 0.0 0.0 0.0 0.0 0.0
table below presents a reconciliation between incoming and outgoing balances
financial instruments measured in level 3. The Group Funds Unlisted shares Total Fair value 2022-01-01 1 886.0 5.0 1 891.0 Total reported profits and losses: Reported in profit/loss for the year* 323.8 2.7 326.5 Write-down -6.4 0.0 -6.4 Acquisition value, acquisitions 61.6 4.6 66.2 Settlement at sale -47.3 -3.8 -51.1 Fair value 2022-12-31 2 217.7 8.5 2 226.2
Reconciliation of fair value in level 3 The
for
reported profits
losses: Reported in profit/loss for the year* 110.8 0.0 110.8 Write-down -26.0 0.0 -26.0 Acquisition value, acquisitions 69.5 2.8 72.3 Settlement at sale -39.5 0.0 -39.5 Fair value 2023-12-31 2 332.5 11.3 2 343.8
ANNUAL REPORT
Note 43 Financial instruments and financial risk management
Framework for financial risk management
In its business activities the Volito Group is exposed to various types of financial risks. Financial risks relate to changes in exchange rates and interest rates that affect the company’s cash flow, income and thereby associated equity. Financial risks also include credit and refinancing risks.
The Group’s finance policy for managing financial risks has been designed by the Board and creates a framework of guidelines and rules in the form of risk mandates and limits for the business. Responsibility for the Group’s financial transactions and risks is managed centrally by the Group’s Finance department, which is within the Parent company. The overall aim for the Finance department is to provide cost-efficient financing and to minimise negative effects on the Group’s income that stem from market risks. Reporting is conducted on a regular basis to the CEO and the Board, which have overall responsibility for financial risk management.
Management of financial risks
Liquidity and financing risks
Liquidity and financing risks refer to the risks of not being able to fulfil payment obligations as a result of insufficient liquidity or difficulties in arranging new loans. Volito shall be able to carry through business transactions when the opportunity arises and always be able to fulfil its obligations. Refinancing risks increase if the company’s credit rating deteriorates or a large part of the debt portfolio becomes due on one or only a few dates.
Liquidity risks are managed through both regular liquidity forecasts and Volito’s access to credit or liquid assets that can be raised at short notice in order to even out fluctuations in payment flows.
Borrowing risks refer to risks that financing is unavailable or available on unfavourable terms at a certain time. In order to limit financing risks, Volito strives to spread final due dates regarding credit over as long a period as possible according to the prevailing market conditions.
Part of Volito’s borrowing is linked to fulfilling financial ratios (covenants) in the form of interest coverage ratio, loan-to-value ratio and equity ratio, which is customary for this type of borrowing. These ratios are followed up continuously and make up a part of the management’s framework for financial planning of the business. Volito’s policy regarding borrowing is that the due dates for loans shall be spread over time. Volito’s policy regarding interest rates is that fixed interest periods for the portfolio shall be well balanced and adjusted to the company’s current view of the fixed income market at any given time.
Duration analysis of financial liabilities, non-discounted cash flows including interest:
Currency exposure
The risk that fair value and cash flows relating to financial instruments may fluctuate when the value of foreign currencies change is called currency risk.
The Volito Group has exposure to changes in EUR through its holdings in subsidiaries in Finland.
The Board of Volito has decided to accept the exposure to the above-mentioned currency, as this exposure in itself constitutes a risk diversification within the Volito Group. The extent of this exposure will be decided according to continuous review.
Interest rate exposure
Interest rate risk is the risk that Volito’s cash flow or the value of financial instruments vary due to changes in market interest rates. The interest rate risk can lead to changes in fair value and changes in cash flows.
The Volito Group is exposed to changes mainly in short-term interest rates through its involvement in the Volito Fastigheter group. The Parent company, Volito AB, also has risk exposure relating to short-term interest rates. Volito’s policy regarding interest rates is that fixed rate periods for the portfolio shall be well balanced and adjusted to the company’s current view of the fixed income market at that time. How much and how fast a change in interest rates makes an impact on financial results depends on the chosen fixed rate term. A rise in interest rates is often initiated by higher inflation. In commercial rental contracts it is normal that the rent is index-adjusted upwards for inflation.
A combination of loans with short fixed-rate periods and utilisation of financial instruments in the form of interest rate swaps enables flexibility to be achieved and the fixed rate period and interest rate level to be adjusted so that the aims of financing activities can be achieved with limited interest rate risk and without underlying loans needing to be renegotiated. In order to manage the interest rate risks and achieve even development of net interest income, the average fixed rate period for Volito’s interest-bearing liabilities is adjusted according to the assessed risk level and interest rate expectations.
Overall, the Volito Group’s total loans exposed to short-term interest rates amount to SEK 1 864.6 million (2 100.0). Hedging relating to 63.7% (49.8) of the debt portfolio of the Volito Fastigheter group, corresponding to 38.3% (30.4) of the entire Volito Group, is managed with swaps, something that gives the company a higher degree of flexibility in terms of future debt management.
The nominal amount of Volito Fastigheter’s outstanding interest rate swaps on 31 December amounted to SEK 1 157.0 million (919.0). On 31 December, the fixed interest rates varied from 0.33% (0.33%) to 3.68% (2.60%) and the floating interest rates are STIBOR 3-months with a supplement for a margin relating to borrowing in SEK.
Fair value has been calculated as the costs/revenues that would have arisen if the contracts had closed at accounting year-end. For this, the banks’ official rates have been applied.
Below is a summary of the Group’s interest rate swaps by duration Due date
Credit risks
Credit risks refer to the risks of losing money due to another party being unable to fulfil their obligations.
Credit risks in accounts receivable – trade
Demand for premises is affected by changes in general business conditions. Volito Fastigheter’s activities are concentrated in Malmö, which is deemed to be attractive in the long term regarding location, population growth, employment and general communications. A broad portfolio of contracts reduces the risk of large fluctuations in vacancies. Leases are divided between commercial properties 91% (89%) and residential 9% (11%). The commercial rental revenue is divided between 143 (146) contracts within a number of different sectors. A combination of good local knowledge, active involvement and a high level of service creates conditions for long-term rental relations and thereby a reduced risk of new vacancies. A certain level of vacancies provides opportunities in the form of new leases and flexibility for existing tenants who want to expand or reduce their premises. Furthermore, Volito Fastigheter bears the risk that tenants are unable to make rent payments. Regular follow-ups are carried out on the tenants’ credit ratings in order to reduce exposure to credit losses. A credit assessment of tenants is carried out for all new leases, and, if required, the rental agreement is supplemented with personal guarantees, rent deposit or bank guarantee. All rents are paid quarterly or monthly in advance.
Within Volito Industry, risks are linked to project management. Many projects are customised and Volito bears the risk that customers cannot fulfil their obligations. Customers make advance payments on major projects in order to reduce the risk of credit losses.
62
2023-12-31 Nominal amount in original currency 1 year or less 1–5 years >5 years Total Interest-bearing financial liabilities Bank loans, SEK, Real Estate 1 815 945 655 935 1 328 910 6 338 1 991 183 Derivatives -21 947 -15 413 567 -36 793 Bank loans, EUR, Industry 6 535 7 804 72 010 – 79 814 Bank loans, SEK, Industry 53 000 3 180 53 265 – 56 445 Investment loans, SEK 1 043 413 65 389 1 108 802 – 1 174 191 Leasing liabilities 66 732 28 698 46 751 3 427 78 876 Bank overdraft facilities, SEK 36 681 44 874 – – 44 874 Total interest-bearing financial liabilities 783 933 2 594 325 10 332 3 388 590 Non-interest-bearing financial liabilities Accounts payable – trade, SEK 61 417 61 417 – – 61 417 Accounts payable – trade, EUR 1 021 11 329 – – 11 329 Accounts payable – trade, DKK 119 177 – – 177 Other short-term liabilities 16 653 16 653 – – 16 653 Total non-interest-bearing financial liabilities 89 576 – – 89 576 Total financial liabilities 873 509 2 594 325 10 332 3 478 166 2022-12-31 Nominal amount in original currency 1 year or less 1–5 years >5 years Total Interest-bearing financial liabilities Bank loans, SEK, Real Estate 1 846 561 90 829 1 918 144 8 522 2 017 495 Derivatives 10 767 29 400 8 680 48 847 Bank loans, EUR, Industry 6 834 79 571 – – 79 571 Bank loans, SEK, Industry 53 000 55 601 – – 55 601 Investment loans, SEK 1 043 413 1 097 668 – – 1 097 668 Leasing liabilities 58 467 23 501 37 366 1 60 868 Bank overdraft facilities, SEK – 1 125 – – 1 125 Total interest-bearing financial liabilities 1 359 062 1 984 910 17 203 3 361 175 Non-interest-bearing financial liabilities Accounts payable – trade, SEK 58 876 58 876 – – 58 876 Accounts payable – trade, EUR 1 114 12 397 – – 12 397 Accounts payable – trade, DKK 112 168 – – 168 Other short-term liabilities 15 508 15 508 – – 15 508 Total non-interest-bearing financial liabilities 86 949 – – 86 949 Total financial liabilities 1 446 011 1 984 910 17 203 3 448 124
Financial exposure 2023-12-31 2022-12-31 Liabilities Loan amount Fair value Loan amount Fair value The Group Interest rate swaps 1 157 000 13 880 919 000 64 365
Liabilities Nom. amount 2024 2025 2026 2027 2028 >2029
rate swaps 2023-12-31 1 157 000 91 000 81 000 148 000 177 000 184 000 476 000 Liabilities Nom. amount 2023 2024 2025 2026 2027 >2028 The Group Interest rate swaps 2022-12-31 919 000 131 000 91 000 81 000 148 000 82 000 386 000
The Group Interest
The Group
Accounts receivable – trade, that are neither overdue nor written-down
Accounts receivable – trade that are overdue 1-30 days
31-60 days
61-90 days
Of which, provision (excluding VAT)
Total
The total cost for confirmed and suspected customer losses for the year amounted to SEK 1 072 K (767).
Offsetting agreements and similar agreements
The Group has entered into a derivative agreement under the International Swaps and Derivatives Association (ISDA) master netting agreement. The agreement means that when a counterparty cannot regulate their obligation according to all transactions, the agreement is broken and all outstanding dealings shall be regulated with a net amount. The ISDA agreement does not fulfil the criteria for offsetting in the statement of financial position. This is because offsetting in accordance with the ISDA agreement is only permitted if the counterparty or Group cannot regulate their obligations. In addition, it is not the counterparty’s or the Group’s intention to regulate dealings on a net basis or at the same juncture.
The company has not offset any amounts in the statement of financial position relating to 2023 or 2022.
Note 44 Accrued expenses and prepaid income
Note 45 Pledged assets and contingent liabilities
Note 46 Closely related parties
Close relations
The Group is owned by AB Axel Granlund, 88.0% (88.0%), and Lennart Blecher (partly through companies), 12.0%. As a result of this, transactions with the companies listed below are noted as transactions with closely related parties.
Peab AB (publ)
Karl-Axel Granlund is a board member of Peab AB (publ). Volito AB owns 5.64% of the capital and 4.99% of the votes in Peab AB (publ).
Bulten AB (publ)
Ulf Liljedahl is chairman of the board of Bulten AB (publ). Volito AB owns 24.30% of the capital and votes in Bulten AB (publ).
EQT AB (publ)
Lennart Blecher is a partner in EQT AB (publ).
Hjortseryd Skogar AB
Karl-Axel Granlund and family own shares in Hjortseryd Skogar. Purchases from and sales to have only been made for minor amounts.
Granlunden AB
Karl-Axel Granlund and family own shares in Granlunden AB. Purchases have been made amounting to SEK 0.0 million (0.8). Volito has co-investment agreements with Granlunden AB regarding nine of the EQT funds.
Joint ventures/associated companies
In addition to the closely related parties stated above, the Group has close relations with its joint ventures/associated companies, see Note 30 and 31.
Subsidiaries
In addition to the closely related parties stated for the Group, the Parent company has close relations that involve a controlling interest in its subsidiaries, see Note 28.
Of the Group’s total purchases and sales measured in SEK, 0% (0%) of purchases and 0% (0%) of sales relate to other companies within the entire group of companies to which the Group belongs.
Of the Parent company’s total purchases and sales measured in SEK, 33% (33%) of purchases and 100% (100%) of the sales relate to other companies within the entire group of companies to which the company belongs.
Transaction conditions
Sales between the Group’s different segments relate to administration fees and rents. Administration fees have been set on the basis of actual costs and utilisation. The rents are according to market conditions.
Loans between subsidiaries have interest rates set in accordance with the current finance policy. The interest rates are according to market conditions.
Summary of transactions with closely related parties 2023 2022 The
The Group
63 Distribution of overdue accounts receivable – trade 2023-12-31 2022-12-31
112 558 102 611
6
836 14 617
3 351
190
1
917 1 565
1 726 1 317
>90 days
-1 336 -825
124 052 120 475
2023-12-31 2022-12-31 The Group Personnel-related items 69 890 45 426 Prepaid rental revenue 32 742 31 396 Accrued interest expenses 5 940 6 035 Other accrued expenses 23 751 15 799 132 323 98 656 The Parent company Personnel-related items 28 467 7 876 Accrued interest expenses 2 387 3 530 Other accrued expenses 1 907 2 635 32 761 14 041
2023-12-31 2022-12-31 The Group Pledged assets For own liabilities and provisions Property mortgages 1 905 708 1 837 008 Chattel mortgages 14 700 14 700 Funds 1 846 016 1 731 470 Shares 1 792 622 1 776 546 Shares in subsidiaries 388 884 388 884 Other 411 212 416 272 Total pledged assets 6 359 142 6 164 880 Contingent liabilities Other guarantees 6 700 2 727 Total contingent liabilities 6 700 2 727 2023-12-31 2022-12-31 The Parent company Pledged assets For own liabilities and provisions Funds 1 472 106 1 469 332 Shares 849 897 930 842 Total pledged assets 2 322 003 2 400 174 Contingent liabilities Guarantees for subsidiaries 125 513 129 062 Other guarantees – 1 970 Total contingent liabilities 125 513 131 032
Transactions with the Parent company Sales to the Parent company 2 778 2 542 Purchases from the Parent company -2 178 -2 528 Interest expense to the Parent company -1 304 -486 Receivable from the Parent company – 451 Liabilities to the Parent company 33 896 13 564 Dividend paid to the Parent company -52 606 -52 606 2023 2022 The Group Transactions with joint ventures Sales to the Hyllie Point group 3 164 3 580 2023 2022
Group Transactions
Dividend from associated company
AB
12 750 11 419 Repayment of receivable
Holding AG) – 35 553 2023 2022
Group
The
with associated companies
(Bulten
(publ))
(Nordkap
Transactions
Dividend from Peab 66 800 83 500 ANNUAL REPORT
with Peab AB (publ)
The
The Group and Parent company
Transactions with EQT
The Volito Group has holdings and interests in 18 (17) of EQT’s funds, as well as outstanding obligations. Volito AB has invested in 13 funds and Volito Kapital in five funds. For 13 of the 18 funds there are co-investment agreements with AB Axel Granlund and/or Granlunden AB. Capital placed in these funds during the year amounted to SEK 75.9 million (61.6). Repaid capital amounted to SEK 41.9 million (81.2) of which realised profit amounted to SEK 22.2 million (33.9). The group-wise value of the holding in these funds on 31 December 2023 was calculated at SEK 2 332.5 million (2 217.7), while the book value at the Parent company amounted to SEK 1 672.3 million (1 684.6).
Transactions with key employees
For salaries and other remuneration, expenses and obligations concerning pensions and similar benefits, and agreements concerning severance payments to the Board and the CEO, see Note 7.
Note 47 Events after accounting year-end
In February 2024, Volito AB received 4 900 000 subscription rights in a preferential share issue for Annehem Fastigheter AB (publ).
Note 48 Information about the Parent company
Volito AB is a Swedish-registered limited company with registered office in Malmö. The address of the registered office is Skeppsbron 3, 211 20 Malmö.
The consolidated financial statements for 2023 consist of Volito AB and its subsidiaries, together referred to as the Group. The Group also includes an owned share of holdings in associated companies and joint ventures.
The company is a subsidiary of AB Axel Granlund, org.no. 556409-6013 with registered office in Malmö. AB Axel Granlund owns 88.0% (88.0%) of the capital and votes in the Volito Group and draws up consolidated financial statements for the largest group.
Karl-Axel Granlund Chairman Lennart Blecher Axel Granlund Peter Granlund Karl-Fredrik Granlund Ulf Liljedahl
Our auditor’s report was submitted on 7 March 2024 Ernst & Young AB
Martin Henriksson
Authorised Public Accountant Principal Accountant
The Group’s income statement and balance sheet, as well as the Parent Company’s income statement and balance sheet will be submitted for adoption at the Annual General Meeting on 15 May 2024.
CEO
64 2023 2022 The Parent company Transactions with the Parent company Sales to the Parent company 1 780 1 667 Purchases from the Parent company -2 178 -2 528 Interest expense to the Parent company -1 304 -486 Liabilities to the Parent company 33 859 13 564 Dividend paid to the Parent company -52 606 -52 606 2023 2022 The Parent company Transactions with subsidiaries Sales to subsidiaries 5 311 3 786 Purchases from subsidiaries -3 910 -2 944 Interest income from subsidiaries 16 249 6 610 Guarantee-related revenue 964 877 Interest expense to subsidiaries -14 157 -7 188 Receivable from subsidiaries 337 622 349 363 Liabilities to subsidiaries 296 259 347 251 Dividends from subsidiaries 9 000 9 000 2023 2022 The Parent company Transactions with associated companies Dividend from Bulten AB (publ) 12 750 11 419 Repayment of receivable (Nordkap Holding AG) – 35 553 2023 2022
Parent company Transactions with
AB
Dividend from Peab 66 800 83 500
Peab
(publ.)
Malmö, 7 March 2024
65 ANNUAL REPORT
AUDITOR’S REPORT
To the general meeting of the shareholders of Volito AB, corporate identity number 556457-4639
REPORT ON THE ANNUAL ACCOUNTS AND CONSOLIDATED ACCOUNTS
Opinions
We have audited the annual accounts and consolidated accounts of Volito AB for the year 2023. The annual accounts and consolidated accounts of the company are included on pages 35-64 in this document.
In our opinion, the annual accounts have been prepared in accordance with the Annual Accounts Act and present fairly, in all material respects, the financial position of the parent company as of 31 December 2023 and its financial performance and cash flow for the year then ended in accordance with the Annual Accounts Act. The consolidated accounts have been prepared in accordance with the Annual Accounts Act and present fairly, in all material respects, the financial position of the group as of 31 December 2023 and their financial performance and cash flow for the year then ended in accordance with International Financial Reporting Standards (IFRS), as adopted by the EU, and the Annual Accounts Act. The statutory administration report is consistent with the other parts of the annual accounts and consolidated accounts.
We therefore recommend that the general meeting of shareholders adopts the income statement and balance sheet for the parent company and the group.
Basis for Opinions
We conducted our audit in accordance with International Standards on Auditing (ISA) and generally accepted auditing standards in Sweden. Our responsibilities under those standards are further described in the Auditor’s Responsibilities section. We are independent of the parent company and the group in accordance with professional ethics for accountants in Sweden and have otherwise fulfilled our ethical responsibilities in accordance with these requirements.
We believe that the audit evidence we have obtained is sufficient and appropriate to provide a basis for our opinions.
Responsibilities of the Board of Directors and the Managing Director
The Board of Directors and the Managing Director are responsible for the preparation of the annual accounts and consolidated accounts and that they give a fair presentation in accordance with the Annual Accounts Act and, concerning the consolidated accounts, in accordance with IFRS as adopted by the EU. The Board of Directors and the Managing Director are also responsible for such internal control as they determine is necessary to enable the preparation of annual accounts and consolidated accounts that are free from material misstatement, whether due to fraud or error.
In preparing the annual accounts and consolidated accounts, The Board of Directors and the Managing Director are responsible for the assessment of the company’s and the group’s ability to continue as a going concern. They disclose, as applicable, matters related to going concern and using the going concern basis of accounting. The going concern basis of accounting is however not applied if the Board of Directors and the Managing Director intend to liquidate the company, to cease operations, or has no realistic alternative but to do so.
Auditor’s responsibility
Our objectives are to obtain reasonable assurance about whether the annual accounts and consolidated accounts as a whole are free from material misstatement, whether due to fraud or error, and to issue an auditor’s report that includes our opinions. Reasonable assurance is a high level of assurance, but is not a guarantee that an audit conducted in accordance with ISAs and generally accepted auditing standards in Sweden will always detect a material misstatement when it exists. Misstatements can arise from fraud or error and are considered material if, individually or in the aggregate, they could reasonably be expected to influence the economic decisions of users taken on the basis of these annual accounts and consolidated accounts.
As part of an audit in accordance with ISAs, we exercise professional judgment and maintain professional skepticism throughout the audit.
We also:
• Identify and assess the risks of material misstatement of the annual accounts and consolidated accounts, whether due to fraud or error, design and perform audit procedures responsive to those risks, and obtain audit evidence that is sufficient and appropriate to provide a basis for our opinions. The risk of not detecting a material misstatement resulting from fraud is higher than for one resulting from error, as fraud may involve collusion, forgery, intentional omissions, misrepresentations, or the override of internal control.
Obtain an understanding of the company’s internal control relevant to our audit in order to design audit procedures that are appropriate in the circumstances, but not for the purpose of expressing an opinion on the effectiveness of the company’s internal control.
• Evaluate the appropriateness of accounting policies used and the reasonableness of accounting estimates and related disclosures made by the Board of Directors and the Managing Director.
Conclude on the appropriateness of the Board of Directors’ and the Managing Director’s use of the going concern basis of accounting in preparing the annual accounts and consolidated accounts. We also draw a conclusion, based on the audit evidence obtained, as to whether any material uncertainty exists related to events or conditions that may cast significant doubt on the company’s and the group’s ability to continue as a going concern. If we conclude that a material uncertainty exists, we are required to draw attention in our auditor’s report to the related disclosures in the annual accounts and consolidated accounts or, if such disclosures are inadequate, to modify our opinion about the annual accounts and consolidated accounts. Our conclusions are based on the audit evidence obtained up to the date of our auditor’s report. However, future events or conditions may cause a company and a group to cease to continue as a going concern.
Evaluate the overall presentation, structure and content of the annual accounts and consolidated accounts, including the disclosures, and whether the annual accounts and consolidated accounts represent the underlying transactions and events in a manner that achieves fair presentation.
Obtain sufficient and appropriate audit evidence regarding the financial information of the entities or business activities within the group to express an opinion on the consolidated accounts. We are responsible for the direction, supervision and performance of the group audit. We remain solely responsible for our opinions.
We must inform the Board of Directors of, among other matters, the planned scope and timing of the audit. We must also inform of significant audit findings during our audit, including any significant deficiencies in internal control that we identified.
66
REPORT ON OTHER LEGAL AND REGULATORY REQUIREMENTS
Opinions
In addition to our audit of the annual accounts and consolidated accounts, we have also audited the administration of the Board of Directors and the Managing Director of Volito AB for the year 2023 and the proposed appropriations of the company’s profit or loss.
We recommend to the general meeting of shareholders that the profit be appropriated in accordance with the proposal in the statutory administration report and that the members of the Board of Directors and the Managing Director be discharged from liability for the financial year.
Basis for Opinions
We conducted the audit in accordance with generally accepted auditing standards in Sweden. Our responsibilities under those standards are further described in the Auditor’s Responsibilities section. We are independent of the parent company and the group in accordance with professional ethics for accountants in Sweden and have otherwise fulfilled our ethical responsibilities in accordance with these requirements.
We believe that the audit evidence we have obtained is sufficient and appropriate to provide a basis for our opinions.
Responsibilities of the Board of Directors and the Managing Director
The Board of Directors is responsible for the proposal for appropriations of the company’s profit or loss. At the proposal of a dividend, this includes an assessment of whether the dividend is justifiable considering the requirements which the company’s and the group’s type of operations, size and risks place on the size of the parent company’s and the group’s equity, consolidation requirements, liquidity and position in general.
The Board of Directors is responsible for the company’s organization and the administration of the company’s affairs. This includes among other things continuous assessment of the company’s and the group’s financial situation and ensuring that the company’s organization is designed so that the accounting, management of assets and the company’s financial affairs otherwise are controlled in a reassuring manner. The Managing Director shall manage the ongoing administration according to the Board of Directors’ guidelines and instructions and among other matters take measures that are necessary to fulfill the company’s accounting in accordance with law and handle the management of assets in a reassuring manner.
Auditor’s responsibility
Our objective concerning the audit of the administration, and thereby our opinion about discharge from liability, is to obtain audit evidence to assess with a reasonable degree of assurance whether any member of the Board of Directors or the Managing Director in any material respect:
has undertaken any action or been guilty of any omission which can give rise to liability to the company, or
• in any other way has acted in contravention of the Companies Act, the Annual Accounts Act or the Articles of Association.
Our objective concerning the audit of the proposed appropriations of the company’s profit or loss, and thereby our opinion about this, is to assess with reasonable degree of assurance whether the proposal is in accordance with the Companies Act.
Reasonable assurance is a high level of assurance, but is not a guarantee that an audit conducted in accordance with generally accepted auditing standards in Sweden will always detect actions or omissions that can give rise to liability to the company, or that the proposed appropriations of the company’s profit or loss are not in accordance with the Companies Act.
As part of an audit in accordance with generally accepted auditing standards in Sweden, we exercise professional judgment and maintain professional skepticism throughout the audit. The examination of the administration and the proposed appropriations of the company’s profit or loss is based primarily on the audit of the accounts. Additional audit procedures performed are based on our professional judgment with starting point in risk and materiality. This means that we focus the examination on such actions, areas and relationships that are material for the operations and where deviations and violations would have particular importance for the company’s situation. We examine and test decisions undertaken, support for decisions, actions taken and other circumstances that are relevant to our opinion concerning discharge from liability. As a basis for our opinion on the Board of Directors’ proposed appropriations of the company’s profit or loss we examined the Board of Directors’ reasoned statement and a selection of supporting evidence in order to be able to assess whether the proposal is in accordance with the Companies Act.
Malmö 7 March 2024
Ernst & Young AB
Martin Henriksson
Authorized Public Accountant
67
ANNUAL REPORT
KEY FIGURES AND DEFINITIONS
The measurements of performance and definitions below are used to describe the development of operations and to enhance comparability between periods. These correspond to the methods applied by the executive management and Board of Directors to measure the company’s financial performance.
Adjusted balance sheet total
Balance sheet total including surplus and/or under value of assets, less tax and holdings with non-controlling interest.
Adjusted equity (Net Asset Value - NAV)
The Group’s equity attributable to the Parent company’s owners adjusted for the market value of assets that are not measured at fair value in accordance with IFRS.
Adjusted equity ratio
Adjusted equity including holdings with non-controlling interest in relation to the adjusted balance sheet total.
AUM
Assets Under Management.
Average number of full-time equivalent employees (FTE)
The total number of hours worked divided by normal annual working hours, expressed as the number of full-time positions.
Debt/equity ratio
Interest-bearing net liabilities in relation to equity. Shows financial position.
EBIT
Earnings Before Interest and Taxes.
EBITDA
Earnings Before Interest, Taxes, Depreciation and Amortisation.
EBITDA margin
Earnings Before Interest, Taxes, Depreciation and Amortisation as a percentage of net sales for the year.
EBIT margin (operating margin)
Earnings Before Interest and Taxes as a percentage of net sales for the year.
Equity
Recognised Equity attributable to the Parent Company’s owners.
Equity/assets ratio
Equity including holdings with non-controlling interest as a percentage of the balance sheet total at year-end. Shows financial position.
Interest coverage ratio
Pre-tax profit plus interest expenses in relation to the interest expenses. Measurement applied to show how well the interest expenses can be covered.
MOIC Multiple Of Invested Capital.
MRO
Maintenance Repair and Overhaul
Inom Volitogruppen inkluderas i begreppet MRO:
• Installations and repair services within automation solutions
Sales and distribution of components via stores, direct orders and webshops.
Net debt
Interest-bearing liabilities less liquid funds and interest-bearing assets at year-end.
Net investment
The change during the period of the recognised value of assets (CB-OB) plus depreciation and write-downs.
OEM
Original Equipment Manufacturer
Design and assembly of automation solutions for e.g. mobile, industrial and marine applications
• Manufacturing of units and component systems and distribution of related components .
Operating margin
Operating profit/loss as a percentage of net sales.
Orders received
The sum of orders received during the period. Measures how new orders replace produced work.
Order book
The value at the end of the period of the remaining income in ongoing production plus orders received that will be produced/delivered.
Organic growth
Annual net sales compared with the previous year’s net sales, adjusted for currency effects, aquisitions and divestments.
Return on adjusted equity
The total comprehensive income for the year in relation to average adjusted equity attributable to the Parent company’s owners.
Return on equity
The total comprehensive income for the year in relation to average equity attributable to the Parent company’s owners.
Vacancy rate
Calculated as income reduction due to vacancies in relation to total rental income.
Working capital
Current assets less short-term non-interest-bearing liabilities.
68
69
Addresses
Volito AB Skeppsbron 3, SE-211 20 Malmö
Phone +46 40 660 30 00 E-mail info@volito.se Corporate identity number 556457-4639 www.volito.se
Volito Fastigheter AB Skeppsbron 3, SE-211 20 Malmö
Phone +46 40 664 47 00 E-mail info@volito.se Corporate identity number 556539-1447 www.volitofastigheter.se
Volito Industri AB Skeppsbron 3, SE-211 20 Malmö
Phone +46 40 660 30 00 E-mail info@volito.se Corporate identity number 556662-5835 www.volitoautomation.se
This English version is a translation of the Swedish original. In case of any dispute as to the interpretation of this document, the Swedish version shall prevail.
Volito is a privately owned investment group headquartered in Malmö. The business was founded in 1991, with an initial focus on aircraft leasing. After achieving rapid early success, Volito broadened its activities and started to expand.
Today, Volito is a strong, growth-oriented group based on a balanced approach to risk and reward, and a long-term perspective. The Group’s activities are divided into three diversified business areas: Real Estate, Industry and Portfolio Investments, areas that develop their own business units, business segments and subsidiaries.
VO LITO WWW.VOLITO.SE


 2022 Anita Viola
2021 Bertil Vallien
2020 Carlos Capelán
2019 Marie Louise Kold
2022 Anita Viola
2021 Bertil Vallien
2020 Carlos Capelán
2019 Marie Louise Kold