
VO LITO GROUP PRESENTATION | ANNUAL REPORT 2017
Karolina Wojcik, born in 1980, is a graphic designer and artist based in Malmö. She has always been strongly influenced by graffiti and urban subcultures, and mixes clean graphic lines, typography and pop culture colours in an illustrative style that is rich in contrasts.

With a preference for working in large formats, she is often engaged as a mural painter with commissions for Art Made This/Vasakronan, Ystad Municipality, Best Western Hotel Noble House and Street Art Österlen, among others. She has also had exhibitions at galleries such as Galerie Leger.


“In addition to a predilection for pop art and comicstrip characters, I am a big fan of subtle references
and letters as shapes. I have chosen to allude to Volito’s Malmö connections by using a word from Skåne, “Mög”, in the background where the “G” has a similar shape to the Volito logotype. To allude to the company’s focus on real estate, I have chosen rectangular elements in the form of skylines (turned horizontal for a figurative dynamic and a not overly obvious reference).”
“Last but not least, in a personal reference to the company, which was founded in 1991, I have chosen to use “91” as a part of the work’s composition.”
 Karolina Wojcik, December 2017
2016 Lennart Aschenbrenner
2015 Rodion Petroff
2014 Per Mölgaard
2013 Karen Gabel Madsen
Karolina Wojcik, December 2017
2016 Lennart Aschenbrenner
2015 Rodion Petroff
2014 Per Mölgaard
2013 Karen Gabel Madsen
Volito is a privately owned investment group headquartered in Malmö. The business was founded in 1991, with an initial focus on aircraft leasing. After achieving rapid early success, Volito broadened its activities and started to expand.
Today, Volito is a strong, growth-oriented group based on a balanced approach to risk and reward, and a long-term perspective. The Group’s activities are divided into three diversified business areas: Real Estate, Industry and Portfolio Investments, areas that develop their own business units, business segments and subsidiaries.

3
THE GROUP
THE RIGHT TIME
We can only acknowledge the passage of time. The right time, however, is a subjective judgement – a judgement that usually arises from a varying mix of facts, common sense, intuition and feelings.
For me, the consequences of the passage of time have been evident for a long while. That is why the question was put to our three children, Axel, Peter and Karl-Fredrik, as far back as 2012. It could be considered early, but we have not discussed Volito business at home, and the children had started to pursue their own paths in life. It was not apparent, therefore, how they would feel about it.
We wanted to have a long and planned process, due to the fact that the children had been consciously kept outside the company, and would therefore need plenty of time to learn the business, if they wished to take over.
As father and founder of the Volito Group it felt good that the children, after long discussions, unanimously declared that they would like to jointly take over ownership and responsibility for Volito.
Over a five-year period, Axel, Peter and Karl-Fredrik have followed a carefully tailored plan with the aim of being well prepared to lead Volito.
With not inconsiderable pride, I felt genuine confidence when handing over ownership in June 2017. The values and good sense of Axel, Peter and Karl-Fredrik will act as a guarantee for the continued successful development of Volito, with an approach based on their premises.
It felt, in other words, like it was the right time.
Karl-Axel Granlund
4


VOLITO VOLITO Volito är en privatägd investmentkoncern med huvudkontor Malmö. Verksamheten grundades 1991, ursprungligen inriktad på flygleasing. Företaget nådde snabbt framgångar varpå verksamheten breddades och Volito inledde en expansion. Idag är Volito en starkt tillväxtorienterad koncern byggd på balanserat risktagande och långsiktighet. Verksamheten är indelad tre diversifierade affärsområden: Fastigheter, Industri och Portföljinvesteringar, områden som var för sig utvecklar egna affärsenheter, affärssegment och dotterbolag. KONCERNPRESENTATION ÅRSREDOVISNING 2017 VOLITO AB ÅRSREDOVISNING 2017 5 THE GROUP
Volito is a strong, growth-oriented investment group based on a balanced approach to risk and reward, and a long-term perspective. The Volito Group’s overall objective is to optimise the return for shareholders, both through current earnings from operational activities and the value growth of the Group’s investments. In the Parent company, Volito AB, business operations are organised in three overall business areas: Real Estate, Industry and Portfolio Investments.
Volito AB 2017
Volito sums up 2017 as a strong year with positive financial results. At year-end, the Volito Group’s adjusted equity amounted to SEK 2 808.2 million, an increase of 15 % (including paid dividend). Volito’s operations and holdings have developed positively and the group has carried out several major investments. The development of existing holdings, as well as the year’s investments, have focused on the continued diversification of Volito’s business.
Definitions
Return on adjusted equity
Total comprehensive income for the year in relation to average adjusted equity.
Adjusted equity ratio Adjusted equity including holdings with non-controlling interests in relation to balance sheet total including surplus values.
6
2 750 2 500 2 250 2 000 1 750 1 500 1 250 1 000 750 500 250 0 08 09 10 11 12 13 14 15 16 17 SEK million The Volito Group, adjusted equity The Volito Group, Ten-year summary SEK million *2017 *2016 *2015 *2014 *2013 *2012 2011 2010 2009 2008 Result after financial items 130.8 78.5 147.6 134.4 -165.7 -252.7 8 8.5 121.7 8 2.5 -28.4 Adjusted equity 2 808 2 475 2 181 1 787 1 4 35 1 253 1 5 39 1 7 71 1 4 65 1 121 Return on equity (%) 12.4 13.0 2 0.5 23.7 14.8 -19.2 4.2 5.8 0.3 -3.3 Adjusted equity ratio (%) 4 6 5 0 5 0 46 4 0 4 0 4 5 56 51 4 5 Assets 5 883 4 857 4 447 4 415 4 278 4 212 3 8 50 2 9 39 2 8 21 2 9 30
THE YEAR IN BRIEF
* From 2014 the consolidated financial statements are drawn up in accordance with IFRS. The comparison information for 2012 and 2013 has been recalculated according to the new principles.
equity
value
assets
valued
fair value
IFRS.
equity
Adjusted equity The Group’s adjusted
attributable to the Parent company’s owners adjusted for the market
of
not
at
in accordance with
This applies to Bulten AB (publ), which is reported in accordance with the
method in the Group. An adjustment has been made of the proportion of equity’s value to fair value as at accounting year-end.
Business Area Real Estate consists of Volito Fastigheter, which owns and manages commercial and residential properties in the Malmö region. The portfolio contains 28 properties, divided between offices, retail, industry, warehousing and residential, with a total area of approximately 121 000 m2.
Business Area Real Estate 2017
Volito Fastigheter has had a positive 2017 and reports a strong profit of SEK 46.3 million after financial items. At year-end, the property portfolio was valued at SEK 3 229.0 million, an increase of 5.5 % (investments for the year not included). With two strategic acquisitions, Volito Fastigheter has strengthened its presence in the housing market according to plan. Volito Fastigheter has also prepared the organisation for continued expansion and forthcoming development projects.

Business Area Industry consists of Volito Automation, a business that invests in companies within industrial automation. Volito Automation has established a well-reputed organisation composed of multiple subsidiaries in Sweden, Finland and Norway.
Business Area Industry 2017
The business climate in Swedish industry has been favourable and Volito Automation has continued to increase its market shares. The consolidated operating profit before depreciation (EBITDA) amounted to SEK 9.6 million. Volito Automation has continued the development of the two business segments MRO (Maintenance, Repair and Overhaul) and OEM (Original Equipment Manufacturer), with good profitable growth in MRO. Volito Automation’s activities have included a new OEM base and acquisitions in Finland, and the opening of an office in Kiruna.
Within Business Area Portfolio Investments, Volito has significant ownership interests in both listed and unlisted companies. Volito has an ownership philosophy of engagement that aims for stable, long-term growth. The Group strives for active ownership with involvement on the companies’ boards. Volito has a diversified portfolio with holdings in Peab AB (publ), Bulten AB (publ), Anticimex AB, Sdiptech AB (publ), Avensia AB (publ) and EQT’s funds.
Business Area Portfolio Investments
2017
Peab has developed positively with a record-high order intake. The company’s share has fallen in value by approx. 2 % in 2017. Bulten has developed very positively and entered a new growth phase. The company’s share has risen by approx. 38 %. Anticimex has continued its strong growth and carried out 35 acquisitions in 12 countries. Sdiptech has increased its sales and EBITA in 2017 and carried out six new acquisitions. Sdiptech became a listed company in 2017 and its share has fallen in value by approx. 17.5 %. Avensia reports strong growth. The company’s share has fallen in value by approx. 9 % in 2017. Volito’s holdings in EQT’s funds have developed positively overall.


5
THE GROUP
INVESTMENTS FOCUSED ON CONTINUED DIVERSIFICATION
Volito has completed the third year of the group’s strategic plan and can look back on a year of good value growth in adjusted equity. The year has been characterised by a number of major investments, which all contribute to Volito’s diversification. With new acquisitions, Business Area Real Estate has strengthened its presence in the housing market according to plan. Business Area Industry has continued the development of the two segments MRO (Maintenance, Repair and Overhaul) and OEM (Original Equipment Manufacturer), with good profitable growth in MRO. Business Area Portfolio Investments has added to existing holdings, mainly through a substantial investment in Anticimex.
Since the start in 1991, Volito has based its business on a purposeful long-term approach and a good ability to balance risk and reward. Recent years have been characterised by dramatic developments in the world at large, not least geopolitically. Despite events in the wider world and a volatile market at times, we have followed the plan we launched three years ago, regarding both strategic initiatives and our financial goals. The Volito Group achieved a balance sheet total of SEK 5.9 billion in 2017. We have delivered solid value growth to our shareholders well in line with our set targets for returns.
At year-end 2017, the Volito Group’s adjusted equity amounted to SEK 2 808.2 million, which represents an increase of 15 % (including paid dividend). The increase is due to the improved profit after financial items, good value growth in our property portfolio and positive value growth in our portfolio investments.
In addition to positive developments in our operations and investments, we have carried out several major investments in
2017. The development of our existing holdings as well as the year’s investments have focused on the continued diversification of Volito’s business, in order to further balance risk and reward, and strengthen profitable growth and future cash flow.
The construction of the 110-metre-high office building in Hyllie, The Point, has proceeded according to plan in 2017. The development of Bara town centre in cooperation with Peab has progressed, including a start on construction and marketing of a new residential property.
As part of the reshaping of Volito, we have divested BF Scandinavian Aviation Academy AB (SAA) in Västerås.
For several years, SAA has been a healthy business whose services have been in great demand. SAA now has a new future with its new owners.
Business Area Real Estate
Volito Fastigheter has continued to develop its business opportunities in the attractive property market in Malmö.
With two strategic acquisitions, Volito Fastigheter has strengthened its presence in the housing market, which means a beneficial diversification of the business.
The leasing side has been positive for Volito Fastigheter with extensions of existing contracts and the signing of new long-term agreements. The market value of Volito Fastigheter’s portfolio at year-end was SEK 3 229.0 million, which is an increase of 5.5 % (investments for the year not included). The profit for the year after financial items was SEK 46.3 million.
After a period of strong expansion, Volito Fastigheter has entered a consolidation phase. In parallel, work is continuing to develop the organisation ahead of future expansion. Volito Fastigheter is prepared for new collaborations
8
comments from the ceo
THE YEAR HAS BEEN CHARACTERISED BY A NUMBER OF MAJOR INVESTMENTS, WHICH ALL CONTRIBUTE TO VOLITO’S DIVERSIFICATION.
and development projects regarding land acquisitions and new construction initiatives.
Business Area Industry
The business climate in Swedish industry has been favourable and Volito Automation’s MRO-operations have reported increased growth. Within OEM, HydX has noted higher demand. However, expected orders from two significant customers did not materialise, which adversely affected turnover. After an increased level of activity in late 2017, a stronger performance is expected in 2018. Volito Automation is in a growth phase and has continued to increase its market shares.
In 2017, Volito Automation completed its diversification by also dividing the Finnish organisation into two segments, MRO and OEM. In Sweden, HydSupply has established a base in Kiruna. In Norway, Volito Automation has initiated a regrouping in which Hyd Partner in Oslo has been wound up in order to find a better entry point to the Norwegian offshore market. Our Norwegian customers will be served by HydX in Sweden for the time being.
Turnover has increased in 2017 compared with the previous year. The consolidated EBITDA (earnings before interest, taxes, depreciation and amortisation) amounted in 2017 to SEK 9.6 million (10.5), which represents a decrease of 8 %. The financial results for 2017 have been affected by costs relating to reorganisation and acquisitions amounting to approx. SEK 2.0 million.
Volito Automation aims to carry on its expansion and diversification, and is continuing to look for new acquisition opportunities.
Business Area Portfolio Investments
Business Area Portfolio Investments previously consisted of our holdings in Peab AB (publ) and Bulten AB (publ). During 2017, we have expanded the business area with a considerable
investment in Anticimex, a business that we deem of great interest, not least from a diversification perspective. We have also invested in Sdiptech AB (publ), a specialised technology group in urban infrastructure. Urbanisation and population growth are driving factors for both Anticimex and Sdiptech, which
2017, Bulten has entered a new growth phase, based on successively increased volumes after switches to new vehicle models, as well as deliveries relating to a major contract. During 2017, Bulten decided to invest in strategically important facilities and established operations in the American market.
VOLITO FASTIGHETER HAS
STRENGTHENED
ITS PRESENCE IN THE HOUSING MARKET.
represent good additions and offer balance in relation to our other operations and holdings. From 2017, Business Area Portfolio Investments also includes Avensia AB (publ), a leading e-commerce company, and our funds in EQT.
Peab – profitable growth and strong order book
Peab is one of the leading construction and civil engineering companies in the Nordic countries. Volito has a long-term involvement in Peab and is one of the company’s major owners.
The company’s B share started very strongly in 2017 and then lost ground. Over the year, the share has fallen in value by approximately 2 %.
The Swedish, Norwegian and Finnish construction markets have developed positively in 2017. All of Peab’s business areas report increased order intake, a rise in turnover and improved operating profit. Good market outlooks, a record-high order book and a strong financial position create good conditions for the future.
Bulten enters new growth phase Bulten, one of the largest suppliers of fasteners to the international automotive industry, has a broad product offering. Volito is the largest owner of Bulten with 21.9 % of the shares at yearend 2017. The Bulten share increased in value by approx. 38 % in 2017.
Bulten’s markets developed positively in terms of sales and demand. From Q4 of
Bulten ends 2017 with strong financial results and increased order intake. The company’s financial position remains strong and there are continued good conditions for capturing new business.
Anticimex – decentralisation and digitalisation
Anticimex, a leading global specialist in pest control, was acquired in 2012 by EQT. Since then, Anticimex has carried out over 100 international acquisitions, launched operations in 11 new countries and championed digitalisation of the sector, with initiatives such as the introduction of the digital pest control system, Anticimex SMART. In the same period, Anticimex has achieved a threefold rise in turnover and a more than fourfold increase in its operating profit. The key to success has been a strong, decentralised business model.
In 2017, with an aim to further stimulate growth in the Anticimex group, EQT offered a small group of selected actors the opportunity to buy minority shares in the company. Volito AB is one of the company’s new joint owners.
Anticimex can look back on 2017 as a year of continued strong growth. The company has continued its global expansion during the year and carried out 35 acquisitions in 12 countries. Anticimex’s decentralised business model continues to underpin success.
9
THE GROUP
comments from the ceo – continued
EQT – a world-class investment firm

EQT is a leading investment firm with interests in Europe, Asia and the USA. At present, EQT has 25 funds, which in turn own portfolio companies in equity, mid-market, infrastructure, credit and ventures. The portfolio companies have total sales of EUR 19 billion, and 110 000 employees.
is attributable to operational progress such as increased sales and improved efficiency.
Sdiptech – a good balance between growth and profitability Sdiptech is a specialised technology group in urban infrastructure. The group consists of 25 companies and has a decentralised business model.
The future
Volito is a co-owner of Sdiptech with 1.3 % of the shares at year-end 2017. The share was listed in 2017, with the first trading day on 12 May. The share fell in value by approx. 17.5 % in 2017.
SINCE 2017, BUSINESS AREA PORTFOLIO
INVESTMENTS CONSISTS OF HOLDINGS IN PEAB, BULTEN, ANTICIMEX, SDIPTECH, AVENSIA AND OUR FUNDS IN EQT.
Volito has holdings in seven of EQT’s funds, and there are strong points of contact in terms of business approach and core values. EQT’s funds invest in companies, sectors and regions where there is potential for strong growth by consistently applying an industrial approach, specialised consulting and a growth-oriented strategy. The aim is to achieve genuine, lasting improvements and sustainable growth.
During ownership by EQT’s funds, portfolio companies have achieved average annual increases in their number of employees (9 %), sales (10 %) and EBITDA (11 %). The greater part of earnings
Avensia – growth and good demand Avensia is a leading e-commerce company with approx. 150 employees in Lund, Helsingborg, Copenhagen, Oslo and Cebu in the Philippines.
Volito is a co-owner of Avensia with 2.3 % of the shares at year-end 2017. Over the past three years, the share has risen by approx. 63 %. The share has fallen in value by approx. 9 % in 2017.
After a successful and intensive 2017, in which we have carried out a number of major investments, we look forward to 2018 with great confidence. We expect a year with conditions in the world at large similar to 2017, where we can anticipate continued global growth and expect interest rate rises in Sweden and abroad. Volito has a number of new investments that will be integrated. In addition, our support functions now have new systems and procedures, which aim to provide better support for our business operations. In view of this, 2018 will be a year of consolidation in which we will benefit from implemented investments. Our strategic plan remains in place and Volito will continue to deliver solid returns to shareholders. In parallel, work continues on balancing risk and reward through increased diversification – of Volito as a whole, and within the respective business areas.
The world is in a state of constant change and there is a rapid structural transition towards increased automation and digitalisation. This will create new opportunities for Volito. We are financially strong, enriched by knowledgeable and skilled staff, and have an efficient structure – a combination that gives us good conditions to take on new challenges and lift Volito to new heights.
10
Ulf Liljedahl President and CEO, Volito AB
Volito Fastigheter has continuously developed its portfolio in order to strengthen its presence in the Malmö region’s most attractive areas.
The company’s aims include positioning Volito Fastigheter as one of Malmö’s most well known real estate companies, and the best in terms of property management and customer relations.

11
Business Area Real Estate consists of Volito Fastigheter, which owns and manages commercial and residential properties in the Malmö region. The business is characterised by a long-term approach, efficient property, a high level of service and close relations with customers and partners.
REAL ESTATE
Volito Fastigheter has continued to develop its business opportunities in 2017 – another year characterised by an attractive property market in Malmö. With the acquisition of Carl Gustaf 4 on Gustav Adolf Square and Elefanten 41 in the Lugnet area, the company has continued its diversification through an increased presence in the housing market. In parallel, the organisation has been strengthened with a focus on new construction projects.
% 1 4 1 6 24 13 51 12 3 000 2 500 2 000 1 500 1 000 500 0 13 14 15 16 17 Distribution by category and m2 Offices Trade Industry Residential School Hotel Restaurant STRATEGIC INVESTMENTS IN THE HOUSING MARKET SEK million Market value of real estate holding The Volito Fastigheter AB Group, Five-year summary SEK million 2017 2016 2015 2014 2013 Rental income 155.5 147.4 138.1 142.3 151.1 Profit after financial items 46.3 58.7 52.8 46.6 39.4 Equity 1 324.7 1 155.2 1 019.3 881.1 858.1 Real estate market value 3 229 2 764 2 560 2 307 2 311
In accordance with Volito’s expansion plan, it is our expressed objective to continue increasing the value of our property portfolio, as well as raise the operation’s revenues and profit. The market in 2017 has continued to be attractive and has been very similar in important respects to the previous year. Interest rates have begun to move upwards, but the rise is marginal and low interest rate conditions are expected to continue for some time.
Strong acquisitions in the housing market
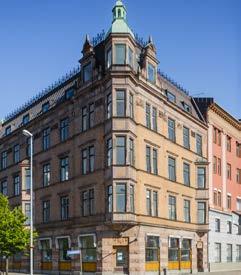
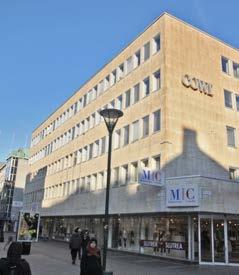
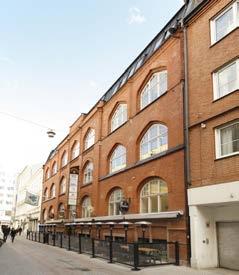
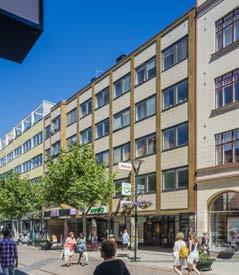
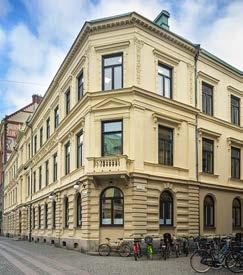
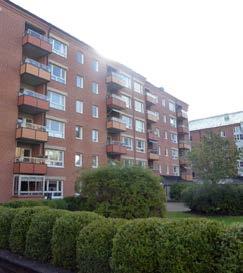
Despite a market with few acquisition opportunities in Malmö, Volito Fastigheter has acquired Carl Gustaf 4 on Gustav Adolf Square and Elefanten 41 in the Lugnet area. Carl Gustaf 4 is one of Malmö’s most well known modernistic buildings and offers both commercial premises and housing. We have initiated marketing of the vacant office and shop spaces and will continue the top-quality renovation of the premises in consultation with the new customers. Elefanten 41 is a purely residential property with 94 apartments. The property will be taken in possession from 1 February 2018. With these acquisitions, we have continued our diversification according to plan through an increased presence in the housing market. Our portfolio continues to be concentrated along a central line from Triangeln to Skeppsbron in Malmö.
The Point takes shape
In a joint venture with Peab, we began the construction of The Point – a 110-metre-high office building in Hyllie on the outskirts of Malmö – in 2016. Construction has progressed according to plan in 2017. The bottom slab is in place, the floor structure has begun to take shape and in 2018 we will see the building shoot up skywards. We have begun to lease space and there is
considerable interest. The Point will be finished in late 2019/early 2020.
New construction
in Bara town centre
In cooperation with Peab, the development of Bara town centre is progressing. We have begun the construction of a new five-storey residential building on Värby Square and started marketing the apartments. Both of the retail premises in the building are leased – to a pizzeria and a chemist’s – which further improves local services for Bara town centre residents. The moving in date is expected to be in July 2018. In parallel, development of the town centre is continuing with our construction of new, modern premises for the Swedish Dental Service. The work is expected to be finished in late 2018.
New agreements
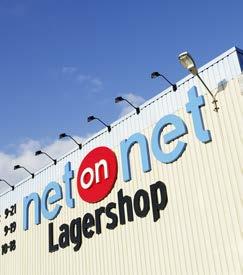
During the year we have signed new tenancy agreements as well as extensions of existing agreements. NetOnNet, for example, has signed a new long-term agreement concerning existing premises in Arlöv. In connection with expansion, BDO, the accountancy and business advisory firm, chose to move between two of our central properties to larger premises at Ran 9. In the same property we welcome Doro, which has chosen to site its head office at Skeppsbron. We have also signed an agreement with Nordic Cleanware regarding large premises at Bronsdolken 26.
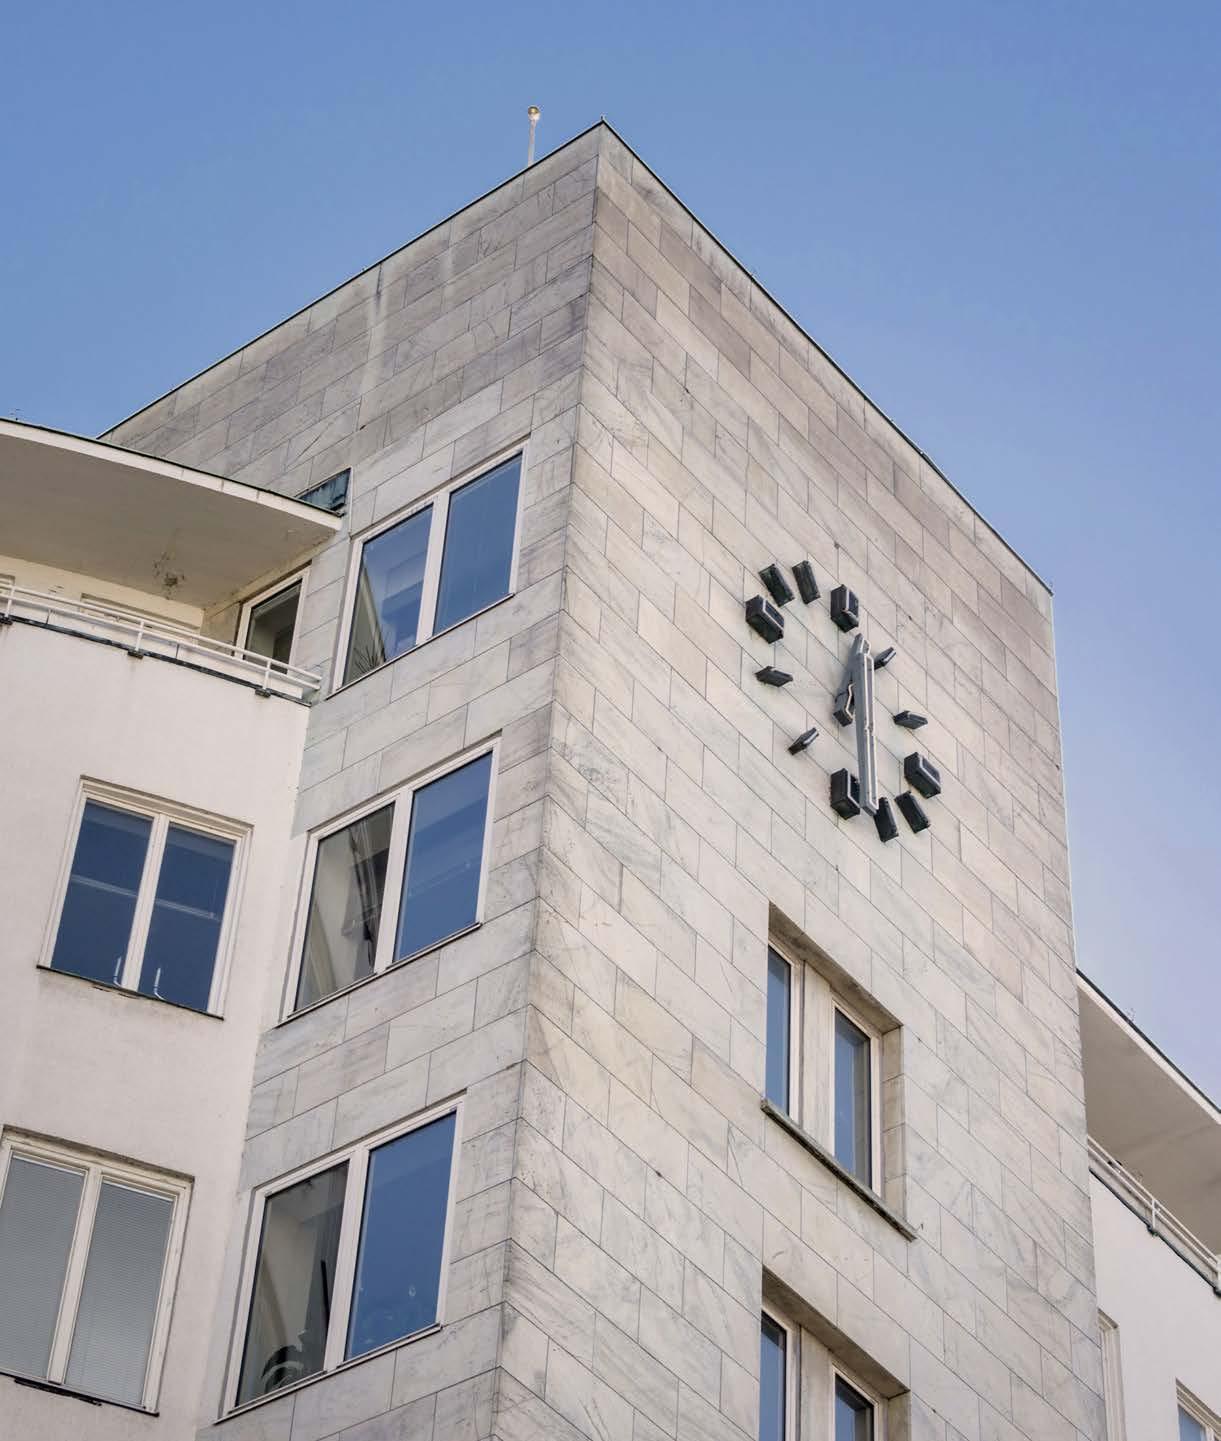
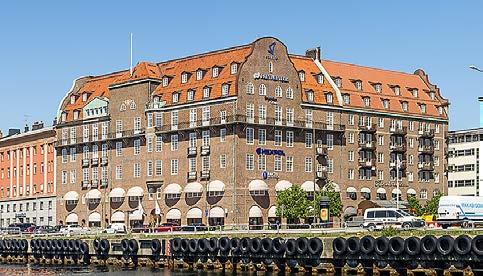
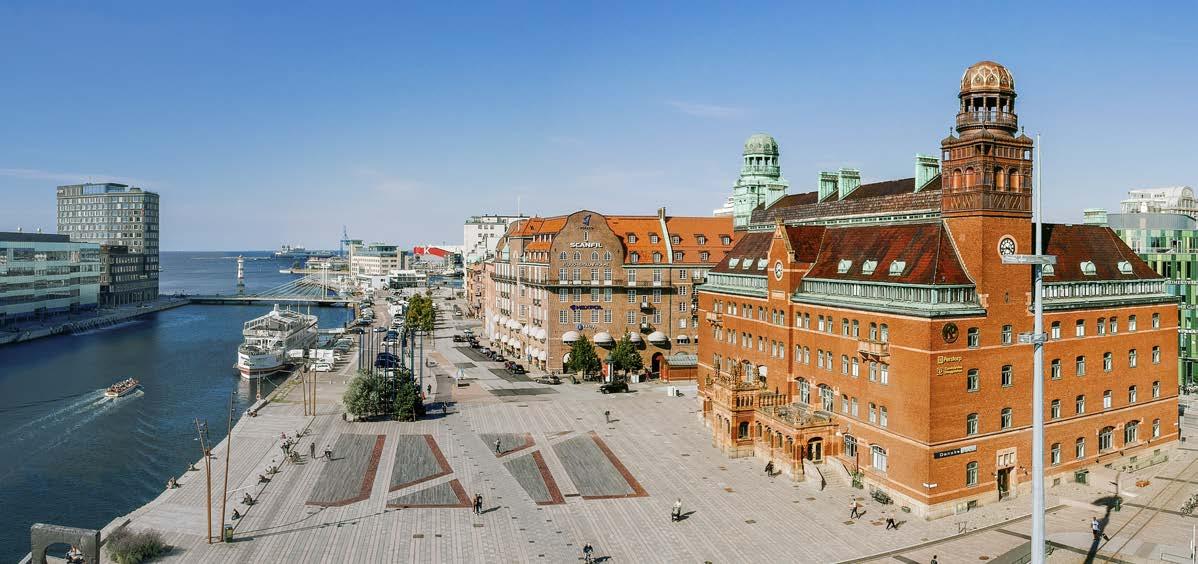
Central Post Office tower unveiled
After a long and discreet process, we have unveiled the Central Post Office building’s newly renovated south tower. The renovation is a considerable investment and the residents of Malmö can now see the tower in its original condition with new copper and splendid decoration covered in gold leaf.
Profit for the year
The profit for the year for 2017 after financial items was SEK 46.3 million. Rental income has increased compared with the previous year and overall we are satisfied with the development of our operations. Interest rates have begun to rise, but still remain low.
Consolidation and new business opportunities

During 2017, we have strengthened our presence in the housing market, which means an advantageous diversification of our operations. After strong expansion in 2017, a phase of consolidation awaits in 2018, as well as a somewhat lower rate of growth. Concurrently, we will be developing the business for future expansion. New partnerships for land acquisition and new construction projects are of interest, both in Malmö and the surrounding area. We also see great possibilities for our properties in Nyhamnen. The area is to undergo a major transformation, which will provide space for a large number of apartments, offices and shops. To provide an increased emphasis on these issues, we have strengthened the organisation with an experienced property developer whose work will focus on new construction and development projects.
We can look back on 2017 as an exciting year in which we have taken several significant steps forward in our expansion. I would like to extend a big thank you to our customers, business partners and colleagues. I look forward with considerable confidence to continuing the development of Volito Fastigheter together with you.
13
REAL ESTATE
Pelle Hammarström Managing Director, Volito Fastigheter

MALMÖ 1 2 3 4 5 21 22 23 24 7 10 9 6 11 8 27 26 25 28 17 18 19 20 14 1 2 3 12 13 14 15 16 REAL ESTATE HOLDING December 31, 2017 Property Aegir 1 Address Carlsgatan 1 Area 7 744 m 2 Property Ran 4 Address Skeppsbron 3 Area 4 568 m 2 Property Ran 8 Address Skeppsbron 7 Area 1 084 m 2
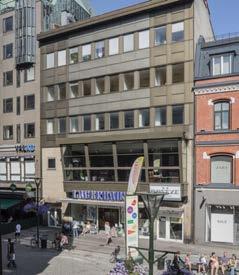
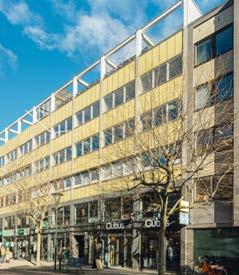


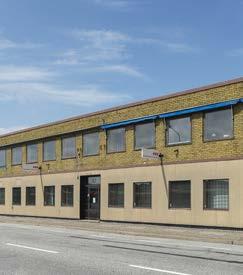


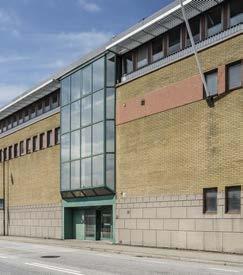

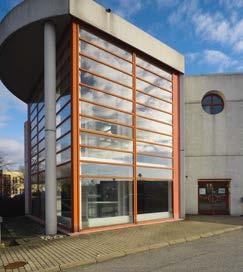
15 4 9 14 19 24 5 10 15 20 25 6 11 16 21 26 7 12 17 22 27 18 8 23 13 28 Property Ran 9 Address Jörgen Kocksg. 1 Area 7 892 m 2 Property Stjärnan 10 Address Engelbrektsg. 6 Area 975 m 2 Property Hamnen 22:2 Address Jörgen Kocksg. 3 Area 7 719 m 2 Property Claus Mortensen 29 Address Södergatan 16 Area 3 047 m 2 Property Diana 28 Address Engelbrektsg. 5 Area 902 m 2 Property Söderport 8 Address Per Weijersg. 4 Area 1 956 m 2 Property Sankt Peter 3 Address Östergatan 30 Area 3 360 m 2 Property Delfinen 17 Address Södra Förstadsgatan 4 Area 3 034 m 2 Property Visenten 20 Address S Förstadsg. 26 Area 3 497 m 2 Property Söderhavet 5 Address Elbegatan 5 Area 1 708 m 2 Property Flygkameran 2 Address Höjdroderg. 7–9 Area 1 429 m 2 Property Laxen 23 Address S Förstadsg. 32 Area 2 347 m 2 Property Söderhavet 6 Address Elbegatan 7 Area 1 406 m 2 Property Runstenen 16 Address Käglingevägen 37 Area 3 068 m 2 Property Laxen 23 Address S Förstadsg. 34 Area 7 476 m 2 Property Segeholm 10 Address Ågatan 1 Area 14 962 m 2 Property Bronsdolken 26 Address Stenyxegatan 25B Area 2 221 m 2 Property Medusa 3 Address Carlsgatan 42 Area 1 300 m 2 Property Hangaren 2 Address Flygplansg. 1–3 Area 2 200 m 2 Property Bronsdolken 26 Address Stenyxegatan 25A Area 3 423 m 2 Property Medusa 4 Address Carlsgatan 44 Area 7 201 m 2 Property Carl Gustaf 4 Address Gustav Adolfs torg 8 A-c Area 7 617 m 2 Property Flygledaren 7 Address Höjdroderg. 22 Area 1 971 m 2 Property Elefanten 41 Address Lugna gatan 38 Area 7 090 m 2 Property Kupolen 3 Address Krossverksg. 7–17 Area 10 037 m 2 REAL ESTATE
THE POST OFFICE’S GOLDEN TOWER IS UNVEILED!
After a long, discreet process, Volito Fastigheter has unveiled the Post Office building’s newly renovated south tower. The tower has been carefully restored to its original condition of 1906 with all the copper work and gold decoration in place – a significant investment that delights the whole of Malmö. Now, a corresponding renovation of the north tower is being planned.
The Central Post Office was built between 1900 and 1906 in the national romantic style. Its architect, Ferdinand Boberg, also designed Rosenbad and Stockholm’s Central Post Office. The Post Office has been a protected building since 1935, and was acquired by Volito Fastigheter in 2005.
“Under our ownership, the Post Office building has been given a total renovation,” says Christel Fryklund, head of property management at Volito Fastigheter. “Among other things, we have demolished an old extension between the wings on the east side of the building and replaced it with a modern glass structure. We have converted the old cashiers’ hall into a restaurant while preserving all the details that are typical of the period. We have also renovated all floors of the building internally and created new, very modern offices.”
The copper work on both towers is unique and among the most beautiful and complex in Sweden. However, an inspection revealed that the towers were in poor condition.
“The copper covering was damaged, pieces were missing, nails were sticking out and joints that had opened up were repaired with soft sealants and sealing compound,” says Christel Fryklund.
“We decided to initiate a renovation of the south tower and started a project in close cooperation with the County Administrative Board.”
The entire underlying structure is made of wood with a complicated and decorative moulding that has the same contours as the copper sheeting on the exterior. When the copper sheeting was removed, the woodwork was found have rot damage. The whole tower needed to be built up from scratch again.
“The copper sheeting sections were removed very carefully and then templates were made following exactly the same contours as the originals,” says Christel Fryklund. “New sheets were made in an engineering workshop. The wooden moulding was removed in its entirely, bit by bit, and then recreated at the factory. We have purchased a total of 1.4 kilometres of wood strips.”
“Apart from on the upper dome, which was restored in modern times, all the copper sheeting has been replaced,” says Christel Fryklund. “And, as the icing on the cake, our project manager found a photograph that showed the original tower was decorated with gold. These beautiful decorations have now been recreated with a double layer of gold leaf.”
Technical solutions have been improved where possible, without affecting the original appearance. Among other things, the moulding has been painted in Falun red paint for better durability, based on experience that the craftsmen acquired from work on churches in Dalarna. On the inside of the tower, the old ladders have been replaced with a safer staircase.
The project ran from February 2016 until May 2017 and was conducted together with Er-Jill Byggnadsplåt AB and Bröderna Bergström Byggnads AB. Projektuppdrag AB acted as project manager for the rebuilding work. The dome’s gold leaf decoration has been funded by the County Administrative Board.
“Properties that have protected building status are a great responsibility, and such a renovation entails a major investment,” says Christel Fryklund. “And, of course, there is the added satisfaction that the work delights the whole of Malmö. Now, we will use the experience gained from this project and initiate the renovation of the north tower. We have sent in the application for permission and, if everything goes according to plan, we can present another beautiful tower in early 2019.”
16
Business Area Industry starts up, acquires and develops industry-related businesses. Today, Business Area Industry consists of Volito Automation, a rapidly growing organisation focused on knowledge-intensive companies in industrial automation. In a short time, Volito Automation has established a well-reputed business in Sweden, Finland and Norway composed of multiple subsidiaries in hydraulic solutions.
Volito Automation stands ready to start up further automation-oriented businesses in areas such as pneumatics, electronics, control and regulation technology, and robotics.

17 INDUSTR Y

18 300 250 200 150 100 50 0 13 14 15 16 17 SEK million Total turnover The Volito Industry Group, Five-year summary SEK million 2017 2016 2015 2014 2013 Revenue 276.3 254.6 230.2 209.8 206.6 EBITDA 9.6 10.5 11.4 8.3 7.4 Result after financial items 4.7 6.4 6.2 2.5 15.5 Volito Automation has spent 2017 pursuing its diversification and further strengthening its offering and position in the market. Highlights of the year included expansion in Finland. FAVOURABLE PROGRESS FOR DIVERSIFIED VOLITO AUTOMATION
The favourable business climate in Swedish industry in 2017 has been reflected in our MRO operations in the form of increased growth, particularly in the second half of the year. Within OEM we have noted higher demand among a number of our customers. However, expected orders from two significant customers did not materialise, which adversely affected total turnover within OEM. The increased level of activity in late 2017 means that we can expect significantly improved performance in 2018. We are in a growth phase and have continued to increase our market shares in 2017.
Diversification and a strong organisation
The division of the Swedish organisation into the two segments, MRO and OEM, has been a success. The two segments, among other things, have been an element in our diversification, which in turn has given us a stronger position and a clearer offering to our customers. As expected, the MRO side’s more even revenue flow counterbalances the OEM side’s project-oriented business. The companies in Volito Automation enjoy strong cooperation on equal terms. We act as a close-knit group and attract both companies and individuals that are looking for development opportunities. During the year, we have recruited some ten new staff members who will contribute to our continued growth.
Finland – Reorganisation and expansion
During 2017, we have also carried out the division into MRO and OEM in Finland. HydX has established itself in Tammerfors and two Finnish sales
representatives have taken over responsibility for Finnish OEM customers. System sales – the success model for HydX in Sweden – has been lacking in the Finnish market until now and HydX therefore has an opportunity to increase its presence. HydroSystem is now completely focused on MRO in cooperation with the Swedish companies, HydSupply and HINDAB.
A Finnish MRO company specialising in field service operations was acquired in the spring of 2017. The business is now a part of HydroSystem and currently employs two service technicians who provide servicing and preventive maintenance at customers’ sites.
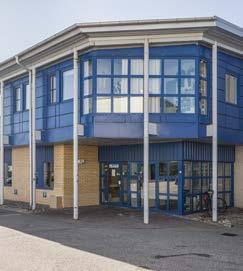
Sweden – A new base in Kiruna In 2017, we opened HydSupply and a new Parker Store in Kiruna. We can now offer high-quality service to customers in the mining industry –exploiters, partners and subcontractors.
Norway – Regrouping
The offshore industry suffered a considerable decline after we became established in Norway. As a new actor, we found it hard to compete. In the following years, the actors within offshore have implemented rationalisations, which has created better trading conditions. Our belief in success in Norway remains strong, but we have deemed that our initial investment was not the right way to proceed. In 2017, we have decided to wind up Hyd Partner in Oslo in order to find a better way in the longer term to enter the Norwegian offshore market. For the time being, our Norwegian customers will be served by HydX in Sweden.
Financial results
Our turnover has increased in 2017 compared with the previous year. The consolidated EBITDA (Earnings before interest, taxes, depreciation and amortisation) amounted in 2017 to SEK 9.6 million (10.5). The financial results for 2017 have been affected by costs relating to reorganisation and acquisitions amounting to SEK 2,0 million.
Bright future
Our strategy aims to continue pursuing Volito Automation’s expansion plan. It is also our intention to continue broadening our offering by expanding the business with automation-oriented technologies adjacent to hydraulics. We see a growing interest in hydraulic solutions that contain both hydraulics and electronics. This, together with increased demand for expertise in energy efficiency and remote monitoring, confirms the opportunities Volito Automation has in future new investments. Our aim is to be a leading Nordic actor and we continue to have our sights on industry-intensive areas in our existing national markets as well as Norway and Denmark.
Thomas Larsson Managing Director, Volito Automation

19
INDUSTR Y
HYDSUPPLY OPENS IN KIRUNA
Under the joint name, HydSupply, Volito Automation has put its MRO (Maintenance, Repair and Operations) business on the map. The investment in a strong presence in Sweden’s industry-intensive areas has been a success, and HydSupply opened in Kiruna in March 2017. The mining sector, industries and entrepreneurs are offered service, maintenance and consultation of the highest class, as well as component sales from HydSupply’s Parker Store.
HydSupply has established itself as one of Sweden’s strongest and fastest-growing service companies in hydraulics, pneumatics, transmissions and roller bearings.
“HydSupply has offices, service units, field technicians and test facilities throughout Sweden,” says Ronnie Werndin, site manager at Kiruna. “We are growing wherever Swedish industry is based and currently have facilities and sales offices in Växjö, Smålandsstenar, Nässjö, Tranås, Vetlanda, Lidköping, Stockholm, Borlänge, Örnsköldsvik, Skellefteå – and now Kiruna.”
HydSupply offers installation, maintenance, analysis, production optimisation and rigorously selected original components from the market’s most wellreputed suppliers – such as Danfoss, Parker and Bosch Rexroth. The company’s technicians and developers are among the best in the sector. Ronnie Werndin is one of the few hydraulic engineers in Sweden who has conducted research in this field. By his side, he has an equally experienced service technician.
“HydSupply handles all types of assignments,” says Ronnie Werndin.
“We design, manufacture, upgrade and install both complete equipment and individual units. We develop technology and systems. We offer advanced customer support and agreements for service and maintenance. We help our customers with repairs, both in the workshop and on site. In addition, we offer analysis and preliminary studies that we use to optimise entire production facilities in terms of production rate, energy, financial aspects, safety and availability.”
“Our strength is, and always has been, expertise,” says Ronnie Werndin. “It’s therefore out task to challenge the local market and present the advantages of engaging HydSupply as a long-term partner. HydSupply’s services are very much appreciated around the country and we have noted a growing interest here in Kiruna.”
Mining is the central industry in Kiruna and one of HydSupply’s most important sources of business. There are also many companies that support the mining industry by providing maintenance, products and services. Kiruna, for example, is one of the areas

in Sweden with the highest density of road haulage firms.
“Our catchment area actually stretches far beyond Kiruna,” states Ronnie Werndin. “Hydraulics are needed everywhere and we have a large circle of customers. It’s a region with many entrepreneurs as well as the space industry and tourism, which all require hydraulics for engineering workshops, special equipment and contractor’s machinery. We have, for instance, supplied the equipment used at the Ice Hotel in Jukkasjärvi.”
“All HydSupply’s facilities are adapted to a great degree to the local industries,” says Ronnie Werndin. “We have established our operations in Kiruna gradually. Initially, we operated purely as a sales office and brought in components from our other sites. Subsequently, as we got to know the market, we have established a fullservice facility with a warehouse stock that is becoming increasingly comprehensive. In addition, we have a Parker Store where we offer spare parts of the highest quality over the counter, such as hoses, couplings and pneumatic components.”
20
Within Business Area Portfolio Investments, Volito has significant ownership interests in both listed and unlisted companies. Volito has an ownership philosophy of engagement that aims for stable, long-term growth. The Group strives for active ownership with involvement on the companies’ boards.

Volito has a diversified portfolio with holdings in Peab AB (publ), Bulten AB (publ), Anticimex AB, Sdiptech AB (publ), Avensia AB (publ) and EQT’s funds
Peab AB is one of the leading construction and civil engineering companies in the Nordic countries. Bulten is one of the largest suppliers of fasteners to the European automotive industry. Anticimex is a leading global specialist in pest control that applies prevention, new technology and sustainable solutions to create healthy environments for companies and individuals. Sdiptech is a technology group specialising in urban infrastructure. Avensia is a leading company in e-commerce. EQT is a leading investment firm with portfolio companies in Europe, Asia and the USA.
21
PORTFOLIO INVESTMENTS

22 45 % 20 % 21 % 14 % 120 100 80 60 Distribution of net sales by business area, SEK M Construction Civil Engineering Industry Project Development Share price development 2017 Peab OMX30 index Jan Feb Mar Apr May June July Aug Sep Oct Nov Dec
Photo: Krook & Tjäder
PROFITABLE GROWTH AND STRONG ORDER BOOK
Peab has shown clear improvements in its operations in 2017. The contractor operations in the Construction and Civil Engineering business areas have delivered stable financial results, and the Industry and Project Development business areas report considerable improvements in margins. Good market outlooks, a record-high order backlog and a strong financial position create good conditions for the future.
Peab AB (publ), one of the leading construction and civil engineering companies in the Nordic countries, is active within Construction, Civil Engineering, Industry and Project Development. Volito has a long-term involvement in Peab and is one of the company’s major owners. Peab is listed on Nasdaq Stockholm (Large Cap). The company’s B share started very strongly in 2017 and then lost ground. Over the year, the share has fallen in value by approximately 2 %.
The Swedish, Norwegian and Finnish construction markets have developed positively in 2017. Order intake has increased in all business areas and the order backlog amounted at year-end to SEK 38.5 billion (33.6), which according to Peab is a record high.
The business areas Construction, Civil Engineering, Industry and Project Development report increased turnover and improved operating profit. Within Business Area Project Development,
Housing Development has continued to improve its operating margin as well as increase both production starts and sales.
Peab’s operative net sales in 2017 amounted to SEK 50 267 million (46 489), which is an increase of 8 %. The operative operating profit rose to SEK 2 425 million (2 075) and the operative operating margin improved to 4.8 % (4.5). Profitability in Construction and Civil Engineering is stable, due to our initiatives for a lower risk profile in projects, greater diversification and a focus on profitability before volume. Cash flow before financing amounted to SEK 2 295 million (2 651) and net debt to SEK 1 216 million (1 862).
Looking to the future, Peab has a positive starting position, with a well-filled order book, a good project mix, a well-dimensioned construction rights portfolio, stable market outlooks and a strong financial position. There are challenges ahead such as capacity
Financial key ratios 2017 2016
Net sales, SEK M (1 50 267 46 489
Operating profit, SEK M (1 2 425 2 075
Operating margin, % 4.8 4.5 Orders received, SEK M 45 247 41 445 Earnings per share, SEK 6.97 5.85
Dividend per share, SEK (2 4.00 3.60 Share price 31 Dec, B share 70.60 72.30
limitations in the form of resource shortages, mainly in metropolitan regions, and cost increases from certain subcontractors.
In certain submarkets, an oversupply of housing in the higher price ranges, together with heightened requirements for financing of housing, has resulted in longer sales processes. In markets where Peab is active, there is a continued need for new housing and continued substantial demand for construction relating to housing, other types of buildings and civil engineering.
Peab’s position, corporate culture and business model provide a strong base for the company’s continued striving to reach its goals: to have the most satisfied customers, and to be the best workplace and the most profitable company in the industry.
Peab’s profit share foundation 3.2 1.6
Kamprad family foundation 2.9 1.4
CBNY-Bank of Norway 2.3 1.1 SEB Investment Management 2.0 1.0
23
Volito’s holding 2017 2016 No. A shares 1 500 000 1 500 000 No. B shares 15 200 000 15 100 000 Value, SEK M 1 179 1 200
Largest shareholders (%) Capital Votes
Ekhaga Utveckling AB 20.7 48.2 AB Axel Granlund & companies 6.6 5.4 Mats Paulsson 3.8 7.6
(1 Refers to operative net sales and operative
profit (2
PORTFOLIO INVESTMENTS
operating
The board’s proposal to the AGM

22 150 120 90 60 Jan Feb Mar Apr May June July Aug Sep Oct Nov Dec Share price development 2017 Financial key ratios 2017 2016 Net sales, SEK M 2 856 2 676 Operating profit, SEK M 210 200 Operating profit margin, % 7.4 7.5 Orders received, SEK M 3 015 2 717 Earnings per share, SEK 7.98 7.27 Dividend per share, SEK
Share price
Largest shareholders (%) Capital Votes Volito AB 21.2 21.2 Lannebo
12.7 12.7 Investment AB
Spiltan
AB
JP Morgan
Volito’s holding 2017 2016 No. of shares 4 450 000 4 450 000 Value, SEK
545 396
(1 3.75 4.50
31 Dec 122.50 89.00 The shareholder register above is taken from Euroclear. The capital share, 21.9 mentioned elsewhere in the annual report is adjusted taking into account the treasury shares. (1 The board’s proposal to the AGM. 2016 amounted 3.50 as ordinary dividend and 1.00 as an extraordinary dividend.
fonder
Öresund 10.8 10.8
Fonder
4.6 4.6
3.3 3.3
M
Bulten OMX30 index
BULTEN ENTERS NEW GROWTH PHASE
Bulten ends 2017 with strong financial results and increased order intake. The year has included investments in strategically important facilities, significant contracts and the start up of operations in the USA. From Q4 of 2017, Bulten has entered a new growth phase and deems that there are good conditions for new business.
Bulten AB (publ) is one of the largest suppliers of fasteners to the international automotive industry. The company’s offering encompasses customer-specific standard products and customised special fasteners as well as technical development, line feeding and expertise in logistics, materials and production. Bulten offers a Full Service Provider (FSP) concept or selected elements of the service. The company was founded in 1873 and has approximately 1 300 employees in eight countries. Bulten’s head office is in Gothenburg.
Volito is the largest owner of Bulten with 21.9 % of the shares at year-end 2017. The share is listed on Nasdaq Stockholm. The Bulten share increased by approx. 38 % in 2017.
The group’s net sales in 2017 amounted to SEK 2 856 million (2 676), which corresponds to a 6.7 % increase. The operating profit (EBIT) amounted to SEK 210 million (200), which corresponds to an operating margin of 7.4 % (7.5). The profit after tax was SEK 159 million (146). Order intake amounted to SEK 3 015 million (2 717), which represents an increase of 11.0 %. The cash flow from operations amounted
to SEK 58 million (351) and net debt to SEK 49 million (net cash 30). The equity/assets ratio was 66.8 % (68.9) at year-end.
Of Bulten’s net sales, approx. 86 % is attributable to light vehicles and approx. 14 % to commercial vehicles. Around 90 % of total sales concern direct deliveries to vehicle manufacturers (OEM), and the remainder to the manufacturers’ subcontractors and others.
Sales of both cars and commercial vehicles have risen in 2017, and the increase is expected to continue in 2018. Bulten’s management deems that the underlying demand for light vehicles in Europe continues to be good, as does demand for vehicles that are exported from Europe to global markets.
To meet increased demand and volume rises relating to signed contracts, Bulten decided in 2017 to invest approximately PLN 80 million (approx. SEK 177 million) in a new production and logistics facility in Poland, with an estimated production start in the first half of 2019. The company has also decided to invest in a new heat
treatment facility in Hallstahammar. After establishing operations in the USA, Bulten can now offer its FSP concept in the American market.
From Q4 of 2017, Bulten has entered a new growth phase, based on successively increased volumes after switches to new vehicle models, as well as deliveries relating to a major contract. Growth is also positively affected by good demand for cars in Europe.
Bulten’s financial position continues to be strong. The company is ready for the new growth phase, and deems that there are continued good conditions for capturing new business.
25
PORTFOLIO INVESTMENTS

22 6 000 5 000 4 000 3 000 2 000 1 000 0 2014 2015 2016 2017 3,2% 5,4% 4,5% 4,2% Financial key ratios 2017 2016 Revenue, SEK M 5 434 4 452 EBITA, SEK M (1 864 664 EBITA margin, % 15.9 14.9 EBIT, SEK M 522 348 EBIT margin, % 9.6 7.8 Cash flow, SEK M 78 -348 36 % 24 % 9 % 2 % 22 % 7 % Distribution of revenue by geografical area* Sweden SouthNorth Central Asia Pacific US SEK M Revenue and organic growth development Revenue Organic growth * SouthNorth: Norway, Denmark, Finland, The Netherlands, Belgium, Italy, Spain and Portugal. Central: Germany, Austria and Switzerland. Asia: Singapore and Malaysia. Pacific: Australia and New Zeeland. (1 EBITA refers to operating EBITA
ANTICIMEX AIMS TO BE WORLD LEADER THROUGH DECENTRALISATION AND DIGITALISATION
Anticimex can look back on 2017 as a year of continued strong growth. The company has sustained its global expansion and carried out a total of 35 acquisitions in 12 countries. Anticimex’s decentralised business model continues to underpin success, as does the development of the company’s digital pest control system, Anticimex SMART.
Anticimex AB is a leading global specialist in pest control. Through prevention, new technology and sustainable solutions, Anticimex creates healthy environments for companies and individuals. Anticimex has 5 200 employees and 3 million private and company customers worldwide. The business is divided into 143 local offices in 17 countries in Europe, the Asia-Pacific region and the USA. The head office of the parent company, Anticimex International AB, is in Stockholm. The turnover in 2017 amounted to SEK 5.4 billion (4.5).
Anticimex was acquired in 2012 by EQT and has subsequently been transformed from a Nordic family company into a leading global specialist company. Since the change of ownership, Anticimex has carried out over 100 international acquisitions and introduced Anticimex in 11 new countries. The company has championed digitalisation of the sector, with initiatives such as the introduction of the digital pest control system, Anticimex SMART. Since 2012, Anticimex has achieved a threefold rise in turnover and a more than fourfold increase in its operating profit.
In 2017, with an aim to further stimulate growth in the Anticimex group, EQT offered a small group of selected actors the opportunity to buy minority shares in the company. Volito AB is one of the company’s new joint owners.
Anticimex’s vision is to be a world leader. The key to success is a strong decentralised business model. Since 2015, all of Anticimex’s 143 local offices have responsibility for their business and financial results. Each local office is responsible for its own sales and is evaluated on a monthly basis using a number of KPIs, which are common for the entire group. The business model stimulates continuous improvements.
The market is driven by the rising number of pest incidents that result from increased travel, urbanisation and increased waste production, in combination with a reduced tolerance of pests. Demand is expected to rise 5–6 % in the next five years. Stricter regulations regarding pesticides are driving an increased demand for sustainable, non-toxic solutions. The market offers considerable opportunities for major actors with the capability to develop
scalable technical solutions and digital services.
Between 2014 and 2016, Anticimex increased its turnover by more than 60 %, increased EBITA by 141 % and improved the company’s profit margin by 4.9 percentage points. In 2016, Anticimex carried out 31 acquisitions, opened up new markets in the USA and Singapore, and introduced Anticimex SMART in 15 of the company’s 16 markets.
In 2017, Anticimex has increased its turnover by 20.7 % (the equivalent of approx. SEK 1 000 million), of which 4.2 % is attributable to organic growth. The company reports operational EBITA earnings of SEK 864 million and an operational EBITA margin of 15.9 %, which represents an increase of 1.0 percentage point. During 2017, a further 35 acquisitions were carried out in 12 countries. The number of installed SMART units has increased by 64 % in 2017.
27
PORTFOLIO INVESTMENTS

22
EQT is a leading investment firm with interests in Europe, Asia and the USA. At present, EQT has 25 funds, which in turn own portfolio companies in equity, mid-market, infrastructure, credit and ventures. The portfolio companies have total sales of EUR 19 billion, and 110 000 employees. Volito has holdings in seven of EQT’s funds.
EQT’s funds invest in companies, sectors and regions where there is potential for strong growth by consistently applying an industrial approach, specialised consulting and a growth-oriented strategy. The aim is to achieve genuine, lasting improvements and sustainable growth. During ownership by EQT’s funds, portfolio companies have achieved average annual increases in their number of employees (9 %), sales (10 %) and EBITDA (11 %).
The greater part of earnings is attributable to operational progress such as increased sales and improved efficiency.
Volito has holdings in seven of EQT’s funds, and there are strong points of contact in terms of business approach and core values. In keeping with Volito’s ownership philosophy, EQT has a long-term, responsible and sustainable approach to its investments. EQT equates a responsible investment with a good transaction, and has an ambition
to create value for investors, portfolio companies and society at large. EQT has strong and close relations with all its funds’ portfolio companies, and stands behind the companies in both good and bad times. Acquired companies do not undergo a change of ownership before the set development plan has been fulfilled. A portfolio company normally stays under EQT fund ownership for four to eight years.
EQT acts as an advisor for the funds’ portfolio companies, offering key expertise in strategic business development, structural changes and financial analysis. A strict model of corporate governance is applied at all the majority-owned companies. A board, consisting of industrial advisors and sector specialists, is appointed for each new acquisition. The board defines and monitors the company’s strategic plans, and ensures that the management team
receives the support it needs in order to run the company in an efficient and responsible way.
EQT was founded in 1994 by Conni Jonsson, who previously worked at Investor. Today, Investor still owns 19 % of EQT and invests in the company’s funds. EQT has approximately 480 employees in 14 countries in Europe, Asia and the USA. The firm has 400 institutional investors and a network of 250 industrial advisors.
At year-end, Volito’s invested capital amounted to SEK 62.9 million. Repayments have been received totalling SEK 20.6 million, of which SEK 11.6 million relates to repayments of invested capital and SEK 9.0 million to realised income. Remaining obligations for these funds amounted at the same juncture to SEK 105.4 million.
Sdiptech AB (publ) is a specialised technology group in urban infrastructure. The group acquires companies that offer products and services in modernisation, new installation, renovation and maintenance in areas such as hospitals, traffic systems, water supply systems and computer centres. The group consists of 25 companies and has a decentralised business model.
Volito is a co-owner of Sdiptech with 1.3 % of the shares at year-end 2017. The share was listed on Nasdaq First North Stockholm in 2017, with the first trading day on 12 May. The share has fallen in value by approx. 17.5 % in 2017.
Avensia AB (publ), a leading e-commerce company, supplies complete omnichannel solutions to Europe-based customers in a range of sectors from sport and fashion to the manufacturing industry. Avensia has approx. 150 employees in Lund, Helsingborg, Copenhagen, Oslo and Cebu in the Philippines.
Volito is a co-owner of Avensia with 2.3 % of the shares at year-end 2017. The share is listed on Nasdaq OMX Stockholm First North Premier and has risen by approx. 63 % over the past three years. The share has fallen in value by approx. 9 % in 2017.
29 PORTFOLIO INVESTMENTS
A GOOD BALANCE BETWEEN GROWTH AND PROFITABILITY STRONG GROWTH AND CONTINUED GOOD DEMAND EQT – A WORLD-CLASS INVESTMENT FIRM
BOARD OF DIRECTORS
MANAGEMENT
30
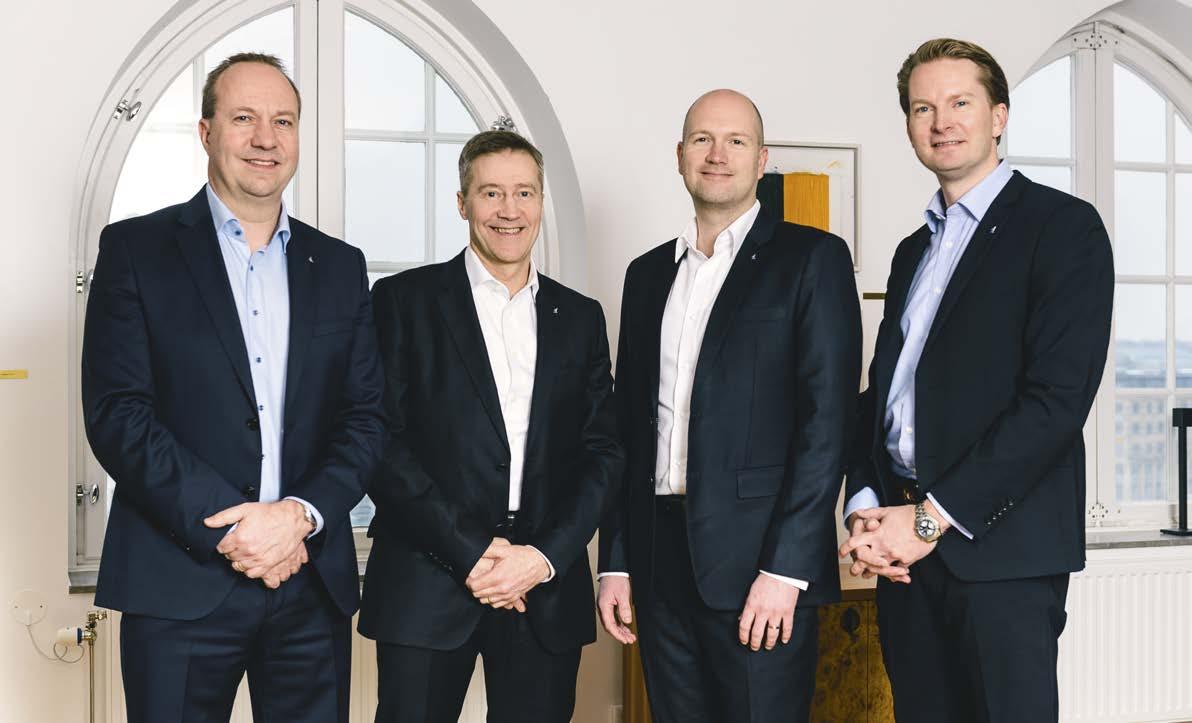
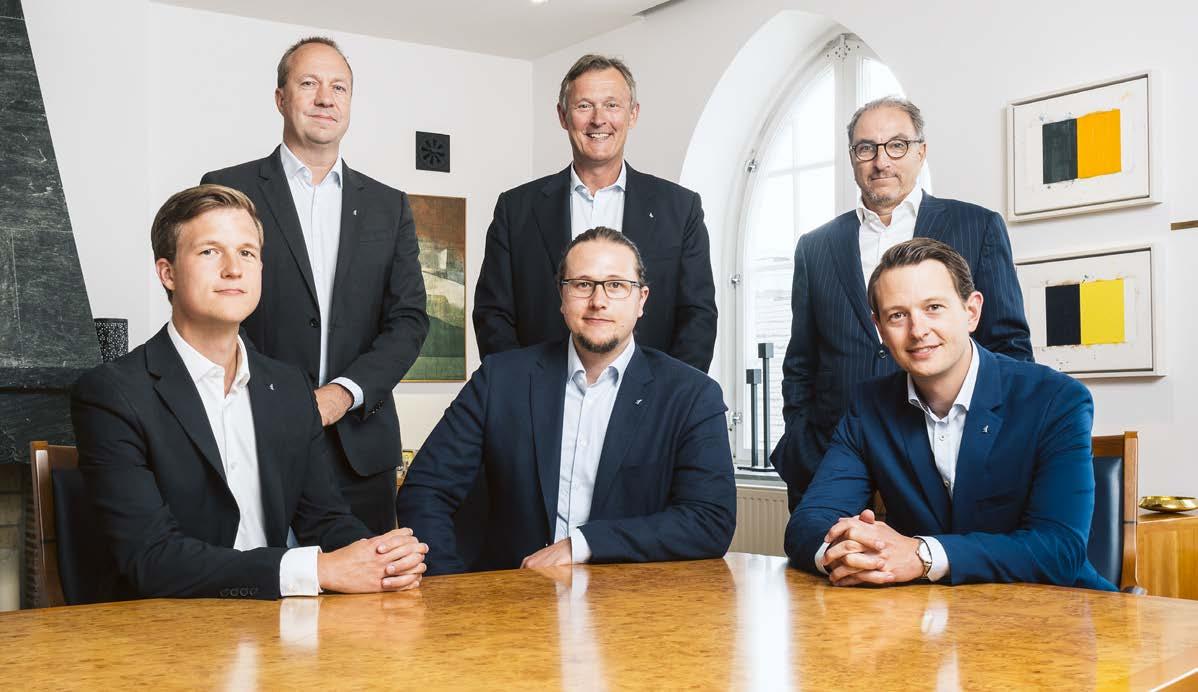
Front row, from left: Board member Karl-Fredrik Granlund, Board member Peter Granlund, Board member Axel Granlund Back row, from left: President and CEO Ulf Liljedahl (Chairman of the Board at Bulten AB (publ)), Chairman of the Board Karl-Axel Granlund (Board member of Peab AB (publ) and others), Board member Lennart Blecher (Deputy Managing Partner of EQT. Board member of Nordkap Holding AG, Zürich)
From left: Ulf Liljedahl, President and CEO, Volito AB, Pelle Hammarström, Managing Director, Volito Fastigheter AB, Fredrik Molested, CFO, Volito AB, Johan Frithiof, Managing Director, Volito Automation AB (as from 1 March 2018)
31 ANNUAL REPORT 32–35 Administration report 36 Consolidated income statement and other comprehensive income for the Group 37–38 Consolidated statement of financial position 39 Report on changes in equity for the Group 40 Consolidated statement of cash flows for the Group 41 Supplement to consolidated statement of cash flows 42 Income statement for the Parent company 43–44 Financial position for the Parent company 44 Report on changes in equity for the Parent company 45 Cash flow statement for the Parent company 45 Supplement to the cash flow statement for the Parent company 46–63 Accounting principles and notes to the accounts 62 Pledged assets and contingent liabilities for the Group and the Parent company 63 Signatures 64 Auditor’s report 67 Addresses THE GROUP ANNUAL REPORT
ADMINISTRATION REPORT
The business in brief
The Group
Volito AB (556457-4639) is the Parent company in a Group that conducts operations in the business areas Real Estate, Industry and Portfolio Investments.
Volito Fastigheter owns and manages commercial and residential properties in the Malmö region. Business Area Industry consists today of Volito Automation, an operation that invests in companies within industrial automation. Business Area Portfolio Investments has previously consisted of our holdings in Peab AB (publ) and Bulten AB (publ). The business area was expanded in 2017 with further investments.
The year in brief
Volito can look back on a year of good value growth in adjusted equity. The year was characterised by a number of major investments, which all contribute to Volito’s diversification. With new acquisitions, Business Area Real Estate strengthened its presence in the housing market according to plan. Business Area Industry continued the development of the two segments MRO (Maintenance, Repair and Overhaul) and OEM (Original Equipment Manufacturer). Business Area Portfolio Investments added to existing holdings, mainly through a substantial investment in Anticimex.
At year-end 2017, the Volito Group’s adjusted equity amounted to SEK 2 808.2 million, which represents an increase of 14.8 % (including paid dividend).
Income
The Group’s turnover amounted to SEK 432.2 million (413.5), which is an increase of 4.5 %. The increase is attributable to both Volito Fastigheter, where a reduced vacancy rate and acquisition of a new property positively affected turnover, and Volito Industry, where the acquisition of Hindab in late 2016 had a full effect in 2017. In addition, the former business area Volito Aviation is now almost entirely wound up. The operating profit was SEK 69.6 million (92.1). Volito Fastigheter became stricter in its demarcation between rebuilding and maintenance of properties, which has led to a larger proportion than previously being expensed. In addition, greater activity has led to higher costs in general.
The profit after financial income and expense was SEK 130.8 million (78.5). In 2016, there were write-downs for SEK 48.4 million on loan receivables in the wound up aviation business. The dividend from Peab was higher in 2017 than in 2016. Bulten’s financial results developed positively and this had a positive effect on Volito’s profit participations in Bulten.
The value growth of Volito’s real estate portfolio continued and the increase in 2017 amounted to SEK 167.2 million (129.2).
Interest rate swaps are used for protection against interest rate risks relating to Volito Fastigheter’s borrowings. These are valued at fair value in the balance sheet and unrealised changes in fair value of interest rate swaps of SEK 14.3 million (-2.9), have been reported in the profit or loss for the year.
The profit before tax for the Group amounted to SEK 312.3 million (204.8).
Financial position and cash flow
The Group’s financial position amounted to SEK 5 883.5 million (4 856.8) and equity relating to the Parent company’s owners amounted to SEK 2 610.6 million (2 404.9).
The Group’s total cash flow amounted to SEK -0.4 million (-54.4). The cash flow from operating activities generated a surplus of SEK 123.9 million (71.3). The year’s net investments amounted to SEK -883.2 million (-265.5), which is mainly attributable to the acquisition of shares in Anticimex for SEK 500,0 million and the acquisition of the Carl Gustaf 4 property on Gustav Adolfs Torg in Malmö for SEK 288.1 million. The net inflow from financing activities amounted to SEK 758.9 million (139.7).
The Parent company Activities
The Parent company runs no operations of its own, but manages group-wide functions for administration and finance.
Income
The turnover of SEK 7.3 million (7.8) relates primarily to the sale of services to other companies within the Group. The profit after financial income and expense was SEK 96.6 million (40.5). The profit increase is attributable to higher dividends both from subsidiaries and from the holdings in Bulten and Peab, as well as realised profit appropriations from the company’s funds in EQT.
The profit before tax amounted to SEK 101.7 million (78.1).
Financial position and cash flow
The financial position amounted to SEK 1 761.9 million (1 227.9) and equity to SEK 733.1 million (661.7). The cash flow from operational activities amounted to 77.5 million (108.8). The year’s net investments amounted to SEK -520.7 million (-97.3), of which the largest investment of SEK 500,0 million relates to Anticimex. The Anticimex purchase is wholly financed by borrowings. After amortisation and dividends to shareholders, the cash flow from financing activities amounted to SEK 443.2 million (-15.8).
Real Estate Activities
Volito Fastigheter is involved in the trade and management of real estate in the Öresund region, with a focus on commercial properties in the Malmö region. The real estate market in Malmö remained attractive in 2017 and Volito Fastigheter has continued to develop its business opportunities. With the acquisition of the Carl Gustaf 4 property, followed by the acquisition in early 2018 of the Elefanten 41 property, Volito has increased its presence in the housing market and thereby strengthened the diversification of the business. In parallel, the organisation has been strengthened with a focus on new construction.
In 2016, Volito Fastigheter and Peab started a joint venture to cooperate on the construction of the 110-metre-high office building in Hyllie, The Point. In 2017, building work has proceeded according to plan. The aim is for construction to be completed at the turn of the year 2019/2020.
In cooperation with Peab, development of Bara town centre is progressing. The construction of a new five-storey residential building, which also contains two retail premises, has begun. The moving-in date is expected to be in July 2018. In parallel, development of the centre is continuing, including the construction of modern premises for the Swedish Dental Service. The work is expected to be finished in late 2018.
In Malmö, the Central Post Office’s southern tower has been renovated and returned to its original condition using new copper and a gold leaf covering for the decorative elements.
The leasing side has been positive for Volito Fastigheter with extensions of existing contracts and the signing of new long-term agreements. The market value of Volito Fastigheter’s property portfolio was evaluated at year-end by an external assessor at SEK 3 229.0 million (2 763.7). Adjusted for investments and rebuilding, the value increase of the portfolio was SEK 167.2 million (129.2), which corresponds to 5.5 % (4.9 %) compared with the previous year.
The vacancy rate has decreased and at year-end was 11.8 % (15.4 %).
Income
Volito Fastigheter’s turnover amounted to SEK 155.5 million (147.4). The increase is mainly attributable to changes in the property portfolio and to the reduced vacancy rate. The operating profit, which amounted to SEK 86.9 million (95.9), was adversely affected by SEK 14.4 million relating to the renovation of the southern tower of the Central Post Office.
The profit after financial income and expense was SEK 46.3 million (58.7). The profit after changes in value for the year of investment properties and derivatives amounted to SEK 181.6 million (185.0). The net change in value of properties has affected income positively by SEK
32
167.2 million (129.2). Volito Fastigheter uses interest rate swaps as protection against interest rate risks relating to borrowings. These are measured at fair value in the balance sheet and unrealised changes in the fair value of interest rate swaps amounting to SEK 14.3 million (-2.9), are reported in the profit or loss for the year.
Financial position and cash flow
The balance sheet total was SEK 3 530.7 million (3 005.8) and equity amounted to SEK 1 324.7 million (1 155.2). The cash flow for the year was negative, SEK -0.2 million (-0,1). Operating activities generated a positive cash flow of SEK 43.5 million (55.3). The year’s net investments amounted to SEK -352.7 million (-209.6) and net borrowing increased by SEK 318.0 million (163.2). Volito Fastigheter paid a dividend to Volito AB of SEK 9.0 million (9.0).
Industry Activities
Volito Industry, via the subgroup Volito Automation, acquires and starts up companies within industrial automation. The group’s ambition is to be the market leader in the Nordic countries. Volito Automation has subsidiaries focused on hydraulics within several application areas. The operations cover a large number of sectors with end customers in different markets. The business area is still in a growth phase and has continued to capture market shares in 2017.
The business area has continued the development of the two segments MRO (Maintenance, Repair and Overhaul) and OEM (Original Equipment Manufacturer). The two segments have, among other things, been an element in Volito’s diversification. The MRO side’s more even revenue flow balances the OEM side’s project-oriented business.
The business climate in Swedish industry has been favourable and Volito Automation’s MRO operations have reported increased growth, particularly in the second half of the year. OEM has also noted higher demand among the group’s customers. However, expected orders from two significant customers did not materialise, which adversely affected the total turnover in OEM during 2017.
A Finnish MRO company specialising in field service operations was acquired in the spring of 2017. The business is now a part of Hydrosystem Oy. Volito Automation has also been established on the Finnish OEM market.
The offshore industry suffered a considerable decline after the business area set up operations in Norway, and as a new actor, Volito found it hard to compete. In 2017, it was decided to wind up Hyd Partner in Oslo in order to find a better way in the longer term to address the Norwegian offshore market. Our Norwegian customers will be served by HydX in Sweden for the time being.
Volito AB owns 91 % of the shares in the Volito Industry group and the Volito Group’s CEO Ulf Liljedahl owns the remaining 9 %.
Income
Volito Industry’s turnover amounted to SEK 276.3 million (254.6), which is an increase compared with the previous year and attributable to the acquisition of Hindab and captured market shares. The operating profit before depreciation was SEK 9.6 million (10.5) and after depreciation SEK 7.0 million (8.0). Volito Industry generated a profit after financial income and expense of SEK 4.7 million (6.4).
Financial position and cash flow
The financial position amounted to SEK 182.4 million (189.3) and equity to SEK -20.0 million (-23.9).
Operating activities generated a positive cash flow of SEK 12.0 million (12.8). The year’s investments amounted to SEK -16.6 million (-41.6), which were financed by net borrowing of SEK 4.4 million (31.6). The total cash flow for the year was SEK -0.2 million (2.9).
Portfolio Investments
Business Area Portfolio Investments previously consisted of Volito’s holdings in Peab AB (publ) and Bulten AB (publ). During 2017, the business area was expanded with a considerable investment in Anticimex and an investment in Sdiptech AB (publ). Urbanisation and
population growth are driving factors for both Anticimex and Sdiptech, which represent good additions and offer balance in relation to our other operations and holdings. From 2017, Business Area Portfolio Investments also includes Avensia AB (publ) and the funds in EQT.
Peab AB (publ)
Peab is one of the leading construction and civil engineering companies in the Nordic countries, active in Construction, Civil Engineering, Industry and Project Development. The company’s share is listed on Nasdaq OMX Stockholm (Large Cap).
Volito has increased its holding in Peab by 100 000 shares to 16 700 000 shares as at 31 December 2017, of which 15 200 000 class B shares, which corresponds to 5.64 % of the capital and 4.99 % of the votes. Volito has a long-term involvement in Peab and is one of the company’s major owners.
The value of the Peab share decreased in 2017. The market value of Volito’s total holding at year-end was SEK 1 179.0 million (1 200.2).
Bulten AB (publ)
Bulten is one of the largest suppliers of fasteners for Europe’s automotive industry. The product offering encompasses customerspecific standard products and customised special fasteners as well as technical development, line feeding, and expertise in logistics, materials and production. Bulten offers a Full Service Provider concept. The company’s share is listed on Nasdaq Stockholm (Mid Cap).
Volito is the largest owner of Bulten AB with a holding of 4 450 000 shares as at 31 December 2017, which corresponds to 21.9 % of the capital and votes.
Bulten reported very positive value growth during the year. The market value of Volito’s total holding at year-end was SEK 545.1 million (364.9). Bulten was consolidated as an associated company and the Volito Group’s income attributable to the holding amounted to SEK 40.8 million (37,9) including other comprehensive income.
Anticimex AB Anticimex is a leading global specialist in pest control. Through prevention, new technology and sustainable solutions, Anticimex creates healthy environments for companies and individuals.
Anticimex was acquired in 2012 by EQT and has subsequently been transformed from a Nordic family company into a leading global specialist company. In 2017, with an aim to further stimulate growth in the Anticimex group, EQT offered a small group of selected actors the opportunity to buy minority shares in Anticimex. In connection with this offer, Volito AB acquired 3.21 % of the capital and 3.31 % of the votes. The acquisition for SEK 500,0 million was carried out on 29 December and at accounting year-end this was considered to correspond with the market value.
EQT
EQT is a leading investment firm with interests in Europe, Asia and the USA. At present, EQT has 25 funds, which in turn own portfolio companies in equity, mid-market, infrastructure, credit and ventures. Volito has holdings in seven of EQT’s funds. The value of these amounted at year-end to SEK 65.1 million (38.0).
EQT has a long-term, responsible and sustainable approach to its investments and has strong and close relations with all its portfolio companies. EQT offers key expertise in strategic business development, structural changes and financial analysis. A strict model of corporate governance is applied at all the majority-owned companies. A portfolio company normally stays under EQT’s ownership for four to eight years.
Sdiptech AB (publ)
Sdiptech is a specialised technology group in urban infrastructure. The company provides specialised products and services in modernisation, new installation, renovation and maintenance in areas such as hospitals, traffic systems, water supply systems and computer centres.
In early 2017, Volito AB acquired 400 000 shares in the company, which corresponds to 1.25 % of the capital and 0.8 % of the votes. The market value of Volito’s total holding at year-end was SEK 18.5 million.
33
ANNUAL REPORT
Avensia AB (publ)
Avensia is a leading e-commerce company that supplies complete omnichannel solutions to companies with high ambitions and requirements for their business. Avensia has extensive experience of e-commerce projects and helps customers with the implementation of systems, consulting and business development in e-commerce.
Avensia is traded on NASDAQ OMX Stockholm First North Premier and has the ticker symbol, AVEN. At year-end, Volito owned 800 000 shares and the market value of the holding amounted to SEK 6.5 million (7.1).
Other holdings
In addition to the holdings above, Volito has ownership shares in other diverse small companies. The combined value of these holdings at year-end was SEK 8.6 million (29.7). During the year, the holding in Scandinavian Aviation Academy AB (SAA) was divested and this resulted in a positive effect on income of SEK 5.5 million.
Unchanged accounting principles
The accounting principles are unchanged in comparison with the previous year.
Expectations concerning future developments
The Group
After an intensive 2017, Volito is looking forward to 2018 with great confidence. In the world at large, Volito expects a year of continued global growth with interest rate rises in Sweden and abroad. Volito has a number of new investments that will be integrated and 2018 will be a year characterised by consolidation in which the Group benefits from implemented investments. The strategic plan remains in place and Volito will continue to deliver solid returns to shareholders. In parallel, work continues on balancing risk and reward through increased diversification – of Volito as a whole, and within the respective business areas.
Volito Fastigheter is entering a consolidation phase and expects a reduced rate of growth in 2018. In parallel, the business is being developed for future expansion. New collaborations for land acquisitions and construction projects are of interest. Volito also sees great potential for the group’s properties in Nyhamnen. The area is about to go through a major transformation that will provide space for a large number of apartments, offices and shops.
Volito Industry intends to keep broadening its offering by expanding the business with automation-oriented technologies adjacent to hydraulics. There is a growing interest in hydraulic solutions that contain both hydraulics and electronics. This, together with increased demand for expertise in energy efficiency and remote monitoring, confirms the opportunities that Volito has in new, future initiatives. The aim is to become a leading Nordic actor and the group is focusing on industryintensive areas both in existing business territories as well as Norway and Denmark.
The world is in a state of constant change and there is a rapid structural transition towards increased automation and digitalisation. This will create new opportunities for Volito, which is financially strong and has knowledgeable and skilled staff, and an efficient structure – a combination that provides good conditions to take on new challenges and lift Volito to new heights.
Group information
The company is a subsidiary of AB Axel Granlund, org.no. 556409-6013 with registered office in Malmö. AB Axel Granlund owns 88.0 % (88.0 %) of the capital and votes in the Volito Group and draws up consolidated financial statements for the largest group.
Information on risks and uncertainty factors
The Group Volito’s earnings, cash flow and financial position are affected by a number of factors that are to varying degrees influenced by the company’s own actions.
Risk management
Exposure to risks is a natural part of a business enterprise and this is reflected in Volito’s approach to risk management. This aims to identify risks and prevent and limit the adverse consequences that arise as a result of these risks. Management of the operational risks is a continuous process. The operational risks are managed within the organisation by the respective business areas. The financial risks are linked to the operations’ tied up capital and capital requirements, mainly in the form of interest rate risks and refinancing risks. See also note 43.
Material risks
Changes in the value of properties depend mostly on Volito Fastigheter’s own ability, through changes and refinements to properties as well as agreement and customer structures, to increase the properties’ market value, and partly on external factors that affect property supply and demand. In general, property value is less volatile for concentrated portfolios of property in good locations. Volito’s properties are predominately concentrated in the central and most expansive parts of Malmö. Most of Volito Fastigheter’s long-term rental agreements contain an index clause that means annual rental adjustments are based either on changes in the consumer price index or on a fixed percentage increase. Property valuations are calculations made according to established principles based on certain assumptions, and affect the Group’s earnings considerably. For more information on property valuations, see the Valuation principles section on page 49 and Note 22.
Credit risks
Credit risks refer to the risk of losing money due to another party being unable to fulfil their obligations.
Vacancy risks and credit risks in accounts receivable – trade Demand for premises is affected by general business conditions. Volito Fastigheter’s activities are concentrated in Malmö, which is deemed to be attractive in the long term regarding location, population growth, employment and general communications. A broad portfolio of contracts reduces the risk of large fluctuations in vacancies. Leases are divided between commercial properties (97 %) and residential (3 %). The commercial rental income is divided between 163 contracts within a number of different sectors. A combination of good local knowledge, active involvement and a high level of service creates conditions for long-term rental relations and thereby a reduced risk of new vacancies. A certain level of vacancies provides opportunities in the form of new leases and flexibility for existing tenants who want to expand or reduce their premises. Furthermore, Volito Fastigheter bears the risk that tenants are unable to make rent payments. Regular follow-ups are carried out on the tenants’ credit ratings in order to reduce exposure to credit losses. A credit rating of tenants is carried out for all new leases, and, if required, the rental agreement is complemented with personal guarantees, rent deposit or bank guarantee. All rents are paid quarterly or monthly in advance.
Within Volito Industry, risks are linked to project management. Many projects are customised and Volito bears the risk that customers cannot fulfil their obligations. Customers make advance payments on major projects in order to reduce the risk of credit losses.
Financial risks
In its business activities, the Volito Group is exposed to various types of financial risks. Financial risks relate to changes in exchange rates and interest rates that affect the company’s cash flow, earnings and thereby associated equity. The financial risks also include credit and refinancing risks.
The Group’s finance policy for managing financial risks has been designed by the Board and creates a framework of guidelines and rules in the form of risk mandates and limits for the business. Responsibility for the Group’s financial transactions and risks are managed centrally by the Group’s Finance function, which is within the Parent company. The overall aim for the Finance function is to provide cost-efficient financing and to minimise negative effects on the Group’s earnings that stem from market risks. Reporting is conducted on a regular basis to the CEO and the Board, which have overall responsibility for financial risk management. See note 43 .
34
Liquidity and financing risks
Liquidity and financing risks refer to risks of not being able to fulfil payment obligations as a result of insufficient liquidity or difficulties in arranging new loans. Volito is to be able to carry through business transactions when the opportunity arises and always be able to fulfil its obligations. Refinancing risks increase if the company’s credit rating deteriorates or a large part of the debt portfolio becomes due on a single, or relatively few, dates.
Liquidity risks are managed through both regular liquidity forecasts and Volito’s access to credit or liquid assets that can be raised at short notice in order to even out fluctuations in the payment flow.
Borrowing risks refer to risks that financing is unavailable or available on unfavourable conditions at a certain time. In order to limit financing risks, Volito strives to spread final due dates regarding credit over the longest possible period allowed by prevailing market conditions.
Part of Volito’s borrowing is linked to fulfilling financial ratios (covenants) in the form of the interest coverage ratio and equity ratio that the Group is to achieve, which is customary for this type of loan. These ratios are followed up continuously and make up a part of the management’s framework for financial planning of the business. Volito fulfilled these ratios by a good margin at year-end.
Currency exposure
The Volito Group has for many years been exposed to risks relating to exchange rate changes, principally through its involvement in aircraft leasing. As this business is in the final phase of being wound up, this risk is considered to be small.
Interest rate exposure
The Volito Group is exposed to changes mainly in short-term interest rates through its involvement in the Volito Fastigheter AB group. The Parent company, Volito AB, also has risk exposure relating to shortterm interest rates. Volito’s policy regarding interest rates is that fixed rate terms for the portfolio shall be well balanced and adjusted to the company’s prevailing view of the interest rate market at that time.
Interest costs are the largest single cost item for Volito. How much and how fast a change in interest rates makes an impact on earnings depends on the chosen fixed interest term. A rise in interest rates is often initiated by higher inflation. In commercial rental contracts, it is normal that the rent is index-adjusted upwards for inflation.
A combination of loans with short fixed interest terms and utilisation of financial instruments in the form of interest rate swaps enables flexibility to be achieved, and the fixed interest term and interest rate level can be adjusted so that the aim of the financing activity can be achieved with limited interest rate risk. This is without underlying loans needing to be renegotiated. In order to manage the interest rate risks and achieve even development of net interest income, the average fixed interest term for Volito’s interest-bearing debts has been adjusted according to the assessed risk level and interest rate expectations. Interest rate derivatives are valued at fair value. If the agreed interest for the derivative deviates from the expected future market interest rate during the derivative’s duration, a change in value arises that affects the company’s balance sheet and income statement, but not the cash flow. The risk reduction in interest payments from longer fixed interest terms often creates a larger risk in derivative value, due to the time factor. When the term of the derivative has expired, the value of the interest rate derivative is always zero.
Overall, the Volito Group’s total loans exposed to short-term interest rates amount to SEK 1 706.2 million (1 064.3). Hedging relating to 60.1 % (62.6) of the debt portfolio of the Volito Fastigheter AB group, corresponding to 38.4 % (46.2) of the entire Volito Group, is managed with swaps, something that gives the company a higher degree of flexibility in terms of future debt management.
The nominal amount of Volito Fastigheter’s outstanding interest rate swaps at year-end 2017 was SEK 1 063.0 million (913.0). At year-end 2017 the fixed interest rates varied from -0.18 % (0.18 %) to 3.45 % (3.56 %) and the floating interest rates are STIBOR 3-months with a supplement for a margin relating to borrowing in SEK.
Refinancing risks
The Volito Group depends on a functioning credit market. The Group has a need to continuously refinance parts of its business, see Note 40. The Group has a satisfactory equity ratio and borrowing capacity. It is therefore Volito’s assessment that there is at present no problem concerning the credit that is due for refinancing.
Taxes
Volito’s current tax expense is lower than the nominal tax on the pre-tax profit or loss, which is due to higher fiscal depreciation in properties than in the accounts and to unrealised changes in value that are not included in the fiscal results. Political decisions regarding changes in corporate taxation, tax legislation or their interpretation can lead to changes in Volito’s tax situation.
Operational risks
Good internal control procedures for important processes, fit-forpurpose administrative systems, competence development and reliable valuation models and principles are methods for reducing operational risks. Volito works continuously to monitor, evaluate and improve the company’s internal control procedures.
Information on non-financial earnings indications
Volito’s employees
The Volito Group is a relatively small organisation that handles large amounts of capital. Therefore the wellbeing and development of the Group’s employees are of vital importance for the long-term prosperity of the Group.
Volito uses employment conditions as a competitive factor for attracting suitable, people with the right set of skills. Different events are regularly organised within the Group’s various companies to further strengthen team spirit and company loyalty.
Proposed allocation of the company’s profit
The Board of Directors and CEO propose that the unappropriated earnings, SEK 468.094.340,47 are allocated as follows (SEK K):
Dividend, [2 440 000 * SEK 14.85 per share] 36 234 Retained earnings carried forward 431 860
Total 468 094
The Group’s equity has been calculated in accordance with the EUdeveloped IFRS standards and interpretations of these (IFRIC), and in accordance with Swedish law through the application of the Swedish Financial Accounting Standards Council reporting recommendation RFR 1 Supplementary reporting rules for groups.
The Parent company’s equity has been calculated in accordance with Swedish law through the application of the Swedish Financial Accounting Standards Council reporting recommendation RFR 2 Reporting for legal entities. The proposed dividend reduces the Parent company’s equity ratio to 40 % from 42 %. The equity ratio is prudent, in view of the fact that the company’s activities continue to operate profitably. Liquidity in the Group is expected to be maintained at a similarly stable level.
The Board’s understanding is that the proposed dividend will not hinder the company from carrying out its obligations in the short or long term nor from conducting necessary investments. The proposed dividend is thus defensible with consideration to what is stated in ABL chapter 17, section 3, paragraph 2-3 (prudence principle).
For further information on the company’s earnings and position, refer to the subsequent income statements and statements of financial position, and related notes to the financial statements.
35
ANNUAL REPORT
Consolidated income statement and other comprehensive income for the Group
Note Amounts in SEK K 2017 2016
3
Net sales 432 171 413 473 4 Other operating income 702 1 537 5 432 873 415 010
Operating expenses
Raw materials and consumables -160 736 -148 845
Real estate expenses -47 800 -31 357 6, 9 Other external expenses -40 212 -40 522 7 Personnel expenses -107 165 -95 659 8
Depreciation and amortisation of tangible and intangible fixed assets -6 014 -5 542 10 Other operating expenses -1 311 -981
Operating profit 69 635 92 104
Profit or loss from financial income and expense
12 Profit or loss from participations in joint ventures 3 464 -45 289 13 Profit or loss from participations in associated companies 41 208 32 312 14 Profit or loss from other financial income and expense 65 101 48 654 15 Interest income and similar income 7 858 4 628 16 Interest expense and similar expenses -56 495 -53 930
Profit after financial income and expense 130 771 78 479 17
Changes in value of investment properties 167 243 129 231 18 Changes in value of derivatives 14 332 -2 891
Profit before tax 312 346 204 819 19 Taxes -46 724 -44 133
Profit for the year 265 622 160 686
20
Other comprehensive income
Items that have been or can be transferred to profit or loss for the year
Translation differences from translation of foreign operations for the year -2 124 8 642
Translation differences transferred to profit or loss for the year – -46 970
Changes in fair value of assets available-for-sale for the year -26 830 132 529
Tax attributable to items that have been or can be transferred to profit or loss for the year -1 332 -794
Changes in fair value of financial assets available-for-sale transferred to profit or loss for the year -2 672 -4 365
Participations in other comprehensive income of associated companies and joint ventures 5 464 5 607
Other comprehensive income for the year -27 494 94 649
Total comprehensive income for the year 238 128 255 335
Profit or loss for the year attributable to:
Shareholders in Parent company 265 622 184 777 Holdings with non-controlling interest – -24 091
Profit for the year 265 622 160 686
Total comprehensive income for the year attributable to: Shareholders in Parent company 238 128 274 840 Holdings with non-controlling interest – -19 505
TOTAL COMPREHENSIVE INCOME FOR THE YEAR 238 128 255 335
36
Consolidated statement of financial position
Note Amounts in SEK K
ASSETS
2017-12-31 2016-12-31
Fixed assets 21 Intangible assets 63 635 61 912 22 Investment properties 3 229 000 2 763 700 23 Industrial premises 4 180 4 455 24 Machines and other technical fixed assets 2 704 2 636 25 Equipment, tools and installations 21 498 21 362 26 Fixed assets under construction and advances regarding tangible fixed assets 17 375 12 732 29 Participations in joint ventures 59 649 32 347 30 Receivables from joint ventures 185 399 150 252 31 Participations in associated companies 368 952 362 555 32 Receivables from associated companies 0 0 33 Other long-term securities holdings 1 777 676 1 256 845 34 Deferred tax assets 4 500 1 308 35 Financial leasing agreements 25 799 26 816 36 Other long-term receivables – 1 999
Total fixed assets 5 760 367 4 698 919
CURRENT ASSETS
Inventories 57 088 54 524 43 Accounts receivable – trade 38 455 48 962 Receivables from group companies 3 101 12 000 Receivables from associated companies 36 174 Tax receivables 3 033 2 566
Other receivables 6 913 6 049 37 Prepaid expenses and accrued income 8 146 8 824 Short-term investments – 18 096 38 Cash and bank balances 6 351 6 662
Total current assets 123 123 157 857
TOTAL ASSETS 5 883 490 4 856 776
37
ANNUAL REPORT
Consolidated statement of financial position
Note Amounts in SEK K
EQUITY AND LIABILITIES
39 Equity
2017-12-31 2016-12-31
Share capital 244 000 244 000
Other contributed capital 21 005 21 005
Reserves 749 466 776 960
Retained earnings including profit or loss for the year 1 596 110 1 362 955
Equity attributable to shareholders in Parent company 2 610 581 2 404 920
Holdings with non-controlling interest 0 0
Equity 2 610 581 2 404 920
Liabilities
40, 43 Liabilities to credit institutions
2 804 516 2 011 056
Other long-term liabilities 5 000 5 000 34 Provisions for deferred tax 302 524 252 432
Total long-term liabilities 3 112 040 2 268 488 40, 43 Liabilities to credit institutions 14 692 11 794 40, 41, 43 Bank overdraft facilities 29 376 48 051
Advances from customers 74 942
Accounts payable – trade 42 180 38 997 Liabilities to subsidiaries 117 136 Current tax liabilities 2 160 2 717 Other liabilities 8 977 23 841 44 Accrued expenses and deferred income 63 293 56 890
Total short-term liabilities 160 869 183 368
TOTAL EQUITY AND LIABILITIES 5 883 490 4 856 776
38
Report on changes in equity for the Group
Amounts in SEK K
EQUITY, 31 DECEMBER 2015
Share capital
Other contributed equity
Foreign exchange reserve
Availablefor-sale reserve
Retained earnings incl. profit or loss for the year Total
Holdings with noncontrolling interest Total equity
244 000 21 005 40 185 642 126 1 171 544 2 118 860 89 292 2 208 152
Total comprehensive income for the year Profit for the year 184 777 184 777 -24 091 160 686
Adjustment of foreign exchange reserve, 1) -46 970 46 970 – – –Foreign exchange reserve, assoc. companies 2) 5 607 -5 607 – – –Other comprehensive income 8 642 127 370 1 021 137 033 4 586 141 619
Total comprehensive income for the year – – -32 721 127 370 227 161 321 810 -19 505 302 305
Adjustment of holdings with non-controlling interests’ profit participation – – -23 080 -23 080
Transactions with Group owners
Contributions from and value transfer to owners
Dividends paid -29 280 -29 280 -2 800 -32 080 Repayment of shareholders’ contribution – – -5 350 -5 350 Acquisitions -265 -265 – -265 Share-related remuneration 393 393 – 393
Contributions from and value transfer to owners – – – – -29 152 -29 152 -8 150 -37 302
Changes to ownership interest in subsidiaries
Acquisition of jointly-owned subsidiaries with existing controlling interest -6 598 -6 598 -2 326 -8 924 Divestment of jointly-owned subsidiaries in which controlling interest ceases – – -36 231 -36 231
Total transactions with Group owners – – – – -35 750 -35 750 -46 707 -82 457
EQUITY, 31 DECEMBER 2016 244 000 21 005 7 464 769 496 1 362 955 2 404 920 0 2 404 920
Total comprehensive income for the year Profit for the year 265 622 265 622 – 265 622 Foreign exchange reserve, assoc. companies 5 464 – 5 464 – 5 464 Other comprehensive income -2 124 -30 834 – -32 958 – -32 958
Total comprehensive income for the year – – 3 340 -30 834 265 622 238 128 – 238 128
Transactions with Group owners
Contributions from and value transfer to owners
Dividends paid -32 940 -32 940 – -32 940
Acquisitions 36 36 – 36 Share-related remuneration 437 437 – 437
Total contributions from/value transfer to owners – – – – -32 467 -32 467 – -32 467
EQUITY, 31 DECEMBER 2017 244 000 21 005 10 804 738 662 1 596 110 2 610 581 0 2 610 581
1) Volito Aviation AB previously owned 51 % of the shares in Volito Aviation AG. In late 2016, 2 % of the shares in Volito Aviation AG were divested. As of 31 December 2016, the company is thus consolidated as an associated company. The foreign exchange reserve linked to the Volito Aviation AG group should have been reversed in connection with this. The adjustment is hereby made.
2) An adjustment has been made in the translation differences reported in associated companies’ other comprehensive income.
39
ANNUAL REPORT
Consolidated statement of cash flows
Amounts in SEK K 2017 2016
Operating activities
Profit after financial income and expense 130 771 78 479 Adjustments for items not requiring an outflow of cash -22 509 27 357 108 262 105 836
Income taxes paid -2 195 -3 683
Cash flow from operating activities before changes in working capital 106 067 102 153
Cash flow from changes in working capital
Increase(-)/Decrease(+) in inventories -2 278 1 382
Increase(-)/Decrease(+) in operating receivables 11 770 -29 281 Increase(+)/Decrease(-) in operating liabilities 8 362 -2 912
Cash flow from operating activities 123 921 71 342
Investing activities
Acquisition of subsidiaries -13 424 -41 807
Divestment of subsidiaries – -33 474
Acquisition of intangible fixed assets -1 355 -360
Acquisition of tangible fixed assets -7 162 -82 287
Divestment of tangible fixed assets – 796
Acquisition of investment properties -298 057 -2 489
Investments in financial assets -637 135 -247 679 Divestment/reduction of financial assets 73 914 141 773
Cash flow from investing activities -883 219 -265 527
Financing activities
Repayment to holdings with non-controlling interest – -5 350 Proceeds from borrowings 821 600 1 962 402 Amortisation of borrowings -29 750 -1 785 233
Dividends paid -32 940 -32 080
Cash flow from financing activities 758 910 139 739
Cash flow for the year -388 -54 446
Liquid funds at start of the year 6 662 58 172
Exchange rate differences in liquid funds 77 2 936
Liquid funds at year-end 6 351 6 662
40
Supplement to consolidated statement of cash flows
Amounts in SEK K 2017 2016
Interest paid and dividends received
Dividends received 92 243 59 434
Interest received 2 164 1 317 Interest paid -50 816 -51 760
Adjustments for items not requiring an outflow of cash
Less: Profit participations in associated companies and joint ventures -39 171 -35 452
Dividends received from associated companies 32 363 14 435 Depreciation and write-downs of tangible and intangible assets 3 750 5 542 Depreciation and write-downs, other items 3 031 48 722
Reversed write-downs -5 501 –
Unrealised exchange rate differences 63 -783
Capital gains or losses from divestment of tangible fixed assets 136 -782 Capital gains or losses from divestment of operations/subsidiaries -17 180 -4 325 -22 509 27 357
Transactions that do not involve payments
Acquisition of assets via taking over a directly related liability or the issuing of a promissory note – 6 118
Acquisition of assets through financial leasing 3 466 3 640
Acquisition of subsidiaries and other business units
Acquired assets and liabilities: Intangible fixed assets 759 12 319 Tangible fixed assets -34 850 Inventories – 11 761
Operating receivables -283 8 635 Liquid funds 796 2 099
Total assets 1 238 35 664
Acquired equity in previous holdings – -6 599 Holdings with non-controlling influence – -2 327 Operating liabilities 97 16 284
Total provisions and liabilities 97 7 358
Purchase price 1 238 34 424 Less: promissory notes – -6 118 Add: payment of promissory notes relating to previous acquisitions 12 982 15 600
Purchase price paid 14 220 43 906 Less: Liquid funds in the acquired business -796 -2 099
Effect on liquid funds (minus = increase) 13 424 41 807
Divestment of subsidiaries and other business units
Divested assets and liabilities: Sales price – 1 945 Promissory notes – -1 478
Liquid funds received – 467 Less: Liquid funds in the divested business – -33 941
Effect on liquid funds – -33 474
Liquid funds
The following components are included in liquid funds: Cash and bank balances 6 351 6 662
Unutilised credit facilities
Unutilised credit facilities amount to SEK 120.6 million (101.9).
41
ANNUAL REPORT
Income statement for the Parent company
Note Amounts in SEK K 2017 2016
3
Net sales 7 314 7 759 4 Other operating income 156 330 7 470 8 089
Operating expenses
6, 9 Other external expenses -15 098 -12 743 7 Personnel expenses -14 258 -12 410 8 Depreciation of tangible and intangible fixed assets -175 -309 10 Other operating expenses -331 -393
Operating loss -22 392 -17 766
Profit or loss from financial income and expense 11 Profit or loss from participations in subsidiaries 30 680 419 13 Profit or loss from participations in associated companies 25 526 14 435 14 Profit or loss from other financial income and expense 64 849 48 654 15 Interest income and similar income 8 191 3 473 16 Interest expense and similar expenses -10 246 -8 720
Profit after financial income and expense 96 608 40 495
Appropriations
Group contributions, received 4 937 37 756 Tax allocation funds 125 -125
Profit before tax 101 670 78 126 19 Taxes 2 653 -3 788
PROFIT FOR THE YEAR 104 323 74 338
In the parent company there is no other comprehensive income, which is why the total comprehensive income sum for the Parent company corresponds with the profit for the year.
42
Financial position for the Parent company
Note Amounts in SEK K 2017-12-31 2016-12-31
ASSETS
Fixed assets
Intangible fixed assets 21 Franchises, patents, licences, brands and similar rights 113 188 113 188
Tangible fixed assets 25 Equipment, tools and installations 2 617 2 673 2 617 2 673
Financial fixed assets 27 Participations in subsidiaries 369 692 370 692 28 Receivables from subsidiaries 107 997 107 997 31 Participations in associated companies 195 223 195 223 32 Receivables from associated companies 0 0 33 Other long-term securities holdings 1 028 014 478 698 34 Deferred tax assets 2 774 –36 Other long-term receivables – 1 999 1 703 700 1 154 609
Total fixed assets 1 706 430 1 157 470
Current assets
Short-term receivables
Accounts receivable – trade 714 294 Receivables from subsidiaries 51 846 52 231 Receivables from associated companies – 96 Tax receivables 459 231 Other receivables 837 796 37 Prepaid expenses and accrued income 1 412 1 077 55 268 54 725
Short-term investments – 15 424 38 Cash and bank balances 248 272
Total current assets 55 516 70 421
TOTAL ASSETS 1 761 946 1 227 891
43
ANNUAL REPORT
44
Amounts in SEK K 2017-12-31
Financial position for the Parent company Note
2016-12-31
39 Equity
EQUITY AND LIABILITIES
Restricted equity Share capital (2 440 000 B shares with quota value 100) 244 000 244 000 Legal reserve 21 005 21 005 265 005 265 005
reserves Tax allocation funds
liabilities 40 Liabilities to credit institutions 970
liabilities 40, 41 Bank overdraft facilities
Accounts payable – trade
Liabilities to subsidiaries
Other liabilities
44 Accrued expenses and deferred
EQUITY AND LIABILITIES
Non-restricted equity Retained earnings 363 771 322 374 Profit or loss for the year 104 323 74 338 468 094 396 712 733 099 661 717 Untaxed
– 125 – 125 Long-term
000 470 000 970 000 470 000 Short-term
29 376 48 051
1 522 1 066
21 738 42 303
302 288
income 5 909 4 341 58 847 96 049 TOTAL
1 761 946 1 227 891
Amounts in SEK K Share capital Legal reserve Retained earnings Profit or loss for the year Total equity EQUITY, 31 DECEMBER 2015 244 000 21 005 281 722 69 931 616 658 Appropriation of earnings 69 931 -69 931 –Profit for the year 74 338 74 338 Dividend -29 280 – -29 280 EQUITY, 31 DECEMBER 2016 244 000 21 005 322 374 74 338 661 717 Appropriation of earnings 74 338 -74 338 –Profit for the year 104 323 104 323 Dividend -32 940 – -32
EQUITY, 31 DECEMBER 2017 244 000 21 005 363 771 104 323 733 099
Report on changes in equity for the Parent company
940
Cash flow statement for the Parent company
Amounts in SEK K 2017 2016
Operating activities
Profit after financial income and expense 96 608 40 496 Adjustments for items not requiring an outflow of cash -22 296 14 104 74 312 54 600
Income taxes paid -349 –
Cash flow from operating activities before changes in working capital 73 963 54 600
Cash flow from changes in working capital
Increase(-)/Decrease(+) in operating receivables 16 876 2 420 Increase(+)/Decrease(-) in operating liabilities -13 357 51 737
Cash flow from operating activities 77 482 108 757
Investing activities
Acquisition of tangible fixed assets -44 -24
Investments in financial assets -593 605 -124 897 Divestment/reduction of financial assets 72 954 27 654
Cash flow from investing activities -520 695 -97 267
Financing activities
Proceeds from borrowings 500 000 512 118 Amortisation of borrowings -23 845 -498 681 Dividends paid -32 940 -29 280
Cash flow from financing activities 443 215 -15 843
Cash flow for the year 2 -4 353 Liquid funds at start of the year 272 4 611
Exchange rate differences in liquid funds -26 14
Liquid funds at year-end 248 272
Supplement to cash flow statement for the Parent company
Amounts in SEK K 2017 2016
Interest paid and dividends received
Dividends received 101 905 77 434 Interest received 2 466 1 643 Interest paid -9 165 -8 711
Adjustments for items not requiring an outflow of cash
Dividends from subsidiaries -13 300 –
Depreciation and write-downs of tangible assets 175 309 Other write-downs 7 983 18 079
Unrealised exchange rate differences 26 -14
Capital gains or losses from divestment of financial fixed assets -17 180 -4 270 -22 296 14 104
Liquid funds
The following components are included in liquid funds: Cash and bank balances 248 272
Unutilised credit facilities
Unutilised credit facilities amount to SEK 120.6 million (101.9).
45
ANNUAL REPORT
Accounting principles and notes to the accounts
Amounts are in SEK thousand, unless otherwise stated.
Note 1 Significant accounting principles Agreement with standards and laws
The consolidated financial statements have been drawn up in accordance with International Financial Reporting Standard (IFRS) issued by International Accounting Standards Board (IASB) as well as interpretations from the IFRS Interpretations Committee such as have been enacted by the EU. Furthermore, the consolidated financial statements have been drawn up in accordance with the Swedish Financial Accounting Standards Council recommendations RFR 1 Supplementary accounting rules for groups.
The Parent company’s annual accounts are drawn up in accordance with the same principles as the Group’s with the exception of cases noted below in the section ”The Parent company’s accounting principles”.
The consolidated financial statements and annual accounts of Volito AB (Parent company) for the fiscal year 2017 were approved by the Board and CEO on 15 March 2018 and will be presented to the Annual General Meeting on 5 April 2018 for adoption. The Parent company is a Swedish limited company with registered office in Malmö.
Valuation basis applied in the drawing up of the Parent company’s and Group’s financial statements
Assets and liabilities are reported at historical acquisition value, except investment properties and certain financial assets and liabilities that are measured at fair value. Financial assets and liabilities that are measured at fair value comprise of derivative instruments and available-for-sale financial assets.
Functional currency and reporting currency
The Parent company’s functional currency is SEK, which is also the reporting currency for the Parent company and the Group. This means that the financial statements are presented in SEK. All amounts are rounded to the nearest thousand, unless otherwise stated.
Assessments and estimates in the financial statements
Drawing up the financial statements in accordance with IFRS requires the company management to make assessments and estimates as well as assumptions that affect the application of accounting principles and the book amounts of assets, liabilities, revenue and expenses. These assessments are based on experience and the various assumptions that the management and Board deem to be reasonable under the prevailing circumstances. Conclusions from this process form the basis for decisions relating to book values of assets and liabilities, in those cases where they cannot be established by information from other sources. The actual outcome can differ from these assessments if other assumptions are made, or if conditions change.
Estimates and assumptions are reviewed regularly. Changes in estimates are reported in the period the change is made, if the change affected only that period, or in the period when the change is made and future periods, if the change affects both current and future periods.
Assessments made by company management in the application of IFRS that have a significant effect on the financial statements and applied estimates, and which can entail significant adjustments to the following year’s financial statements, are covered in Note 2.
Significant applied accounting principles
The accounting principles outlined below, with the exceptions that are described in detail, have been applied consistently for all periods that are presented in the Group’s financial statements. The Group’s accounting principles has also been consistently applied by the Group’s companies regarding associated companies and joint ventures, when necessary through adjustment to the Group’s principles.
Changed accounting principles
Changed accounting principles resulting from new or amended IFRS No changes in IFRS applicable from 1 January 2017 have had a significant effect on the Group’s accounting.
New IFRS that have not yet come into effect
A number of new or changed IFRS come into effect during the coming fiscal year have not been applied in advance in the drawing up of the Group’s financial statements. There are no plans to apply in advance new standards or changes that will apply in the future.
IFRS 9, Financial instruments will replace IAS 39 Financial instruments. IFRS 9 is to be applied from the fiscal year that starts on 1 January 2018 and earlier application is permitted. The introduction is not expected to have a significant effect on the group’s financial statements given the Group’s present structure and business activities.
IFRS 15, Revenue will replace the current standards on reporting revenue. IFRS 15 is to be applied from the fiscal year that starts on 1 January 2018 and earlier application is permitted. The company has started work on assessing the effects of the introduction of IFRS 15 on the principles for reporting revenue that are applied today. This work is continuing, but given the company’s current activities it cannot be ruled out that the introduction of IFRS 15 can have effects on the company’s revenue reporting, especially concerning the juncture of revenue reporting. At the present time Volito’s assessment is that this will have no significant effect on the financial statements.
IFRS 16, Leasing will replace IAS 17. IFRS 16 shall be applied from the fiscal year that starts on 1 January 2019 and earlier application is permitted. The company has not yet started work on assessing the effects of IFRS 16, but given the current level of leasing it can be observed that the company’s assets and liabilities can be expected to increase. However, the company considers that this will not have a significant effect on the financial statements, provided that the level of leasing activity does not change to a considerable extent.
Other new and changed IFRS for application in the future are not expected to have a significant effect on the Group’s financial statements.
Classification, etc.
Fixed assets, long-term liabilities and provisions essentially consist only of amounts that are expected to be recovered or paid after more than 12 months calculated from accounting year-end. Current assets and short-term liabilities consist essentially only of amounts that are expected to be recovered or paid within 12 months calculated from accounting year-end.
Consolidated financial statements
Subsidiaries
The consolidated financial statements cover the Parent company Volito AB and its subsidiaries, which are all companies in which the Parent company, directly or indirectly, has a controlling influence. A controlling influence exists if Volito AB has influence over investments, is exposed to, or has the right to variable return from its involvement and can use its influence over investments to affect the return. In an assessment of whether a controlling interest exists, attention is paid to potential shares with voting entitlement and whether actual control exists.
Subsidiaries are reported according to the acquisition method. The method means that the acquisition of the subsidiary is considered as a transaction from which the Parent company indirectly acquires the assets of the subsidiary and takes over its debts. The group-wise acquisition value is established through an acquisition analysis in connection with the acquisition, The analysis establishes the acquisition value for the shares, as well as the fair value on the acquisition date of the acquired identifiable assets, taken over liabilities and any holdings with non-controlling interest on the acquisition date.
Transaction expenditure, with the exception of transaction expenditure relating to issue of equity or debt instruments, is reported directly in profit or loss for the year.
In the acquisition of businesses where the transferred payment, any holding with non-controlling interest and the fair value of previously owned shares (in multi-stage acquisitions) exceed the fair value of the acquired assets and taken over liabilities, the difference is reported as goodwill. When the difference is negative, so-called acquisition at low price, this difference is reported directly in the profit or loss for the year.
Transferred payment in connection with the acquisition does not include payments relating to regulation of previous business connections. This type of regulation is usually reported in profit or loss for the year.
Conditional purchase prices are reported at fair value from the acquisition date. In cases where the conditional purchase price is classified as an equity instrument, no revaluation and regulation is reported in equity. For other conditional purchase prices, revaluation is done for each reporting period and the change in value is reported in profit or loss for the year.
In cases where the acquisition does not relate to 100 % of the subsidiary, a holding with non-controlling interest is created. There are two alternatives for reporting holdings with non-controlling interest. These two alternatives are to report the holding with non-controlling interest’s share of proportional net assets, or that the holding with non-controlling interest is reported at fair value, which means that the holding with non-controlling interest has a share in goodwill. The choice between the two methods for reporting a holding with non-controlling interest can be made from acquisition to acquisition.
Ownership of a company that increases through acquisitions on several occasions is reported as a multi-step acquisition. In a multi-step acquisition that results in a controlling interest, the previously acquired shares are revaluated based on the fair value of the latest acquisition and the arising profit or loss is reported in profit or loss for the year.
When the acquisition of subsidiaries means the acquisition of net assets that do not consist of a business, the acquisition cost is divided between the single identifiable assets and liabilities based on their fair value on the acquisition date.
The subsidiaries’ financial statements are taken into the consolidated financial statements from the day the controlling interest arises and is included in the consolidated financial statements until the day it ceases.
Acquisitions from holdings with non-controlling interest
Acquisitions from holdings with non-controlling interest are reported as a transaction within equity, i.e. between the Parent company’s owners (within retained earnings) and the holding with non-controlling interest. Therefore, no goodwill arises from these transactions. Changes in holdings with non-controlling interest are based on the proportional share of net assets. The difference between the received liquidity and the holding with non-controlling interest’s proportional share of acquired net assets is reported under retained earnings.
Sales to holdings with non-controlling interest
Sales to holdings with non-controlling interest, in which the controlling interest remains, are reported as a transaction within equity, i.e. between the Parent company’s owners and the holding with non-controlling interest.
If the reduction in ownership is to the extent that a controlling interest is lost, this is considered to correspond to a divestment of a subsidiary. The effect is reported in profit or loss for the year and consists of capital gains or losses from the divested assets and liabilities and a revaluation effect on the remaining holding, which is valued at fair value on the divestment date with the change in value reported in profit or loss for the year.
Participations in joint ventures
Participations in joint ventures in accounting terms are those companies for which the Group, through cooperation agreements with one or more parties, has a joint controlling interest over operational and financial management. From the point when the joint controlling interest is gained, shares in joint ventures are reported in accordance with the equity method in the consolidated financial statements.
Associated companies
Associated companies are those companies in which the Group has a significant interest, but not a controlling interest, over operational and financial management, generally through shareholdings with between 20 % and 50 % of the votes. From the time that the significant influence is gained, shares in the associated company are reported in accordance with the equity method in the consolidated financial statements.
46
The equity method
The equity method means that the book value of joint ventures and associated companies reported in the Group corresponds to the Group’s share in the joint venture’s or associated company’s equity, as well as group-wise goodwill and any other residual value in the group-wise surplus value or under value. The Group’s participation in the respective companies’ profit after tax and expenses adjusted for any amortisation, write-downs or resolution of acquired surplus or under value is reported in the profit or loss for the year under ”Participations in joint ventures’ profit or loss” and “Participations in associated companies’ profit or loss”. These profit participations less received dividends from joint ventures and associated companies make up the main changes in the book value of participations in joint ventures and associated companies. The Group’s share of other comprehensive income in associated companies is reported in a separate line in the Group’s other comprehensive income.
Any difference at the time of acquisition between the acquisition value of the holding and the owner companies share of the fair value net of joint ventures’ and associated companies’ identifiable assets and liabilities is reported in accordance with the same principle as the acquisition of subsidiaries.
Transaction expenditure, with the exception of transaction expenditure relating to issue of equity instruments or debt instruments, is included in the acquisition value.
When the Group’s share of reported losses in a joint venture or associated company exceeds the book value of the shares in the Group, the value of the ownership share is reduced to zero. Settlement for losses is also applied for long-term financial dealings without security, which in their economic meaning make up part of the owner company’s net investment in the associated company. Continued losses are not reported, provided that the Group has not made guarantees to cover losses arising in the joint venture or associated company.
The equity method is applied until such point as the significant influence ceases.
Acquisition of property via a company
A company acquisition can be regarded as either an asset acquisition or a business acquisition. Company acquisitions in which the primary aim is to gain a company’s property and in which the company’s property management organisation and administration has a subordinate importance for the acquisition’s implementation, are generally treated as asset acquisitions. Company acquisitions in which the acquired company’s property management organisation and administration has a considerable importance for the acquisition’s implementation and valuation, are instead treated as business acquisitions.
In the case of asset acquisitions, no deferred tax is reported on the property’s surplus value, and any discount attributable to the deferred tax instead reduces the property value. In the case of business acquisitions, the deferred tax is reported with the relevant nominal tax on the property’s surplus value and other temporary differences attributable to the acquired assets and liabilities. The company acquisitions regarding property that have occurred since the formation of the Group have been treated as asset acquisitions.
Acquisitions made before 1 January 2013 (transition date to IFRS)
In the case of acquisitions completed before 1 January 2013, goodwill has, after writedown appraisal, been reported at an acquisition value that corresponds to the book value in accordance with previously applied accounting principles. Classification and reporting of business acquisitions that occurred before 1 January 2013 have not been reviewed in accordance with IFRS 3 in the drawing up of the Group’s opening balance in accordance with IFRS on 1 January 2013.
Elimination of transactions on consolidation
Intra-group receivables and liabilities, revenue or expenses and unrealised profits or losses that arise from intra-group transactions between group companies are eliminated in full in the drawing up of consolidated financial statements. Unrealised profits deriving from transactions with associated companies and joint ventures are eliminated to the extent that corresponds to the Group’s ownership share in the company. Unrealised losses are eliminated in the same way as unrealised profits, provided that there is no write-down requirement.
Translation of foreign subsidiaries or other overseas businesses Assets and liabilities in overseas businesses, including goodwill and other group-wise surplus value or under value are translated from the overseas businesses’ functional currency to the Group’s reporting currency, SEK, at the exchange rate at accounting year-end. Income and expenses in an overseas business are translated to SEK at an average exchange rate that constitutes an approximation of the exchange rate on the respective transaction date. Translation differences that arise in currency translation of overseas businesses are reported in other comprehensive income and accumulated in a separate component in equity, called the foreign exchange reserve. In cases where an overseas business is not wholly owned, the translation difference is allocated to holdings with non-controlling interest based on the proportional ownership share.
If an overseas business is divested, the accumulated translation differences attributable to the business are reclassified from the foreign exchange reserve in equity to profit or loss for the year.
When a controlling interest, significant interest or joint controlling interest ceases for an overseas business, the accumulated translation differences attributable to the business are realised and reclassified from the foreign exchange reserve in equity to profit or loss for the year. In cases where divestment occurs, but a controlling interest remains, the proportional share of the accumulated translation differences is transferred from the foreign exchange reserve to holdings with a non-controlling interest. In cases where parts of an associated company or joint venture have been divested, but significant influence or joint controlling interest remain, the proportional share of the translation differences is reclassified to profit or loss for the year.
Accumulated translation differences relating to overseas businesses are presented as a separate capital category and contain translation differences accumulated from 1 January 2013. Accumulated translation differences before 1 January 2013 were stated as zero at the transition date to IFRS.
Foreign currencies
Transactions in foreign currencies
Transactions in foreign currencies are translated to the functional currency at the exchange rate on the transaction date. The functional currency is the currency in the primary economic environments where the company runs its operations. Monetary assets and liabilities in foreign currencies are translated to the functional currency at the exchange rate at accounting year-end. Exchange rate differences arising from translation are reported in profit or loss for the year. Non-monetary assets and liabilities that are reported at historical acquisition value are translated at the exchange rate on the transaction date. Non-monetary assets that are reported at fair value are translated to the functional currency at the exchange rate at the time of measurement of fair value.
Exchange rate differences regarding operating receivables and operating liabilities are reported in the operating profit or loss, whereas exchange rate differences relating to financial assets and liabilities are reported as profit or loss from financial income and expense.
Income Rental income
Rental income from investment properties is reported linearly in the profit or loss for the year based on the conditions in the leasing agreement. The total cost for granted benefits is reported as a reduction of rental income linearly over the leasing period.
Rental contracts relating to investment properties are considered as operational leasing agreements. These agreements are reported in accordance with the principles for income accounting above. Volito has one property that is leased out through a financial leasing agreement, see Note 35.
Income from the sale of real estate
Income from the sale of real estate is normally reported on the day of taking possession, unless the risks and benefits have been transferred to the buyer at an earlier juncture. Control of access may have been transferred at an earlier juncture than the day of taking possession, and if this is the case, income from the sale of the property is reported at this earlier juncture. The assessment of the juncture for reporting the income takes into consideration both what has been contracted between the parties regarding risks and benefits, and involvement in the current management of the property. In addition, consideration is given to circumstances that can affect the transaction’s outcome, but are beyond the sellers and/or buyer’s control.
Sales of goods, execution of service assignments and other income Reporting of income other than rental and leasing income from property management is done in accordance with IAS 18 Revenue. Revenue from sales of goods is reported in the profit or loss for the year when significant risks and benefits associated with ownership of the goods has been transferred to the buyer. Income from service assignments is reported in the profit or loss for the year based on the degree of completion at accounting year-end. The degree of completion is determined through an assessment of completed work on the basis of progress checks. Revenue is not reported if it is probable that the economic benefits will not be gained by the Group.
Revenue is reported at the fair value of what has been received, or is expected to be received, with deduction of granted discounts.
Leasing
Leasing is classified in the consolidated financial statements as either financial or operational leasing. It is considered to be financial leasing when the economic risks and benefits associated with ownership in all significant aspects are transferred to the lessee. If this is not the case, it is a matter of operational leasing.
Operational leasing agreements
Expenses relating to operational leasing agreements in which the Group is the lessee are reported in profit or loss for the year linearly over the duration of the leasing period. Benefits gained in connection with the signing of an agreement are reported in the profit or loss for the year linearly over the duration of the leasing agreement. Variable fees are reported as expense in the period they arise.
Income relating to operational leasing agreements in which the Group is the lessor is reported linearly over the duration of the leasing agreement. Expenses that arise as a result of the leasing agreement are reported when they arise.
Financial leasing agreements
Assets that are hired in accordance with financial leasing agreements are reported as assets in the consolidated statement of financial position at the lowest of the leasing object’s fair value and present value of future minimum leasing fees. The leased assets are written off during their economic period of utilisation in the same way as Group-owned assets. The obligation to pay future leasing fees is reported as long-term and shortterm liabilities. Minimum leasing fees are divided between interest expense and amortisation on the outstanding liability. Interest expenses are assigned with an amount that corresponds to a fixed interest rate for reported liabilities during the respective period. Variable fees are reported as expenses in the periods they arise.
Expense
The income statement is classified by nature of expense.
Real estate expenses
The term real estate expenses covers all expenses for the investment properties. This includes direct property expenses, such as expenses for operation, maintenance, ground rent and property tax. The term also covers indirect property expenses, such as expenses relating to leasing and property administration.
47
ANNUAL REPORT
Financial income and expense
Financial income consists of interest income from invested funds (including availablefor-sale financial assets) dividend income and profit on divestment of available-forsale financial assets. Interest income is taken up as income in the period it concerns. Dividends from shares are reported in the period that the right to receive payment is deemed as certain.
Financial expense consists of interest expense on loans, and realised losses on financial investments and derivative instruments used in financial activities. Interest costs affect profit and loss in the period they concern, except to the extent they are included in an asset’s acquisition value, and reported with the application of the effective rate method. An asset for which the interest can be included in the acquisition value is an asset that of necessity takes a significant time to complete for intended use or sale. Activation of borrowing costs is done in accordance with IAS 23 Borrowing costs.
Profit or loss from the sale of financial investments is reported when the risks and benefits associated with the undertaking of the instrument in all important aspects has been transferred to the buyer and the Group no longer has control over the instrument.
Exchange rate profits and losses are reported net.
Unrealised changes in the value of financial assets measured at fair value, as well as hedging instruments, are reported in a specific line in the profit or loss for the year.
Interest rate swaps are used for hedging against interest rate risks linked to the Group’s borrowing. The Group does not at present apply hedge accounting for these instruments. Interest rate swaps are measured at fair value in the balance sheet. In the profit or loss for the year, the interest rate coupon component is reported as a correction of interest expense. Unrealised changes in the fair value of interest rate swaps are reported in a specific line in the profit or loss for the year.
The effective rate is the rate that discounts the estimated future incoming and outgoing payments during a financial instrument’s expected duration at the financial asset’s or liability’s reported net value. The calculation includes all fees paid or received by the agreement partners that are a part of the effective rate, transaction costs and all other surplus and under values.
Taxes
Income taxes consist of both current and deferred income tax for the Swedish and foreign Group units. Income taxes are reported in the profit or loss for the year, unless the underlying transaction is reported in other comprehensive income or in equity, in which case the associated tax effect is reported in other comprehensive income or in equity.
Current tax is tax that is to be paid or received regarding the current year, with application of the tax rates that are decided or in practice decided at year-end. Current tax also includes adjustments of current tax relating to earlier periods.
Deferred tax is calculated according to the balance sheet method. According to this method, deferred tax liabilities and receivables are reported for all temporary differences between reported and fiscal values for assets and liabilities and for other fiscal deductions or deficiencies. Deferred tax liabilities and receivables are calculated based on how the temporary differences are expected to be evened out and by the application of the tax rates and tax rules that have been adopted or announced at accounting year-end.
In the valuation of fiscal deductible deficiency, an assessment is made of the probability that the deficiency can be utilised. The basis for deferred tax receivables includes established deductible deficiencies to the extent that they can with certainty by utilised in relation to future profits. Deferred taxes are reported at the nominal valid tax rate without discounting.
Temporary differences are not taken into account in group-wise goodwill or in normal cases in the differences relating to participations in subsidiaries, joint ventures and associated companies that are not expected to be taxed in the foreseeable future. Temporary differences are not taken into account either for differences that have arisen in the initial reporting of assets and liabilities that are not business acquisitions that on the transaction date do not affect either the reported profit or loss or the taxable profit or loss.
When an acquisition of a company takes place, the acquisition is either an acquisition of a business or an acquisition of assets. It is an acquisition of assets, for example, if the acquired company only own one or more properties with a rental contract, but the acquisition does not include the processes required to run the property business. In reporting of an acquisition of assets, no deferred tax is reported separately. The fair value of the deferred tax liability is instead deducted from the fair value of the acquired asset.
Untaxed reserves including deferred tax liabilities are reported in the legal entity. In the consolidated financial statements on the other hand, untaxed reserves are divided into deferred tax liabilities and equity.
Intangible assets
Goodwill Goodwill represents the difference between the acquisition value of the business acquisition and the fair value of the acquired identifiable assets and taken over liabilities.
Goodwill is valued at the acquisition value minus any accumulated write-downs. Goodwill is designated to cash generating units and is reviewed for write-down requirements annually or as soon as indications arise that show that the asset in question has fallen in value. Goodwill that has arisen in the acquisition of joint ventures and associated companies is included in the book value for participations in joint ventures and associated companies.
In the case of business acquisitions in which the acquisition costs are less than the net value of the acquired assets and taken over liabilities, known as an acquisition at low price, the difference is reported directly in profit or loss for the year.
Concerning goodwill in acquisitions that took place before 1 January 2013, the Group, on transition to IFRS, has not applied IFRS retroactively, as the book value on that day constitutes from that time on the Groups’ acquisition value, after write-down appraisal.
Other intangible assets
Intangible assets that are acquired by the company are reported at the acquisition value minus accumulated depreciations and write-downs.
Depreciation is linear over the asset’s period of utilisation and reported as expense in the income statement. Depreciation begins from the date when assets become available for use.
The estimated periods of utilisation are: The Group The Parent company
Software 3–5 years 5 years Other intangible assets 5 years –
An assessment of an asset’s period of utilisation and residual value is carried out annually.
Tangible fixed assets
Owned assets
Tangible assets that are acquired by the company are reported at the acquisition value less accumulated depreciation and any write-downs.
The book value of a tangible fixed asset is removed from the balance sheet in the case of discarding or sale of an asset, or when no future economic benefits are expected from use of the asset. Profit or loss that arises from the divestment or discarding of an asset is made up of the difference between the sales price and the asset’s book value with deductions for directly related sales costs.
Leased assets
Leasing is classified in the consolidated financial statements as either financial or operational leasing. It is considered financial leasing when the economic risks and advantages associated with ownership are in all essential aspects transferred to the lessee. If this is not the case, it is a matter of operational leasing.
Assets that are hired according to financial leasing agreements are reported as assets in the Group’s balance sheet. The obligation to pay future leasing fees has been reported as long and short-term liabilities. The leased assets are depreciated according to plan, whereas leasing payments are reported as interest and amortisation of liabilities.
Assets that are hired according to operational leasing agreements are not reported as assets in the Group’s balance sheet. Leasing fees for operational leasing agreements are taken up as expense linearly over the duration of the lease.
Assets that are hired out according to financial leasing agreements are not reported as tangible fixed assets, as the risks and benefits associated with ownership of the assets are transferred to the lessee. Instead a financial receivable is reported regarding future minimum leasing charges.
Additional expenditure
Additional expenditure is added to the acquisition value to the extent that the asset’s performance has been improved in relation to the level at the time it was originally acquired. All other additional expenditure is reported as expense in the period it arises.
Borrowing expenses
Borrowing expenses that are directly attributable to purchasing, construction or production of assets that take a significant time to complete for the intended use or sale are included in the asset’s acquisition value. Activation of borrowing expenses is done on condition that it is probable that it will lead to future economic benefits and costs that can be measured in a reliable way.
Depreciation principles for tangible fixed assets
Depreciation according to plan is based on the original acquisition value reduced by the calculated residual value. Depreciation is linear over the period the asset is expected to be utilised.
The following depreciation periods are applied: The Group The Parent company
Industrial buildings 20-25 years –
Plant and machinery 5-10 years –
Equipment, tools and installations 5 years 5 years
Computer equipment 3-5 years 3-5 years
Industrial buildings account for a negligible amount and depreciation for various parts is over a period of 20-25 years. Component depreciation is not applied, as there are no individual components with significantly different depreciation periods.
48
Investment properties
Most of the properties in the Group are classified as investment properties, as they are owned with an aim to generate rental income or value increases, or a combination of the two. Investment properties are reported initially at acquisition value, which includes expenditure directly attributable to the acquisition. Thereafter, investment properties are reported at fair value in the statement of financial position, in accordance with IAS 40, Changes in value are reported in a designated line in the income statement. The Group’s properties are reported in the statement of financial position as fixed assets. As the properties are reported at fair value, depreciation is not reported for these properties in the consolidated financial statements. The investment properties are valued annually by an independent external appraiser with recognised and relevant qualifications. The applied calculation model is based on long-term yield evaluation, which factors in present value of future payment streams with differentiated yield requirements per property, depending on aspects such as location, purpose, condition and standard.
Unrealised and realised changes in value are reported in profit or loss for the year. Rental income and income from property sales are reported in accordance with the principles described in the income accounting section.
Additional expenditure – investment properties reported according to the fair value method
Additional expenditure is added to the book value only if it is probable that the future economic benefits associated with the asset will be gained by the company and the acquisition value can be calculated in a reliable way. All other additional expenditure is reported as expense in the period it arises. A decisive factor in assessing when additional expenditure is added to the book value is if the expenditure refers to the exchange of the whole, or parts of, the identified components, which activates such expenditure. Expenditure for any newly created components is also added to the book value. Expenditure for repairs is reported in the period it arises.
Properties under construction that are intended for use as investment properties when work is completed are also classified as investment properties.
Note 22 contains further information on external property valuation and a statement on classification of the property portfolio and its book value.
Inventories
Inventories are valued at the lowest of either the acquisition value or the net realisable value. The acquisition value is calculated according to the first-in, first-out principle and includes expenditure that has arisen in the acquisition of inventory assets and transport of these to their present location and condition.
For manufactured goods and ongoing work, the acquisition value includes a reasonable share of the indirect costs based on normal capacity.
Net realisable value is the estimated sales price in current operations, after deductions for estimated costs for completion and to achieve a sale.
Financial instruments
Financial instruments that are reported in the statement of financial position include on the asset side; liquid funds, loans receivable, accounts receivable – trade, financial investments and derivatives. On the liability side are accounts payable – trade, loan liabilities and derivatives.
Reporting in and removal from the balance sheet
Financial assets and liabilities are taken up in the statement of financial position when the company becomes a party in accordance with the instrument’s agreement-related conditions. A receivable is taken up when the company has performed and the contracted obligation exists for the counterparty to pay, even if the invoice has yet to be sent. Accounts receivable – trade are taken up in the statement of financial position when the invoice has been sent. A liability is taken up when the counterparty has performed and the contracted obligation exists for the payment to be made, even if the invoice has yet to be received. Accounts payable – trade are taken up when the invoice is received.
A financial asset is removed from the statement of financial position when the rights in the agreement have been realised, fall due or when the company loses control over it. The same applies for a share of a financial asset. For every reporting period, the company evaluates if there are objective indications that a financial asset or group of financial assets requires a write-down. A financial liability is removed from the statement of financial position when the obligation in the agreement has been fulfilled or in other ways ceases to apply. The same applies for a share of a financial liability.
Financial assets and liabilities are offset and reported as a net amount in the statement of financial position when there is a legal right to offset and where the intent is to regulate items with a net amount or to simultaneously realise assets and regulate liabilities. Financial income and expense are offset in the income statement in cases where they are linked to the financial assets and liabilities that have been offset.
Acquisition and divestment of financial assets are reported on the transaction date. The transaction date is the day when the company obligates itself to acquire or divest the assets.
Classification and valuation
Financial instruments are reported either at the accrued acquisition value or fair value according to categorisation in IAS 39.
Financial instruments that are not derivatives are reported initially at the acquisition value corresponding to the instrument’s fair value with additions for transaction costs for all financial instruments except those categorised as financial assets, which are reported at fair value excluding transaction costs via the profit and loss. A financial instrument is classified in initial accounting according to the purpose for which the instrument was acquired. Classification determines how the financial instrument is valued after initial accounting as described below.
Derivative instruments are reported initially at fair value, meaning that the transaction costs affect the period’s profit or loss. After initial accounting, the derivative instrument is reported in the way described below. If the derivative instrument is used for hedge accounting and to the extent it is effective, any changes in value of the derivative instrument are reported in the same line of profit or loss for the year as the hedged item. In hedge accounting, the ineffective part is reported in the same way as changes in value of a derivative that is not used for hedge accounting. If hedge accounting is applied in the use of interest rate swaps, the interest rate coupon is reported as interest and the other changes in value in its designated line in the profit or loss for the year.
Financial assets valued at fair value via profit
or loss
Financial assets in this category are measured at fair value with changes in value reported in profit or loss for the year. This category consists of two sub-groups: financial assets owned for trade and other financial assets that the company initially chose to place in this category with support of the so-called “fair value option”. The first subgroup includes derivatives with a positive fair value, with the exception of derivatives that are identified and effective hedging instruments. The Group’s interest swaps are in this sub-group.
Available-for-sale financial assets
The available-for-sale financial assets category includes financial assets that are not classified in any other category or financial assets that the company initially chose to classify in this category. This category reports holdings of shares and other participations that are not reported at fair value via profit or loss (see above) and that do not constitute subsidiaries, joint ventures or associated companies. Assets in the category are measured continuously at fair value with the period’s changes in value reported in other comprehensive income and the accumulated changes in value in a special component in equity. Received dividends and write-downs are reported in profit or loss for the year. When an asset is divested the accumulated profit or loss is reported, which was previously reported in other comprehensive income.
Loan receivables and accounts receivable – trade
Other long-term receivables relates mainly to promissory note loans. The aim is to keep these promissory notes until they are due. The part of the promissory note receivable that is due within one year is reported among other short-term receivables. If the promissory note loan has interest conditions that deviate from market interest conditions, the acquisition value deviates from the nominal value.
Receivables, including accounts receivable – trade, are valued at the accrued acquisition value. Accrued acquisition value is determined based on the effective rate, which is calculated on the acquisition date. Receivables are reported at the amount that is expected to be received, i.e. after deductions for uncertain receivables. The provision requirement is assessed individually and any write-down is reported in operating expenses. The expected duration of accounts receivable – trade is short, which is why the value is reported at nominal amount without discounting.
Liquid funds
Liquid funds consist of balances at the bank at accounting year-end and are reported at nominal value.
Financial liabilities valued at fair value via profit or loss
This category consists of two sub-groups: financial liabilities owned for trade and other financial liabilities that the company initially chose to place in this category with support of the so-called “fair value option”, see description under “Financial assets valued at fair value via profit or loss”. The first sub-group includes the Group’s derivatives with a negative fair value, with the exception of derivatives that are identified and effective hedging instruments. Changes in fair value are reported in profit and loss for the year.
Derivative instruments
The Group’s derivative instruments consist of interest rate swaps used to cover risks relating to exchange rate changes. Derivative instruments are reported continuously at fair value in accordance with IAS 39. Changes in value are reported in the income statement.
Other financial liabilities
Borrowings and other financial liabilities, such as accounts payable – trade, are included in this category. Liabilities are valued at the accrued acquisition value. The expected duration of accounts payable – trade is short, which is why the value is reported at nominal amount without discounting.
Hedge accounting
The Group’s derivative instruments have been acquired to financially hedge the risks of interest rate and currency changes that the Group is exposed to. Hedge accounting is not applied to these derivative instruments. They are valued at fair value according to the principles outlined above.
Write-downs
The book values of the Group’s assets are tested at each accounting year-end to determine if there is any indication that write-downs are required. IAS 36 is applied for testing write-down requirements for assets other than financial assets, which are tested in accordance with IAS 39, available-for-sale assets, and divestment groups, which are reported in accordance with IFRS 5, inventories, managed assets used for financing of remuneration to employees, and deferred tax receivables. For excepted assets as above, the book value is tested according to the respective standard.
Write-down tests for tangible and intangible assets, and participations in subsidiaries, joint ventures, associated companies etc.
If there is an indication that a write-down is required, the asset’s recoverable amount is calculated in accordance with IAS 36. For goodwill and for other intangible assets that are not yet ready for use, the recoverable amount is also calculated annually. If it is not possible to determine significant independent cash flows to a single asset, the assets on being tested for write-down requirements shall be grouped at the lowest level where it is possible to identify a significant independent cash flow – a so-called cash-generating unit.
49
ANNUAL REPORT
A write-down is reported when an asset’s or cash-generating unit’s book value exceeds the recoverable amount. The write-down of assets relating to a cash-generating unit (group of units) is assigned first of all to goodwill. Thereafter, a proportional write-down is carried out for other assets included in the unit (group of units).
The recoverable amount is the highest value of the fair value minus sales costs and value of use. In the calculation of value of use, future cash flows are discounted with a discounting factor that takes into consideration risk-free interest and the risk that is associated with the specific asset.
Write-down tests for financial assets
For every reporting period, the company evaluates whether there is objective evidence that a financial asset or group of assets requires a write-down. Objective evidence consists of observable conditions that have a negative effect on the possibility of recovering the acquisition value, as well as significant or lengthy reductions in the fair value of a financial asset classified as an available-for-sale financial asset. Write-downs of available-for-sale financial assets are reported in profit or loss for the year in net interest income/expense.
Accounts receivable – trade with write-down requirements are reported at the present value of the expected future cash flow. However, receivables with short duration are not discounted. A write-down affects profit or loss for the year.
Reversal of write-downs
A write-down is reversed if there is both an indication that a write-down requirement no longer exists and that a change has occurred in the supposition that was the basis for calculation of the recoverable amount. However, write-downs of goodwill are never reversed. A reversal is carried out only to the extent that the asset’s book value after reversal does not exceed the book value that would have been reported, with deduction for depreciation if applicable, if no write-down had been carried out.
Write-downs of loans receivable and accounts receivable – trade that are reported at accrued acquisition value are reversed if a later increase in the recoverable amount can be objectively related to an event after the write-down was carried out.
Equity
Dividends are reported as a reduction of equity after the Annual General Meeting has made a decision.
Provisions
A provision differs from other liabilities as there is uncertainty over the payment date or the size of the amount for regulating a provision. A provision is reported when the company has a formal or informal commitment as the result of an event that has occurred and it is likely that an outflow of resources is required to regulate the commitment, and that a reliable estimate of the amount can be made. Present value calculations are made to take significant time effects into account for future payments.
Remuneration to employees
Remuneration to employees in the form of salaries, paid holiday, paid sick leave, etc. is reported at the rate that it is earned. Regarding pensions and other remuneration after employment ends, these are classed as contribution-based or benefit-based plans. The commitment regarding the contribution-based plans is fulfilled through premiums to independent authorities or companies that administer the plans. A number of employees in the Volito Group have ITP plans with rolling payments to Alecta/Collectum. In accordance with IFRS, these are classified as benefit-based plans that cover several employers. As there is not sufficient information to report these as benefit-based plans, they are reported as contribution-based plans.
Remuneration on severance of employment
A provision for remuneration in connection with notice of termination for staff is reported only if the company is evidently obligated, without a realistic possibility of withdrawal, to terminate employment before the normal time and affected groups of employees have been informed of the termination plans. The provision is made for that part of the severance pay that has no requirement for received services from the employee.
Short-term remuneration
Short-term remuneration to employees is calculated without discounting and is reported as expense when the related services are received.
A provision is reported for the expected expense for bonus payments when the Group has a valid legal or informal obligation to make such payments as a result of services received from employees and the obligation can be calculated reliably.
Fixed assets owned for sale and discontinued operations
The meaning of having a fixed asset (or disposal group) classified as a holding for sale is that its book value will be recovered mainly through a sale rather than through use. An asset or disposal group is classified as being owned for sale if it is available for immediate sale in present condition and according to conditions that are normal, and that it is very probable that the sale will be made. These assets or disposal groups are reported in their own line as current assets and short-term liabilities respectively in the statement of financial position.
Immediately before classification as a holding for sale, the book value of assets and liabilities in a disposal group is determined in accordance with applied standards. In the initial classification of a holding for sale, the fixed assets and disposal groups are reported at the lowest of the book value and fair value with deductions for sales costs. Certain assets, separately or as part of a disposal group, are exempt from the valuation rules described above, namely investment properties, financial assets, deferred tax assets and managed assets relating to benefit-based pension plans.
A profit is reported at every increase of the fair value with deductions for sales costs. This profit is limited to an amount that corresponds to the total of the previously executed write-downs.
Losses as a result of a fall in value in the initial classification as a holding for sale are reported in the profit or loss for the year. Subsequent changes in value, both profits and losses, are also reported in the profit or loss for the year.
Discontinued operations refer to a part of a company’s business that represents an independent operating arm or a significant business within a geographical area or a subsidiary that was acquired exclusively with an aim to be sold on. Classification as a discontinued operation is made on divestment or at an earlier time if the operations meet the criteria to be classified as a holding for sale.
Profit or loss after tax from discontinued operations is reported in a specific line in the statement of profit or loss and other comprehensive income. When operations are classified as discontinued, the formulation of comparison year reports of profit or loss and other comprehensive income changes so that it is reported as if the discontinued operations had been discontinued at the start of the comparison year. The formulation of the statement of financial position for the current year and previous year is not changed in a corresponding way.
Contingent liabilities
A contingent liability is reported when there is a possible obligation that arises from events and whose existence is confirmed only by one or more uncertain future events or when there is an obligation that is not reported as a liability or a provision due to the improbability of an outflow being required.
The Parent company’s accounting principles
The Parent company has drawn up its annual accounts in accordance with the Swedish Annual Accounts Act (1995:1554), and the Swedish Financial Accounting Standards Council recommendation, RFR 2 Accounting for a legal entity. RFR 2 means that the Parent company in the annual accounts for the legal entity shall apply all of the EU-developed IFRS and pronouncements as far as this is possible within the framework of the Annual Accounts Act, the law on safeguarding pension commitments, and with consideration taken for the connection between accounting and taxation. The recommendation states the exceptions and additions to IFRS that are to be made.
Unchanged accounting principles
The Parent company’s accounting principles are unchanged compared with the previous year.
Differences between the Group’s and Parent Company’s accounting principles
The differences between the Group’s and Parent Company’s accounting principles are given below.
Classification and format
The Parent company’s income statement and balance sheet are drawn up according to the Annual Account Act’s scheme. The differences compared with IAS 1, Presentation of financial statements, which have been applied in the presentation of the Group’s financial statements, are principally reporting of financial income and expense, fixed assets, equity and the addition of provisions as a heading in the balance sheet.
Financial instruments
Due to the connection between accounting and taxation, the rules on financial instruments and hedge accounting in IAS 39 are not applied in the Parent company as legal entity.
In the Parent company, financial fixed assets are valued at acquisition value minus any write-down, and financial current assets according to the lowest value principle. The acquisition value for interest-bearing instruments is adjusted for the accrued difference between what was paid originally, after deductions for transaction costs, and the amount that was paid on the due date (surplus and under value respectively).
Subsidiaries, participations in associated companies and jointly controlled companies Participations in subsidiaries, associated companies and jointly controlled companies are reported in the Parent company according to the acquisition value method. This means that acquisition expenditure is included in the book value of participations in subsidiaries. In the consolidated financial statements, the acquisition expenditure relating to participations in subsidiaries from 2013 is reported directly in profit or loss when it arises.
The book value is reviewed continuously against the fair value of assets and liabilities in the subsidiaries, associated companies and jointly controlled companies. In cases where the book value of the participations exceeds the companies’ fair value, writedowns are made that affect the income statement. In cases where a previous writedown is no longer justified, a reversal is carried out.
Financial guarantees
The Parent company’s financial guarantee agreements consist mainly of guarantees for the benefit of subsidiaries, associated companies and jointly controlled companies. Financial guarantees mean that the company has an obligation to compensate holders of a debt instrument for losses if these are incurred due to a stated debtor not fulfilling payment on the due date according to the agreement conditions. For reporting of financial guarantee agreements the Parent company applies one of the Swedish Financial Accounting Standards Council-permitted participation exemption rules compared with the rules in IAS 39. The participation exemption rule relates to financial guarantee agreements formulated for the benefit of subsidiaries, associated companies and jointly controlled companies. The Parent company reports financial guarantee agreements as provisions in the balance sheet when the company has an obligation for which payment is probably required in order to regulate the obligation.
Anticipated dividends
Anticipated dividends from subsidiaries can be reported in cases where the Parent company alone has the right to decide on the dividend’s size and the Parent company has decided on the dividend’s size before the Parent company has published its financial statements. Anticipated dividends are reported as financial income.
50
Group contributions
Paid and received group contributions are reported as appropriations.
Shareholders’ contribution
The shareholders’ contribution is taken up directly against equity at the recipient and activated in shares and participations at the donor, to the extent that write-downs are not required.
Tangible fixed assets
Tangible fixed assets in the Parent company are reported at the acquisition value after deductions for accumulated depreciation and any write-downs in the same way as for the Group, but with any write-ups.
Leased assets
In the Parent company all leasing agreements are reported according to the rules for operational leasing.
Financial fixed assets
In the Parent company all financial fixed assets are reported at the acquisition value with reductions for any write-downs. The assessment is made from share type to share type and a write-down to fair value is carried out when the decrease in value is expected to be lasting.
Other long-term receivables are valued at the amount that is expected to be received.
Taxes
In the Parent company untaxed reserves are reported including deferred tax liabilities. However, in the consolidated financial statements untaxed reserves are divided between deferred tax liabilities and equity.
Note 2 Important estimates and assessments
The company management and the Board have discussed the development, choice and information regarding the Group’s important accounting principles and estimates, as well as the applications of these principles and estimates.
Certain important accounting-related estimates that have been used in the Group’s accounting principles are described below.
The sources of uncertainty in estimates that are stated below refer to those that involve a risk that the value of assets or liabilities may need an adjustment to a significant extent in the coming financial year.
The financial risks are linked to the business’s tied-up capital, capital requirements, interest rate risks and currency risks.
Investment properties
Investment properties are reported in accordance with the options in IAS 40 at fair value. This value is established by company management based on the properties’ market value at accounting year-end, with changes in fair value reported in the profit or loss. Therefore, the profit or loss can be considerably affected by changes in the fair value of investment properties. The fair value has been calculated by independent appraisal institutions in accordance with good appraisal practice. Important assessments have therefore been made regarding aspects such as cost of capital and direct yield requirement that are based on the appraisal institutions’ experience-based assessments of the market’s yield requirements for comparable properties. The assessments of cash flow for operating, maintenance and administration costs are based on actual costs, but consideration has also been given to experiences relating to comparable properties. Future investments have been assessed based on the actual needs that exist and with the support of the investment plans that have been drawn up. See Note 22 for a more detailed description of assumptions and estimations connected with the appraisal process.
Write-down testing of goodwill
The Group’s total goodwill amounts to SEK 62 405 K (60 805). In the calculation of the cash-generating units’ recoverable amounts for assessment of any write-down requirement for goodwill, several assumptions about future conditions and estimates of parameters have been made. A description of these is presented in Note 21. As can be understood from the description, changes exceeding what is reasonable can be expected, due to these assumptions and estimates, to have an effect on the value of goodwill in 2018. However, this risk is very low as the recoverable amounts exceed to a great extent the book value in those cases where the goodwill values are a significant amount.
Taxes
Changes in fiscal legislation and altered practice in the interpretation of fiscal legislation can significantly affect the amount of reported deferred taxes. For more information on taxes, see Notes 19 and 34.
Note 3 Net sales by type of income
The Group
Income per significant type of income
2017 2016
Sale of goods 276 253 254 600
Rental income 153 255 144 872
Service assignments 137 11 105
Administrative income 2 526 2 896 432 171 413 473
The Parent company
Income per significant type of income
Administrative income 7 314 7 759 7 314 7 759
Note 4 Other operating income
The Group
2017 2016
Capital gains from divestment of fixed assets 16 782
Exchange gains from receivables/liabilities of an operating nature 119 218 Recovered customer losses 69 –Other 498 537 702 1 537
The Parent
company Other 156 330 156 330
Note 5 Leasing income relating to operational leasing
Rental and leasing income is based on the rental and leasing agreements that are regarded as operational leasing agreements in which the Group is the lessor.
One property in the Volito Fastigheter group is leased out through a financial leasing agreement, see Note 35.
Real estate
The rental income includes not only basic rent, continuing charges for items such as heating, electricity, water and sanitation, and property tax, but also a deduction for granted rent rebates. Also included is income relating to premature settlement of the rental contract. Of rental income, SEK 193 K (400) consists of turnover-based premises rents. Rents and rent rebates that are only debited during a certain period of a contract’s duration are accrued linearly over the respective contract’s entire duration.
Rental income in the Volito Fastigheter group according to the property portfolio at year-end was divided between 97 % commercial premises and 3 % residential. The commercial rental income was divided between 163 (147) contracts within a number of different sectors. With the aim of limiting exposure to credit losses, regular follow-ups are made of tenants’ credit ratings. No sector or tenant accounts for more than 10 % of the rental income.
The duration of the contract portfolio for commercial premises in the Volito Group expires as at 31 December 2017 as below. The stated amounts refer to contracted closing rents in the portfolio: 2017 2016
The Group
Within one year 23 597 24 298 Between one and five years 103 457 80 672 Longer than five years 48 335 49 338 175 389 154 308
Note 6 Auditing: fees and expenses
The Group
kpmg
2017 2016
Audit assignments 1 041 1 154 Tax consultations 252 –Other assignments 199 168 pwc Tax consultations – 155 other auditors Audit assignments 35 50 Tax consultations 17 36 Other assignments 89 309
The Parent company
kpmg
Audit assignments 321 319 Tax consultations 173 –Other assignments 7 89 Audit assignments refer to the scrutiny of the annual accounts, accounting, and the Board’s and CEO’s administration, as well as other tasks that fall to the company’s auditor to carry out, and consultation or other assistance resulting from observations of such scrutiny or the carrying out of such other tasks. Tax consultations include consultations concerning income tax and valued added tax. Other assignments refer to consultations that are not applicable to any of the above named service categories.
Note 7 Staff and personnel costs
Of which, Of which,
Average number of employees 2017 men 2016 men
The Parent company
Sweden 5 40 % 5 40 %
Subsidiaries Sweden 98 86 % 88 85 % Finland 19 89 % 18 89 % Norway 2 100 % 3 100 % Total in subsidiaries 119 87 % 109 86 %
Group total 124 85 % 114 83 %
51
ANNUAL REPORT
Gender distribution in company management
The Group
2017 2016
Percentage of women Percentage of women
Board of Directors 0 % 0 % Other senior executives 0 % 0 %
Expenses and remuneration to employees 2017 2016
The Group
Salaries and remuneration etc. 71 071 64 021 Pension expense, contribution-based plans 12 075 10 157 Social security charges 22 217 19 453 105 363 93 631
Salaries, other remuneration and social security expenses 2017 2016
Salaries and remuneration
Social security expenses Salaries and remuneration
Note 8 Depreciation of tangible and intangible fixed assets
2017 2016
The Group
Social security expenses
The Parent company 8 864 5 201 7 602 4 646 (of which, pension costs) 1) (1 816) 1) (1 733) Subsidiaries 62 207 29 091 56 419 24 964 (of which, pension costs) (10 421) (8 424)
Total for the Group 71 071 34 292 64 021 29 610 (of which, pension costs) 2) (12 237) 2) (10 157)
1) Of the Parent company’s pension costs, SEK 1 248 K (previous year 1 107) refers to the company’s Board and CEO. The company has no outstanding pension obligations to them.
2) Of the Group’s pension costs, SEK 3 745 K (previous year 3 198) refers to the companies Board and CEO. The group has no outstanding pension obligations to them.
Salaries and other remuneration by senior executives, and other employees in the Parent company 2017 2016
The Parent company senior executives (5 people, ceo And boArd members) Salaries and other remuneration 6 040 4 530 (of which, bonuses and similar) (1 000) (–) Social security expenses 3 525 2 862 (of which, pension costs) (1 248) (1 107) other employees
Salaries and other remuneration 2 824 3 072 Social security expenses 1 676 1 784 (of which, pension costs) (568) (626)
The Parent company, total Salaries and other remuneration 8 864 7 602 (of which, bonuses and similar) (1 000) (–) Social security expenses 5 201 4 646 (of which, pension costs) (1 816) (1 733)
Salaries and other remuneration by senior executives, and other employees in the Group 2017 2016
The Group senior executives Salaries and other remuneration 17 997 13 407 (of which, bonuses and similar) (1 000) (155) Social security expenses 9 943 7 378 (of which, pension costs) (3 745) (3 198)
other employees
Salaries and other remuneration 53 074 50 614 Social security expenses 24 349 22 232 (of which, pension costs) (8 492) (6 959)
The Group, total Salaries and other remuneration 71 071 64 021 (of which, bonuses and similar) (1 000) (155) Social security expenses 34 292 29 610 (of which, pension costs) (12 237) (10 157)
Remuneration to senior executives Principles
The Chairman of the Board receives no remuneration. The other Board members receive a fee of SEK 300 K according to the Annual General Meeting’s decision. There is no agreement concerning future pension/severance pay for either the Chairman of the Board or other board members. Remuneration to the CEO and other senior executives consists of basic salary, other benefits and pension. There is an agreement with the CEO of the Parent company regarding a bonus scheme and severance pay corresponding to one year’s salary.
Remuneration and other benefits
Other benefits refer to company cars. Pension costs refer to the costs that affect the profit or loss for the year. For the CEO and other senior executives premium-based pension plans apply, and the retirement age is 65. Costs for the CEO’s pension consist of premium of 35 % of the pension-establishing salary during the period of employment. For other senior executives ITP plans or equivalent apply, and the retirement age is 65.
Other senior executives
On termination of employment from the company’s side, other senior executives have the right to severance payments amounting to between six months’ and 12 months’ salary.
Absence due to illness
As only five people are employed by the Parent company, there is no obligation to report on absence due to illness.
Other intangible assets
-742 -581 Industrial premises -274 -268 Plant and machinery -421 -398 Equipment, tools and installations -4 577 -4 295 -6 014 -5 542
The Parent company Licences -75 -38 Equipment, tools and installations -100 -271 -175 -309
Note 9 Leasing fees relating to operational leasing
The Group
Assets held via operational leasing agreements
2017 2016
Minimum leasing fees 7 517 7 562
Total leasing costs 7 517 7 562
Contracted future minimum leasing fees relating to non-terminable contracts due for payment: Within one year 7 884 7 025 Between one and five years 14 756 17 771 22 640 24 796
The Parent Company Assets held via operational leasing agreements Minimum leasing fees 2 257 2 254 2 257 2 254
Leasing income from subleases 1 378 1 423 Contracted future minimum leasing fees relating to non-terminable contracts due for payment: Within one year 2 309 2 322 Between one and five years 3 603 6 124 5 912 8 446
Premises rental and certain office inventories are classified as operational leasing agreements. The main part of leasing costs relates to renting of premises in accordance with operational leasing agreements. The Parent company’s leasing agreement runs until 30 June 2020, without special restrictions and with an option to extend. The Parent company and Volito Fastigheter AB occupy premises owned by Volito Fastigheter AB. All subsidiaries within Volito Industry, except the part of Hydraulic Supplier based in Smålandsstenar, which owns the property, occupy rented premises.
Other agreements on operational leasing are divided between small agreements and amount to a negligible amount.
Note 10 Other operating expenses
The Group
2017 2016
Exchange losses on receivables/liabilities of an operating nature -718 -817 Capital loss -152 -94 Guarantee-related costs -307 –Capital loss on divestment of participations in subsidiaries – -39 Other -134 -31 -1 311 -981
The Parent company Capital loss – -94 Write-downs of receivables -331 -299 -331 -393
Note 11 Profit or loss from participations in subsidiaries
2017 2016
The Parent company
Dividends 35 300 18 000 Write-downs of participations -4 620 -17 581 30 680 419
Note
12 Profit or loss from participations in joint ventures 2017 2016
The Group
Profit from participations in joint ventures 3 464 3 140 Write-downs of loans – -48 429 3 464 -45 289
52
Note 13 Profit or loss from participations in associated companies
2017 2016
The Group
Profit participations in earnings of associated companies 35 707 32 312 Reversal of write-downs 5 501 –41 208 32 312
The Parent company
Dividend 20 025 14 435 Reversal of write-downs 5 501 –25 526 14 435
Note 14 Profit or loss from other financial income and expense
The Group
2017 2016
Dividend 60 132 44 489 Capital gain from divestments 8 000 4 364 Write-downs -3 031 -199 65 101 48 654
The Parent company
Dividend 59 880 44 489 Capital gain from divestments 8 000 4 364 Write-downs -3 031 -199 64 849 48 654
Note 15 Interest income and similar income
The Group
No properties were divested in 2016 or 2017. Total invested capital refers to original investments or acquisitions plus the investments made in the respective properties during the remaining period of the holding.
At every year-end all properties are valued externally. Malmöbryggan Fastighetsekonomi AB carried out a valuation of Volito’s properties on 31 December 2017. The properties’ values are individually assessed to correspond to the fair value for the respective property.
Note 22 presents a description of valuation methods, valuation basis, market parameters etc. that are used in the valuation of the property portfolio.
Note 18 Changes in value of derivatives
Derivatives are financial instruments that according to IAS 39 are valued at fair value in the balance sheet. Changes in the value of interest rate derivatives are reported under the heading “Changes in value of derivatives” in the income statement. If the agreed interest rate for the derivative deviates from the expected future market interest rate during the derivative’s duration a change in value is entered in Volito’s balance sheet and income statement, but does not affect the cash flow. The reduced risk in interest payments through long fixed interest rates often creates a larger risk in derivative value due to the time factor. When the duration of the derivative has expired, the value of the interest rate derivative is always zero.
Note 19 Taxes
The Group
2017 2016
Interest income, subsidiaries 118 45 Interest income, other 2 046 1 272 Leasing income 1 579 1 633 Exchange rate profits 358 1 063 Guarantee-related income 79 –Capital gain from divestment of short-term investments 3 678 –Dividend from short-term investments – 510 Other – 105 7 858 4 628
The Parent company
Interest income, subsidiaries 2 466 1 737 Exchange rate profits 367 274 Guarantee-related income 1 680 846 Capital gain from divestment of short-term investments 3 678 –Dividend from short-term investments – 510 Other – 106 8 191 3 473
All interest income is attributable to instruments valued at the accrued acquisition value.
Note 16 Interest expenses and similar expenses
2017 2016
The Group
Interest expenses, other -51 847 -51 088 Set-up fee -1 000 –
Credit charges and commissions -750 -942 Other -2 898 -1 900 -56 495 -53 930
The Parent company
Interest expenses, subsidiaries -138 -238 Interest expenses, other -8 358 -7 609 Set-up fee -1 000 –
Credit charges and commissions -750 -873 -10 246 -8 720
Of interest expenses, SEK 30 259 K (25 092) is attributable to instruments valued at the accrued acquisition value and SEK 24 486 K (25 996) to instruments valued at fair value.
Note 17 Changes in value of investment properties
The changes in value for the year are attributable to both divested properties and to the property portfolio at year-end
2017 2016
The Group Changes in value of property portfolio, 31 December 167 243 129 231
2017 2016
Current tax -1 154 -1 545 Deferred tax -45 570 -42 588
Total reported taxes for the Group -46 724 -44 133 The Parent company
Current tax -121 -89 Deferred tax 2 774 -3 699
Total reported taxes for the Parent company 2 653 -3 788
Reconciliation of effective tax 2017 2016
Per cent Amount Per cent Amount
The Group Profit before tax 312 346 204 819 Tax according to the current tax rate for the Parent company 22,0% -68 716 22,0 % -45 060 Effect of other tax rates for foreign subsidiaries 0,0% 134 4,0 % -8 254 Other non-deductible expenses 1,3% -4 152 3,4 % -7 052 Other tax-exempt income -7,0% 21 965 -7,0 % 14 437 Utilisation of previously non-activated deductible deficiency 0,0% – 0,0 % 72 Tax relating to previous years 0,0% -121 0,0 % -76 Non-evaluated deductible deficiency 0,1% -310 0,3 % -645 Temporary differences -0,1% 407 0,1 % -183 Fiscal result of divestment of shares 0,0% – -0,5 % 960 Adjustment of tax attributable to profit or loss from associated companies and joint ventures -1,3% 4 127 -0,8 % 1 625 Other 0,0% -58 0,0 % 43
Reported effective tax 15,0 % -46 724 21,5 % -44 133
Reconciliation of effective tax 2017 2016 Per cent Amount Per cent Amount
The Parent company Profit before tax 101 670 78 126 Tax according to the current tax rate for the Parent company 22,0% -22 367 22,0 % -17 188 Non-deductible expenses 3,9% -3 942 5,5 % -4 304 Tax-exempt income -27,8% 28 274 -21,4 % 16 688 Tax relating to previous years 0,1% -121 0,1 % -60
Temporary differences -0,8% 809 -0,1 % 116 Fiscal result from divestment of shares 0,0% – -1,2 % 960
Reported effective tax -2,6 % 2 653 4,8 % -3 788
The nominal tax rate is 22 % in Sweden, 12.5 % in Ireland, 17.77 % in Switzerland, 12.5 % in Cyprus, 20 % in Finland and 24 % in Norway.
The Group reports current tax of SEK -1 154 K (-1 545). Current tax is calculated on the fiscal results of the companies included in the Group. This is lower than the Group’s reported profit or loss before tax, which is mainly because:
• Changes in value relating to investment properties, shares in listed companies and derivatives are not included in the taxable profit or loss.
• Tax deductible depreciation for buildings does not affect the Group’s profit or loss.
• Directly tax deductible amounts relating to certain rebuilding investments for properties do not affect the Group’s profit or loss.
• Fiscally utilised deductible deficiency does not affect the Group’s profit or loss.
In addition to what is reported above, there is also within the Group a tax expense attributable to components in other comprehensive income amounting to SEK -1 332 K (-794).
53
ANNUAL REPORT
Before tax Tax After tax
The Group 2017
Translation differences for the year in translation of overseas businesses -2 124 – -2 124
Available-for-sale financial assets – net -29 502 -1 332 -30 834
Participations in associated companies’ other comprehensive income 5 464 – 5 464
Other comprehensive income -26 162 -1 332 -27 494
The Group 2016 Before tax Tax After tax
Translation differences for the year in translation of overseas businesses 8 642 – 8 642
Available-for-sale financial assets – net 128 164 -794 127 370 Participations in associated companies’ other comprehensive income 5 607 – 5 607
Other comprehensive income 142 413 -794 141 619
Note 20 Scope of other comprehensive income and other reserves
The foreign exchange reserve includes all currency differences that arise in translation of financial statements from foreign subsidiaries and associated companies that have drawn up their financial statements in currencies other than the currency used in the Group’s financial statements. When foreign subsidiaries are wound up or divested this part of the foreign exchange reserve is transferred to profit or loss for the year.
The available-for-sale reserve includes changes in value of available-for-sale financial assets. Available-for-sale financial assets are continuously valued at fair value with the period’s changes in value reported in other comprehensive income and the accumulated changes in value in an available-for-sale reserve in equity.
Note 21 Intangible fixed assets
Goodwill 2017-12-31 2016-12-31
The Group
Accumulated acquisition value
At start of the year 60 805 47 989 Acquisition of subsidiaries – 12 319 Business combinations 759 –Other investments 501 –Exchange rate differences for the year 340 497 At year-end 62 405 60 805
2017-12-31 2016-12-31
Other intangible assets
The Group
Accumulated acquisition value
At start of the year 4 829 5 462 Other investments 854 360 Divestments and disposals – -1 082 Exchange rate differences for the year 65 89
At year-end 5 748 4 829
Accumulated depreciation according to plan At start of the year -3 722 -4 160 Divestments and disposals – 1 082 Depreciation according to plan for the year -742 -582 Exchange rate differences for the year -54 -62
At year-end -4 518 -3 722 Book value at year-end 1 230 1 107
2017-12-31 2016-12-31
Total intangible assets
The Group
Accumulated acquisition value
At start of the year 65 634 53 451
Acquisition of subsidiaries – 12 319 Business combinations 759 –Other investments 1 355 360 Divestments and disposals – -1 082 Exchange rate differences for the year 405 586
At year-end 68 153 65 634
Accumulated depreciation according to plan
At start of the year -3 722 -4 160
Divestments and disposals – 1 082 Depreciation according to plan for the year -742 -582 Exchange rate differences for the year -54 -62
At year-end -4 518 -3 722
Book value at year-end 63 635 61 912
2017-12-31 2016-12-31
Write-down testing of goodwill in cash-generating units
The Volito Group’s financial position at as 31 December 2017 includes goodwill of SEK 62 405 K (60 805). The entire amount is attributable to acquisitions in the Volito Industry group.
2017-12-31 2016-12-31
The Group Industry
HydX AB 35 980 35 980
Hydraulic Supplier i Norden AB 7 657 7 657
Hydraulik- och Industriservice i Vetlanda AB 6 901 6 142 Hydrosystem Oy 11 867 11 026
At year-end 62 405 60 805
Write-downs of goodwill
During 2017, the Group made no write-downs of goodwill. In all of the cash-generating units where a calculation of recoverable amount was carried out and no write-down requirement was identified, it is the company management’s assessment that no reasonably possible changes in important assumptions would cause the recoverable amount to fall below the book value.
Method for calculating recoverable amounts
For all goodwill values the recoverable amount has been measured through a calculation of the value in use for the cash-generating unit. The calculation model is based on a discounting of future forecast cash flows that are set against the unit’s book value. The future cash flows are based on 3-year forecasts compiled by the management of the respective cash-generating unit. In testing of goodwill an infinite horizon has been assumed and extrapolation of the cash flow after the forecast period has been based on a growth rate from year 4 of approx. 2 %.
Important variables for calculating value in use:
The following variables are significant and common for all cash-generating units in the calculation of value of use.
turnover: The businesses’ competitiveness, expected business climate trend for the hydraulic sector, general social-economic development, interest rates and local market conditions.
operAting mArgin: Historic profitability level and efficiency of the business, access to key people and qualified work force, ability to cooperate with customers, access to internal resources, cost trends for salaries and materials.
operAting cApitAl requirements: An assessment on a case-by-case basis of whether the operating capital level reflects the business’s requirements or needs to be adjusted for the forecast periods. For future development a cautious assumption is that it follows growth in turnover. A high level of internally developed projects can mean a greater need for operating capital.
investment requirements:
The investment needs of the business are assessed based on the investments required to reach forecast cash flow at the base level, i.e. without investments in expansion. In normal cases, the investment level has corresponded to the depreciation rate on tangible fixed assets.
discount rAte of interest:
The discount rate of interest is determined through a balanced average capital cost for the hydraulic sector and reflects current market assessments of the money’s time value and the risks that in particular apply to the asset for which the future cash flows have not been adjusted. For cash-generating units in Sweden a discount rate of interest estimated as a WACC of 7.0 % (8.1) is used, and the corresponding WACC in Finland has been estimated at 8.3 % (7.9).
Note 22 Investment properties
The greater part of Volito’s properties have been classified as investment properties. Investment properties are properties held with an aim to generate rental income or value growth, or a combination of the two. Investment properties are reported in the statement of financial position at fair value.
Volito rents offices in Malmö in its own properties. The rental amount for internal renting makes up a negligible part of the respective property’s total rental value, which is why no classification as a business property has been made for these properties.
Volito holds no property that has been acquired or rebuilt for subsequent immediate sale, which is why no property has been classified as a property held for resale.
Investments for the year amounted to SEK 302.7 million (80.4), see Note 26.
The property portfolio’s fiscal residual value amounted at year-end to SEK 1 821.0 million (1 561.9).
Calculation of fair value
Other intangible assets
The Parent company
Accumulated acquisition value
At start and end of year 226 226
Accumulated depreciation according to plan
At start of the year -38 –Depreciation according to plan for the year -75 -38
At year-end -113 -38
Book value at year-end 113 188
On 31 December 2017 the company carried out an external market valuation of the Group’s properties. The fair value of the investment properties has been assessed by an external, independent property appraiser with relevant professional qualifications and experience of both current market areas and the type of property that is being valued.
Volito has used Malmöbryggan Fastighetsekonomi AB.
The valuation has been done in accordance with the guidelines applied in the SFI/IPD Swedish Real Estate Index. Fair value has been estimated through the application of the present value method, which is calibrated against comparable purchases and other available, relevant market information.
The present value method is based on the present value calculation of future actual cash flows that is gradually market-adjusted, normally over five to eight years, and the present value of assessed residual value at the calculation period’s end. Valuation of investment properties has been categorised as belonging to level three in the fair value
54
hierarchy, as non-observable input data used in the valuation has a significant effect on the assessed value. The properties’ values are individually assessed to correspond to the fair value of the respective property.
The value is calculated as an average yield of 4.55 % (4.66 %).
2017-12-31 2016-12-31
Reconciliation of property valuation
Properties’ value according to external appraisers 3 229 000 2 763 700
Change in book value for the year 2017-12-31 2016-12-31
Book value at start of the year 2 763 700 2 560 000 Investments 288 108 2 489 Reclassifications 9 948 71 980
Change in value of remaining properties at year-end 167 244 129 231 Book value 3 229 000 2 763 700
Summary
Valuation date 2017-12-31 2016-12-31 Calculation period 5–8 years 5–8 years In normal cases, five years for the most recent properties. However, certain properties have other calculation periods due to length of contracts.
Assessed direct yield requirement, residual value 2.75–6.5 % 4.0–6.5 % Long-term vacancy rate 3.5–10.0 % 3.7–27.3 % Operating and maintenance costs Assessed normalised cost levels (SEK153-443/m2) based on outcome 2013–2016, forecast 2017 and budget 2018. Inflation forecast CPI assessed to rise by 1.9 % for 2018, thereafter 2.0 % per year.
Accrued rebuilding expenses regarding properties classified as investment properties are reported under the item “Fixed assets under construction and advances relating to tangible fixed assets.” Note 26.
2017-12-31 2016-12-31
The Group 17 340 12 732
Investment properties – effect on profit or loss for the period 2017-12-31 2016-12-31
The Group
Rental income 155 512 147 354
Direct costs for investment properties that generated rental income during the period (operating and maintenance costs, property tax and ground rent) -47 800 -31 357
The duration of the contract portfolio for commercial premises within the Volito Group as at 31 December 2017 expires according to the table below. Stated amounts refer to contracted closing annual rents in the portfolio: 2017-12-31 2016-12-31
The Group
Within one year 23 597 24 298 Between one and five years 103 457 80 672 Longer than five years 48 335 49 338 175 389 154 308
Counterparty risks in rental incomes
According to the contract portfolio at year-end, rental income was divided between 97 % commercial properties and 3 % residential. The commercial rental income was divided between 163 contracts in a number of different sectors. With the aim of limiting exposure to credit losses, regular follow-ups are made of tenants’ credit ratings. No sector or tenant accounts for more than 10 % of the rental income.
Note 23 Industrial premises
The Group
Accumulated acquisition value
2017-12-31 2016-12-31
At start and end of year 10 589 10 589
Accumulated depreciation according to plan
At start of the year -6 134 -5 866 Depreciation according to plan for the year -274 -268 -6 408 -6 134
Book value at end of period 4 180 4 455
2017-12-31 2016-12-31
Note 24 Machinery and other technical fixed assets
The Group
Accumulated acquisition value
At start of the year
Of which, land
The Group
Accumulated acquisition value 598 598
2017-12-31 2016-12-31
5 360 4 997
New acquisitions 490 96 Acquisition of subsidiaries – 333 Reclassifications – -66 5 850 5 360
Accumulated depreciation according to plan
At start of the year -2 724 -2 037
Acquisition of subsidiaries – -320 Reclassifications – 31 Depreciation according to plan for the year -421 -398 -3 145 -2 724
Book value at end of period 2 704 2 636
Note 25 Equipment, tools and installations
The Group
Accumulated acquisition value
2017-12-31 2016-12-31
At start of the year 43 793 37 836 New acquisitions 5 495 7 776
Acquisition of subsidiaries – 3 230 Divestments and disposals -2 606 -5 227 Reclassifications – 66 Exchange rate differences for the year 66 112 46 748 43 793
Accumulated depreciation according to plan
At start of the year -22 431 -18 746 Acquisition of subsidiaries – -2 393 Divestments and disposals 1 809 3 106 Reclassifications – -31 Depreciation according to plan of acquisition value for the year -4 577 -4 295 Exchange rate differences for the year -51 -72 -25 250 -22 431
Book value at end of period 21 498 21 362
2017-12-31 2016-12-31
The Parent company
Accumulated acquisition value
At start of the year 5 266 5 979 New acquisitions 44 24 Divestments and disposals – -737 5 310 5 266
Accumulated depreciation according to plan
At start of the year -2 593 -2 964 Divestments and disposals – 642 Depreciation according to plan of acquisition value for the year -100 -271 -2 693 -2 593
Book value at end of period 2 617 2 673
55
ANNUAL REPORT
Note 26 Fixed assets under construction and advances relating to tangible fixed assets
The Group
2017-12-31 2016-12-31
At start of the year 12 732 6 833 Reclassifications -9 948 -71 981 Expensing of renovation work -14 431 –Investments 29 022 77 880
Book value at end of period 17 375 12 732
Borrowing expenses
No activated interest is included in the acquisition value
Note 27 Participations in subsidiaries
Accumulated acquisition value
2017-12-31 2016-12-31
At start of the year 582 630 686 249 Reduction of share capital and repayment of share-holders’ contribution – -121 200 Granted shareholders’ contribution 3 620 17 581 586 250 582 630
Accumulated write-downs
At start of the year -211 938 -194 357 Write-downs for the year -4 620 -17 581 -216 558 -211 938
Book value at end of period 369 692 370 692
Continued Note 27, Specification of the Parent company’s and Group’s holdings of participations in subsidiaries
2017-12-31 2016-12-31 No. of Share in Book Book Subsidiary / Corp. ID No. / Registered office shares in % 1) value value
Volito Aviation AB, 556603-2800, Malmö 10 000 100,0 51 588 52 588
Volito Fredag AB, 556673-5782, Malmö 100,0
Volito Fastigheter AB, 556539-1447, Malmö 423 000 100,0 312 014 312 014
Volito Fastighetsutveckling AB, 556375-6781, Malmö 100,0
Volito Fastighetsförvaltning AB, 556142-4226, Malmö 100,0
Fastighetsbolaget Flygledaren HB, 916760-2035, Malmö 100,0 HB Ran Förvaltning, 916766-5224, Malmö 100,0
Volito Fastighetskupolen AB, 556629-1117, Malmö 100,0
Fastighets AB Centralposthuset i Malmö, 556548-1917, Malmö 100,0
Volito Leisure AB, 556541-9164, Malmö 100,0
Volito Agatel AB, 556677-1472, Malmö 100,0
Volito Fosiestenen AB, 556690-0873, Malmö 100,0
Volito Mosippan AB, 556131-7979, Malmö 100,0
Volito Delfinen AB, 556630-7988, Malmö 100,0
Volito Proveniens AB, 556758-2415, Malmö 100,0
Volito Sankt Peter AB, 556658-6904, Malmö 100,0
Volito Claus AB, 556758-3090, Malmö 100,0
Volito Laxen AB, 556758-3975, Malmö 100,0
Volito Stjärnan AB, 556758-3074, Malmö 100,0
Volito Södra Porten AB, 556758-3108, Malmö 100,0
Volito Söderhavet AB, 556758-3561, Malmö 100,0
Volito Visenten AB, 556749-9636, Malmö 100,0
Volito Industri AB, 556662-5835, Malmö 81 900 91,0 5 460 5 460
Volito Automation AB, 556669-2157, Malmö 100,0 HydX AB, 556791-5326, Ystad 100,0
Hydraulic Supplier i Norden AB, 556718-2091, Malmö 100,0
Hydraulik- och Industriservice i Vetlanda AB, 556281-7352, Vetlanda 100,0 Hintratech AB, 556568-9436, Vetlanda 100,0 Hyd Partner A/S, 913929616, Krokkleiva, Norway 100,0 Hydrosystem Oy, 0606351-2, Jyväskylä, Finland 100,0 Volito AG, CHE-110.245.578, Zug, Switzerland 100 100,0 0 0 Other subsidiaries, dormant 630 630
1) Refers to the ownership share of the capital, which also agrees with the proportion of votes for the total number of shares. 369 692 370 692
Holding with non-controlling interest Subsidiary Country Business segment 2017-12-31 2016-12-31
Volito Industri AB Sweden Industry 9 % 9 %
Volito Industri AB (group) Subsidiaries 2017 2016
Net sales 276 253 254 600 Income 3 407 2 284
Total comprehensive income 3 407 2 284
Attributable to acquisitions with non-controlling interest 0 0
Fixed assets 76 990 75 527
Current assets 105 378 113 773 Long-term liabilities -111 913 -111 687 Short-term liabilities -90 405 -101 551
Net assets -19 950 -23 938
Attributable to acquisitions with non-controlling interest 0 0
Cash flow from:
Operating activities 12 019 12 830 Investing activities -16 550 -41 565 Financing activities 4 361 31 648
Cash flow for the year -170 2 913
As the net assets are negative, receivables from holdings with non-controlling interest have not been reported.
Note 28 Receivables from subsidiaries
The Parent company
Accumulated acquisition value
2017-12-31 2016-12-31
At start of the year 107 997 63 717
Additional receivables – 51 176 Regulated receivables – -11 500 Reclassifications – 4 604
Book value at end of period 107 997 107 997
Note 29 Participations in joint ventures
The Group
Accumulated acquisition value
2017-12-31 2016-12-31
At start of the year 32 347 244 593
The year’s acquisitions 23 838 21 312
Reclassifications – -236 698 Participations in joint ventures’ profit for the year 3 464 3 140 59 649 32 347
Accumulated write-downs At start of the year – -236 698 Reclassifications – 236 698 – –
Book value at end of period 59 649 32 347
56
Specification of the Parent company’s and Group’s holdings of participations in joint ventures 2017-12-31
Joint venture/Corp. ID no., Registered office
Indirectly owned
Shares / number in %
Equity share’s value in the Group
Book value at Parent company
Nya Bara Utvecklings AB, 556858-4311, Bara 50,0 33 343 –Point Hyllie Holding AB, 559023-4034, Malmö 50,0 26 306 –
Book value at end of period 59 649 –
2016-12-31
Specification of the Parent company’s and Group’s holdings of participations in associated companies
Joint venture/Corp. ID no., Registered office
Shares /number in %
Equity share’s value in the Group
2017-12-31
Book value at Parent company
Directly owned Bulten AB (publ), 556668-2141, Gothenburg 21,9 347 520 195 223 Nordkap Holding AG, 40,0 0 0 CHE - 110.234.439, Zug, Switzerland
Joint venture/Corp. ID no., Registered office
Indirectly owned
Shares / number in %
Equity share’s value in the Group
Book value at Parent company
Nya Bara Utvecklings AB, 556858-4311, Bara 50,0 10 566 –Point Hyllie Holding AB, 559023-4034, Malmö 50,0 21 781 –
Book value at end of period 32 347 –
Below is a specification of the group-wise value relating to the ownership share in joint ventures’ income and expense, as well as assets and liabilities.
Nya Bara Utvecklings AB Point Hyllie AB 2017 2016 2017 2016
Income 8 509 8 390 13 931 8 330 Expense -5 769 -5 718 -13 208 -7 862 Adjust. of group value – – – –2 740 2 672 723 468
Assets 159 947 140 255 436 107 369 088
Liabilities -126 604 -129 689 -429 560 -363 264 Acquired surplus value – – 19 759 15 957
Net assets 33 343 10 566 26 306 21 781
Note 30 Receivables from joint ventures
The Group
Accumulated acquisition value
2017-12-31 2016-12-31
At start of the year 150 252 197 583 Additional receivables 33 226 150 252 Regulated receivables – -113 714 Reclassifications 1 921 -101 485 Exchange rate differences for the year – 17 616 185 399 150 252
Accumulated write-downs
At start of the year – -25 058 Reclassifications – 78 752 Write-downs for the year – -48 429 Exchange rate differences for the year – -5 265 – –
Book value at end of period 185 399 150 252
Note 31 Participations in associated companies
2017-12-31 2016-12-31
Indirectly owned Volito Aviation AG, CHE - 111.972.238, Zug, Switzerland 49,0 21 432 –368 952 195 223
Specification of the Parent company’s and Group’s holdings of participations in associated companies 2016-12-31
Joint venture/Corp. ID no., Registered office
Shares /number in %
Equity share’s value in the Group
Book value at Parent company
Directly owned Bulten AB (publ), 556668-2141, Gothenburg 21,9 326 323 195 223
Indirectly owned Nordkap Holding AG, 40,0 0 –CHE - 110.234.439, Zug, Switzerland Volito Aviation AG, CHE - 111.972.238, Zug, Switzerland 49,0 36 232 –362 555 195 223
Below is a specification of the group-wise value relating to the ownership interest in associated companies’ income and expense, as well as assets and liabilities.
Bulten AB (publ) Volito Aviation AG 2017 2016 2017 2016
Income 631 797 591 172 13 626 –Expense -596 475 -558 859 -13 241 –35 322 32 313 385 –
Assets 476 043 430 387 22 553 37 662 Liabilities -161 327 -136 868 -1 121 -1 430 Acquired surplus value 32 804 32 804 – –
Net assets 347 520 326 323 21 432 36 232
Note 32 Receivables from associated companies
2017-12-31 2016-12-31
The Group
Accumulated acquisition value
At start of the year 46 634 44 109 Exchange rate differences for the year -2 528 2 525 44 106 46 634
Accumulated write-downs At start of the year -46 634 -44 109 Exchange rate differences for the year 2 528 -2 525 -44 106 -46 634
Book value at end of period 0 0
The Group
Accumulated acquisition value
At start of the year 362 555 301 541
Purchases – 1 170 Participation in associated companies’ profit for the year 35 707 32 313 Participation in associated companies’ other comprehensive income for the year 5 464 5 607
Reclassifications – 36 232
Exchange rate differences for the year -2 848 –Dividend -32 363 -14 435 Transactions with owners 437 127
Book value at end of period 368 952 362 555
The Parent company
Accumulated acquisition value
At start of the year 195 223 194 053 Purchases – 1 170 195 223 195 223
57
ANNUAL REPORT
Note 33 Holdings in other long-term securities
The Group
Available-for-sale financial assets
Shares and participations
Book value at year-end
2017-12-31 2016-12-31
1 777 676 1 256 845
1 777 676 1 256 845
Changes relating to available-for-sale financial assets for the year
The Group
Accumulated acquisition value
At start of the year 490 873 476 390 Additional assets 564 071 44 239 Divested assets -13 379 -11 789 Reclassifications – -17 967
Changes in value in the income statement
1 041 565 490 873
At start of the year 768 529 641 455
Unrealised changes in value for the year -26 830 131 439 Realised changes in value for profit or loss for the year – -4 365 741 699 768 529
Accumulated write-downs
At start of the year -2 557 -2 358 Write-downs for the year -3 031 -199 -5 588 -2 557
Book value at year-end
1 777 676 1 256 845
2017-12-31 2016-12-31
The Group 2016
Accelerated depreciation
Investment properties
32 694 -32 694
Machinery and inventories 1 340 -1 340
Tax allocation reserves 2 058 -2 058
Fair value
Investment properties – 232 058 -232 058 Swaps – -18 519 18 519
Group-wise surplus value
Buildings and land – 320 -320
Temporary differences – 1 705 -1 705 Other – 776 -776
Deductible deficiency 1 308 – 1 308
Net deferred tax liability 1 308 252 432 -251 124
Deferred Deferred tax assets tax liability Net
The Parent company 2017 Deductible deficiency 2 774 – 2 774
The Parent company 2016 Deductible deficiency – – –
The change in the Parent company between years has been shown as deferred tax expense.
Deferred taxes are valued based on the nominal rate of tax. The only exception to this rule is the acquisition of material assets in which the tax assessment was a significant part of the business transaction when the deferred tax is valued based on the purchase price. All deferred taxes have been valued at a nominal amount as at 31 December 2017 (the same applies for the previous year).
The Parent company
Accumulated acquisition value
At start of the year 481 255 475 390 Additional assets 565 726 17 654 Subtracted assets -13 379 -11 789
Accumulated write-downs
1 033 602 481 255
At start of the year -2 557 -2 358 Write-downs for the year -3 031 -199 -5 588 -2 557
Book value at year-end 1 028 014 478 698
Peab AB (publ) 1 179 020 449 825 1 200 180 442 619
Anticimex AB 500 035 500 035 – –
Sdiptech AB (publ) 18 480 22 400 – –
EQT-fonder 65 076 51 272 37 972 28 564
Avensia AB (publ) 6 481 3 865 7 080 3 865 NAC Luxembourg I S.A. 5 171 – 5 171 –Other 3 413 617 6 442 3 650 1 777 676 1 028 014 1 256 845 478 698
Note
34 Deferred tax assets/tax liability
Deferred Deferred tax assets tax liability Net
Unreported deferred tax assets
Deductible temporary differences and fiscal deductible deficiencies for which deferred tax assets have not been reported in the income statement and balance sheet: 2017-12-31 2016-12-31
Fiscal deficit 8 887 7 785
None of the fiscal deficit relates to Swedish subsidiaries and hence it cannot be offset against profits in other companies by group contributions.
Note 35 Financial leasing agreements
One of the properties in the Volito Fastigheter group is leased out on a financial leasing agreement 2017-12-31 2016-12-31
The Group
Reconciliation of the gross investment and the present value of the receivable relating to future minimum leasing fees:
Gross investment 41 250 43 789 Less: unearned financial income -14 434 -16 013
Net investment in financial leasing agreements 26 816 27 776 Less: non-guaranteed residual value that goes to the lessor – –
Present value of receivable relating to future minimum leasing fees 26 816 27 776
As at 31 December the breakdown of the remaining durations was as follows: Gross investment
The Group 2017
Accelerated depreciation
Investment properties 36 134 -36 134
Machinery and inventories 1 758 -1 758
Tax allocation reserves 1 861 -1 861
Fair value
Investment properties – 273 909 -273 909 Swaps – -15 366 15 366
Group-wise surplus value Buildings and land – 297 -297 Temporary differences – 3 037 -3 037 Other 490 894 -404
Deductible deficiency 4 010 – 4 010
Net deferred tax liability 4 500 302 524 -298 024
Within one year 2 538 2 538 Between one and five years 10 154 10 154 Longer than five years 28 558 31 097 41 250 43 789
Less: unearned financial income -14 434 -16 013
Net investment in financial leasing agreements 26 816 27 776 Present value of receivable relating to future minimum leasing fees
Within one year 1 017 960 Between one and five years 4 394 3 241 Longer than five years 21 405 23 575 26 816 27 776
Variable component of leasing fee included in profit or loss for the period 121 100 Variable fees change in accordance with CPI according to the rental agreement.
58
2017-12-31 2016-12-31 The Parent The Parent List of securities The Group company The Group company
Note 36 Other long-term receivables
The Group and Parent company
Accumulated acquisition value
2017-12-31 2016-12-31
At start of the year 15 791 15 791
Regulated receivables -15 434 –357 15 791
Accumulated write-downs
At start of the year -13 792 -13 792 Reversed write-downs for the year 13 435 –-357 -13 792
Book value at year-end – 1 999
Note 37 Prepaid expenses and accrued income
The Group
2017-12-31 2016-12-31
Prepaid expenses 6 856 6 517
Borrowing allocation costs 1 289 2 177 Accrued income 1 130 8 146 8 824
The Parent company
Prepaid expenses 1 411 1 040 Accrued income 1 37 1 412 1 077
Note 38 Liquid funds
Liquid funds consist of cash and bank balances. Unutilised bank overdraft facilities that are not included in liquid funds amount to SEK 120.6 million (101,9), of which in the Parent company, SEK 120.6 million (101.9).
Note 39 Equity
Number of issued shares
Fully paid Not fully paid Quota value
Class B shares 2 440 000 – 100
All shares have the same voting rights, one vote per share.
Other contributed capital Refers to equity that is contributed by the owners. This includes premiums paid in connection with share issues.
Reserves
Foreign exchange reserve
The foreign exchange reserve includes all the exchange rate differences that arise from translating financial statements in a currency other than the currency used to present the consolidated financial statements. The Parent company and the Group present their financial statements in SEK. Furthermore, the foreign exchange reserve includes the exchange rate differences that arise in expanded investment in foreign businesses as well as re-loans from foreign businesses.
Available-for-sale reserve
The available-for-sale reserve includes the accumulated net change in fair value after tax of available-for-sale financial assets until the asset is no longer reported in the balance sheet.
Retained earnings including profit or loss for the year
Retained earnings including profit or loss for the year includes profits from the Parent company and its subsidiaries, joint ventures and associated companies.
The Parent company Reserve fund
The aim of the reserve fund has been to save a part of the net profit that is not designated for covering losses carried forward. The reserve fund also includes amounts that prior to 1 January 2006 were transferred to the premium reserve. The reserve is not to be reduced through paying a dividend.
Retained earnings
Includes the previous year’s profit or loss brought forward after paying a dividend. Constitutes together with profit or loss for the year the total non-restricted equity, i.e. the amount that is available for dividends to shareholders.
Proposed allocation of the company’s profit
The Board of Directors and CEO propose that the unappropriated earnings, SEK 468 094 340.47 are allocated as follows (SEK K):
Dividend, [2 440 000 * SEK 14.85 per share] 36 234
Retained earnings carried forward 431 860 468 094
Information on allocation of profit
The Group’s equity has been calculated in accordance with the EU-developed IFRS standards and interpretations of these (IFRIC), and in accordance with Swedish law through the application of the Swedish Financial Accounting Standards Council reporting recommendation RFR 1 Supplementary reporting rules for groups.
The Parent company’s equity has been calculated in accordance with Swedish law through the application of the Swedish Financial Accounting Standards Council reporting recommendation RFR 2 Reporting for legal entities. The proposed dividend reduces the Parent company’s equity ratio from 42 % to 40 %. The equity ratio is prudent, in view of the fact that the company’s activities continue to operate profitably. Liquidity in the Group is expected to be maintained at a similarly stable level.
The Board’s understanding is that the proposed dividend will not hinder the company from carrying out its obligations in the short or long term, nor from conducting necessary investments. The proposed dividend is thus defensible with consideration to what is stated in ABL chapter 17, section 3, paragraph 2-3 (prudence principle).
Note 40 Interest-bearing liabilities
The Group
2017-12-31 2016-12-31
Due date, up to 1 year from accounting year-end 44 068 59 845 Due date, 1-5 years from accounting year-end 2 752 130 1 968 963 Due date, more than five years from accounting year-end 52 386 42 093 2 848 584 2 070 901
The Parent group
Due date, up to 1 year from accounting year-end 29 376 48 051 Due date, 1-5 years from accounting year-end 970 000 470 000 999 376 518 051
2017-12-31 2016-12-31
Long-term liabilities
The Group Bank loans 2 739 797 1 918 908 Derivative instruments 69 845 84 177 Leasing liabilities 9 566 7 971 2 819 208 2 011 056
The Parent company Bank loans 970 000 470 000
2017-12-31 2016-12-31
Short-term liabilities
The Group
Bank loans 13 210 10 364 Bank overdraft facilities 29 376 48 051 Derivative instruments 52 –Leasing liabilities 1 430 1 430 44 068 59 845
2017-12-31 2016-12-31
The Parent company Bank overdraft facilities 29 376 48 051 29 376 48 051
2017-12-31 2016-12-31
The Group
Borrowings at the start of the year 2 070 901 1 893 195
Additional borrowings 821 600 1 957 402
Regulated borrowings -11 075 -1 785 233
Change in bank overdraft facilities -18 675 –Change in leasing liabilities 165 2 292 Change in value of derivatives -14 332 2 891 Translation differences – 354 2 848 584 2 070 901
The Parent company
Borrowings at the start of the year 518 051 460 879 Additional borrowings 500 000 512 118 Regulated borrowings -23 845 -498 681 Change in Group account 5 170 43 735 999 376 518 051
The Group’s derivative instruments consist of interest rate swaps, which are utilised to cover risks of changes in interest rates. Derivative instruments are reported continuously at fair value in accordance with IAS 39. Changes in value of interest rate derivatives are reported in the income statement on a separate line “Changes in value of derivatives.” The change in value for the year amounts to SEK 14.3 million (-2.9).
2017-12-31 2016-12-31
Value of swaps IFRS 7, level 2
Brought forward fair value, liability 84 177 81 286 Change in value -14 332 2 891 69 845 84 177
Note 41 Bank overdraft facilities
The Group and Parent company
2017-12-31 2016-12-31
Granted credit limit 150 000 150 000 Unutilised part -120 624 -101 949
Utilised credit amount 29 376 48 051
59
ANNUAL REPORT
Note 42 Valuation of financial assets and liabilities at fair value
In accordance with IAS 39 Financial instruments, financial instruments are valued at either the accrued acquisition value or at fair value depending on categorisation. Categorisation depends to a large extent on the purpose of the holding. The items that are subject to measurement at fair value are listed shareholdings, various types of derivative instruments and unlisted ownership interests.
Fair value of listed shareholdings and share derivatives has been calculated according to the closing rate at year-end. In the fair value measurement of unlisted shares, the market value from the administering financial institution has been used. This valuation is based on an active market and the rates reflect actual transactions concerning comparable investments in equivalent funds.
In the measurement of fair value for interest-bearing receivables and liabilities, as well as interest rate swaps, discounting has been applied for future cash flows at the quoted market interest rate for the remaining durations. This is based on the quotes of brokers. Similar contracts are handled in an active market and the rates reflect actual transactions involving comparable instruments. For non-interest bearing assets and liability items such as accounts receivable – trade and accounts payable – trade with a remaining life time of less than six months, the book value is considered to reflect the fair value. The table below shows the book value compared with the assessed fair value per type of financial asset and liability.
Financial assets measured at fair value via income statement
Available-for-sale financial assets Trade and interest receivables Total book value Fair value Amounts in SEK M 2017 2016 2017 2016 2017 2016 2017 2016 2017 2016
The Group
Financial assets
Other long-term securities holdings – – 1 777,7 1 256,8 – – 1 777,7 1 256,8 1 777,7 1 256,8
Interest-bearing long-term receivables – – – – 185,4 150,3 185,4 150,3 185,4 150,3 Other long-term receivables – – – – 25,8 28,8 25,8 28,8 25,8 28,8
Accounts receivable – trade – – – – 38,5 49,0 38,5 49,0 38,5 49,0
Interest-bearing short-term receivables – – – – 4,0 12,0 4,0 12,0 4,0 12,0 Prepaid expenses and accrued income – – – – – 0,1 – 0,1 – 0,1 Other short-term receivables – – – – 5,9 6,2 5,9 6,2 5,9 6,2 Short-term investments – – – 18,1 – – – 18,1 – 18,1 Cash and bank balances – – – – 6,4 6,7 6,4 6,7 6,4 6,7
Total financial assets 0,0 0,0 1 777,7 1 274,9 266,0 253,1 2 043,7 1 528,0 2 043,7 1 528,0
Financial
Amounts in SEK M 2017 2016 2017 2016 2017 2016 2017 2016 2017 2016
Financial liabilities
Interest-bearing financial liabilities 69,8 84,2 2 734,7 1 926,9 – – 2 804,5 2 011,1 2 804,5 2 011,1 Other long-term liabilities – – 5,0 5,0 – – 5,0 5,0 5,0 5,0 Interest-bearing short-term liabilities 0,1 – 44,0 59,9 – – 44,1 59,9 44,1 59,9 Accounts payable – trade – – – – 42,2 39,0 42,2 39,0 42,2 39,0 Accrued expenses and deferred income – – – – 31,4 28,4 31,4 28,4 31,4 28,4 Other short-term liabilities – – – – 9,1 23,9 9,1 23,9 9,1 23,9
Total financial liabilities 69,9 84,2 2 783,7 1 991,8 82,7 91,3 2 936,3 2 167,3 2 936,3 2 167,3
The effect of measuring financial instruments at fair value is included in the Groups’ profit or loss with a total of SEK 14.3 million (-2.9) and relates to the market valuation of interest rate swaps. Financial assets measured at fair value via income statement Available-for-sale financial assets Trade and interest receivables Total book value Fair value Amounts in SEK M 2017 2016 2017 2016 2017 2016 2017 2016 2017 2016
The Parent Company
Financial assets Interest-bearing long-term receivables, subsidiaries – – – – 108,0 108,0 108,0 108,0 108,0 108,0 Other long-term securities holdings – – 1 028,0 478,7 – – 1 028,0 478,7 1 769,7 1 247,2 Other long-term receivables – – – – – 2,0 – 2,0 – 2,0 Accounts receivable – trade – – – – 0,7 – 0,7 – 0,7 –Interest-bearing short-term receivables – – – – 50,1 47,4 50,1 47,4 50,1 47,4 Other short-term receivables – – – – 2,6 6,0 2,6 6,0 2,6 6,0 Short-term investments – – – – – 15,4 – 15,4 – 18,1 Cash and bank balances – – – – 0,2 0,3 0,2 0,3 0,2 0,3 Total financial assets 0,0 0,0 1 028,0 478,7 161,6 179,1 1 189,6 657,8 1 931,3 1 429,0
Financial liabilities
The Parent company
Financial liabilities
Interest-bearing financial liabilities – – 970,0 470,0 – – 970,0 470,0 970,0 470,0 Interest-bearing short-term liabilities – – 29,4 48,1 – 5,2 29,4 53,3 29,4 53,3 Accounts payable – trade – – – – 1,5 1,1 1,5 1,1 1,5 1,1 Accrued expenses and deferred income – – – – 5,9 4,3 5,9 4,3 5,9 4,3 Other short-term liabilities – – – – 22,0 37,4 22,0 37,4 22,0 37,4 Total financial liabilities 0,0 0,0 999,4 518,1 29,4 48,0 1 028,8 566,1 1 028,8 566,1
60
liabilities measured at fair value via income statement Other financial liabilities Accounts payable – trade and other liabilities Total book value Fair value
measured at fair value via income statement Other financial liabilities Accounts payable – trade and other liabilities Total book value Fair value Amounts in SEK M 2017 2016 2017 2016 2017 2016 2017 2016 2017 2016
Fair value
Fair value is determined though categorisation based on three levels.
Level 1: according to the quoted price in an active market for an identical instrument.
Level 2: based on direct or indirect observable market data that is not included in level 1.
Level 3: based on input data that is not observable in the market.
The table below shows the division by level of the financial assets and liabilities that are reported at fair value in the balance sheet.
Level 1 Level 2 Level 3 Total
Amounts in SEK M 2017 2016 2017 2016 2017 2016 2017 2016
The Group Financial assets
Other long-term securities holdings
Market-quoted 1 704,0 1 207,2 – – – – 1 704,0 1 207,2
Fund holdings – – 70,6 43,5 – – 70,6 43,5
Other short-term securities holdings
Short-term investments – 18,1 – – – – – 18,1
Total financial assets 1 704,0 1 225,3 70,6 43,5 0,0 0,0 1 774,6 1 268,8
Financial liabilities
Other long-term liab.
Interest rate swaps – – 69,8 84,2 – – 69,8 84,2
Other short-term liab.
Interest rate swaps – – 0,1 – – – 0,1 –
Total financial liabilities 0,0 0,0 69,9 84,2 0,0 0,0 69,9 84,2
Note 43 Financial instruments and financial risk management
Framework for financial risk management
In its business activities the Volito Group is exposed to various types of financial risks. Financial risks relate to changes in exchange rates and interest rates that affect the company’s cash flow, earnings and thereby associated equity. Financial risks also include credit and refinancing risks.
The Group’s finance policy for managing financial risks has been designed by the Board and creates a framework of guidelines and rules in the form of risk mandates and limits for the business. Responsibility for the Group’s financial transactions and risks are managed centrally by the Group’s Finance function, which is within the Parent company. The overall aim for the Finance function is to provide cost-efficient financing and to minimise negative effects on the Group’s earnings that stem from market risks. Reporting is conducted on a regular basis to the CEO and the Board, which have overall responsibility for financial risk management.
Management of financial risks
Liquidity and financing risks
Liquidity and financing risks refer to the risks of not being able to fulfil payment obligations as a result of insufficient liquidity or difficulties in arranging new loans. Volito shall be able to carry through business transactions when the opportunity arises and always be able to fulfil its obligations. Refinancing risks increase if the company’s credit rating deteriorates or a large part of the debt portfolio becomes due on one or several separate occasions.
Liquidity risks are managed through both regular liquidity forecasts and Volito’s access to credit or liquid assets that can be raised at short notice in order to even out fluctuations in the payment flow.
Borrowing risks refer to risks that financing is unavailable or available on poor conditions at a certain time. In order to limit financing risks, Volito strives to spread final due dates regarding credit over as long a period as possible according to the prevailing market conditions.
Part of Volito’s borrowing is linked to fulfilling financial ratios (covenants) in the form of interest coverage ratio and equity ratio, which is customary for this type of borrowing. These ratios are followed up continuously and make up a part of the management’s framework for financial planning of the business. Volito fulfilled these ratios by a good margin at year-end. Volito’s policy regarding borrowing is that the due dates for loans shall be spread over time. Volito’s policy regarding interest rates is that loan periods for the portfolio shall be well balanced and adjusted to the company’s current view of the interest rate market at any given time.
Duration analysis of financial liabilities, non-discounted cash flow including interest
2017-12-31
Interest-bearing financial liabilities
Nominal amount in original currency 1 year or less 1–5 years >5 years Total
Bank loans, SEK, Real Estate 1 774 797 39 013 1 754 931 12 976 1 806 920
Derivatives 24 444 86 382 34 662 145 488
Investment loans, SEK 970 000 18 004 996 107 – 1 014 111
Leasing liabilities 9 566 1 430 8 136 – 9 566 Bank overdraft facilities, SEK 29 376 32 062 – – 32 062
Total interest-bearing financial liabilities 114 953 2 845 556 47 638 3 008 147
Non-interest-bearing financial liabilities
Accounts payable – trade, SEK 37 740 37 740 – – 37 740
Accounts payable – trade, EURO 447 4 403 – – 4 403
Accounts payable – trade, NOK 37 37 – – 37
Other short-term liabilities 9 094 9 094 – – 9 094
Total non-interest-bearing financial liabilities 51 274 – – 51 274
Total financial liabilities 166 227 2 845 556 47 638 3 059 421
2016-12-31
Nominal amount in original currency 1 year or less 1–5 years >5 years Total
Interest-bearing financial liabilities Bank loans, SEK, Real Estate 1 456 253 27 870 1 458 719 14 120 1 500 709
Derivatives 27 669 77 640 11 476 116 785
Investment loans, SEK 470 000 7 863 481 783 – 489 646
Leasing liabilities – 1 430 7 971 – 9 401 Bank overdraft facilities, SEK 48 051 49 616 – – 49 616
Total interest-bearing financial liabilities 114 448 2 026 113 25 596 2 166 157
Non-interest-bearing financial liabilities
Accounts payable – trade, SEK 35 034 35 034 – – 35 034 Accounts payable – trade, EURO 390 3 731 – – 3 731 Accounts payable – trade, NOK 220 232 – – 232 Other short-term liabilities 23 977 23 977 – – 23 977
Total non-interest-bearing financial liabilities 62 974 – – 62 974
Total financial liabilities 177 422 2 026 113 25 596 2 229 131
Currency exposure
The risk that fair value and cash flow relating to financial instruments can fluctuate when the value of foreign currencies change is called currency risk.
The Volito Group’s exposure to foreign currencies has been drastically reduced in connection with the winding up of the Volito Aviation group, which was exposed mainly to USD, and the winding up of Nordkap AG, which was exposed to changes in CHF. In addition, the Volito Group also has exposure to changes in EURO and NOK through its holdings in Hydrosystem Oy and Hydpartner AS.
The Board of Volito has decided to accept the exposure to the above-mentioned currencies, as this exposure in itself constitutes a risk diversification within the Volito Group. The extent of this exposure will be decided according to continuous review.
61
ANNUAL REPORT
Interest rate exposure
Interest rate risks are risks that Volito’s cash flow or the value of financial instruments vary due to changes in market interest rates. The interest rate risk can lead to changes in fair value and changes in the cash flow.
The Volito Group is exposed to changes mainly in short-term interest rates through its involvement in the Volito Fastigheter group. The Parent company, Volito AB, also has risk exposure relating to short-term interest rates. Volito’s policy regarding interest rates is that loan periods for the portfolio shall be well balanced and adjusted to the company’s current view of the interest rate market at any given time. How much and how fast a change in interest rates makes an impact on financial results depends on the chosen fixed interest term. A rise in interest rates is often initiated by higher inflation. In commercial rental contracts it is normal that the rent is index-adjusted upwards for inflation.
A combination of loans with short fixed interest terms and utilisation of financial instruments in the form of interest rate swaps enables flexibility to be achieved and the fixed interest term and interest rate level can be adjusted so that the aim of financing activities can be achieved with limited interest rate risk and without underlying loans needing to be renegotiated. In order to manage the interest rate risks and achieve even development of net interest income, the average fixed interest term for Volito’s interest bearing liabilities has been adjusted according to the assessed risk level and risk expectations.
Overall, the Volito Group’s total loans exposed to short-term interest rates amount to SEK 1 706.2 million (1 064.3). Hedging relating to 60.1 % (62.6) of the debt portfolio of the Volito Fastigheter group, corresponding to 38.4 % (46.2) of the entire Volito Group, is managed with swaps, something that gives the company a higher degree of flexibility in terms of future debt management.
The nominal amount of Volito Fastigheter’s outstanding interest rate swaps at year-end 2017 was SEK 1 063.0 million (913.0). At year-end 2017, the fixed interest rates varied from -0.18 % (-0.18 %) to 3.45 % (3.56 %) and the floating interest rates are STIBOR 3-months with a supplement for a margin relating to borrowing in SEK.
Financial exposure 2017-12-31 2016-12-31
Liabilities Loan amount Fair value Loan amount Fair value
The Group Interest rate swaps 1 063 000 -69 845 913 000 -84 177
Fair value has been calculated as the cost /revenue that would have arisen if the contracts had closed at year-end. For this, banks’ official rates have been applied.
Below is a summary of the Group’s interest rate swaps by duration Due date
Liabilities Nom. amount 2018 2019 2020 2021 2022 >2023
The Group Interest rate swaps 2017-12-31 1 063 000 14 000 80 000 80 000 231 000 140 000 518 000 Interest rate swaps 2016-12-31 913 000 – 96 000 162 000 162 000 162 000 331 000
Credit risks
Credit risks refer to the risk of losing money due to another party being unable to fulfil their obligations.
Credit risks in accounts receivable – trade Demand for premises is affected by general business conditions. Volito Fastigheter’s activities are concentrated in Malmö, which is deemed to be attractive in the long term regarding location, population growth, employment and general communications. A broad portfolio of contracts reduces the risk of large fluctuations in vacancies. Leases are divided between commercial properties (97 %) and residential (3 %). The commercial rental income is divided between 163 contracts within a number of different sectors. A combination of good local knowledge, active involvement and a high level of service creates conditions for long-term rental relations and thereby a reduced risk of new vacancies. A certain level of vacancies provides opportunities in the form of new leases and flexibility for existing tenants who want to expand or reduce their premises. Furthermore, Volito Fastigheter bears the risk that tenants are unable to make rent payments. Regular follow-ups are carried out on the tenants’ credit ratings in order to reduce exposure to credit losses. A credit assessment of tenants is carried out for all new leases, and, if required, the rental agreement is supplemented with personal guarantees, rent deposit or bank guarantee. All rents are paid quarterly or monthly in advance.
Within Volito Industry, risks are linked to project management. Many projects are customised and Volito bears the risk that customers cannot fulfil their obligations. Customers make advance payments on major projects in order to reduce the risk of credit losses.
Distribution of overdue accounts receivable – trade 2017-12-31 2016-12-31
The Group
Accounts receivable – trade, that are neither overdue or written-down 34 933 44 833
Accounts receivable – trade that are overdue
1–30 days 2 932 3 630
31–60 days 208 356
61–90 days 33 77
>90 days 564 264
Of which, reserved (excluding VAT) -215 -198
Total 38 455 48 962
The total cost for confirmed and suspected customer losses for the year amounted to SEK 142 K (80).
Offsetting agreements and similar agreements
The Group has entered into a derivative agreement under the International Swaps and Derivatives Association (ISDA) master netting agreement. The agreement means that when a counterparty cannot regulate their obligation according to all transactions, the agreement is broken and all outstanding balances shall be regulated with a net amount.
The ISDA agreement does not fulfil the criteria for offsetting in the statement of financial position. This is because offsetting in accordance with the ISDA agreement is only permitted if the counterparty or group cannot regulate their obligations. In addition, it is not the counterparty or the group’s intention to regulate the balances on a net basis or at the same juncture.
The company has not offset any amounts in the balance sheet relating to 2017 or 2016.
Note 44 Accrued expenses and prepaid income
2017-12-31 2016-12-31
The Group
Personnel-related items 24 165 20 098
Prepaid rental income 27 358 23 947
Accrued interest expenses 697 554
Provision for repair costs relating to acquisitions 4 500 4 500 Other accrued expenses 6 573 7 791 63 293 56 890
The Parent company
Personnel-related items 3 565 2 962 Accrued interest expenses 103 22 Other accrued expenses 2 241 1 357 5 909 4 341
Note 45 Pledged assets and contingent liabilities
2017-12-31 2016-12-31
The Group Pledged assets
For own liabilities and provisions
Property mortgages 1 813 859 1 549 899
Chattel mortgages 12 500 12 500 Shares 1 724 145 1 551 730 Shares in subsidiaries 1 364 743 1 195 278 Leasehold Mosippan 26 816 27 776 Blocked bank account – 175 Other 1 000 1 000
Total pledged assets 4 943 063 4 338 358
Contingent liabilities Guarantees for joint ventures 250 000 175 000 Guarantees for associated companies – 14 000 Other guarantees – 1 390 Other contingent liabilities – 50
Total contingent liabilities 250 000 190 440
2017-12-31 2016-12-31
The Parent company
Pledged assets
For own liabilities and provisions Shares 645 048 615 907 Shares in subsidiaries 312 014 312 014 Other 1 000 1 000
Total pledged assets 958 062 928 921
Contingent liabilities Guarantees for jointly controlled companies 250 000 175 000 Guarantees for associated companies – 14 000 Other guarantees – 1 390 Other contingent liabilities – 50
Total contingent liabilities 250 000 190 440
Note 46 Closely-related parties
Close relations
The Group is owned by AB Axel Granlund, 88.0 % (88.0 %), and Lennart Blecher (partly through companies), 12.0 %. As a result of this, transactions with the companies listed below are noted as transactions with closely-related parties.
Peab AB (publ)
Karl Axel Granlund is a Board member of Peab AB (publ). Volito AB owns 5.64 % of the capital and 4.99 % of the votes in Peab AB (publ).
Bulten AB (publ)
Ulf Liljedahl is a Board member of Bulten AB (publ). Volito AB owns 21.86 % of the capital and votes in Bulten AB (publ).
62
2017 2016
Lennart Blecher is a partner in EQT.
Sunnerbo Skogar AB
Karl Axel Granlund and family own shares in Sunnerbo Skogar. Purchases and sales have only been made for minor amounts.
Granlunden AB
Karl Axel Granlund and family own shares in Granlunden AB. A purchase has been made worth SEK 1.3 million (0.3).
Joint ventures/associated companies
In addition to the closely-related parties stated above, the Group has close relations with its joint ventures/associated companies, see Notes 29 and 31.
Subsidiaries
In addition to the closely-related parties stated for the Group, the Parent company has close relations that involve a controlling interest in its subsidiaries, see Note 27.
Of the Group’s total purchases and sales measured in SEK, 0 % (0 %) of purchases and 1 % (1 %) of sales relate to other companies within the entire group of companies to which the Group belongs.
Of the Parent company’s total purchases and sales in SEK, 48 % (42 %) of the purchases and 97 % (97 %) of the sales relate to other companies within the entire group of companies to which the company belongs.
Transaction conditions
Sales between the Group’s different segments relate to administration fees and rents. Administration fees have been set on the basis of actual costs and utilisation. Rents are according to market conditions.
Loans between group companies have interest rates set in accordance with the current finance policy. Interest rates are according to market conditions.
Summary of transactions with closely-related parties
The Group
Transactions with the Parent company
2017 2016
Sales to the Parent company 2 885 2 673 Purchases from the Parent company -4 976 -3 196 Interest income from the Parent company 118 45 Receivable from the Parent company 3 101 12 000 Liabilities to the Parent company 117 68 Dividend to the Parent company 28 987 25 766
2017 2016
The Parent company
Transactions with subsidiaries
Sales to subsidiaries 4 788 5 000
Purchases from subsidiaries -2 258 -2 198
Interest income from subsidiaries 2 348 1 690
Guarantee-related income 1 601 846 Interest expenses to subsidiaries -138 -238 Receivable from subsidiaries 156 742 148 228 Liabilities to subsidiaries 21 739 42 303 Dividend from subsidiaries 35 300 18 000
2017 2016
The Parent company
Transactions with associated companies Dividend from Bulten AB (publ) 20 025 14 435
2017 2016
The Parent company
Transactions with Peab AB (publ) Dividend from Peab 59 760 43 160
The Group and Parent company
Transactions with EQT
Volito AB has holdings in seven (previous year three) of EQT’s funds. For all funds there is co-investment agreement with AB Axel Granlund and/or Granlunden AB. During the year, capital placed in these funds amounted to SEK 36.1 million. The group’s participation in the realised profit amounted to SEK 8.0 million. The group-wide value of the holding in these funds at year-end 2017 was estimated at SEK 65.1 million (38.0) whereas the book value at the Parent company amounted to SEK 51.3 million (28.6).
Transactions with key employees
For salaries and other remuneration, expenses and obligations concerning pensions and similar benefits, and agreements concerning severance payments to the Board and the CEO, see Note 7.
Note 47 Events after accounting year-end
In early 2018, Volito Fastigheter acquired the Elefanten 41 property and thereby further increased its presence in the housing market. The property is solely for residential purposes and has 94 apartments.
The Board of Volito Industri AB has appointed Johan Frithiof as the new CEO of Volito Automation AB. Johan takes over the position on 1 March 2018 and replaces Thomas Larsson, who is leaving the Volito Group.
The Group
Transactions with joint ventures
Sales to VGS Aircraft Holding (Ireland) Ltd – 11 242 Sales to Barabolagen 935 523 Interest income from Point Hyllie 1 923 1 093 Receivable from Point Hyllie 185 399 150 252
2017 2016
Otherwise, there have been no important events after accounting year-end.
Note 48 Information about the Parent company
Volito AB is a Swedish-registered limited company with registered office in Malmö. The address of the registered office is Skeppsbron 3, 211 20 Malmö.
The Group
Transactions with associated companies Dividend from assoc. company Bulten AB (publ) 20 025 14 435 Receivable from Volito Aviation AG 36 174
2017 2016
The consolidated financial statements for 2017 consist of Volito AB and its subsidiaries, together referred to as the Group. The Group also includes an owned share of holdings in associated companies and joint ventures.
The company is a subsidiary of AB Axel Granlund, org.no. 556409-6013 with registered office in Malmö. AB Axel Granlund owns 88.0 % (88.0 %) of the capital and votes in the Volito Group and draws up consolidated financial statements for the largest group.
The Group
Transactions with Peab AB (publ)
Sales to Peab 134 720 Purchases from Peab -11 909 -28 003 Dividend from Peab 59 760 43 160
Operating liabilities to Peab 5 657 3 053 Loan from Peab 5 000 5 000
Our auditors’ report was submitted on 5 April 2018
KPMG AB
Eva Melzig Authorized Public Accountant
The Group’s income statement and balance sheet, as well as the Parent company’s income statement and balance sheet, will be submitted for adoption at the Annual General Meeting on 5 april 2018.
63 EQT
Malmö 15 March 2018
Karl-Axel Granlund Chairman
Lennart Blecher Axel Granlund Peter Granlund
Karl-Fredrik Granlund Ulf Liljedahl CEO
ANNUAL REPORT
AUDITOR´S REPORT
To the general meeting of the shareholders of Voilto AB, corp. id 556557-4639
REPORT ON THE ANNUAL ACCOUNTS AND CONSOLIDATED ACCOUNTS Opinions
We have audited the annual accounts and consolidated accounts of Voilto AB for the year 2017. The annual accounts and consolidated accounts of the company are included on pages 31-63 in this document.
In our opinion, the annual accounts have been prepared in accordance with the Annual Accounts Act, and present fairly, in all material respects, the financial position of the parent company as of 31 December 2017 and its financial performance and cash flow for the year then ended in accordance with the Annual Accounts Act. The consolidated accounts have been prepared in accordance with the Annual Accounts Act and present fairly, in all material respects, the financial position of the group as of 31 December 2017 and their financial performance and cash flow for the year then ended in accordance with International Financial Reporting Standards (IFRS), as adopted by the EU, and the Annual Accounts Act. The statutory administration report is consistent with the other parts of the annual accounts and consolidated accounts.
We therefore recommend that the general meeting of shareholders adopts the income statement and balance sheet for the parent company and the statement of comprehensive income and statement of financial position for the group.
Basis for Opinions
We conducted our audit in accordance with International Standards on Auditing (ISA) and generally accepted auditing standards in Sweden. Our responsibilities under those standards are further described in the Auditor’s Responsibilities section. We are independent of the parent company and the group in accordance with professional ethics for accountants in Sweden and have otherwise fulfilled our ethical responsibilities in accordance with these requirements.
We believe that the audit evidence we have obtained is sufficient and appropriate to provide a basis for our opinions.
Other Information than the annual accounts and consolidated accounts
This document also contains other information than the annual accounts and consolidated accounts and is found on pages 3-30. The Board of Directors and the Managing Director] are responsible for this other information.
Our opinion on the annual accounts and consolidated accounts does not cover this other information and we do not express any form of assurance conclusion regarding this other information.
In connection with our audit of the annual accounts and consolidated accounts, our responsibility is to read the information identified above and consider whether the information is materially inconsistent with the annual accounts and consolidated accounts. In this procedure we also take into account our knowledge otherwise obtained in the audit and assess whether the information otherwise appears to be materially misstated.
If we, based on the work performed concerning this information, conclude that there is a material misstatement of this other information, we are required to report that fact. We have nothing to report in this regard.
Responsibilities of the Board of Directors and the Managing Director
The Board of Directors and the Managing Director are responsible for the preparation of the annual accounts and consolidated accounts and that they give a fair presentation in accordance with the Annual Accounts Act and, concerning the consolidated accounts, in accordance with IFRS as adopted by the EU. The Board of Directors and the Managing Director are also responsible for such internal control as they determine is necessary to enable the preparation of annual accounts and consolidated accounts that are free from material misstatement, whether due to fraud or error.
In preparing the annual accounts and consolidated accounts The Board of Directors and the Managing Director are responsible for the assessment of the company’s and the group’s ability to continue as a going concern. They disclose, as applicable, matters related to going concern and using the going concern basis of accounting. The going concern basis of accounting is however not applied if the Board of Directors and the Managing Director intend to liquidate the company, to cease operations, or has no realistic alternative but to do so.
Auditor’s responsibility
Our objectives are to obtain reasonable assurance about whether the annual accounts and consolidated accounts as a whole are free from material misstatement, whether due to fraud or error, and to issue an auditor’s report that includes our opinions. Reasonable assurance is a high level of assurance, but is not a guarantee that an audit conducted in accordance with ISAs and generally accepted auditing standards in Sweden will always detect a material misstatement when it exists. Misstatements can arise from fraud or error and are considered material if, individually or in the aggregate, they could reasonably be expected to influence the economic decisions of users taken on the basis of these annual accounts and consolidated accounts.
As part of an audit in accordance with ISAs, we exercise professional judgment and maintain professional skepticism throughout the audit. We also:
• Identify and assess the risks of material misstatement of the annual accounts and consolidated accounts, whether due to fraud or error, design and perform audit procedures responsive to those risks, and obtain audit evidence that is sufficient and appropriate to provide a basis for our opinions. The risk of not detecting a material misstatement resulting from fraud is higher than for one resulting from error, as fraud may involve collusion, forgery, intentional omissions, misrepresentations, or the override of internal control.
• Obtain an understanding of the company’s internal control relevant to our audit in order to design audit procedures that are appropriate in the circumstances, but not for the purpose of expressing an opinion on the effectiveness of the company’s internal control.
• Evaluate the appropriateness of accounting policies used and the reasonableness of accounting estimates and related disclosures made by the Board of Directors and the Managing Director.
• Conclude on the appropriateness of the Board of Directors’ and the Managing Director’s, use of the going concern basis of accounting in preparing the annual accounts and consolidated accounts. We also draw a conclusion, based on the audit evidence obtained, as to whether any material uncertainty exists related to events or conditions that may cast significant doubt on the company’s and the group’s ability to continue as a going concern. If we conclude that a material uncertainty exists, we are required to draw attention in our auditor’s report to the related disclosures in the annual accounts and consolidated accounts or, if such disclosures are inadequate, to modify our opinion about the annual accounts and consolidated accounts. Our conclusions are based on the audit evidence obtained up to the date of our auditor’s report. However, future events or conditions may cause a company and a group to cease to continue as a going concern.
• Evaluate the overall presentation, structure and content of the annual accounts and consolidated accounts, including the disclosures, and whether the annual accounts and consolidated accounts represent the underlying transactions and events in a manner that achieves fair presentation.
• Obtain sufficient and appropriate audit evidence regarding the financial information of the entities or business activities within the group to express an opinion on the consolidated accounts. We are responsible for the direction, supervision and performance of the group audit. We remain solely responsible for our opinions.
We must inform the Board of Directors of, among other matters, the planned scope and timing of the audit. We must also inform of significant audit findings during our audit, including any significant deficiencies in internal control that we identified.
64
REPORT ON OTHER LEGAL AND REGULATORY REQUIREMENTS Opinions
In addition to our audit of the annual accounts and consolidated accounts, we have also audited the administration of the Board of Directors and the Managing Director of Voilto AB for the year 2017 and the proposed appropriations of the company’s profit or loss.
We recommend to the general meeting of shareholders that the profit be appropriated in accordance with the proposal in the statutory administration report and that the members of the Board of Directors and the Managing Director be discharged from liability for the financial year.
Basis for Opinions
We conducted the audit in accordance with generally accepted auditing standards in Sweden. Our responsibilities under those standards are further described in the Auditor’s Responsibilities section. We are independent of the parent company and the group in accordance with professional ethics for accountants in Sweden and have otherwise fulfilled our ethical responsibilities in accordance with these requirements.
We believe that the audit evidence we have obtained is sufficient and appropriate to provide a basis for our opinions.
Responsibilities of the Board of Directors and the Managing Director
The Board of Directors is responsible for the proposal for appropriations of the company’s profit or loss. At the proposal of a dividend, this includes an assessment of whether the dividend is justifiable considering the requirements which the company’s and the group’s type of operations, size and risks place on the size of the parent company’s and the group’s equity, consolidation requirements, liquidity and position in general.
The Board of Directors is responsible for the company’s organization and the administration of the company’s affairs. This includes among other things continuous assessment of the company’s and the group’s financial situation and ensuring that the company’s organization is designed so that the accounting, management of assets and the company’s financial affairs otherwise are controlled in a reassuring manner.
The Managing Director shall manage the ongoing administration according to the Board of Directors’ guidelines and instructions and among other matters take measures that are necessary to fulfill the company’s accounting in accordance with law and handle the management of assets in a reassuring manner.
Auditor’s responsibility
Our objective concerning the audit of the administration, and thereby our opinion about discharge from liability, is to obtain audit evidence to assess with a reasonable degree of assurance whether any member of the Board of Directors or the Managing Director in any material respect:
• has undertaken any action or been guilty of any omission which can give rise to liability to the company, or in any other way has acted in contravention of the Companies Act, the Annual Accounts Act or the Articles of Association.
• Our objective concerning the audit of the proposed appropriations of the company’s profit or loss, and thereby our opinion about this, is to assess with reasonable degree of assurance whether the proposal is in accordance with the Companies Act.
Reasonable assurance is a high level of assurance, but is not a guarantee that an audit conducted in accordance with generally accepted auditing standards in Sweden will always detect actions or omissions that can give rise to liability to the company, or that the proposed appropriations of the company’s profit or loss are not in accordance with the Companies Act.
As part of an audit in accordance with generally accepted auditing standards in Sweden, we exercise professional judgment and maintain professional skepticism throughout the audit. The examination of the administration and the proposed appropriations of the company’s profit or loss is based primarily on the audit of the accounts. Additional audit procedures performed are based on our professional judgment with starting point in risk and materiality. This means that we focus the examination on such actions, areas and relationships that are material for the operations and where deviations and violations would have particular importance for the company’s situation. We examine and test decisions undertaken, support for decisions, actions taken and other circumstances that are relevant to our opinion concerning discharge from liability. As a basis for our opinion on the Board of Directors’ proposed appropriations of the company’s profit or loss we examined the Board of Directors’ reasoned statement and a selection of supporting evidence in order to be able to assess whether the proposal is in accordance with the Companies Act.
Malmö 5 April 2018 KPMG AB
Eva Melzig Authorized Public Accountant
65 ANNUAL REPORT
Addresses
Volito AB Skeppsbron 3, SE-211 20 Malmö
Phone +46 40 660 30 00 Fax +46 40 660 30 20 E-mail info@volito.se Corporate identity number 556457-4639 www.volito.se
Volito Fastigheter AB Skeppsbron 3, SE-211 20 Malmö
Phone +46 40 664 47 00 Fax +46 40 664 47 19 E-mail info@volito.se Corporate identity number 556539-1447 www.volitofastigheter.se
Volito Industri AB Skeppsbron 3, SE-211 20 Malmö
Phone +46 40 660 30 00 Fax +46 40 660 30 20 E-mail info@volito.se Corporate identity number 556662-5835 www.volitoindustri.se
This English version is a translation of the Swedish original. In case of any dispute as to the interpretation of this document, the Swedish version shall prevail.
Volito is a privately owned investment group headquartered in Malmö. The business was founded in 1991, with an initial focus on aircraft leasing. After achieving rapid early success, Volito broadened its activities and started to expand.
Today, Volito is a strong, growth-oriented group based on a balanced approach to risk and reward, and a long-term perspective. The Group’s activities are divided into three diversified business areas: Real Estate, Industry and Portfolio Investments, areas that develop their own business units, business segments and subsidiaries.
VO LITO WWW.VOLITO.SE
