
September 23, 2025

Launched in 2021, the Colorado Latino Agenda (CLA) is a statewide, nonpartisan public research initiative co-led by Voces Unidas and COLOR that publishes relevant and timely in-depth reports about Latinos in Colorado.
The Colorado Latino Policy Agenda (CLPA) is our annual, nonpartisan report designed to provide insights into the demographic makeup and views of Latino voters in Colorado on pressing policy, political, and social issues.
The CLPA report is informed by the largest public opinion poll of Latino voters and non-voters in Colorado, fielded by BSP Research. Learn more at www.coloradolatinoagenda.org

• Based on a survey of n= 1,700 randomly drawn and representative sample of Latinos across the state of Colorado (+/- 2.4%)
• Data was collected between July 10 and August 6, 2025 through a blended approach including web-based (n=1,100)and telephone interviews (n=590) across both landlines and cell phones, in either Spanish or English, with n=447 conducted in Spanish.
• The data was weighted to the best-known estimates of the U.S. Census CPS Survey across key demographics in Colorado for the Latino population.
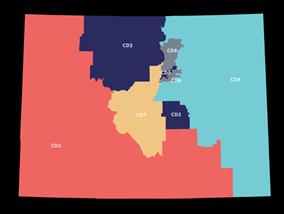
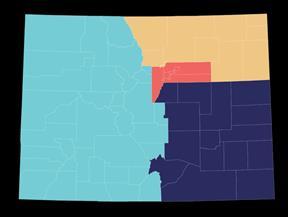
• The survey includes over samples of rural regions of the state to ensure that comparisons can be made across the full state's population, as well as over samples of Latinos in the highly competitive CD-3 (n=427) and CD-8 (n=293).
• The poll includes both registered voters (n=1,245) and non-registered voters (n=455)

Size of poll provides snapshot view of the second-largest and second fastest-growing ethnic voting bloc in the state.
Oversampling in rural areas helps provide insights into regions, as well as congressional districts*
Economic concerns are top priorities for Latino voters.
All three of the top issues Latinos want Congress to address are tied to the economy and personal finances.
Protecting immigrants/reform comes in fourth, over 3 times more salient than border security at 6%.
What are the most important issues facing the Latino community that you think Congress and the President should address?
Addressing the rising cost of living / Inflation
Improving wages and income
Lowering healthcare costs
Protecting immigrant rights/immigration reform
Discrimination/racial justice
Addressing gun violence and mass shootings
Increasing access to mental healthcare
Reducing government spending
Creating affordable and attainable housing
Expanding and protecting reproductive health/abortion rights
Economic concerns are top state priorities for Latinos as well.
All four of the top issues Latinos want the state to address are tied to the economy and personal finances.
Reproductive health and protecting immigrants in top 10.
Thinking about here in Colorado, what are the most important issues that you want the Governor and state legislature to address?
Improving wages and income
Addressing the rising cost of living / Inflation
Lowering healthcare costs
Creating affordable and attainable housing
Homelessness
Addressing gun violence and mass shootings
Reducing government spending
Increasing access to mental healthcare
Expanding and protecting reproductive health/abortion…
Protecting immigrant rights
Most Latinos believe the nation is going in the wrong direction, but that Colorado and its counties are going in the right direction.
For each of the following, do you think things are going in the right direction, or the wrong direction?
The United States as a whole The state of Colorado County
Going in the right direction Going in the wrong direction Don’t know
Who or what do you believe is MOST responsible for the COUNTRY going in the _____ direction?
Trump is perceived to be the most responsible for direction of the country
Don’t know
One-third of Latinos’ financial situation has gotten worse in the last year; one-third have also gotten better.
Over the past 12 months, would you say that your financial situation has generally gotten:
These results are nearly the same as last three years, suggesting that roughly a third of the Latino community has continued to lose ground financially.
Residents of DenverMetro were most likely to have a better financial situation over the past year.
Residents of the Eastern regions were most likely to have a worsening financial situation
Over the past 12 months, would you say that your financial situation has generally gotten:
How do you think the state should fund public services that Coloradans depend upon - like health care, public transportation and education?
Increase taxes ONLY on large businesses and corporations
Increase taxes ONLY on individuals making over $500,000 in income a year
Increase taxes on everyone equally across the state
Taxes should not be increased for anyone, even if it means some local and state programs cannot be funded
Taxes should be reduced for everyone, no matter what impact it has on public programs
Other: Don’t know/Unsure
Most Latinos prefer that the state only increases taxes on large businesses/corporations, or for high income earners making over $500,000 per year
Most Latinos support changing TABOR to allow for more flexibility to spend more on schools, roads, and health.
Would you support changing TABOR to give the state more flexibility to spend on things like schools, roads, and healthcare, even if that means losing some TABOR refunds in the future?
Strongly support Somewhat support Somewhat oppose Strongly oppose
9% of Latinos in the state reported not having health insurance.
Uninsured rates are highest among nonvoters (15%), and Latinos making less than $40,000 annually (15%)
Which of the following types of health insurance do you currently have?
Of those who lack insurance, the main reasons were employers not offering insurance, affordability, and losing their job.
[If uninsured] Which of the following best describes why you do not have health insurance?
Employer does not offer it
Could no longer afford it
Lost job/ not employed
No longer eligible under public insurance program
Never had health insurance
Never got around to applying for Medicaid/Centennial Care
Don’t know how to get insurance
Experienced a gap in coverage while re-enrolling for Medicaid/Centennial Care
Decided no longer need or want it
COBRA coverage ran out
No longer eligible on parents’ policy
(If insured) If you or someone in your household were to lose health insurance coverage, including Medicaid, which of the following would be challenges for you or your family?
Would not be able to afford the out-of-pocket costs of life saving medication
Many Latinos in the state would not be able to afford life saving medication and would skip or delay medical visits if they lost their insurance coverage.
Would begin to skip or delay wellness visits, regular check-ups, vaccines
May go into medical debt or face collections if we are unable to pay for necessary care.
Would lose access to specialized treatments
May lose access to preventive care or immunizations.
May lose a job or skip going to work if we are not able to manage our health
None of the above
Almost two-thirds of Latinos say their overall health has stayed the same (49%) or gotten worse (16%). Vision health saw largest decline.
Thinking about YOUR health, have each of the following gotten better, worse, or stayed about the same over the past year?
Your overall health
Mental and behavioral health
Dental health
Optometry vision/eye health
Family planning, STI testing,…
Better Stayed about the same Gotten worse Not applicable/have not tried to access in the past year
In your opinion, is immigration enforcement in your area mostly:
Targeting people they think look like immigrants, including Latinos who are US Citizens
Targeting people that commit serious crimes
Targeting people that commit minor violations (for example, driving without a license)
Targeting people randomly
Not sure I have not heard about immigration enforcement in my area
Most Latinos believe immigration enforcement is targeting people who “look like immigrants,” including Latinos who are US citizens
In an effort to increase deportations, the Trump administration has asked state and local officials to collaborate with them. Would you oppose or support an elected official here in Colorado who took the following actions?
Volunteers to give the Trump Administration and ICE state Medicaid data about undocumented immigrants, even though it’s against state law to do so
There is high opposition for local officials collaborating with ICE and the Trump administration
Volunteers to share identifiable data about the whereabouts of immigrant children in Colorado with the Trump Administration and ICE, even though it’s against state law to do so
TOTAL SUPPORT
Do you agree or disagree with the following:
Total Agree Total Disagree
There is high agreement for law enforcement identification, body cameras, and respect. There is low support for ICE targeting Latinos for questioning.
All law enforcement officers operating in the state of Colorado should always identify themselves, wear body cameras, drive clearly marked vehicles and treat everyone with dignity and respect.
ICE agents should be allowed to stop anyone they suspect of being undocumented, even if that means some Latino citizens may also be targeted for questioning
How much do you support or oppose each of the following?
Administering $50,000 fines for government workers and agencies who violate state law by sharing data with ICE
Sharing local and state data with ICE for immigration enforcement
Majority of Latinos oppose the idea of sharing data with ICE and having local law enforcement collaborating with ICE.
Local law enforcement working or collaborating with ICE without a judicial order
Total Support Total Oppose
If a close friend or family member were to be detained by ICE, do you know of any organizations here in your community you could contact to get help for this person?
Most Latinos do not know any organizations they could contact if someone they knew was detained by ICE. This appears to be moderated by income and the language spoken at home.
Please indicate whether you would support or oppose each of the following housing policies:
Creating affordable housing programs specifically for essential workers (for example, landscapers, construction workers,…
Give existing mobile home park residents the right to purchase their mobile home park before it goes up for sale
Allow local municipalities the choice to use rent control/rent stabilization policies, which would limit the amount that landlords can…
Requiring cities and towns to build more housing near/adjacent to major employment areas
Local governments should be incentivized to buy mobile home parks to help preserve affordable housing for local workers
There is high support for housing policies that address spike in housing costs
Total Support
Total Oppose
High support for the top three housing policies are consistent across regions
Creating affordable housing programs specifically for essential workers (for example, landscapers, construction workers, housekeepers, restaurant staff)
Give existing mobile home park residents the right to purchase their mobile home park before it goes up for sale
Allow local municipalities the choice to use rent control/rent stabilization policies, which would limit the amount that landlords can raise rent each year
Colorado Please indicate whether you would support or oppose each of the following housing policies:
Colorado
Support Total Oppose
Three-fourths (76%) of Latinos are either very concerned or somewhat concerned about climate change.
Only 20% are not concerned.
Concern about climate change is highest in Western and Northeast Colorado.
How concerned are you that your community will be impacted by wildfires, floods, drought or other disasters related to climate change in the near future?
Very concerned Somewhat concerned Not very concerned Not concerned at all Don’t know
How important do you think it is for Colorado to ensure that communities located near oil and gas extraction sites are protected from the environmental hazards produced by the extraction of these fossil fuels?
Total Important Total Not Important Don’t know
The vast majority of Latinos believe it is important for the state to protect communities located near oil and gas extraction sites.
Only about half of Latinos (55%) have confidence that school districts will eliminate racism and the achievement gap in local schools.
How confident are you that your local school district has the expertise, knowledge and willingness to:
Hire administrators, principals and teachers that reflect the diversity of the students
Involve Latino parents in decision-making processes in school and the district
Eliminate racism and discrimination in the schools across our district
Eliminate the student achievement gap between Latino and White students
Total Confident Total Unconfident
[If parent] Which of the following actions would you consider taking to help ensure that your children have access to a high quality education here in Colorado? Select all that apply.
Of the actions listed, Latino parents would most consider removing school board members who are not responsive to community needs and would also consider pushing for leadership changes.
Remove school board members who are not responsive to community needs
Push for leadership changes (ex., replace the superintendent or school principals)
Take legal action against the school district for violating student civil rights
Establish new schools where Latino parents have more influence over decisions and curriculum
None of the above
Would you support or oppose giving the state’s Department of Education stronger enforcement powers to help parents hold school districts accountable if there are violations to a student’s right to a quality education?
Total Support Total Oppose Don’t know/Unsure
Most Latinos (79%) support giving the Department of Education in Colorado stronger enforcement powers to hold school districts accountable.
Latinos perceive the most unfair treatment in the criminal justice system and the media.
Please tell us whether you feel that Latinos are treated fairly or unfairly in each of the following areas
The criminal justice system
By the media
Employment/workforce/workp laces
The child welfare system
The health care system
The public education system
Total Fair Don’t Know
Two-in-five Latinos (42%) report experiencing discrimination, a rate that climbs to 54% among those earning less than $39K
Have you personally been treated unfairly or personally experienced discrimination? (% yes)
[If Q40=Yes] In your opinion, what are the reasons you were treated unfairly? (Top Ten)
Because of my race or ethnicity
Because of my skin color
Because of my age
Because of my gender
Because I do not have a high income
Because of my religion
Because I am on Medicaid
Because of my accent
Because of my sexual orientation
Because of my immigration status
Most Latinos who experienced discrimination believe it was due to their race/ethnicity or skin color
Perceived effectiveness is highest for the Governor and Democrats in the state legislature. Effectiveness is lowest for Republicans in the state legislature, and county commissioners.
How effective are each of the following at addressing issues important to the Latino community in Colorado?
Governor of Colorado
Democrats in Colorado’s State Legislature
The Colorado Assembly (State House and Senate)
Your city/town councilors
County commissioners
Republicans in Colorado’s State Legislature
Very effective
Somewhat effective
Moderately effective
Slightly effective
Democrats in the state and in Congress have generally high favorability compared to Republicans.
Disapproval for Trump was highest in CD-5 (60%), CD-4 (59%), CD-2 (59%), and CD-3 (58%).
Overall, do you approve or disapprove of each of the following?
[If eligible voter] Who did you vote for in the 2024 Presidential election?
Denver Metro Northeast Colorado Southeast Colorado Western Colorado
Someone else I did not vote in the 2024 Presidential election
Most Latinos in all regions voted for Kamala Harris in 2024. Votes for Trump were highest in the Western and Denver-Metro regions.
Most Latinos disapprove of Trump since his inauguration, including Democrats, Independents, both registered and nonregistered voters, and those making less than $80k per year.
More than one-third of conservative Latinos also disapprove of Trump so far.
Overall, how would you rate President Trump’s job performance so far this year, since he was inaugurated in January? Would you say that you strongly approve, somewhat approve, somewhat disapprove, or strongly disapprove of the job he is doing?
Approve Total Disapprove
Nearly half of Latinos have not been politically contacted by anyone; of those who have, the most common type of contact is from friends and family.
In 2025, have any of the following contacted you to ask for your thoughts about politics or policy here in Colorado? Select all that apply.
Friends, family, and/or coworkers
A community/advocacy organization
A representative from a political party
Someone working for a candidate running for…
A candidate running for office
None of the above
One-fifth of Latinos do not plan to vote in school board elections; another one-fifth are not sure.
[If eligible voter] This November, there will be various local school board elections occurring in the state of Colorado. Do you plan on voting in your school board election?
Yes, I DO plan to vote No, I DO NOT plan to vote
I am not sure yet if I will vote
Latinos in CD-5 are the least likely to vote in school board elections.
[If eligible voter] This November, there will be various local school board elections occurring in the state of Colorado. Do you plan on voting in your school board election?
Yes, I DO plan to vote No, I DO NOT plan to vote I am not sure yet if I will vote
Of those who are not voting in school board elections, most report not being aware of them occurring; many also believe they do not need to vote because they do not have children. Lack of knowledge appears in two of the top three reasons for not voting.
[If not planning or not sure about voting] Why are you not planning to vote in the 2025 school board elections?
I was not aware that there were school board elections
I do not have any children so I do not need to vote for the school board
I don’t know enough about the candidates or what school boards do
I don’t feel like my vote will make a difference
I don’t think school districts care about people like me I don’t feel welcomed or included I am not eligible to vote
I don’t feel represented by any of the candidates
I have scheduling, transportation, or childcare issues
Other:
Education (Collapsed)
HS or less SomeColl 4yrDeg
Education
● Addressing gun violence and mass shootings and protecting immigrant rights are higher federal priorities to residents of CD-1 than most other districts.
● At the state level homelessness and addressing climate change and pollution are slightly higher priorities in this district than the rest of the state.
● CD-1 residents are 10% more likely to report that they have faced discrimination due to their race or ethnicity.
● Nearly 1 in 4 residents in CD-1 reported being contacted by a community or advocacy organization following the 2025 election, higher than all other districts except CD-7.

• Lowering healthcare costs (+5% for federal/+6% for state) remains a higher priority for residents in CD-2, and addressing housing costs CD-2 (+6%) more important in federal priorities in CD-2.
• CD-2 residents have experienced a relatively worse financial year than other Latinos in the state (-5%)
• At 34% approval, CD-2 residents approval ratings of President Trump are 7% lower than the rest of state’s districts, and CD-2 residents are 7% less likely to believe Trump’s economic policies will positively impact their families economic situation.
• 52% of CD-2 residents (15% higher than the overall sample) are very concerned that their community will be impacted by wildfires, floods, drought or other disasters related to climate change in the near future.

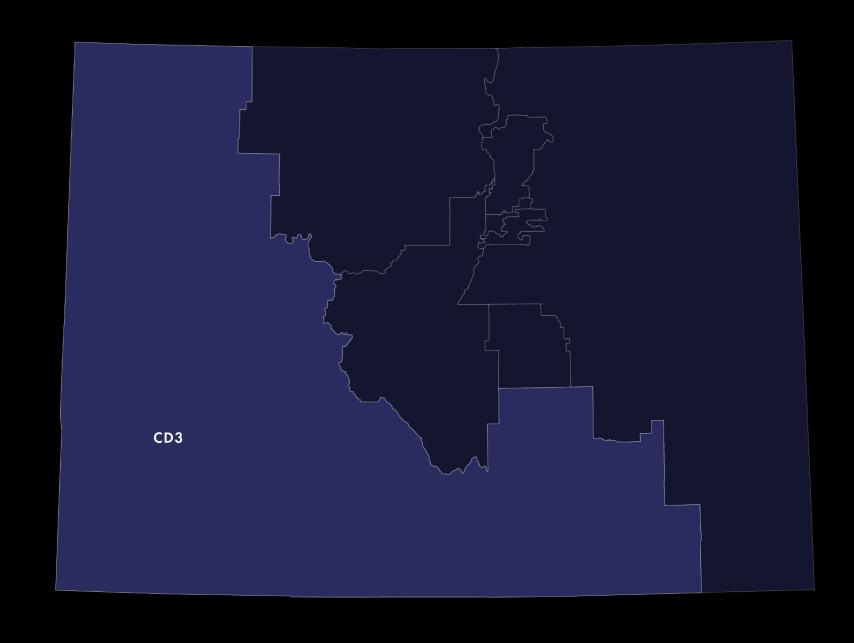
• At the state level, CD-3 residents are 7% more likely to prioritize homelessness than other residents.
• CD-3 residents are 8% less likely to have been contacted by anyone through mobilization.
• CD-3 residents are the most likely to lack trust in their local police not collaborating or sharing data with ICE (64%), and are 6% less likely to support local and state data being shared with ICE for immigration enforcement purposes.
• 59% of CD-3 residents believe it is very important for Colorado to ensure that communities located near oil and gas extraction sites are protected from the environmental hazards produced by the extraction of these materials, 8% higher than the rest of the state.
• CD-3 residents are 8% less likely to report that they face racial or ethnic discrimination.
• CD-3 residents are more satisfied with their healthcare across all measures in the survey, including being 8% more satisfied with the cost of their healthcare.
• Only 8% of CD-4 respondents prioritize protecting immigrant rights/immigration reform compared to 22% overall at the federal level.
• Increasing access to mental healthcare is a higher priority for CD-4 residents (20%, compared to 14% overall)
• Addressing gun violence and mass shootings is also a higher priority in CD-4 (22% compared to 15% overall).
• Residents of CD-4 are 8% less likely to report that their financial situation has gotten better
• CD-4 residents are 5% more likely to believe the country is headed in the wrong direction than other districts, with CD-4 residents slightly more likely (+6%) to believe that this is due to Democrats in Congress.
• CD-4 residents are more conservative on immigration consistently across the various measures in the survey. This includes slightly higher support for state and local officials collaborating with ICE.

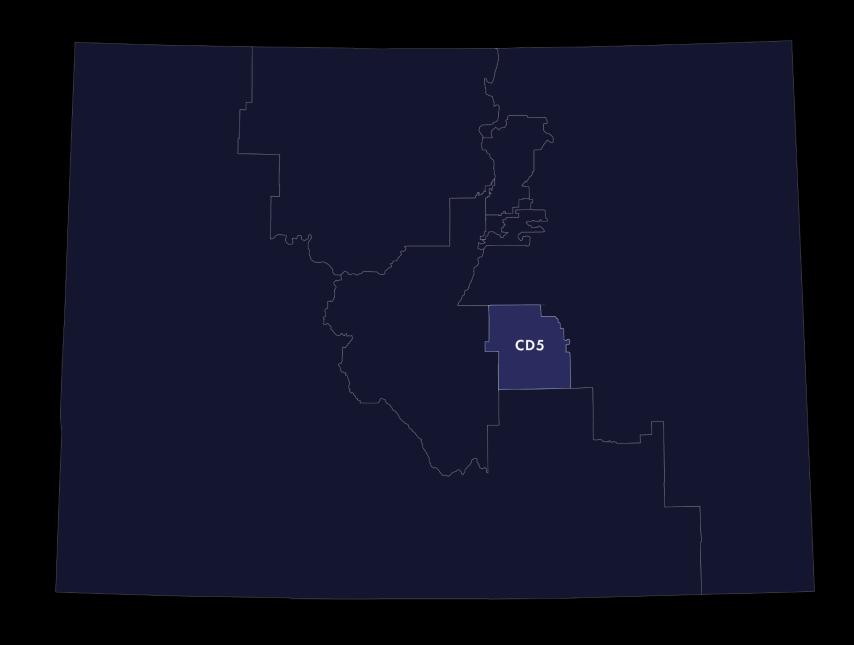
● CD-5 residents are more likely (+6%) to prioritize addressing discrimination and racial justice at the federal level and are 8% more likely to prioritize education as well.
● 63% of CD-5 residents think the nation is heading in the wrong direction which is 11% higher than the overall percentage.
● CD-5 residents are more progressive on immigration policy across all measures in the survey relative to the state overall.
● 50% of CD-5 residents report experiencing racial or ethnic discrimination which is 8% higher than the state overall.
● CD-6 residents are more likely (+5%) to prioritize addressing discrimination and racial justice at the federal level, and are 8% less likely to prioritize education.
● CD-6 residents are 7% more likely to have had their financial situation get worse over the past year - 40% compared to 33% overall.
● CD-6 residents are 10% more likely to distrust state agencies to not share data with ICE and are 6% less likely to support local law enforcement collaborative with ICE - 29% compared to 35% overall.

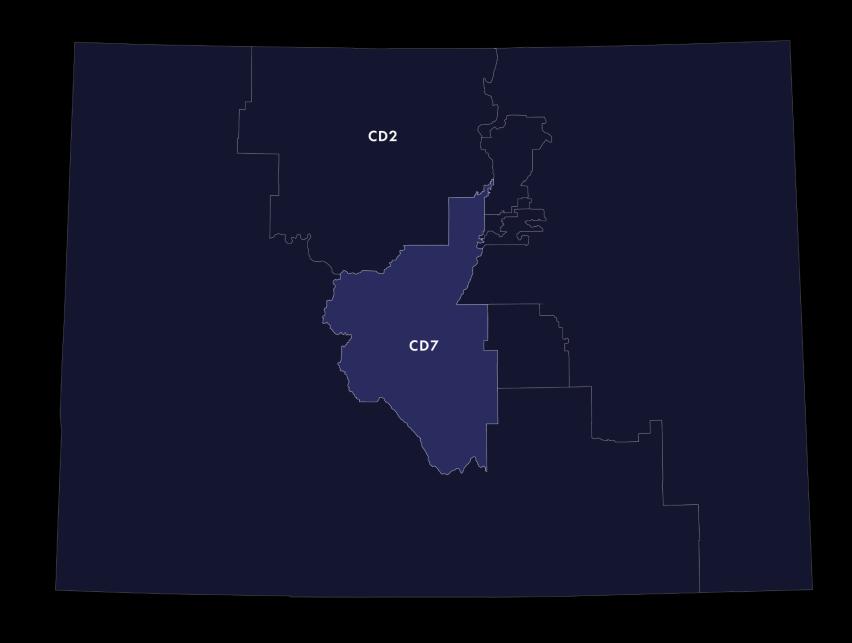
● CD-7 residents are more likely (+4%) to prioritize education than residents in other districts at the federal level.
● CD-7 residents have fared better economically than the rest of the state, as 43% of residents have had their situation get better over the past year compared to 33% of the overall sample.
● Residents of CD-7 are less likely to support lowering construction standards to allow for more affordable housing - 40% in CD-7 relative to 56% overall.
● Residents of CD-8 are more likely to prioritize expanding access to reproductive healthcare including abortions (+5%).
● CD-8 residents are more likely (+7%) to prioritize mental health access than residents in other districts at the federal level.
● CD-8 residents have fared better economically than the rest of the state, as 40% (+7% relative to total sample)
● Residents of CD-8 are more conservative on immigration policy than the rest of the state. For example, they are (+6%) more likely to support ICE agents being able to wear masks to hide their identities (+5%), and support local law enforcement collaborating with ICE (+8%).
● Only 33% of CD-8 residents have faced racial or ethnic discrimination compared to 42% overall.