GULF COAST CAPITAL


quarterly data report

Q2 2023 • Issue 6

Visitation in the second quarter started off slowly before building up as the weather warmed As predicted by national surveys highlighting economic concerns, January and February saw fewer travelers than last year.
However, the beginning of spring break brought positive signs for travel demand during warm weather months. Visitor volume increased greatly compared to last year toward the beginning of spring break, although rain caused last minute cancellations towards the end of break. Even so, hotel occupancy rates over spring break exceeded last year ' s numbers despite the weather

Short term rentals continued to see an increase in visitation this quarter even in the face of the economic climate. These increases in short term rental demand look as though they'll continue into the summer, albeit at a slower rate of growth than we saw last summer The number of short term rentals in the city has also seemed to level out, although this can always change unpredictably in the coming months. That said, the registration process in place this year for short term rental properties means this is less likely than it was last year.
A hotel forecast conducted by Tourism Economics for Corpus Christi predicts that hotels will also see some increases in spring and summer demand compared to last year, especially during May and June, although these increases will slow for economic reasons in July and August The increase is likely in part to the continued return of business travel post-COVID, which has still not reached 2019 levels nationwide.
Also in line with national trends, the Corpus Christi forecast predicts increased hotel room rates and revenue through the rest of the summer. Although some people are opting not to travel this year due to economic concerns, those who are traveling have prepared for the increased price of travel this year and are expecting (and ready to pay) those increased prices.
That means each visitor is giving more back to our economy than ever before. For that reason, your voice matters. 64% of Corpus Christi residents say that they interact with visitors to share recommendations with them Remember, sharing what you love about the city means helping to grow the impact of tourism that we all benefit from!


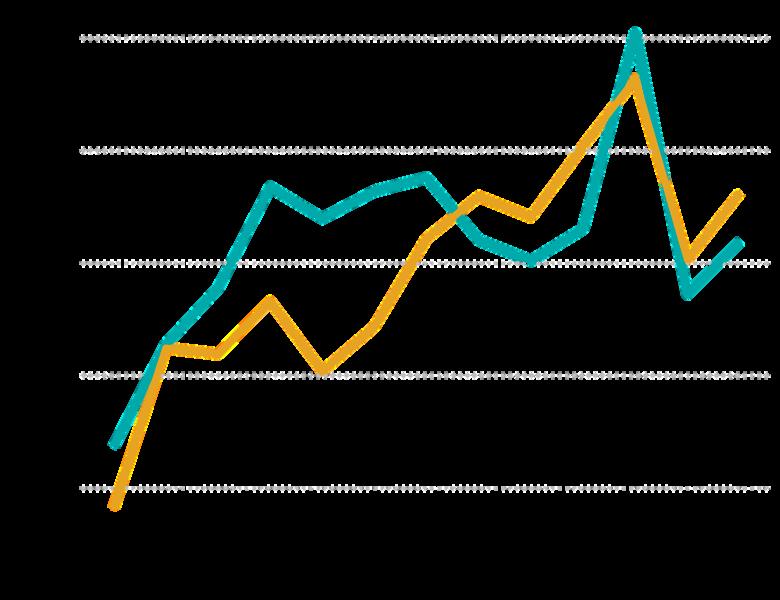
Last minute cancellations due to weather during spring break resulted in large rate drops, which caused large revenue drops.

-5%
2023 hotel
2022
Q2 VS 2022
Demand was well behind last year until March, where we ' ve started to see increases over last year.
2022 2023
Q2 started out slowly, with drops in demand and revenue in January and February. Demand increased in March, but rate decreases meant revenue did not.
-4% hotel REVENUE Q2 VS 2022
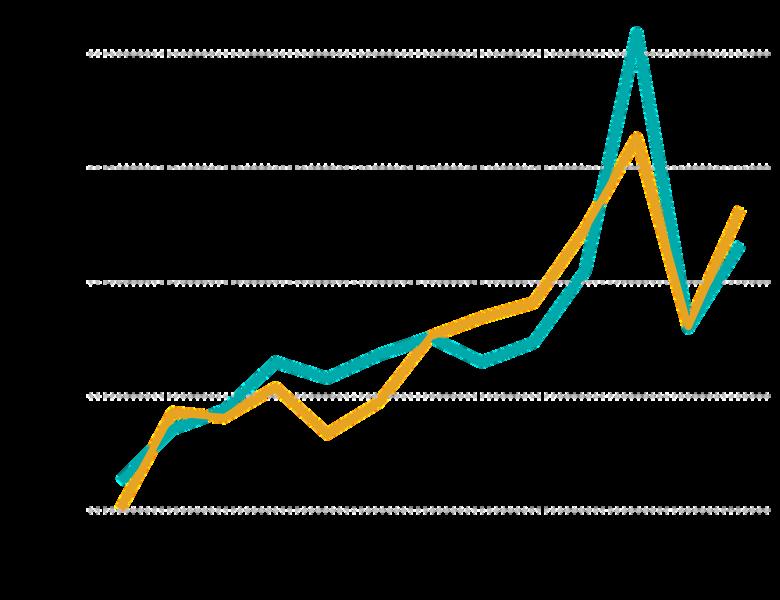
Overall, Corpus Christi room revenue in 2023 is forecasted to grow 2.1%. An expected recession will negatively affect demand in the latter half of 2023, and Tourism Economics expects it to improve quickly in 2024.
Compared to last year, in state visitors were more likely to be from closer markets like San Antonio or the valley. Meanwhile, the out of state visitor base was much more widespread this year, with smaller percentages of the total concentrated in the top 5 geographies


Geolocation-based comparisons of people who saw our ads compared to a control group indicate recent ad campaigns have been effective, with ads increasing the likelihood of visitation by 75% compared to controls
Last Year This Year
m a r k e t s
t o p t e x a s
People who saw our ads were 75% more likely to visit

75% t o p o u t o f s t a t e
m a r k e t s
Darker red means more visitors from state in Q2

data via Bureau of Labor Statistics


2023
2019
2021
2022 2020 L&H LABOR FORCE
The leisure and hospitality industry is supporting more jobs in the Corpus Christi area than ever before. Even still, industry job openings remain historically high.
FLIGHT TRAFFIC
2023
2021
2022
2020
CCIA has experienced excellent passenger volume as of late, with enough traffic in the month of October to rival summer numbers and a busier March than any recent year
APR
Short term rental demand continued to increase throughout most of the quarter.

Supply has remained fairly steady as of late compared to last year, although fluctuations are hard to predict.
This would be good news for current operators, who would benefit more if demand increases outpace supply increases.

Future demand is pacing slightly head of last year in May and June, a positive indication for summer business.
July's demand is pacing slightly behind last year at this point, although pacing that far ahead should always be taken with a grain of salt. Nevertheless, hotel predictions indicate that demand will slow slightly in July due to financial pressure, and rental pacing so far seems to match.

While Corpus has fewer short term rental stays than South Padre or Port Aransas, it has many more hotels, so it has the most visitation of these places in total.
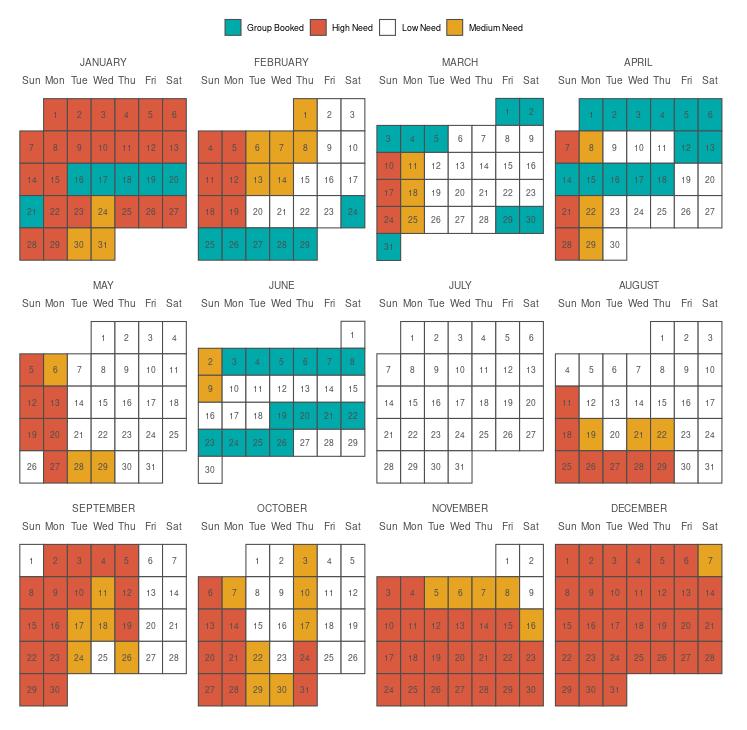
Our strategy is to bring visitors to Corpus Christi when our community benefits from their impact the most: during slower times of year To accomplish this, we use a need date calendar based on seasonal projections to help monitor our progress. Projected occupancy rates below 55% are marked as medium need (orange); below 50% are marked high need (red).
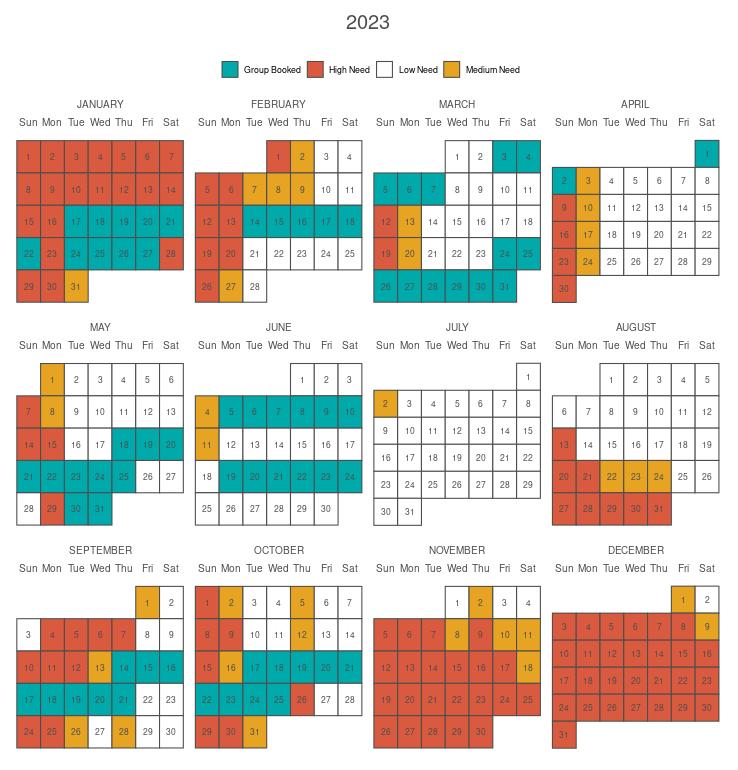
The calendar does not depict effects of all holidays, but they are always taken into account when booking groups. Only very large groups are blocked off on the calendar which represent dates for which we can no longer book further group business - we have booked business for dates elsewhere, but will continue to try to fill those dates.