BI Packages


Uncover the Pulse of Tourism and Hospitality Across the U.S.
Explore into comprehensive research and analysis, providing a clear picture of the current state and emerging trends within the Tourism and Hospitality industries.

Our insights highlight key benchmarks and market shifts that are shaping the future, enabling you to stay ahead in a rapidly evolving landscape.
Reports Include:
• Tourism Economics
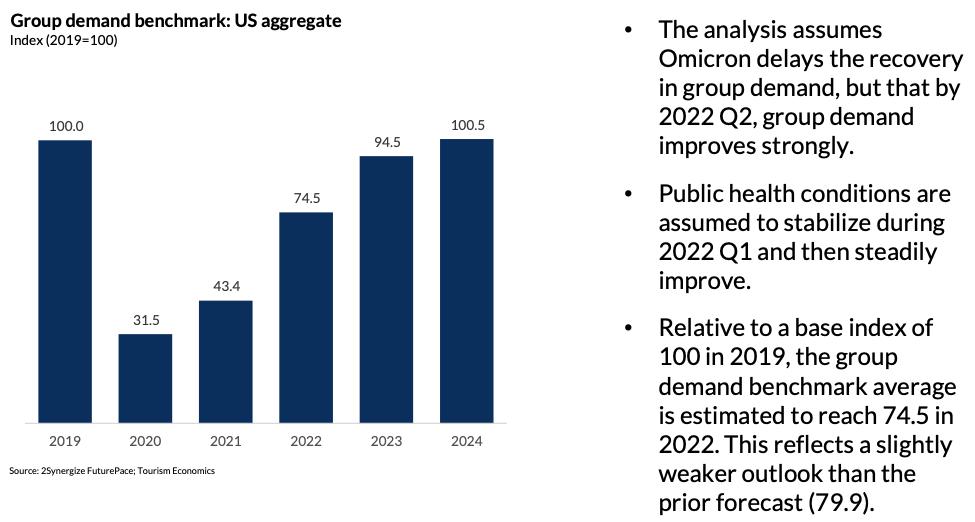
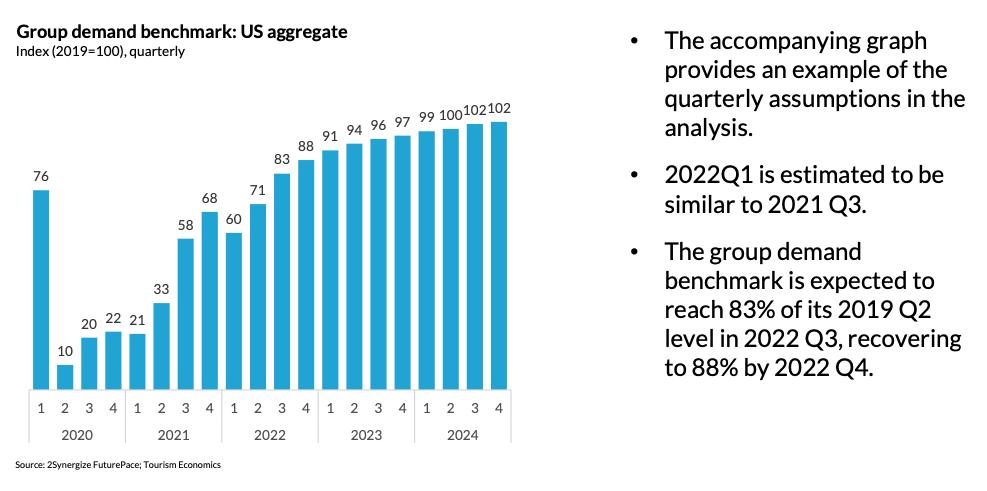
• Group Demand Benchmarks
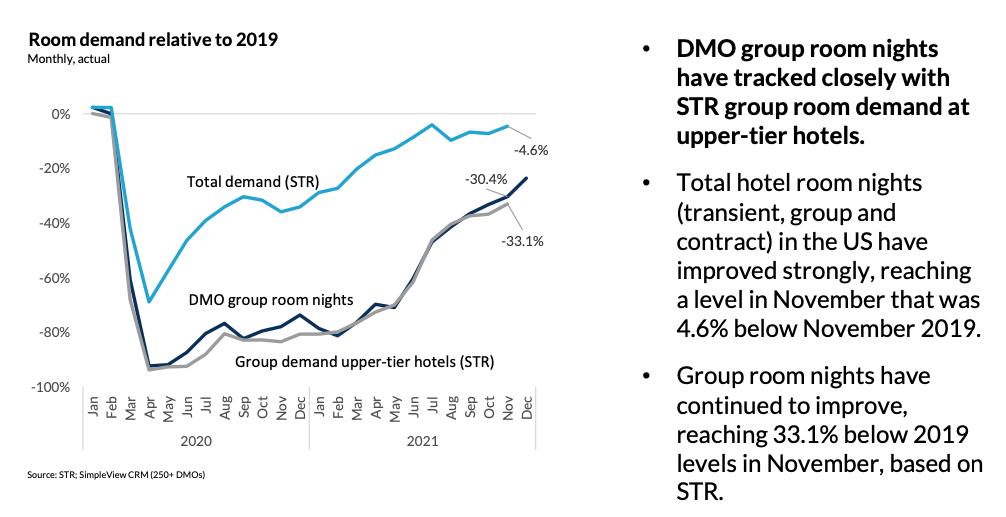
• Room Demand
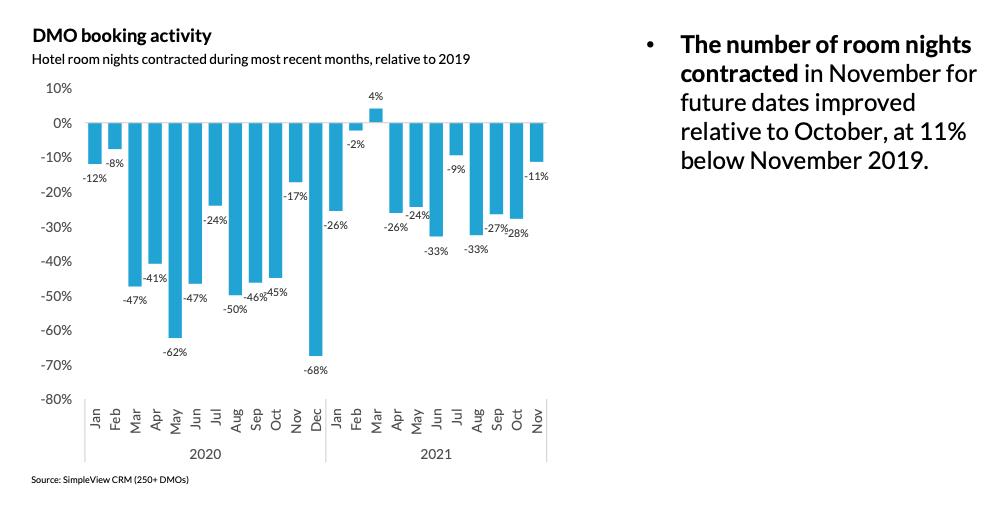
• DMO BookingActivity
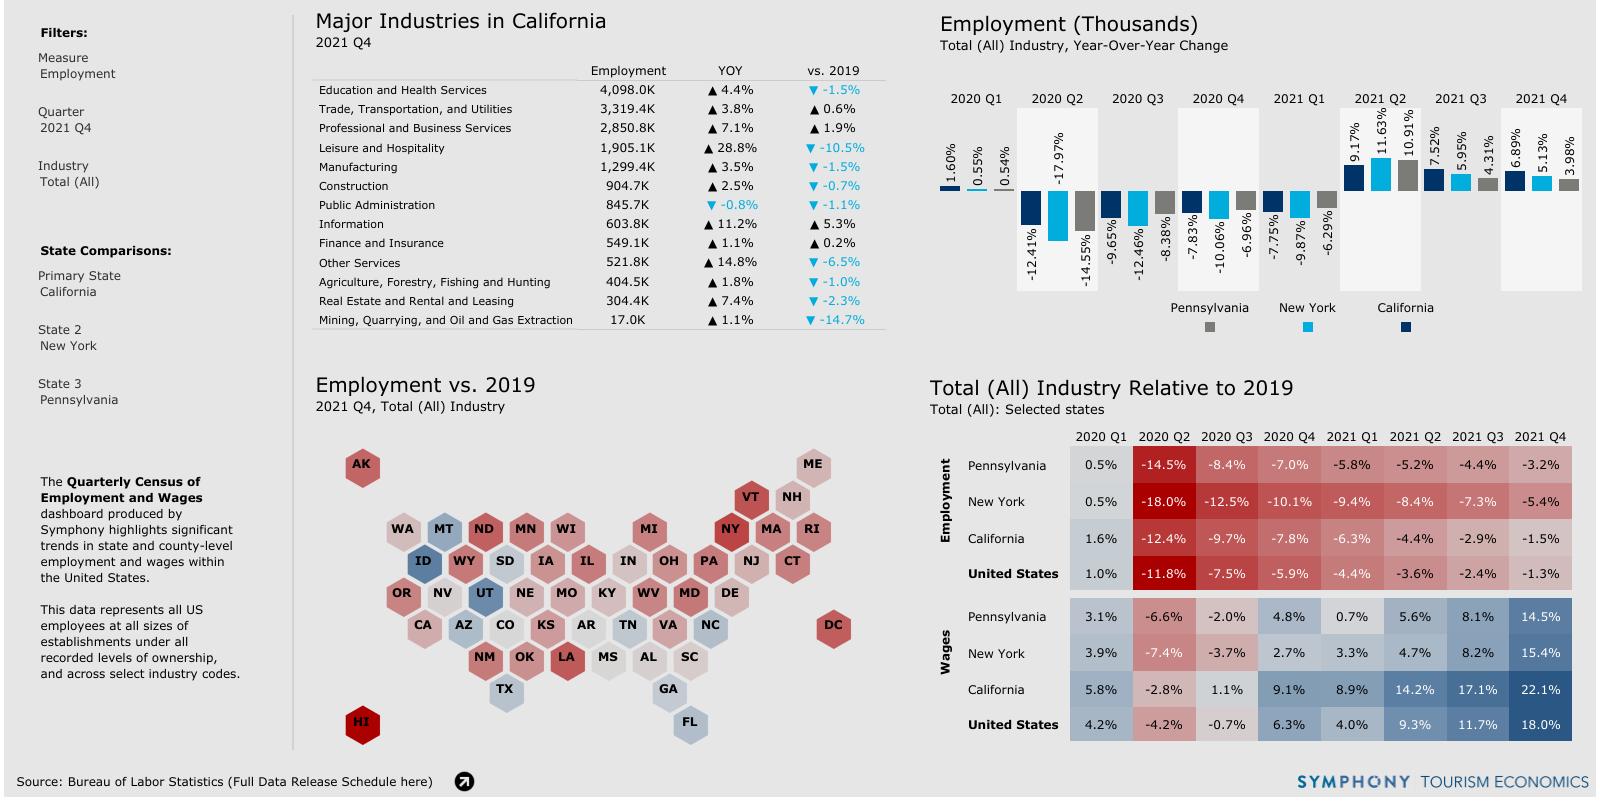
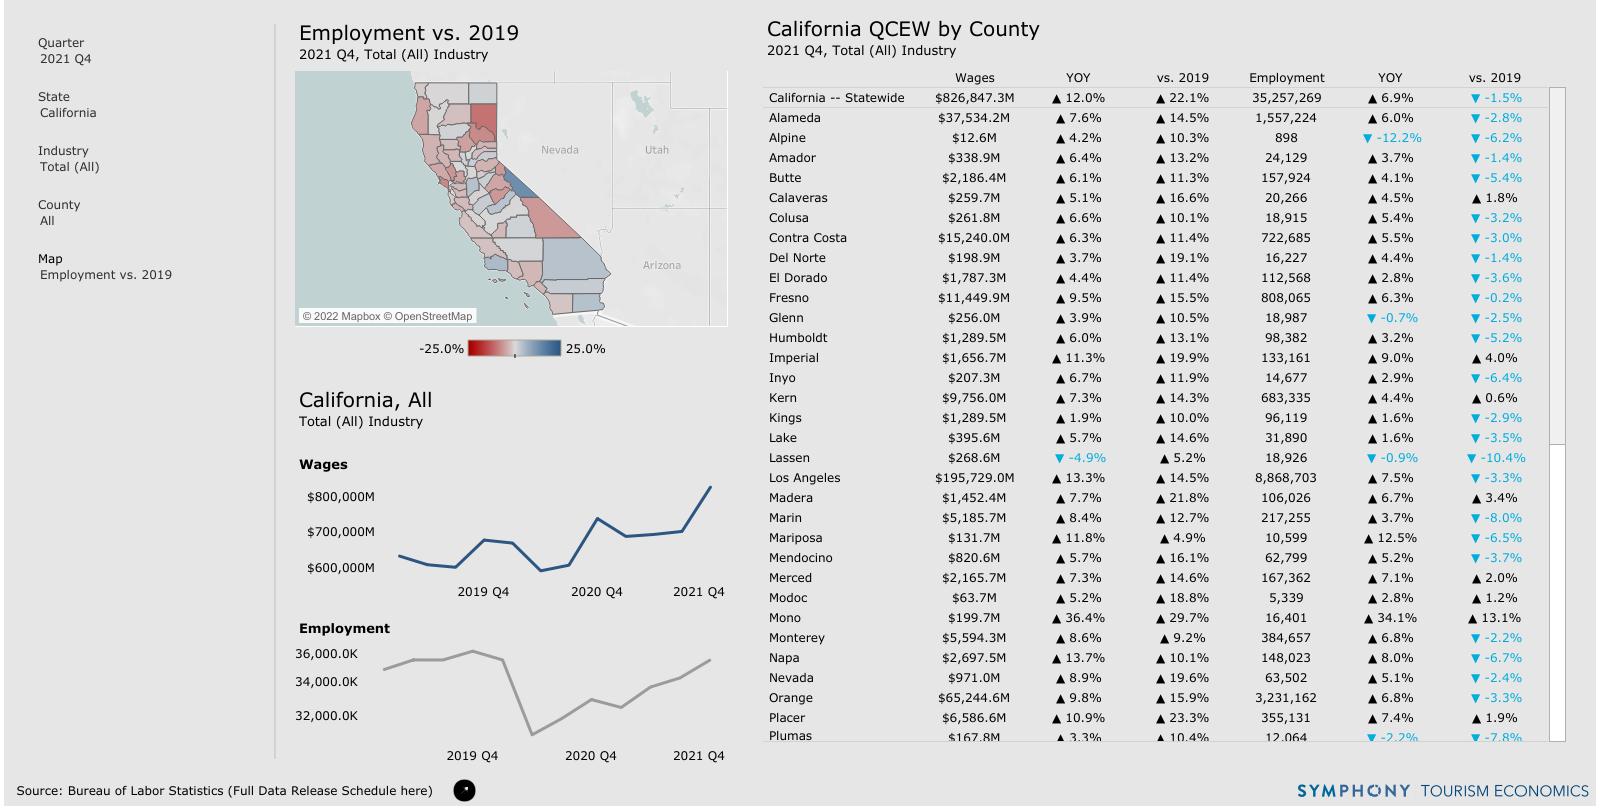
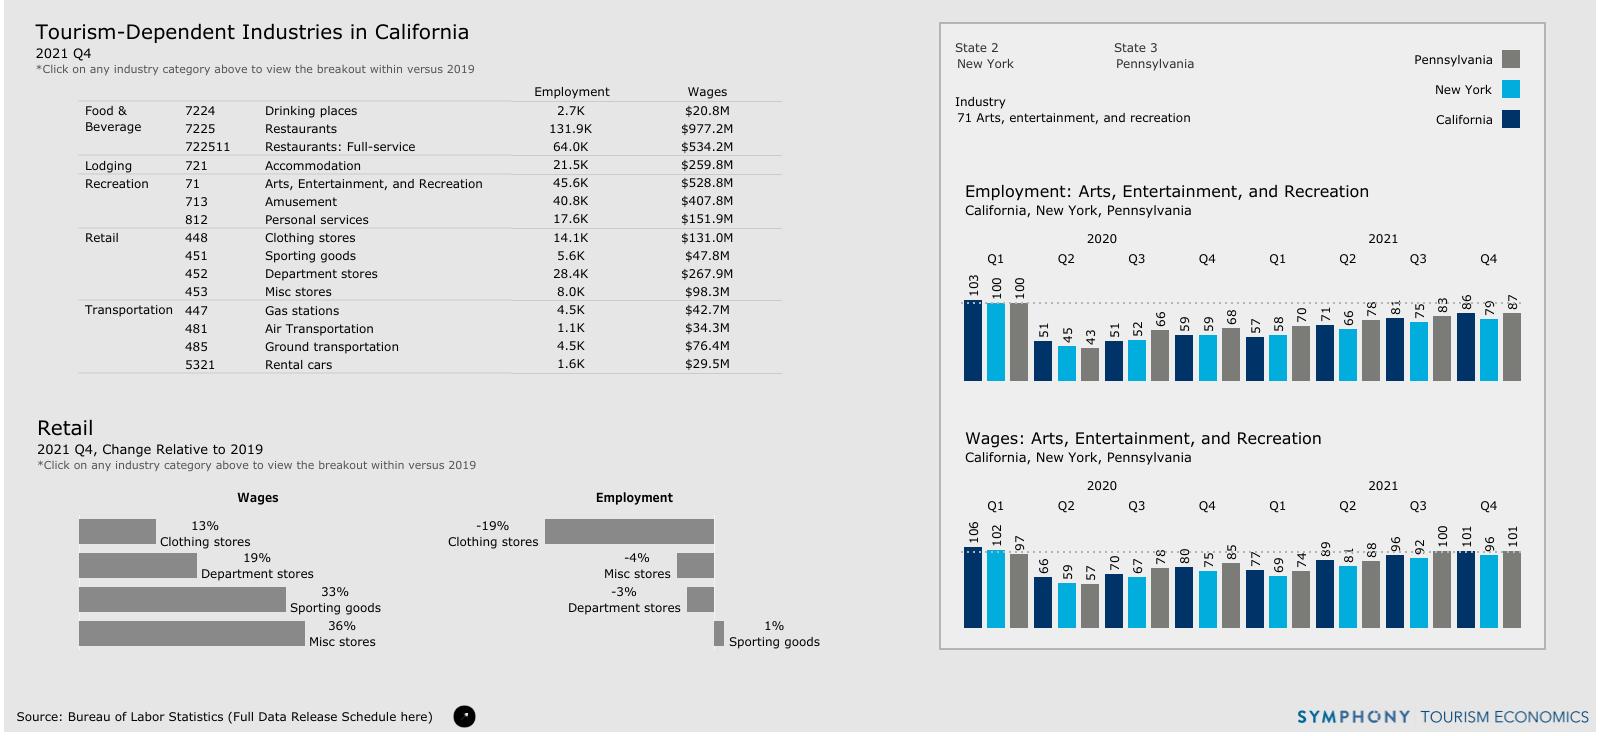
• Bureau of Labor Statistics (BLS)
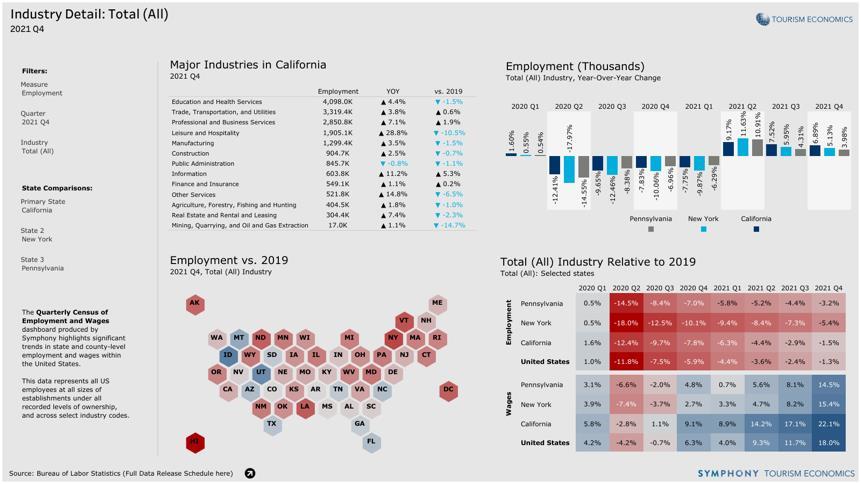
• Industry Detail
• State Detail
• Tourism-Dependent Industries
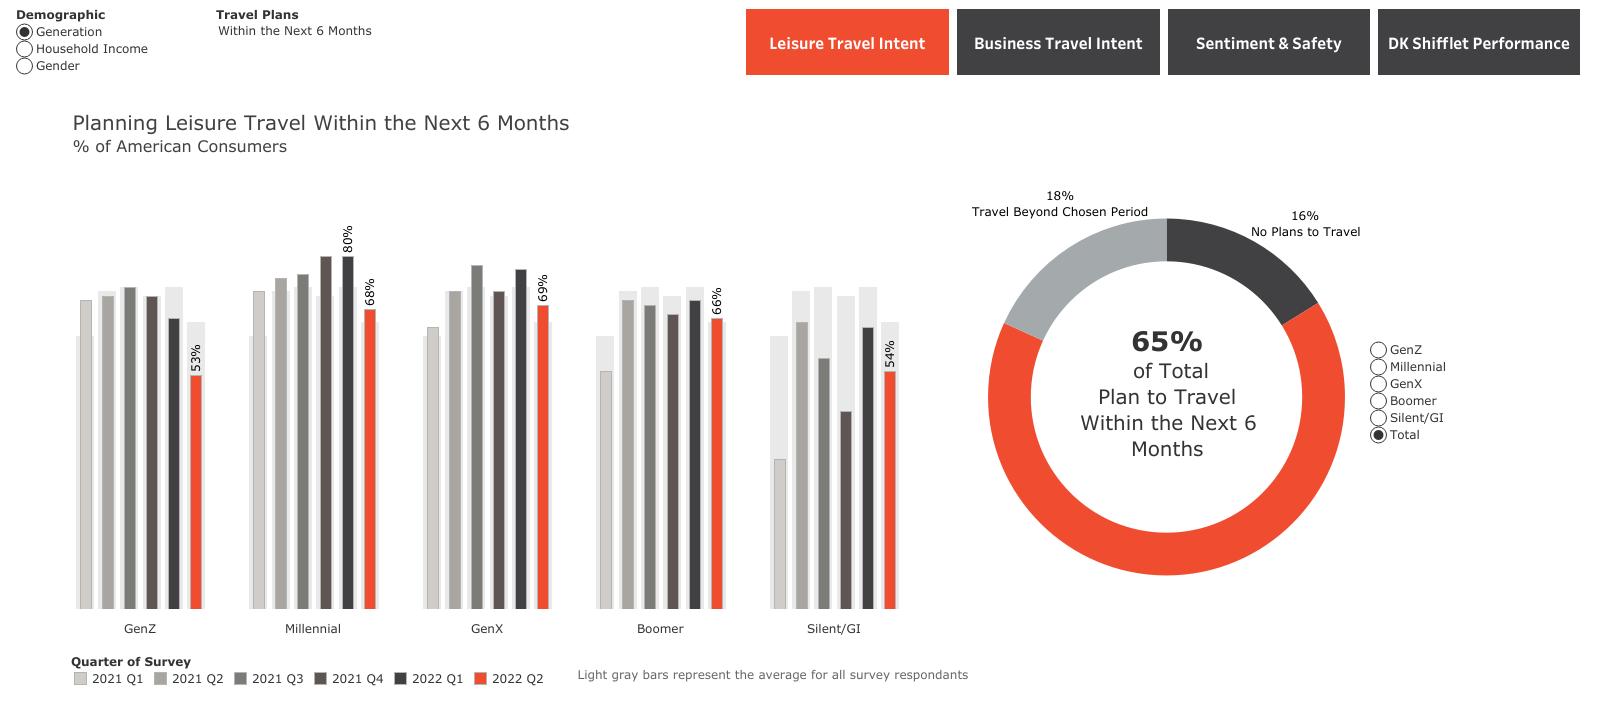
• MMGY
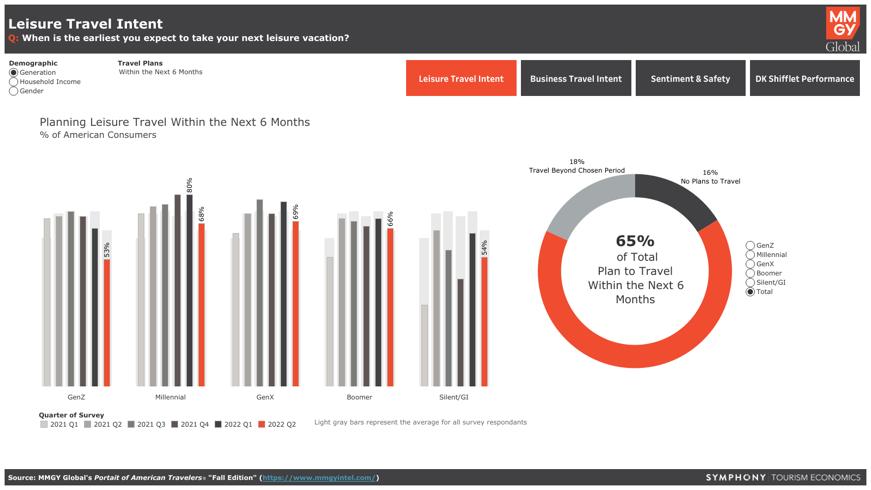
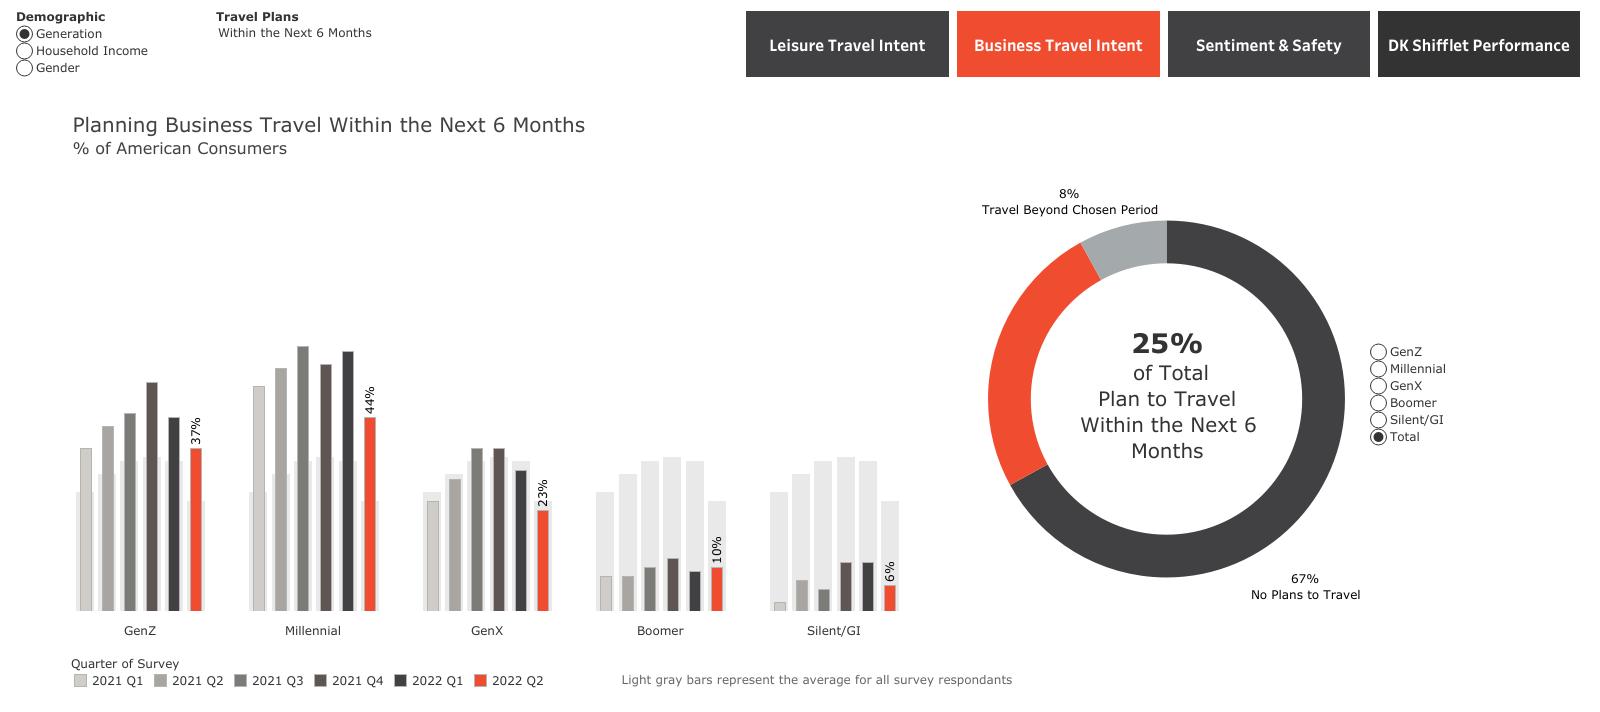
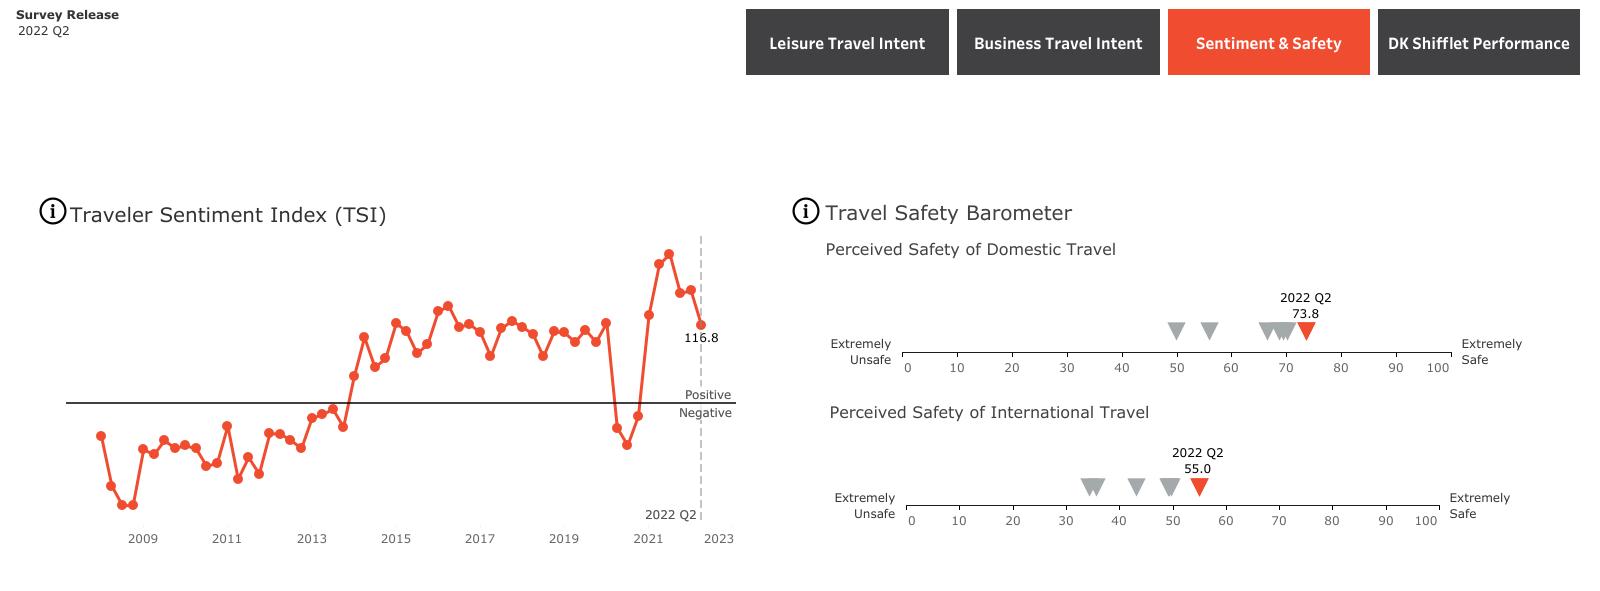
• Leisure Travel Intent
• Business Travel Intent
• Travel Sentiment & Perceived Travel Safety
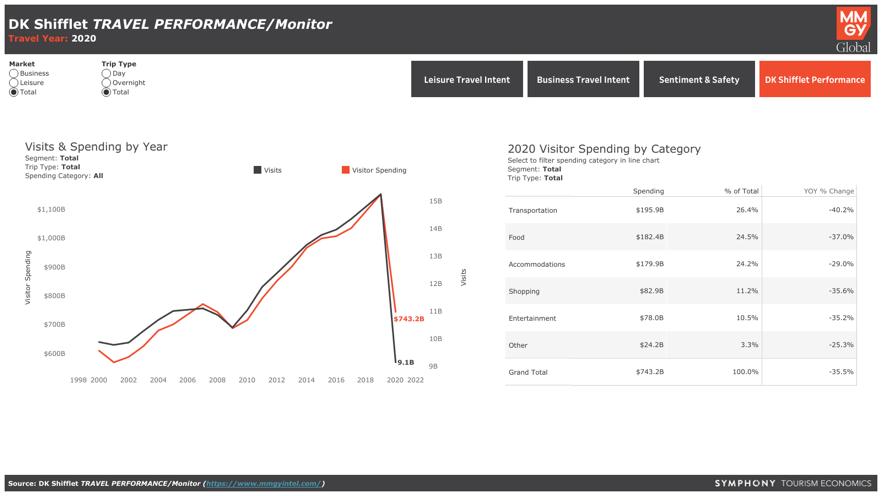
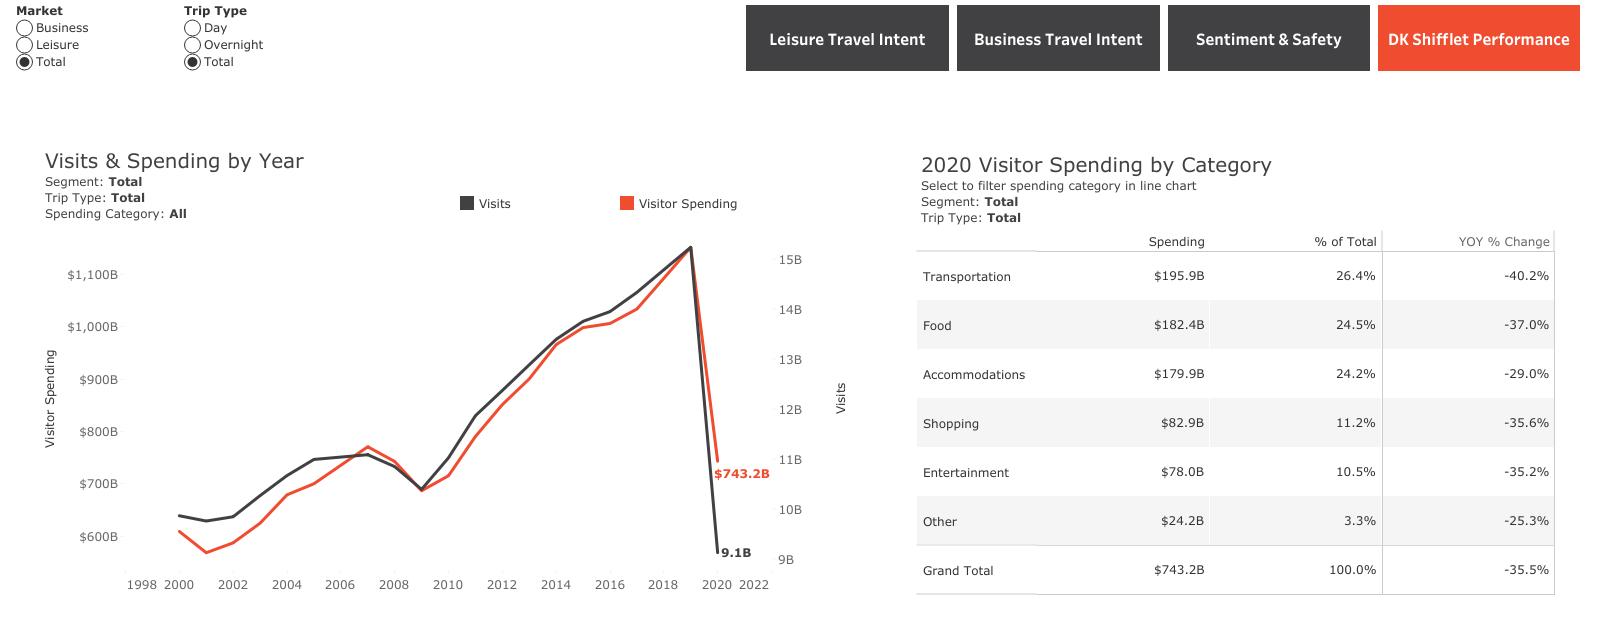
• DK Sifflet Travel Performance/Monitor
• Oxford Economics
• Economic Forecast
• Employment | Workforce
• US Travel
• Recovery and Growth Insights
• YouGov
• Travel Profiler
• National Travel and Tourism Office
• Port of Entry
• Origin Markets
• First IntendedAddress
Report Samples:
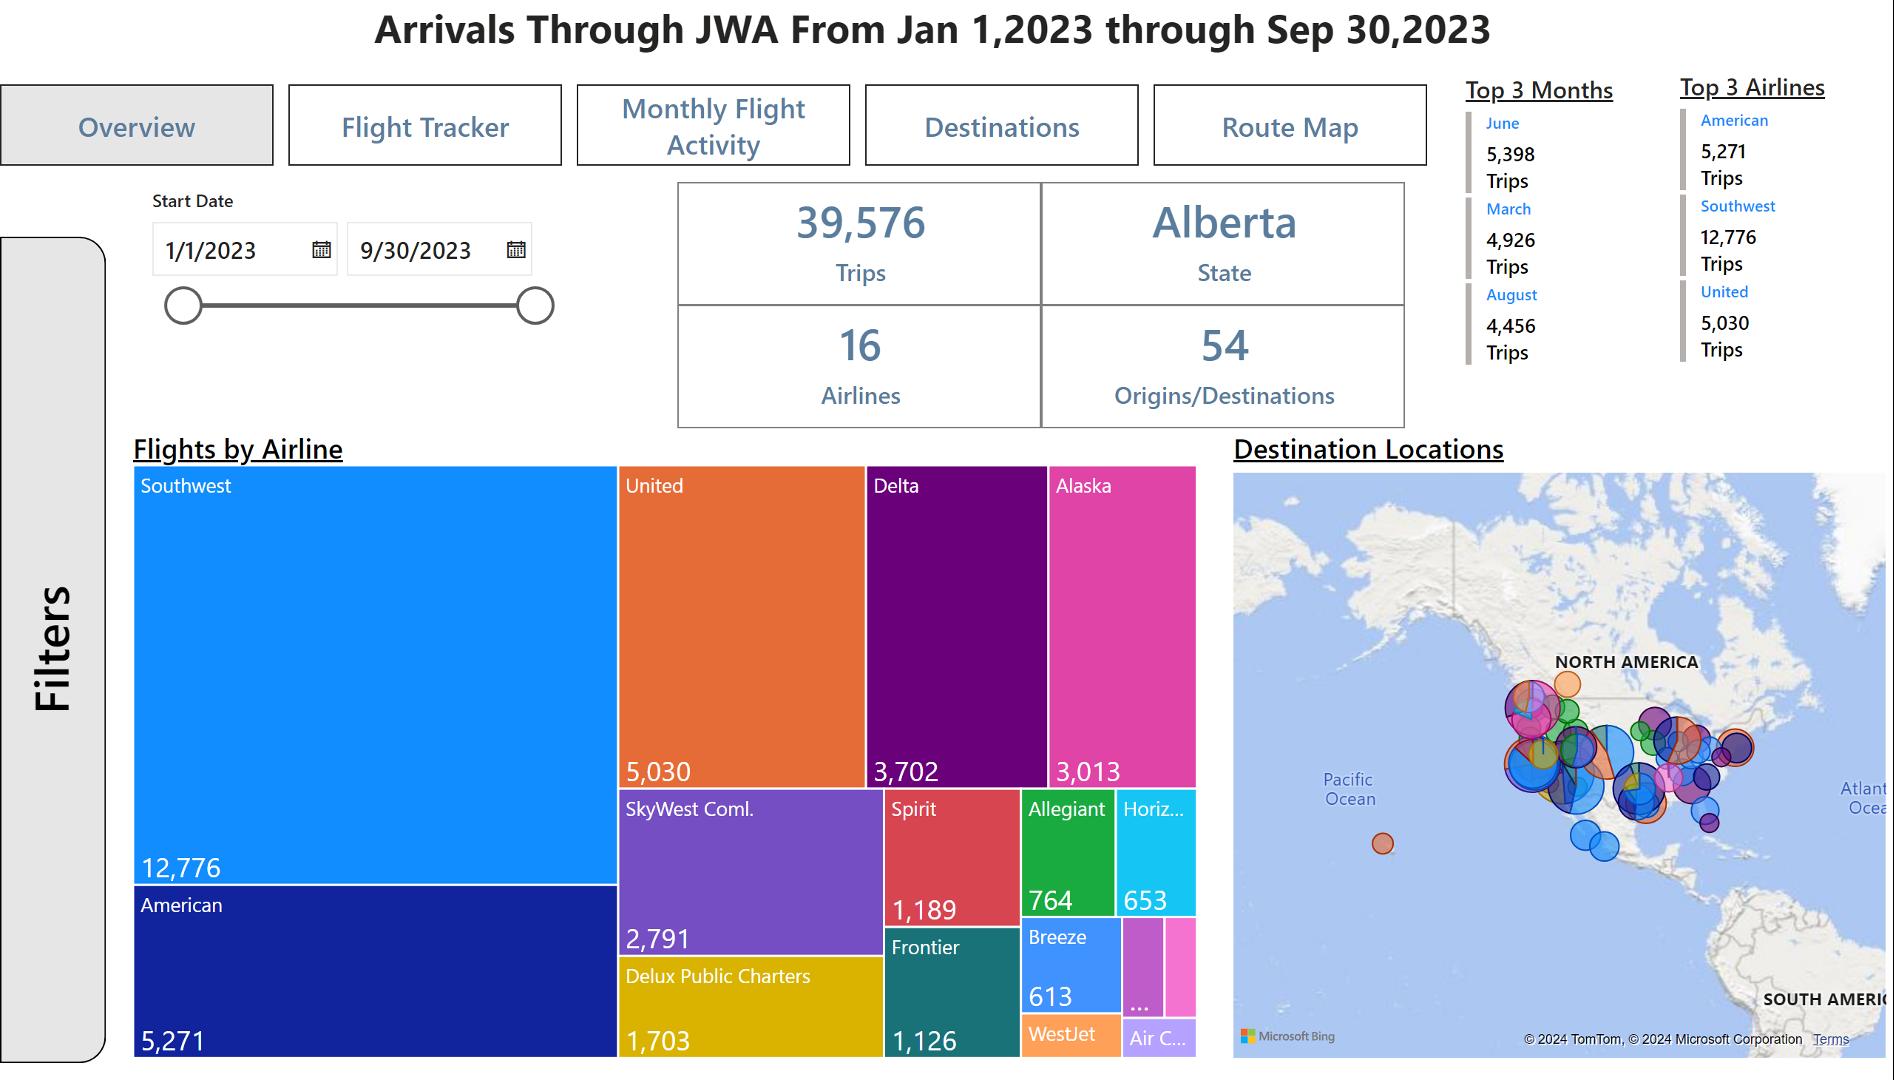
John Wayne Report
• Average Daily Flights
• Airport Throughput
• Passengers Geolocations

Benefit: IndustryAnalytics compiles research, trending data and benchmarks on the status of Tourism and Hospitality market and throughout the US.


An annual analytical review on national DMO sales activity.

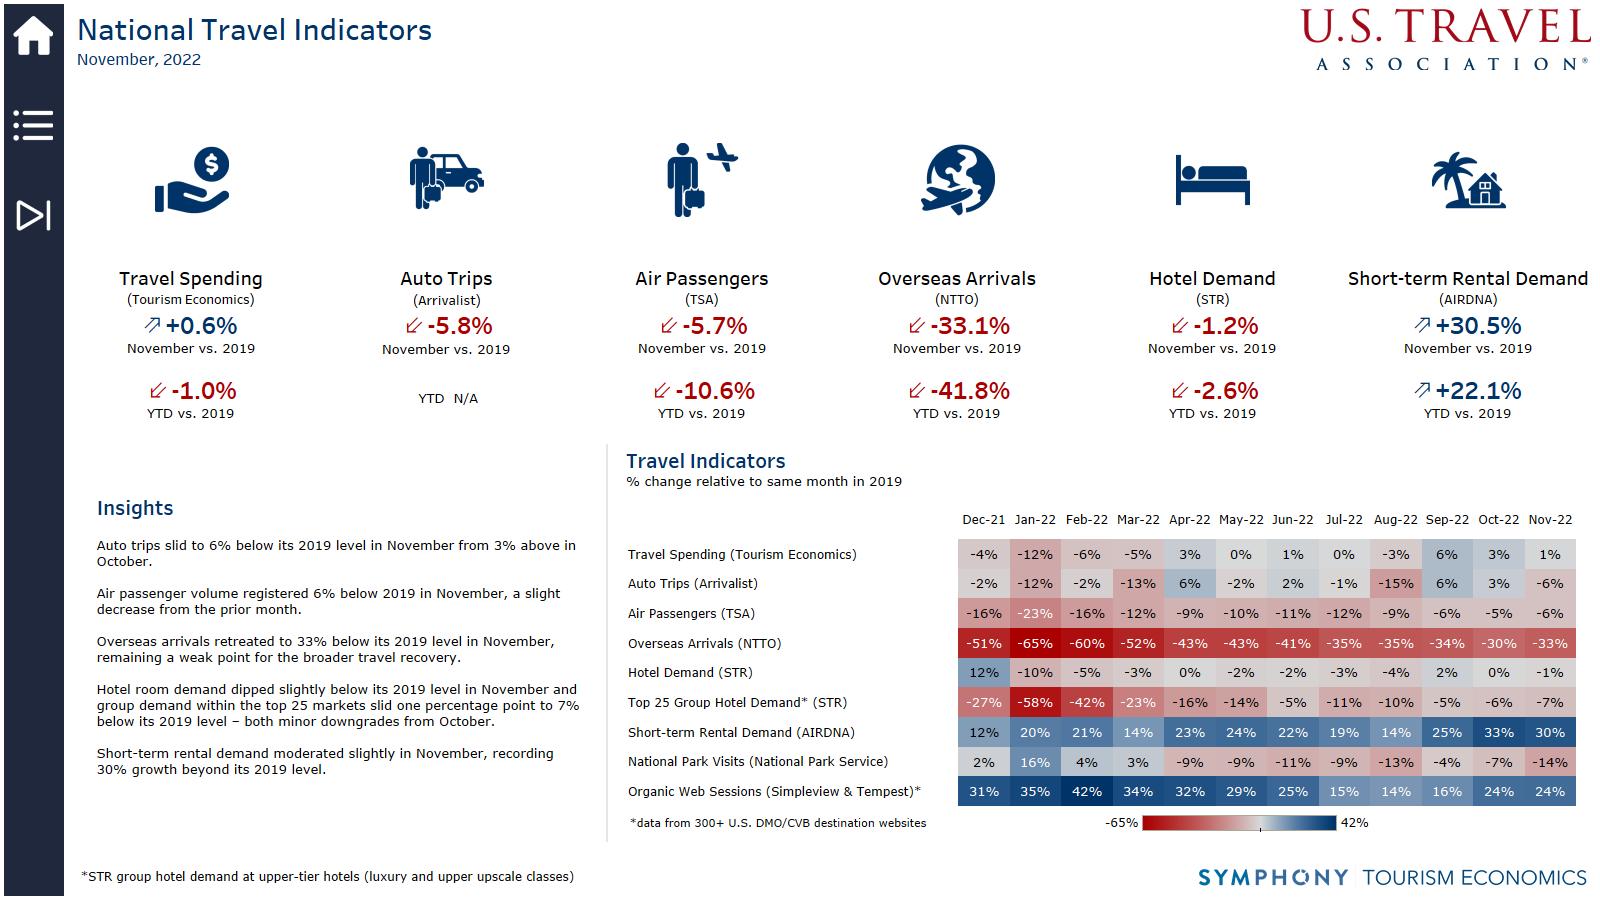
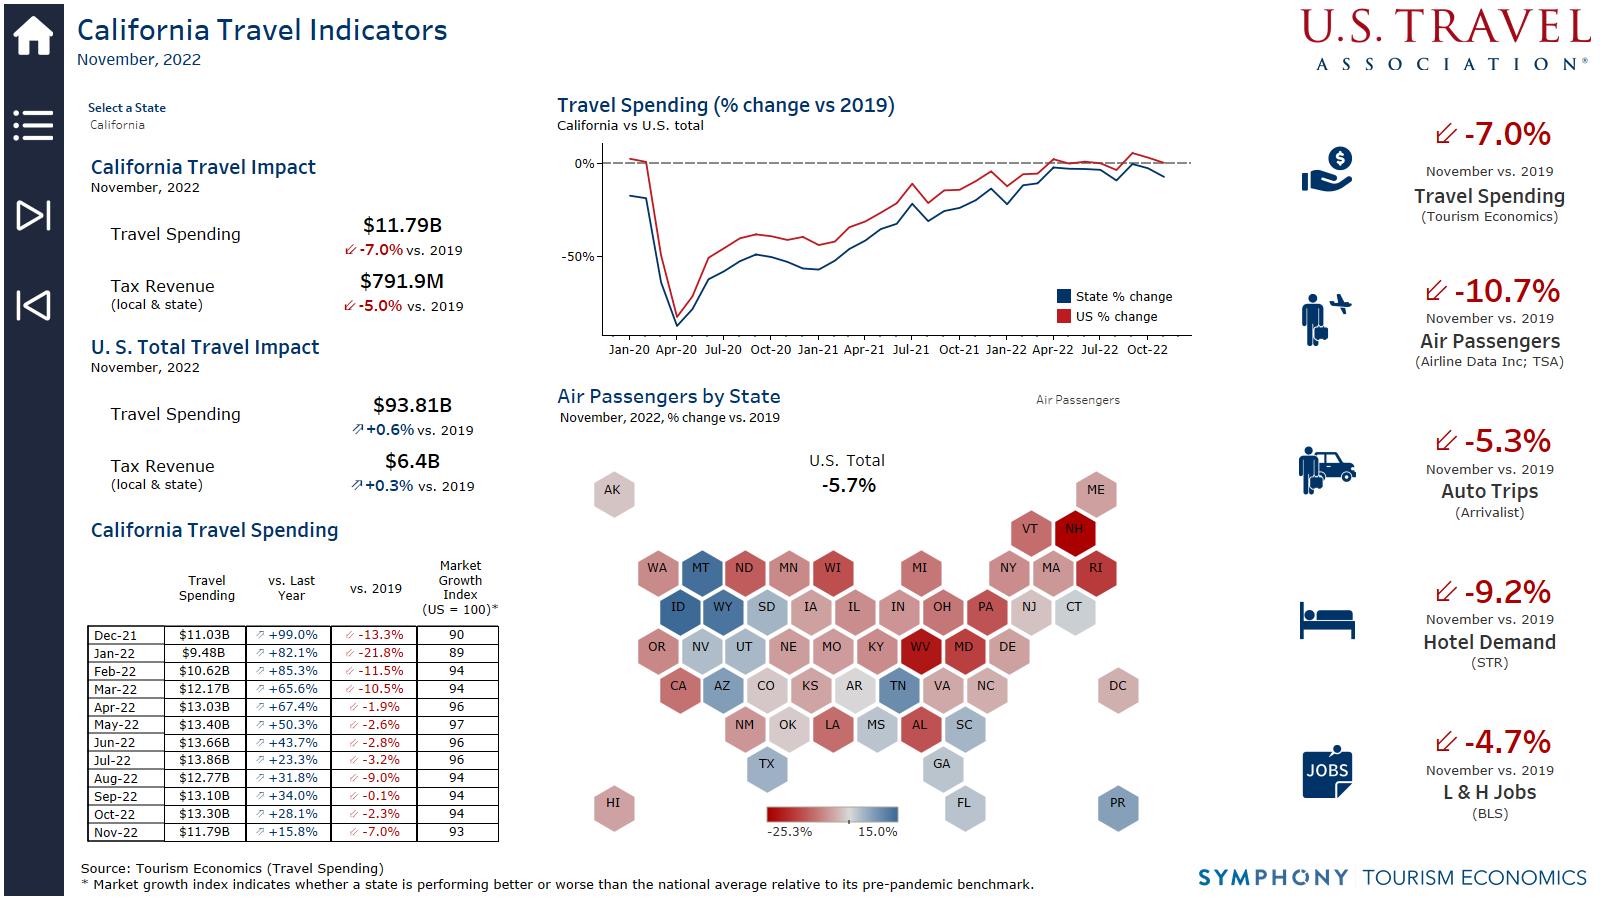
A comprehensive and centralized source for high-frequency intelligence on the U.S. travel industry and the broader economy.

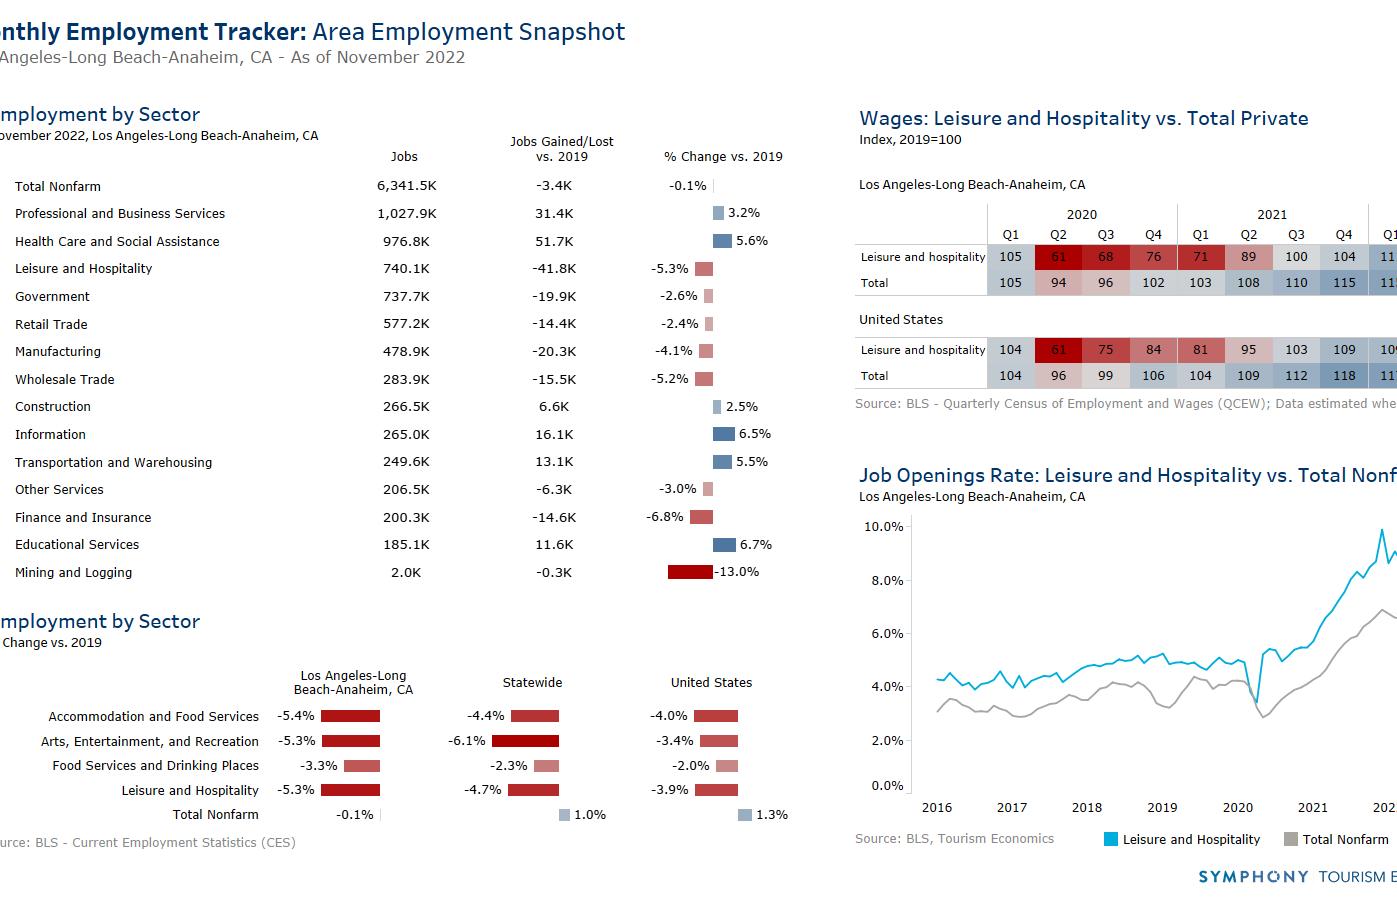
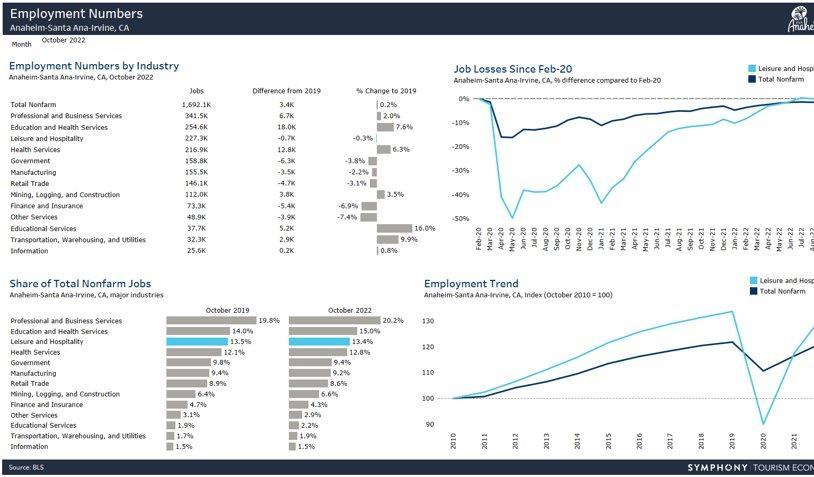
A comprehensive review of employment statistics by geographic location and industry type.
A study of traveler intentions and sentiment. BUSINESS INTELLIGENCE


A forecast of the recovery indicators for the destination.
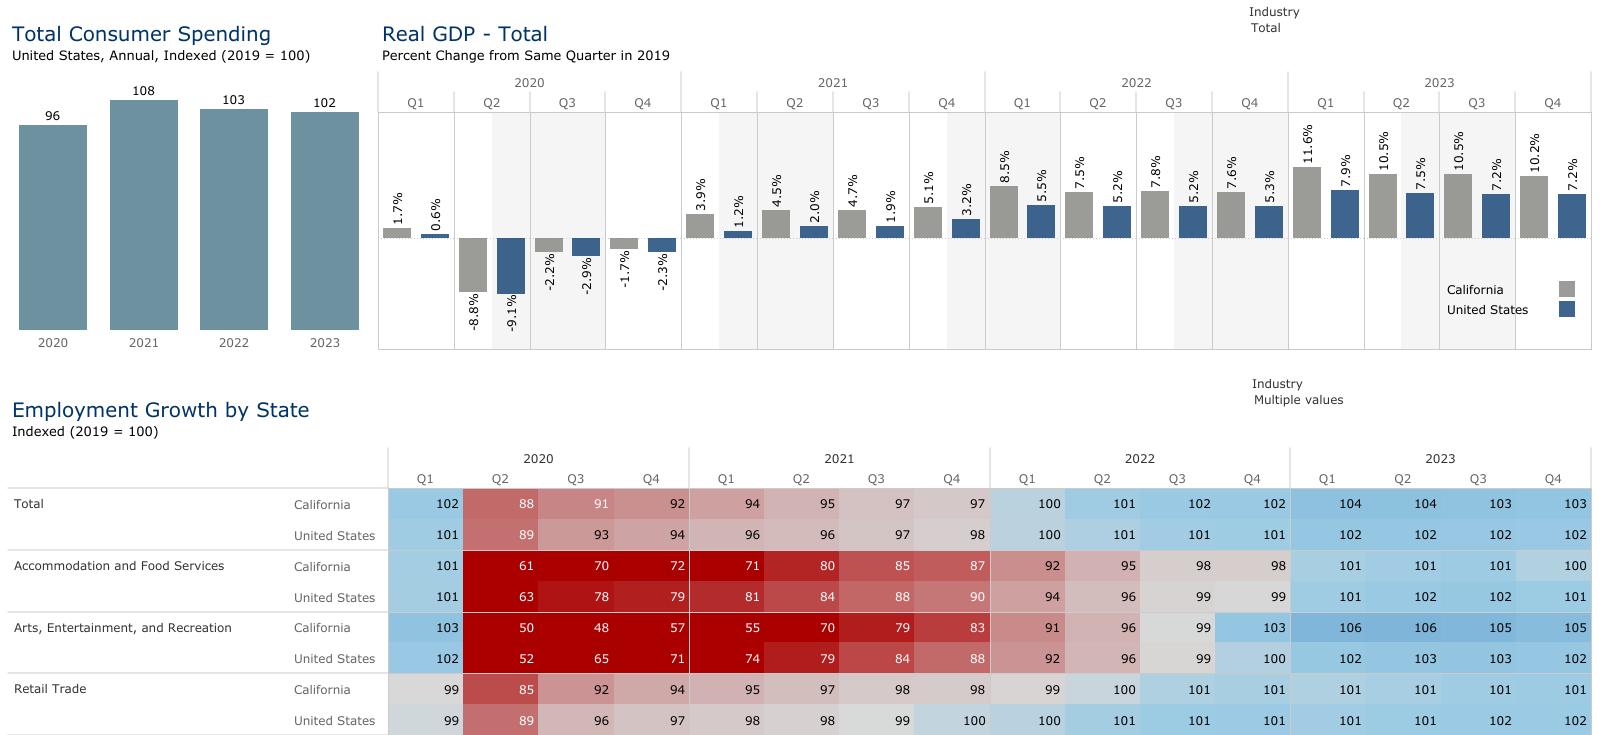
Source: Oxford Economics


A profile of traveler spending type by behavior.
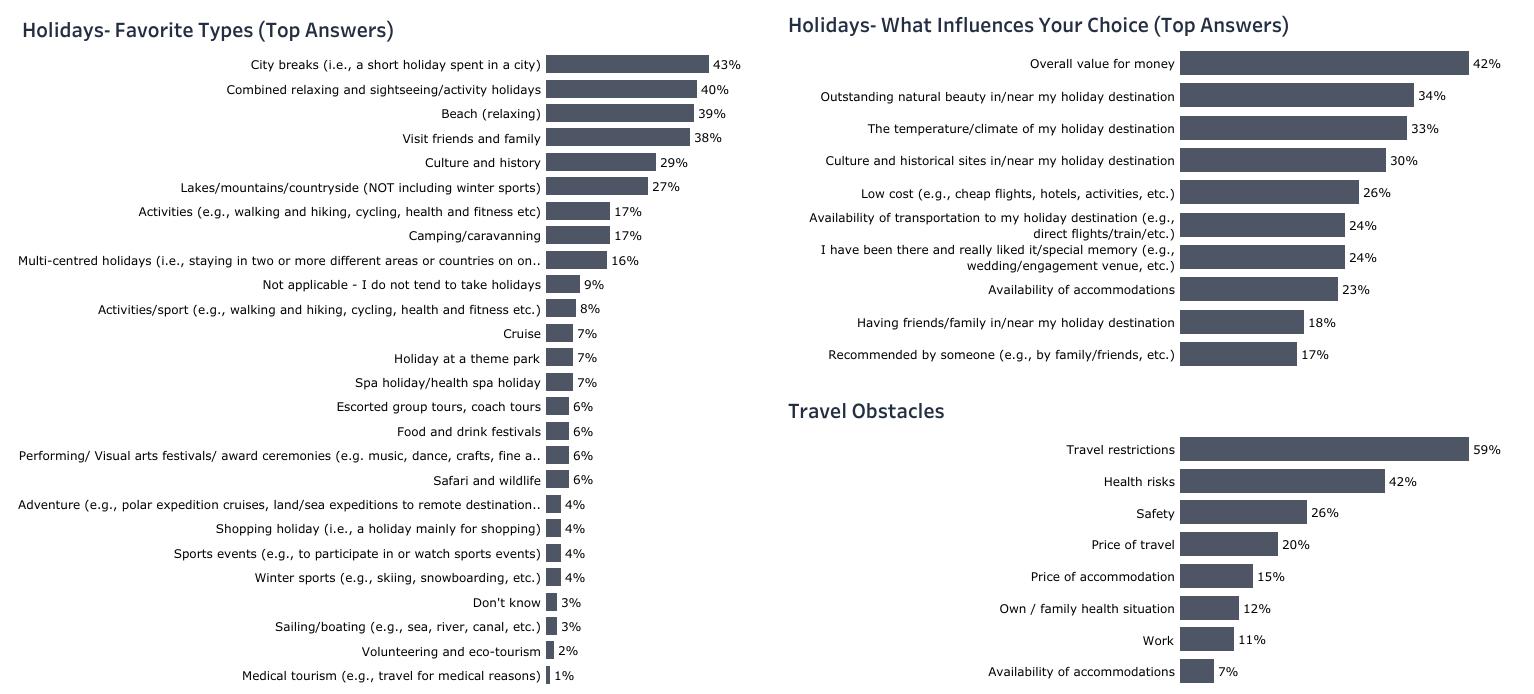
Source: YouGov America Inc.
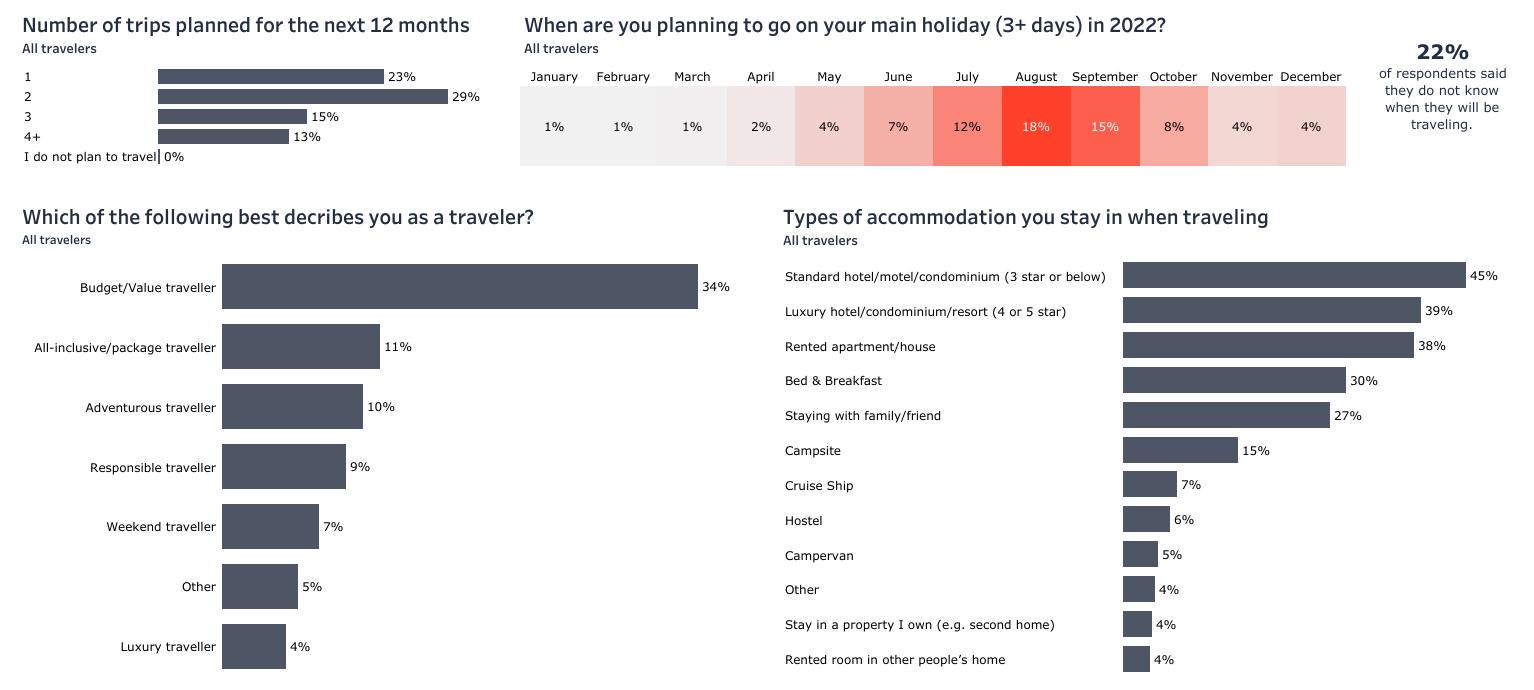
Source: YouGov America Inc.

The National Tourism and Travel Office is the official U.S. government source for travel and tourism statistics.
June 2023
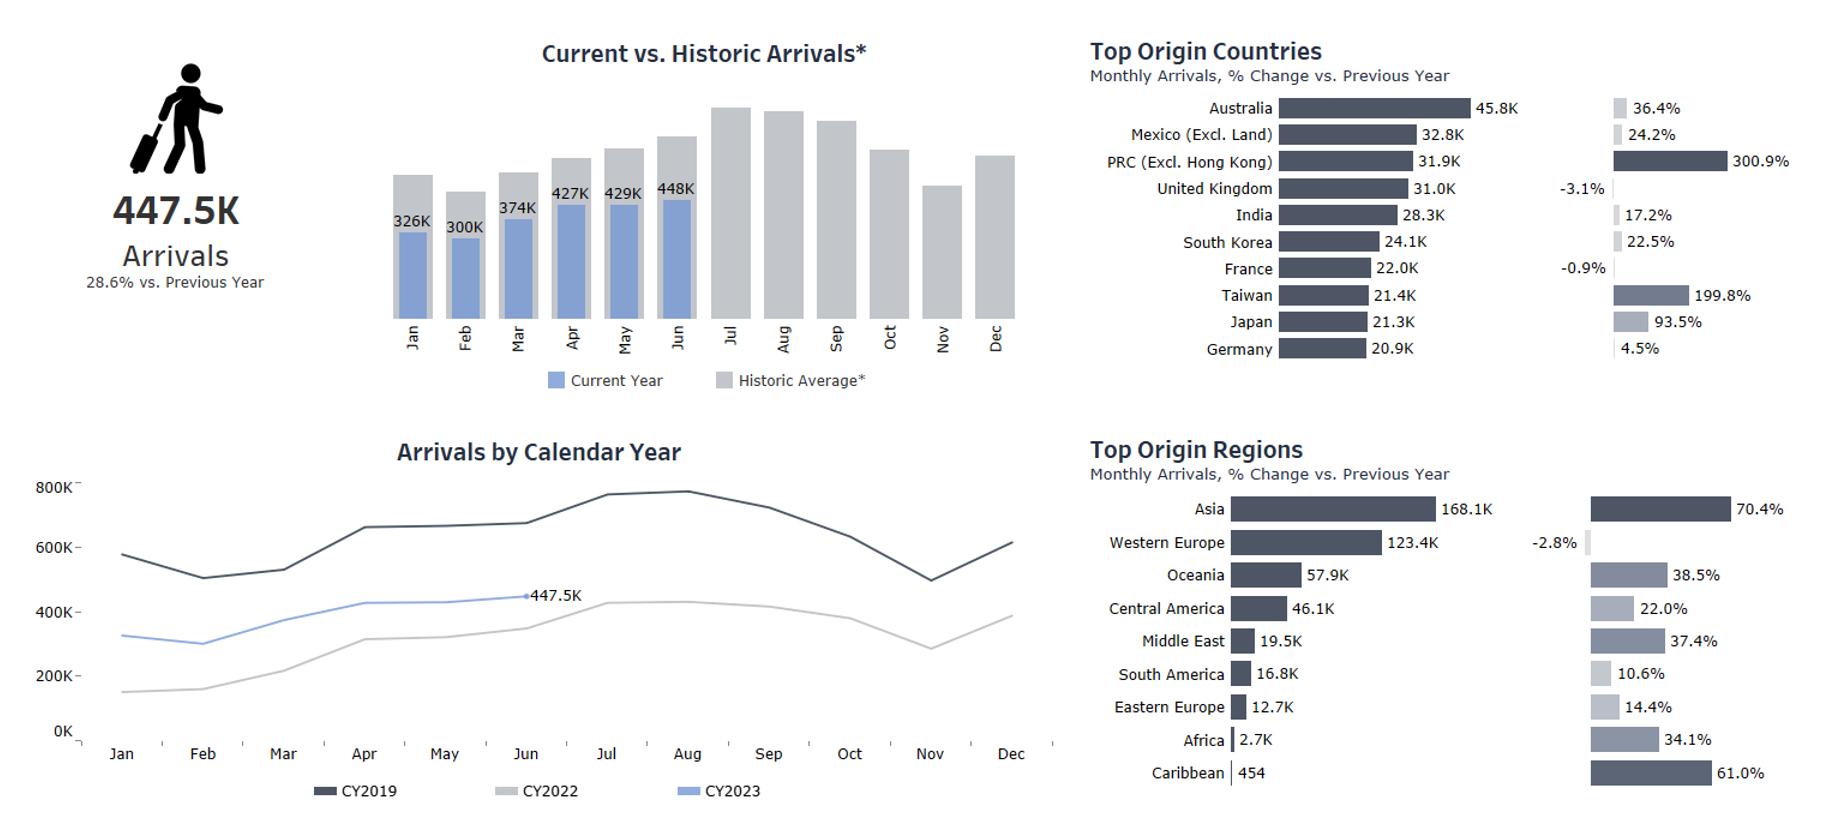
Source: NTTO; History presents the Calendar Year 2012-2019 average.
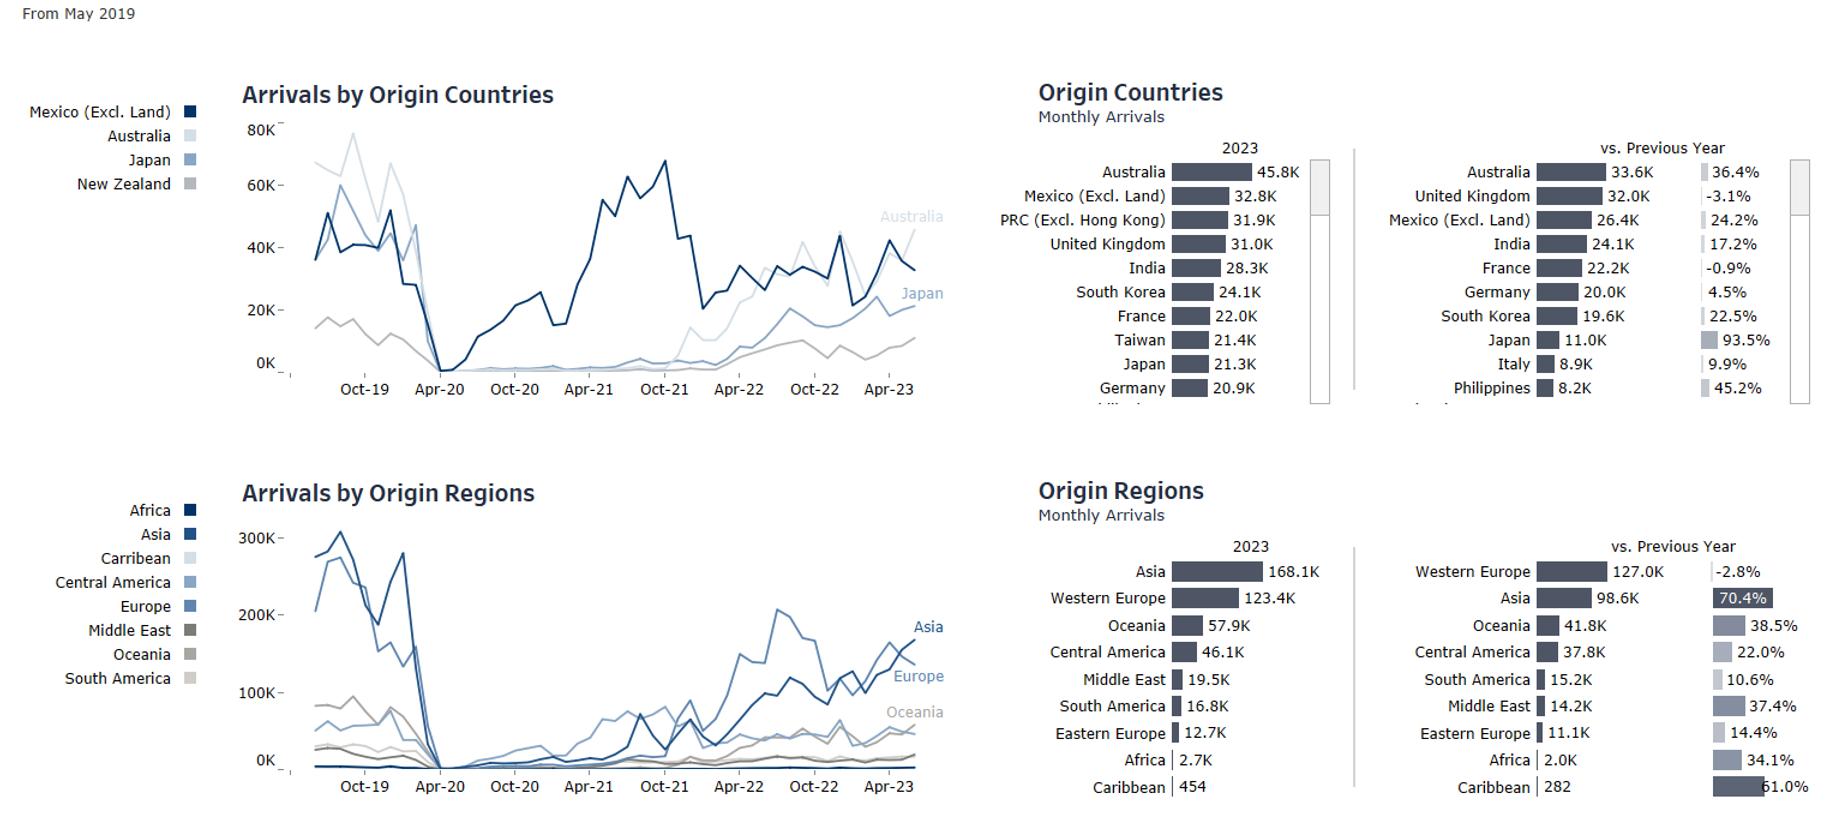
Source: NTTO
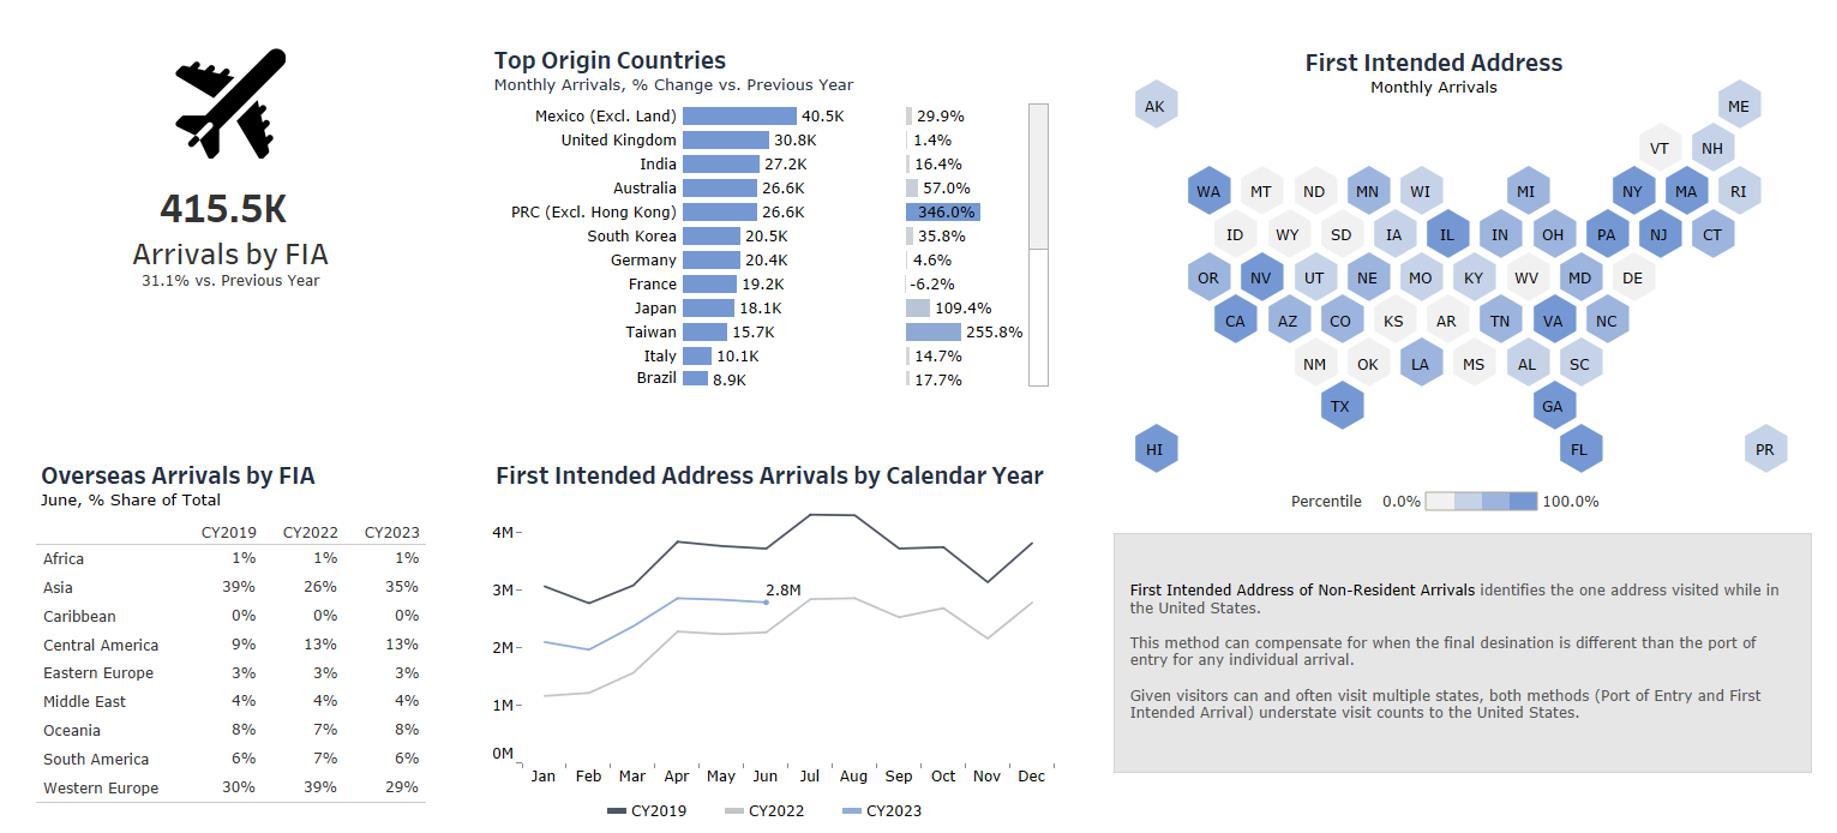
Source: NTTO
TSA data of Airport Throughput by State and Airport, geolocations of passengers, and average number of daily non-stop flights.
Source: NTTO
Our Market and Lodging Analytics empower partners with the tools to assess and refine their selling strategies.

By analyzing marketplace trends and lodging data, including competitive set comparisons, you can identify opportunities and optimize your approach for greater effectiveness in a dynamic market.
Reports Included:
• STR/Costar Report
• YOY/MOM Market Performance
• STR/Costar Data Trending
• Occupancy
• ADR
• RevPAR
• Room Nights
• Revenue
• STR/Costar Comp Set
• Occupancy
• ADR
• RevPAR
• Room Nights
• Revenue
• STR/Costar Submarkets
• Occupancy
• ADR
• RevPAR
• Room Nights
• Revenue
• STR/Costar Submarkets
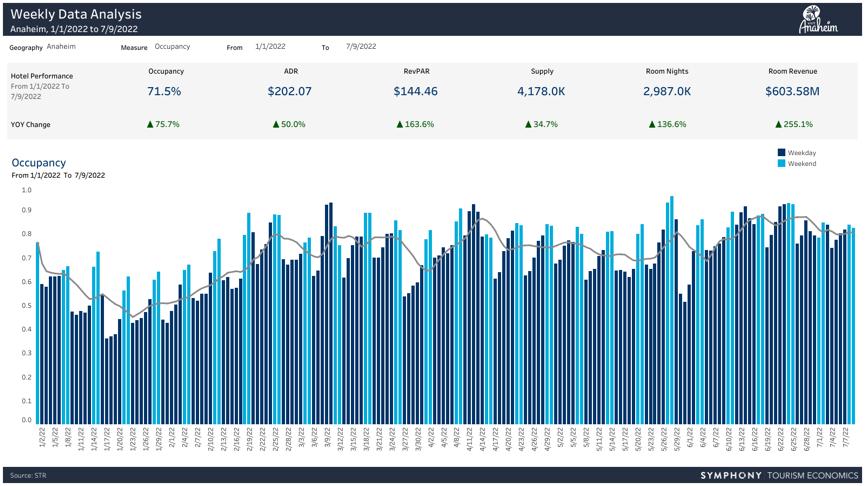
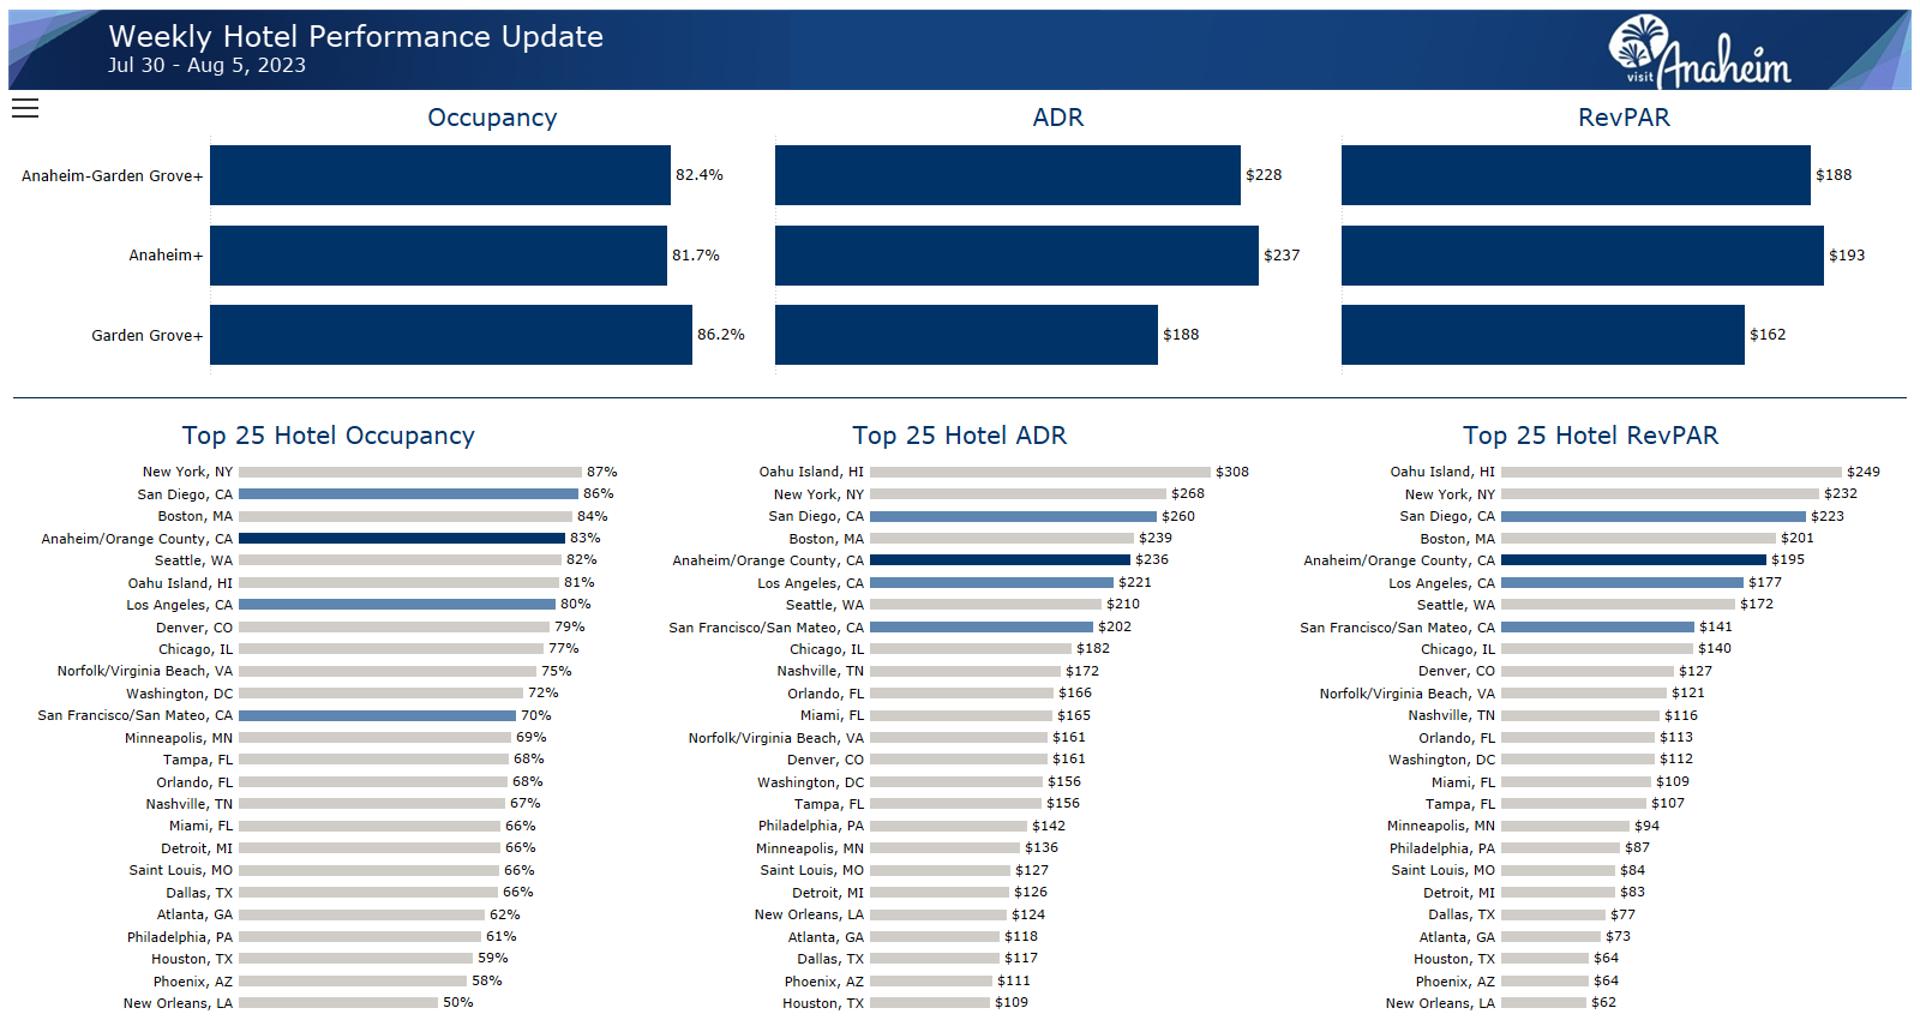
• Weekly Hotel Performance
• Weekly Demand & Average Rates
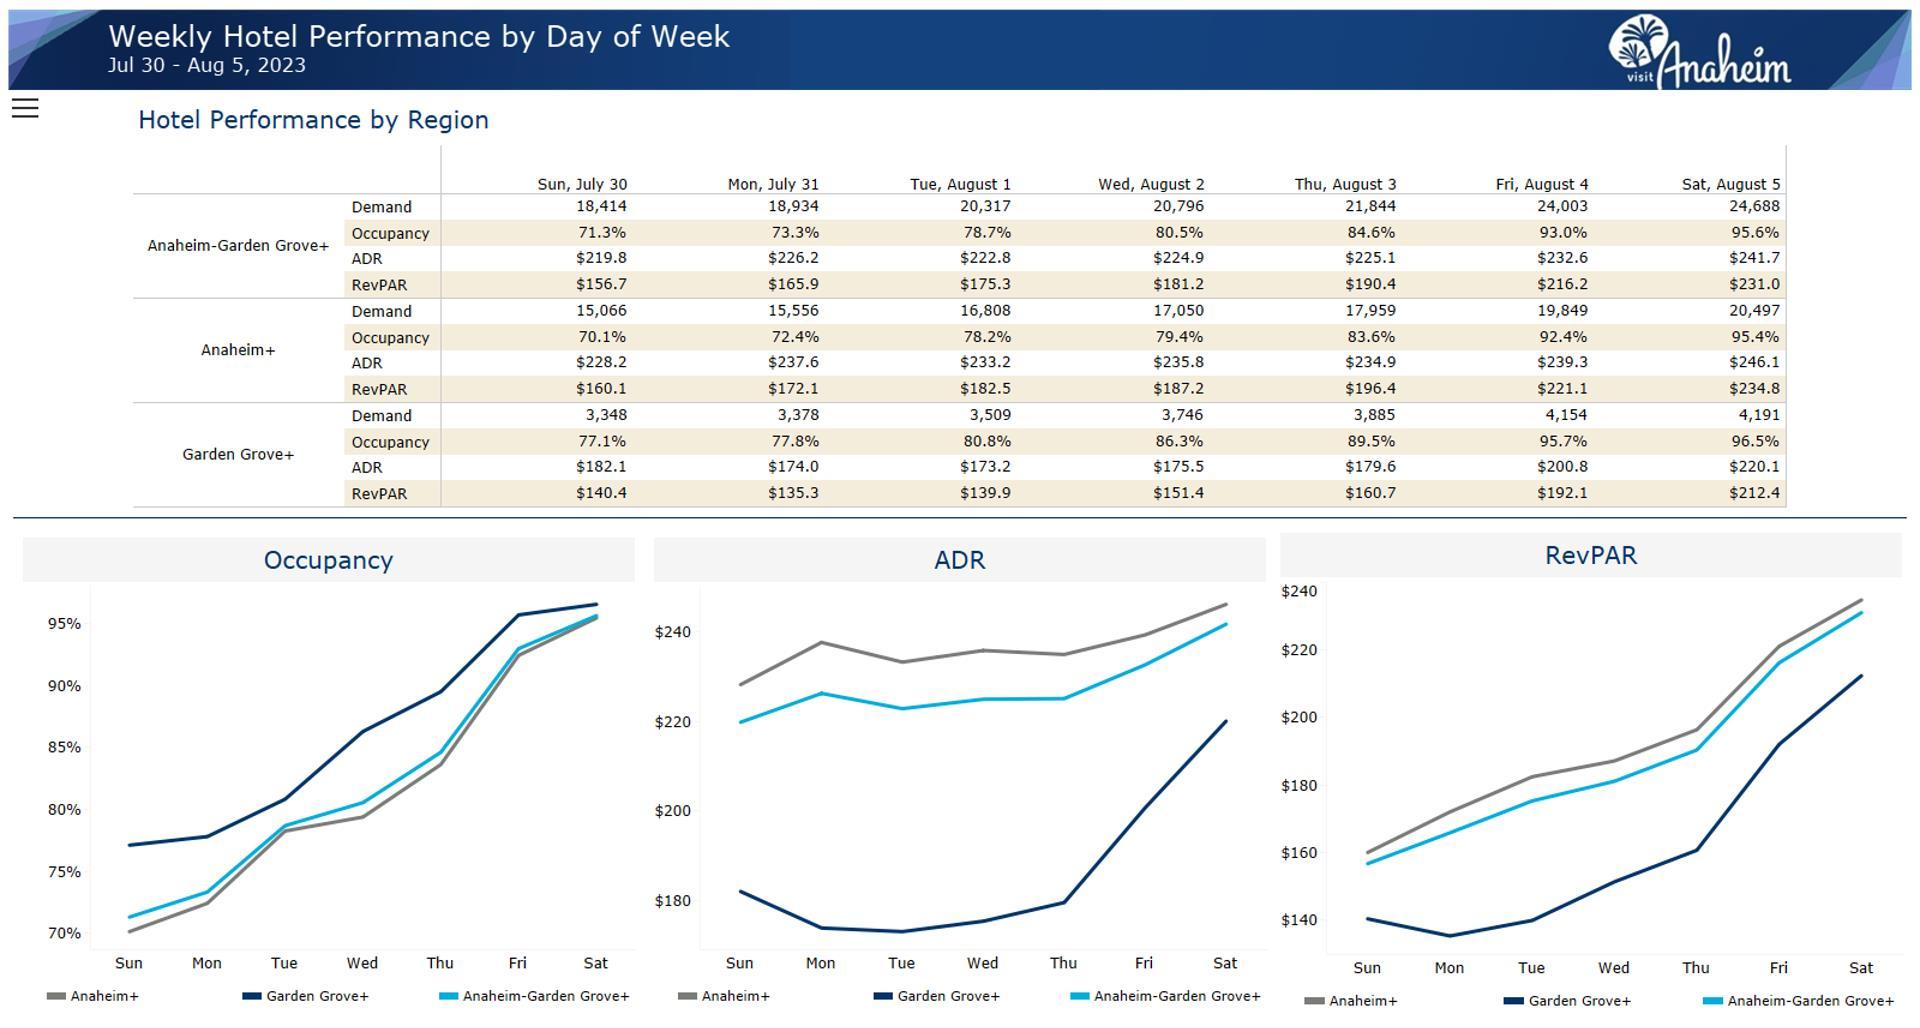
• Day of Week Details
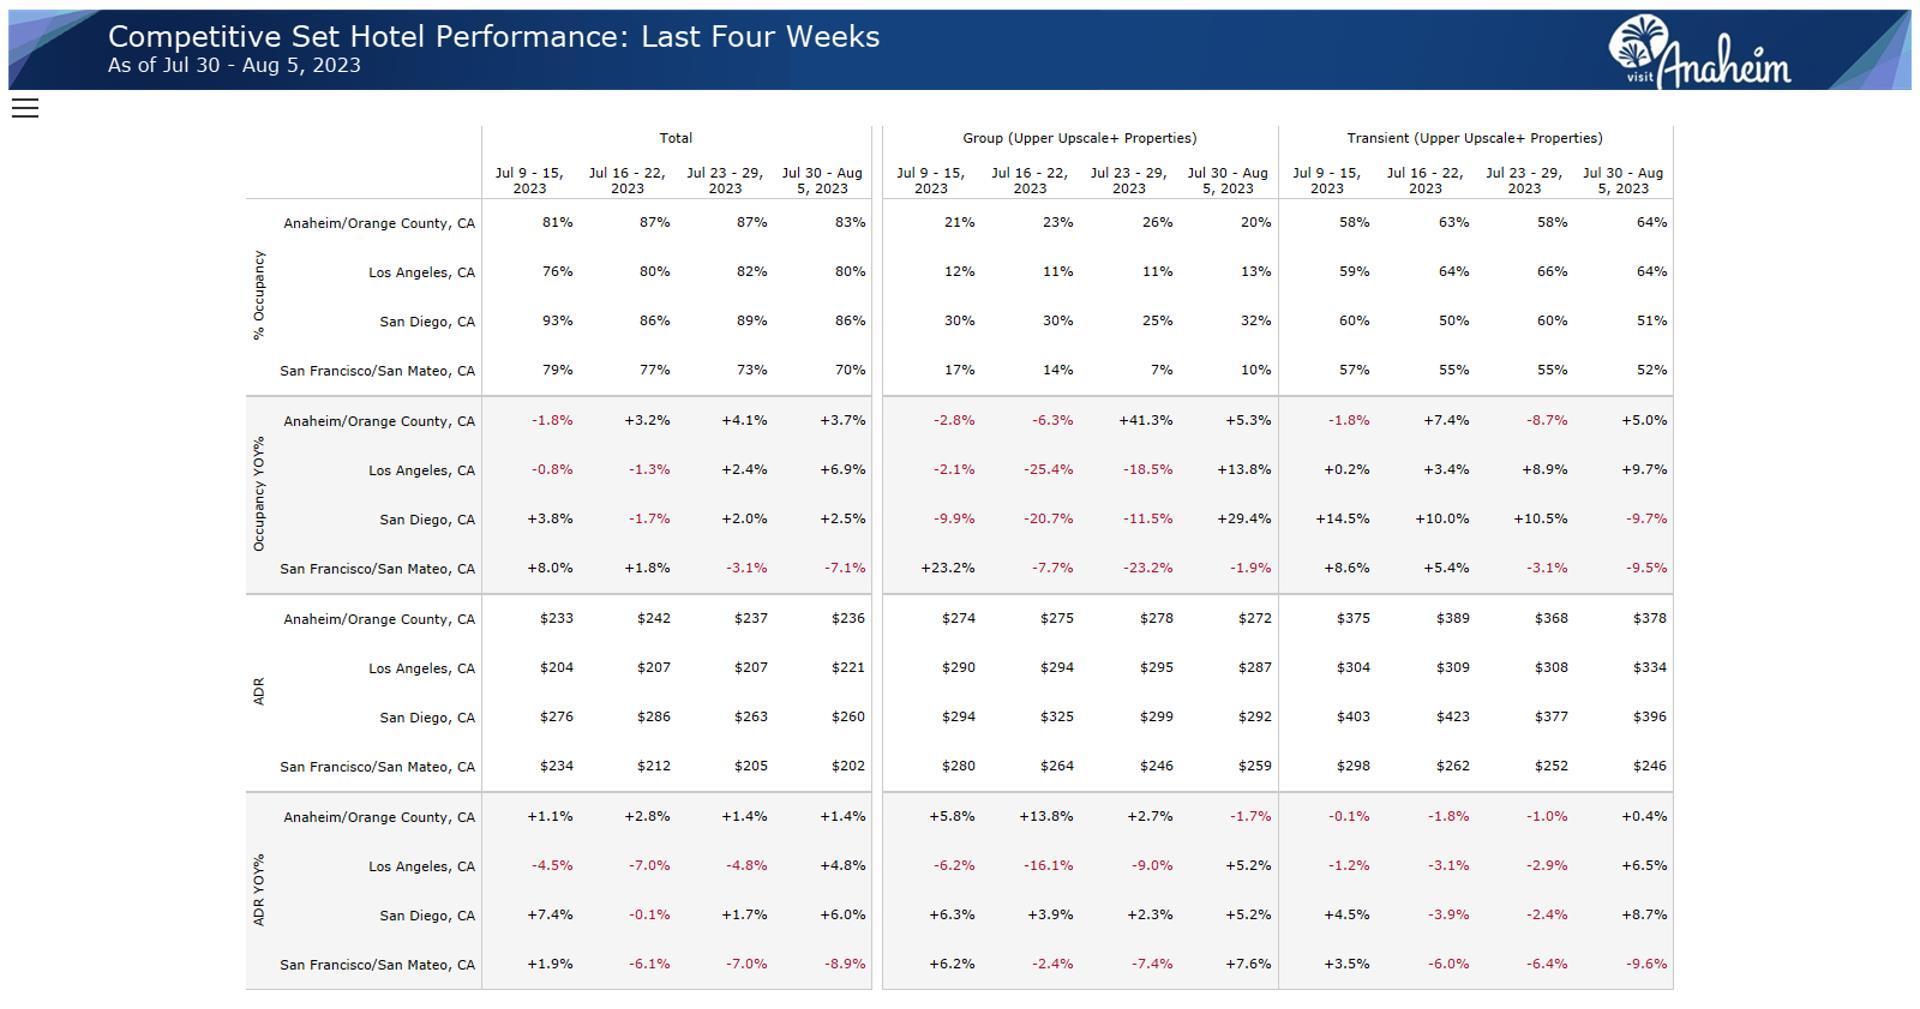
• Competitive Set
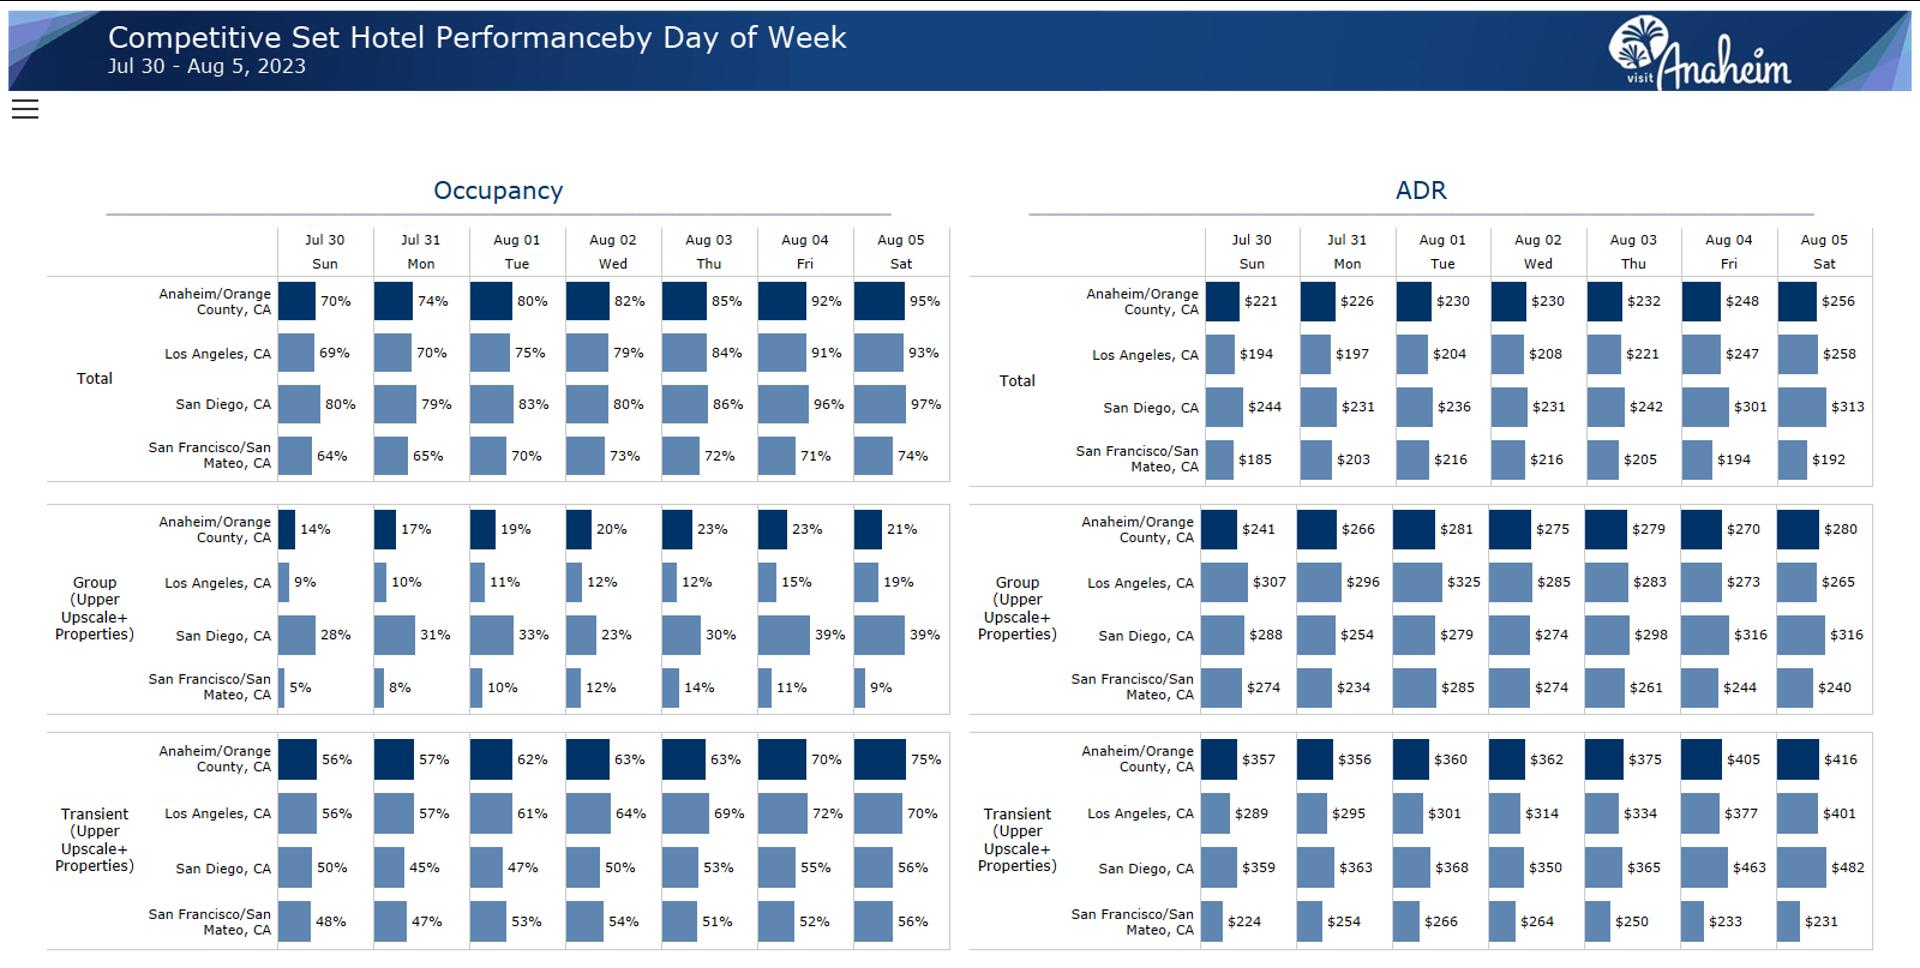
• Competitive Set, Day of week
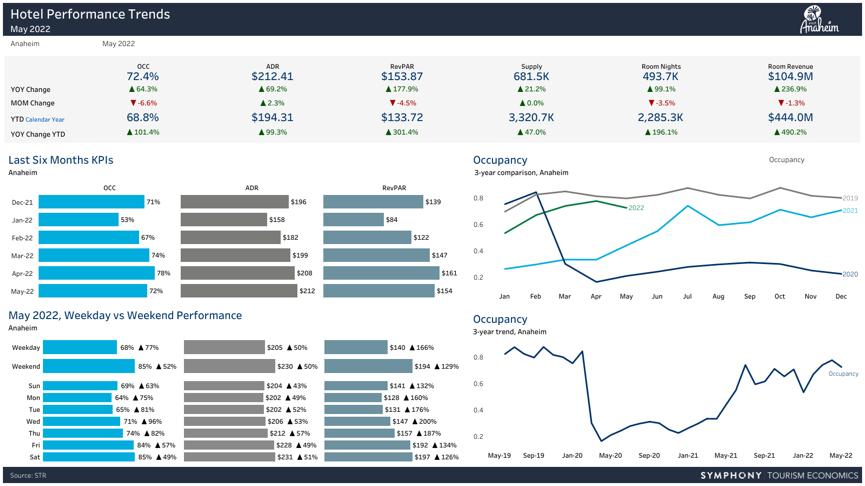
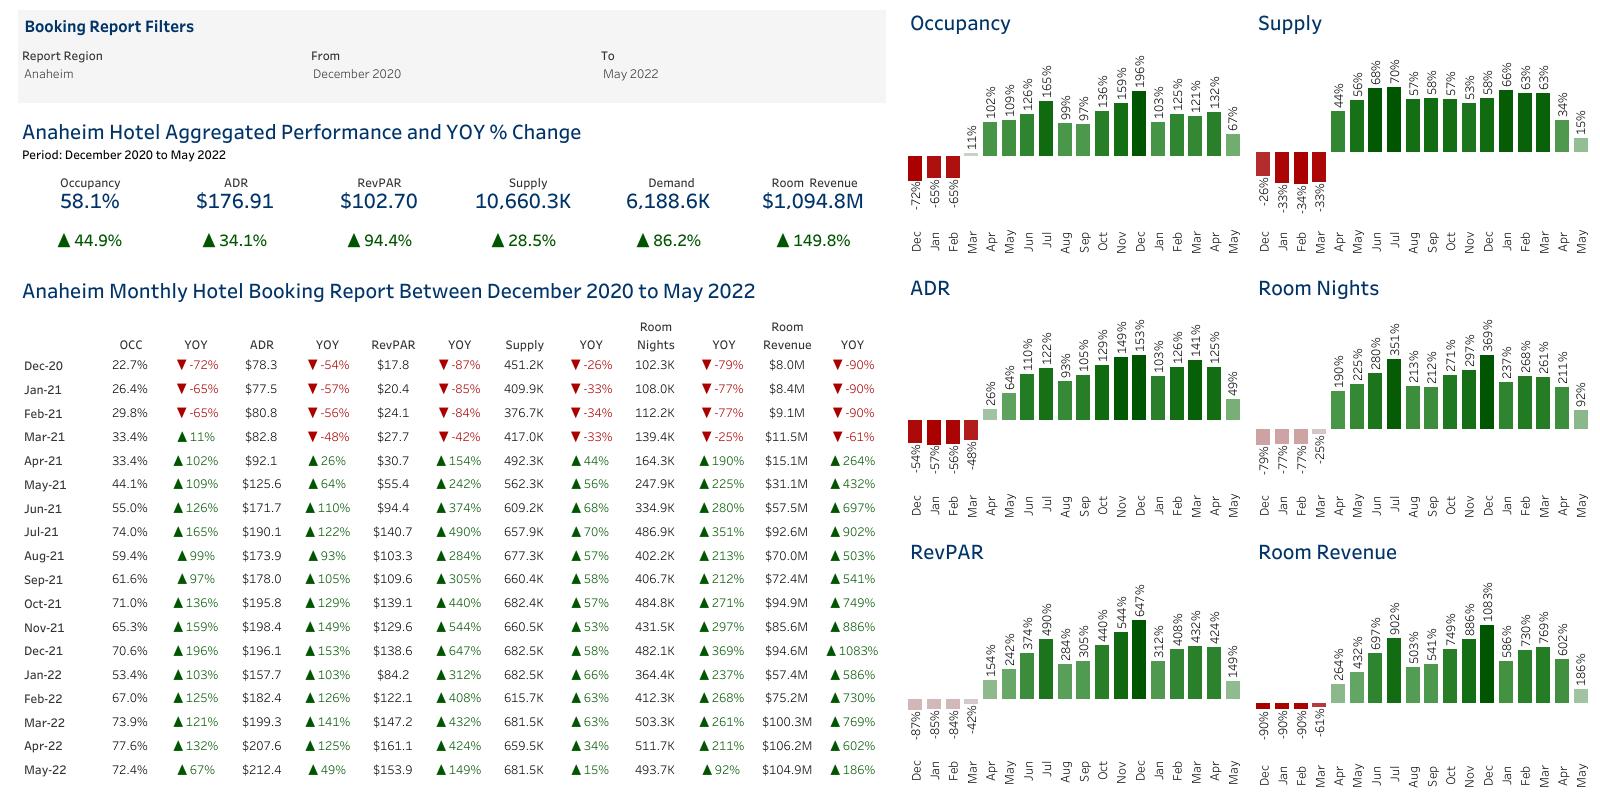
Benefit: Allows partners to have an in-depth review of how hotels are performing in their area. These reports provide a comprehensive overview of ADR, Occupancy, RevPAR, Room Nights and Revenue.

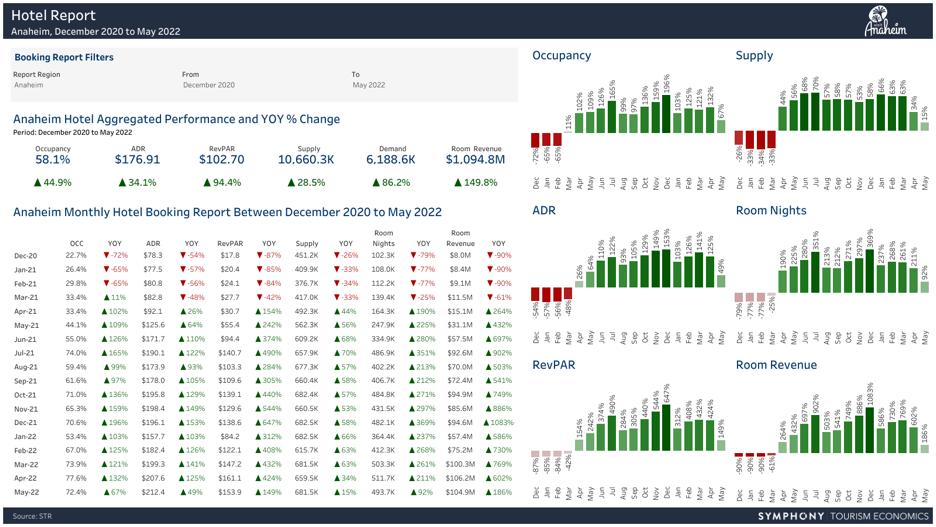
Current hotel performance for Anaheim and Garden Grove.
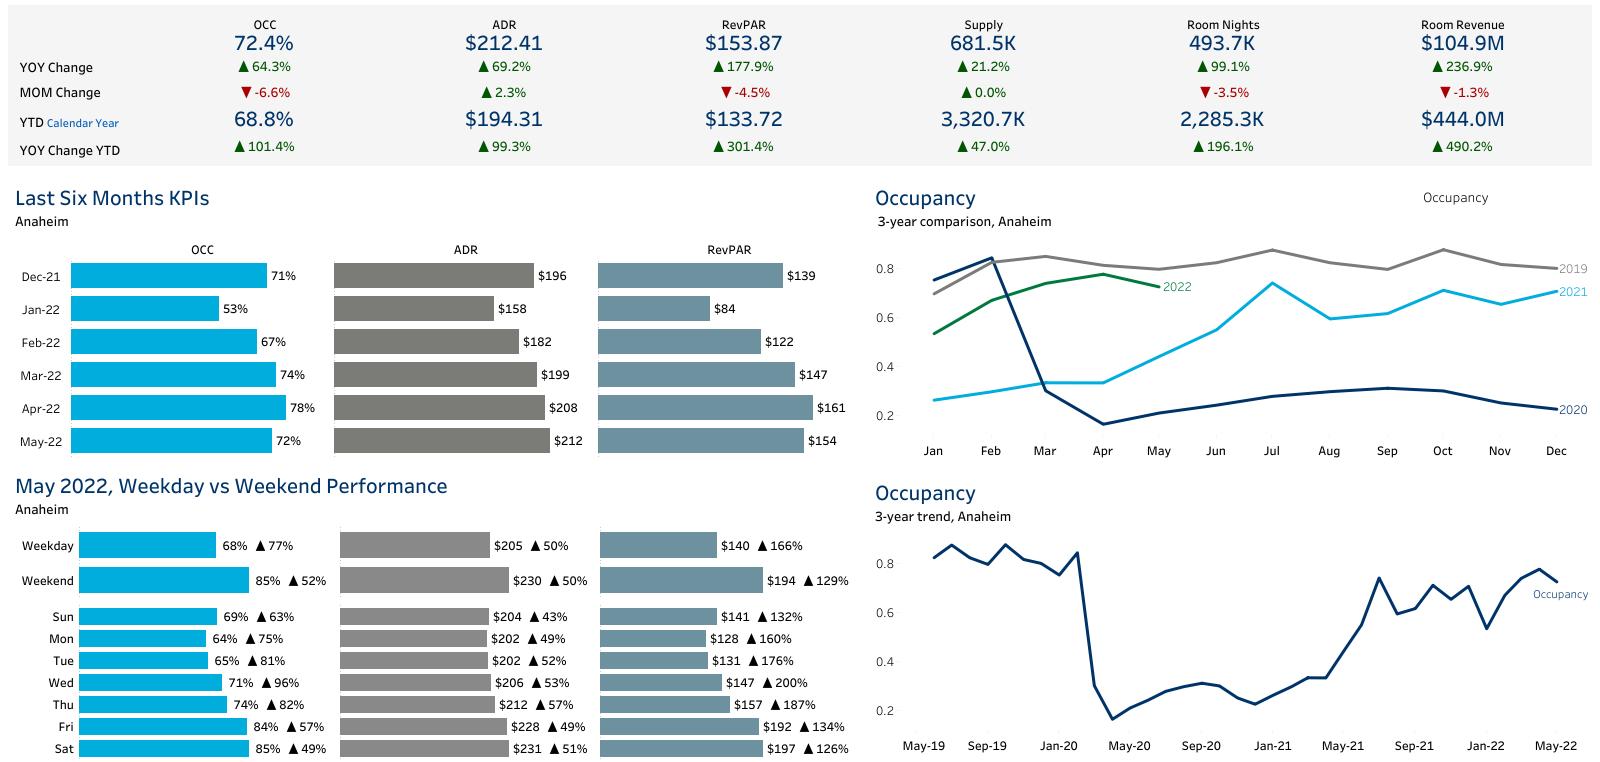
Source: STR


In-depth historical trending for Anaheim and Garden Grove’s hotel performance.
Source: STR
Source: STR
Source: STR

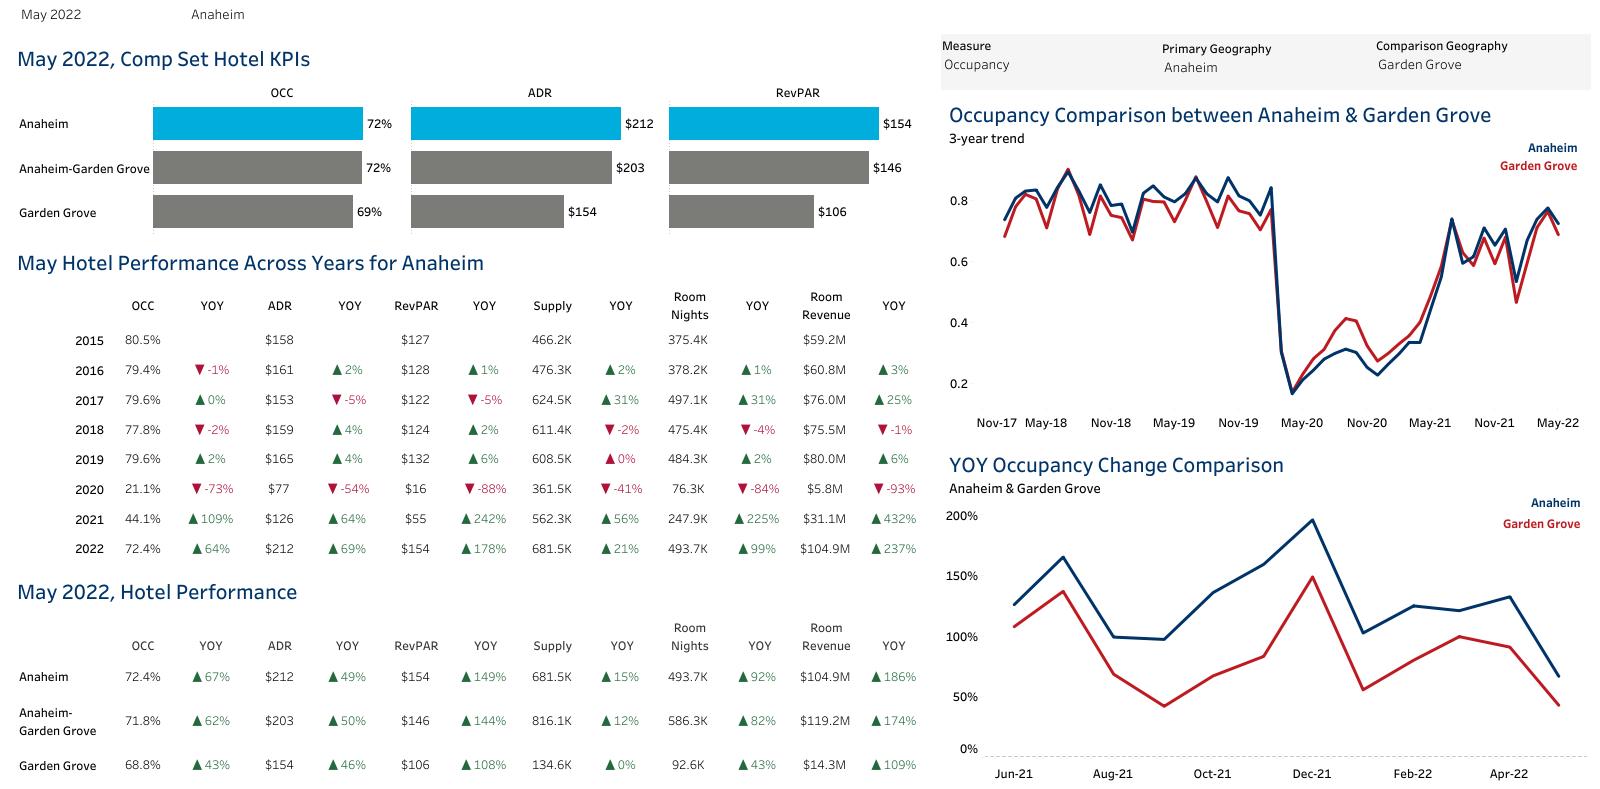
Review of competitive set destinations and their current market hotel performance.
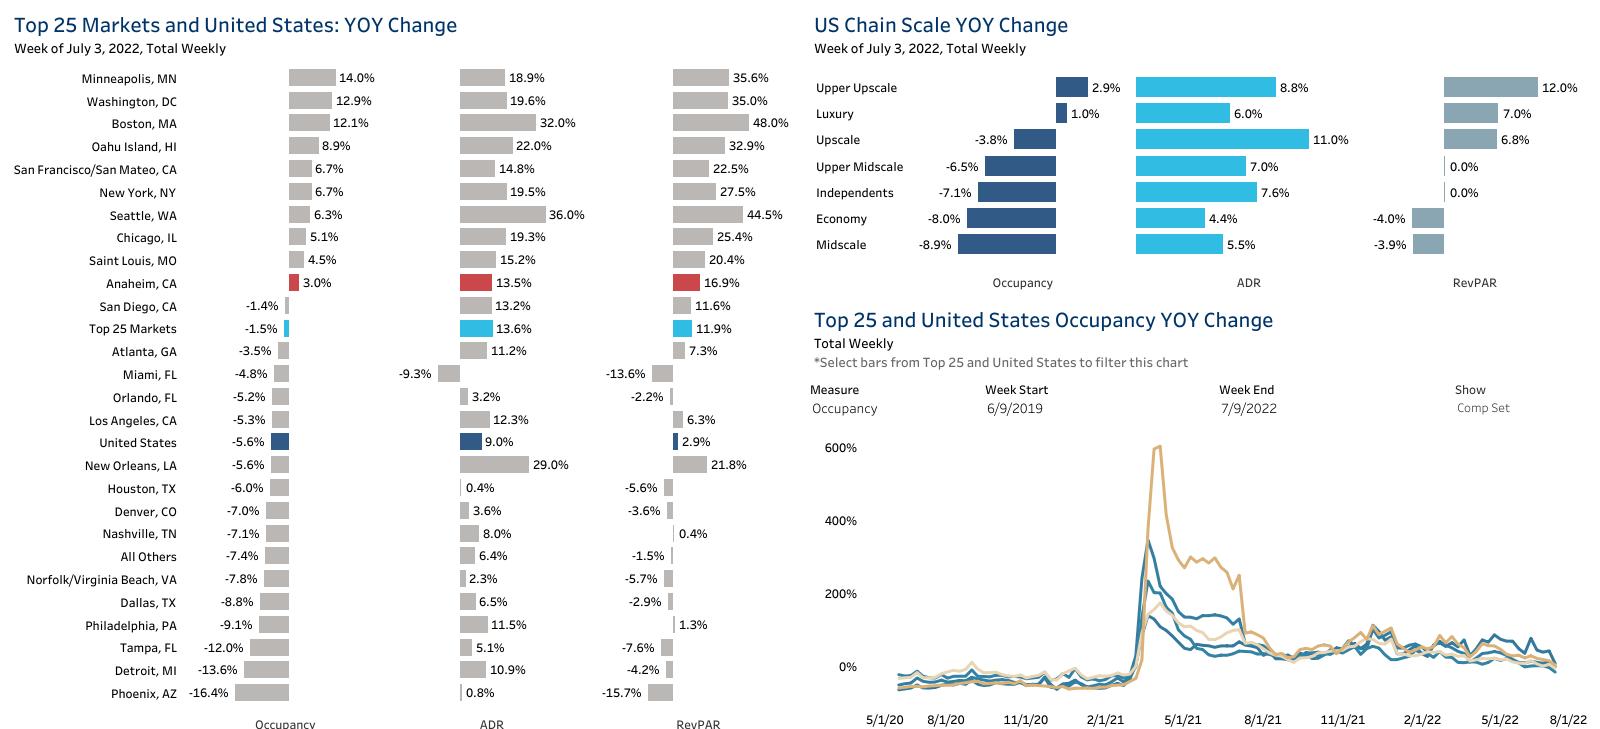
Source: STR
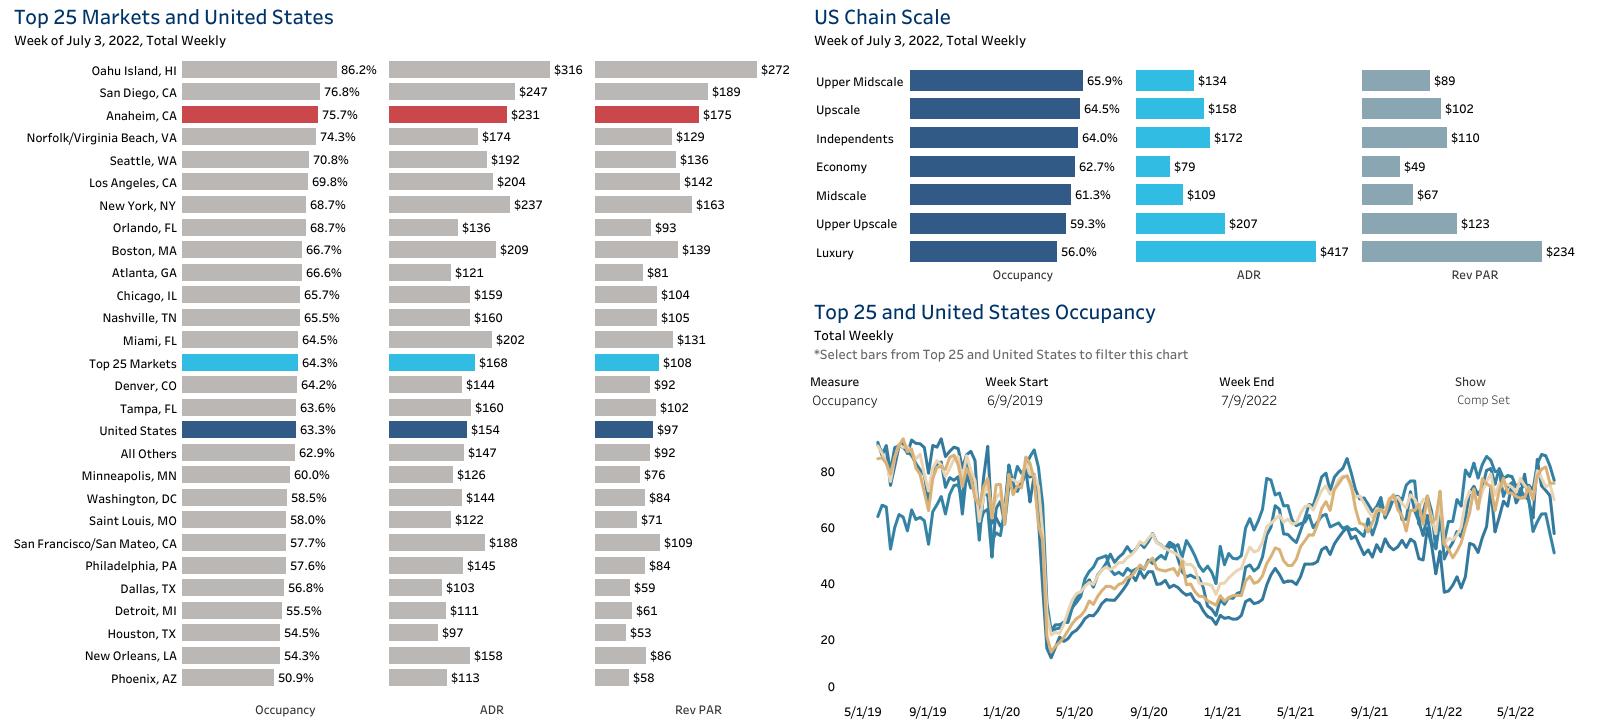
Source: STR

Review of submarkets and their current market hotel performance.
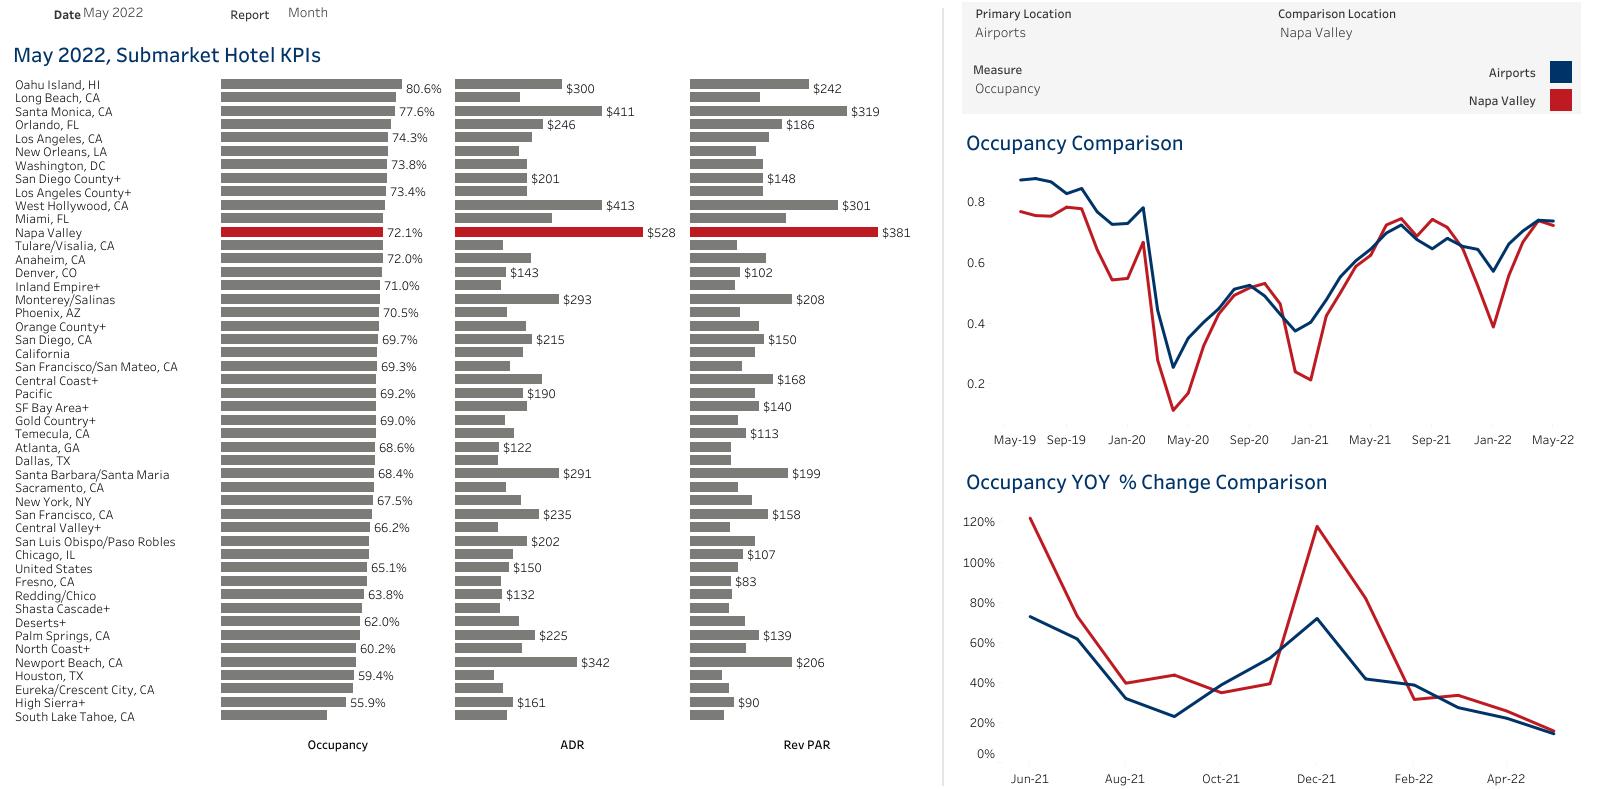
Source: STR

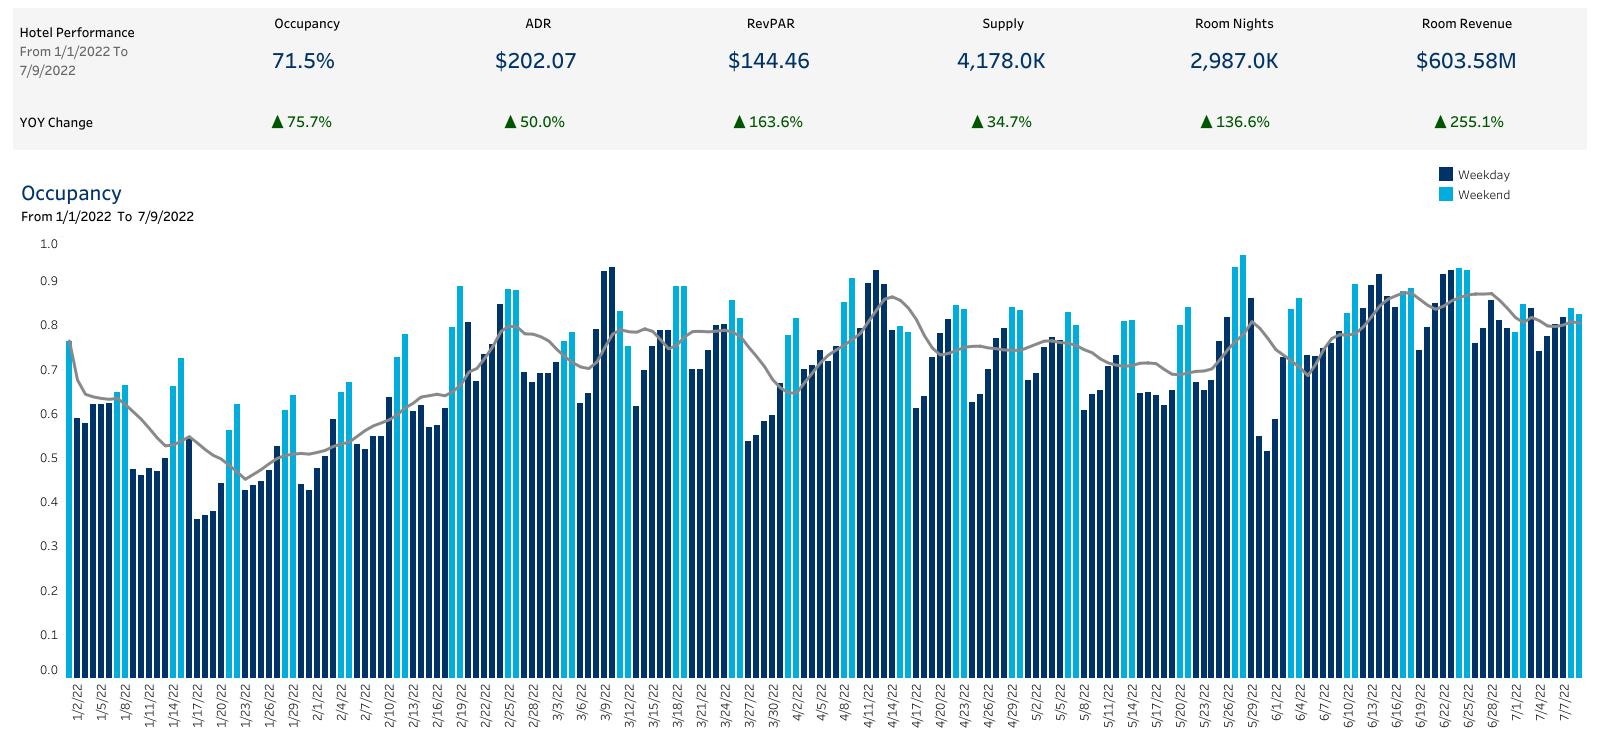
In-depth historical trending for Anaheim and Garden Grove’s hotel performance on a weekly basis.
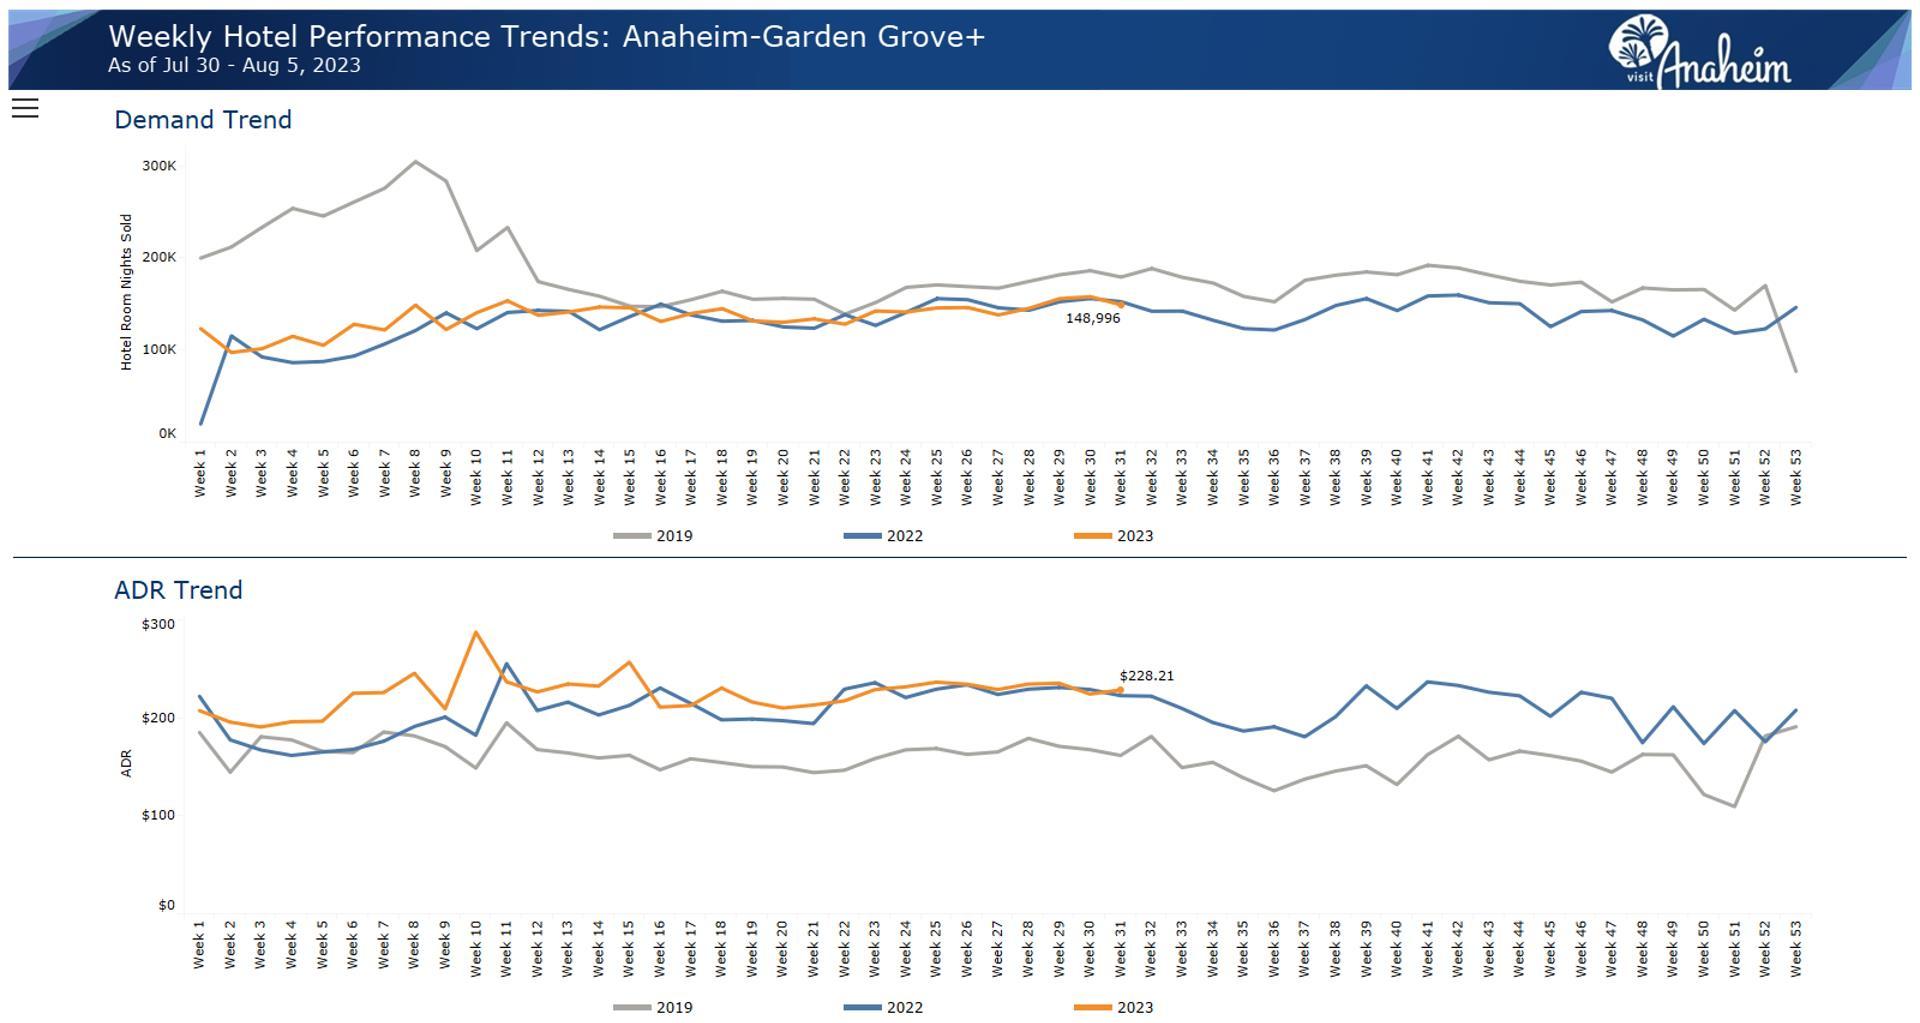
Source: STR
Source: STR
Source: STR
Source: STR
Source: STR
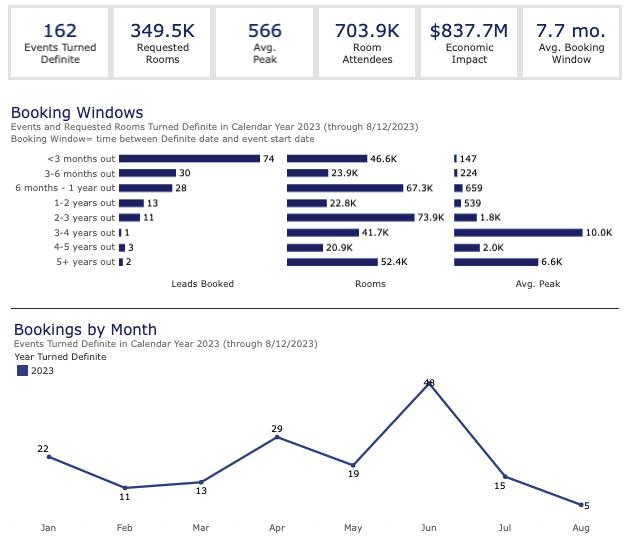
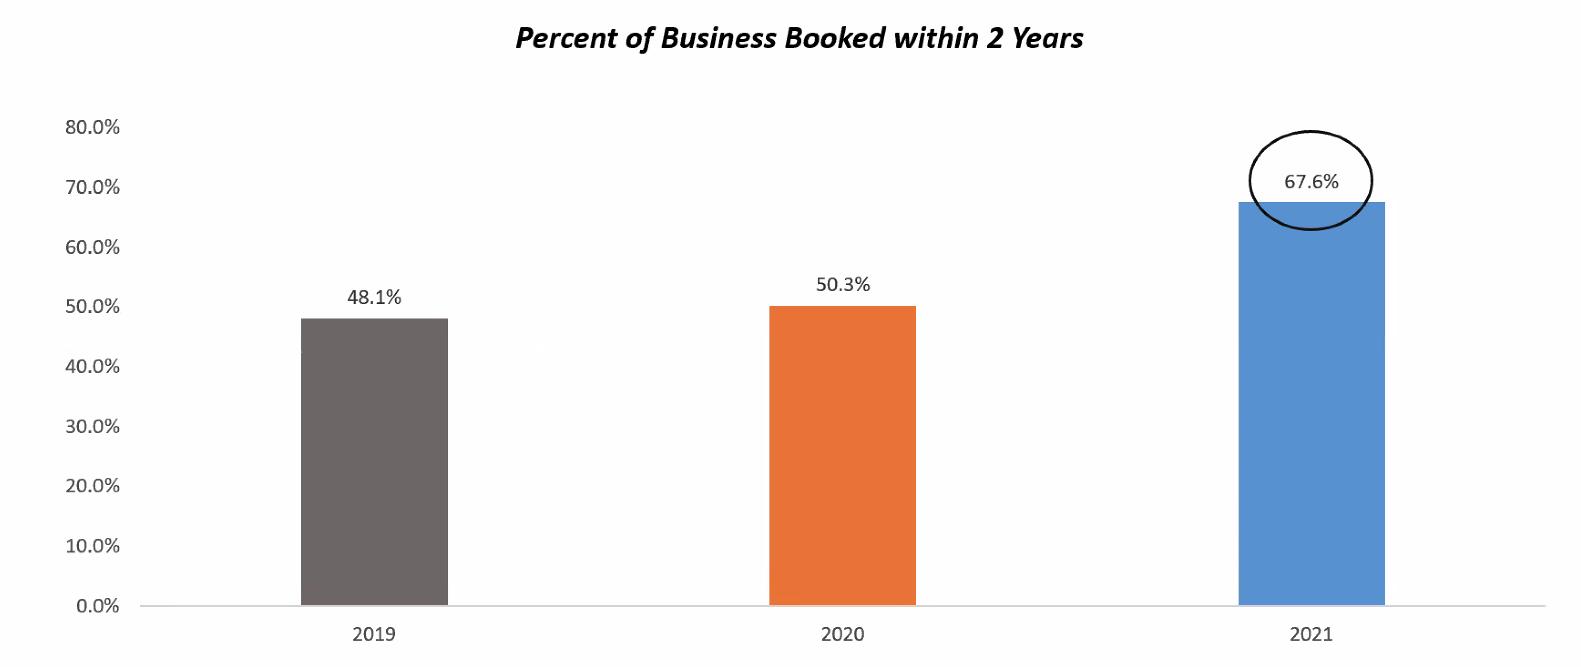
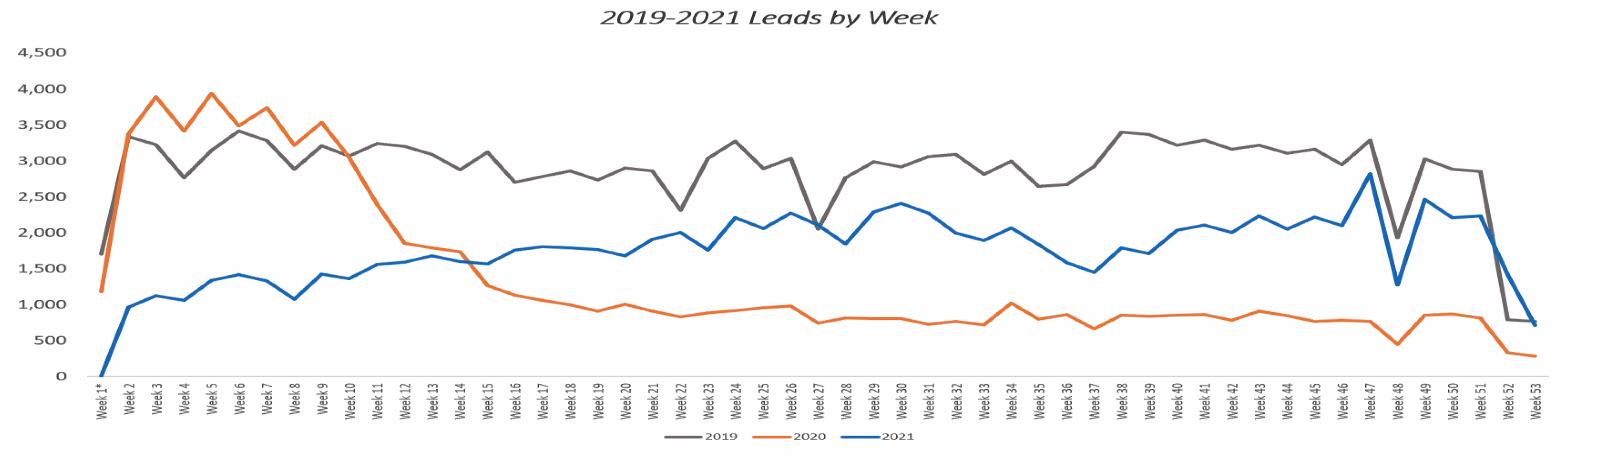
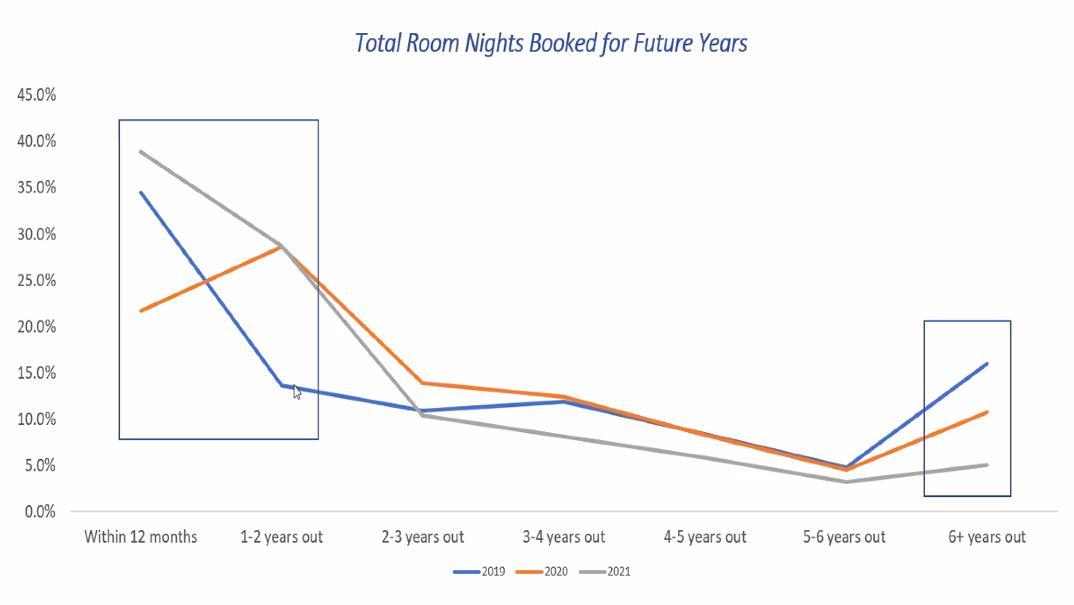
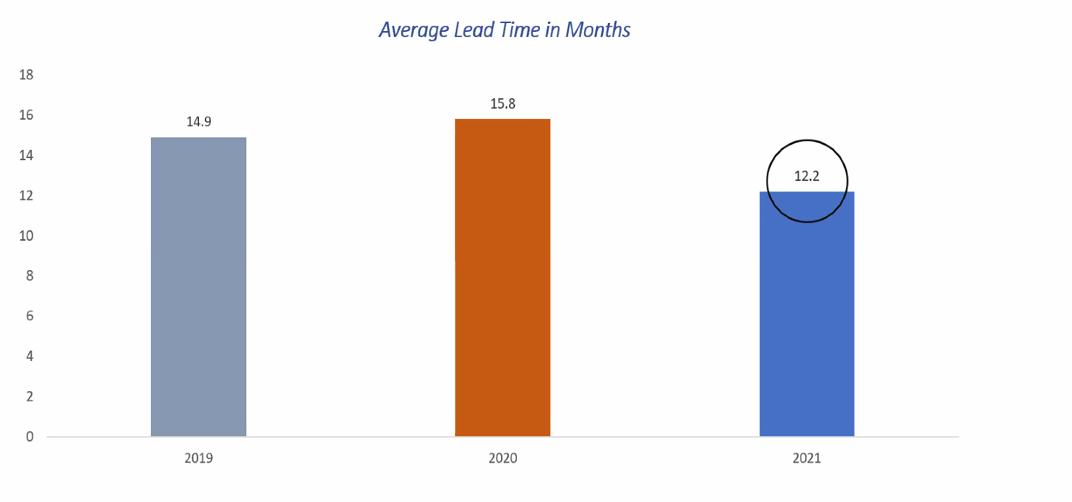
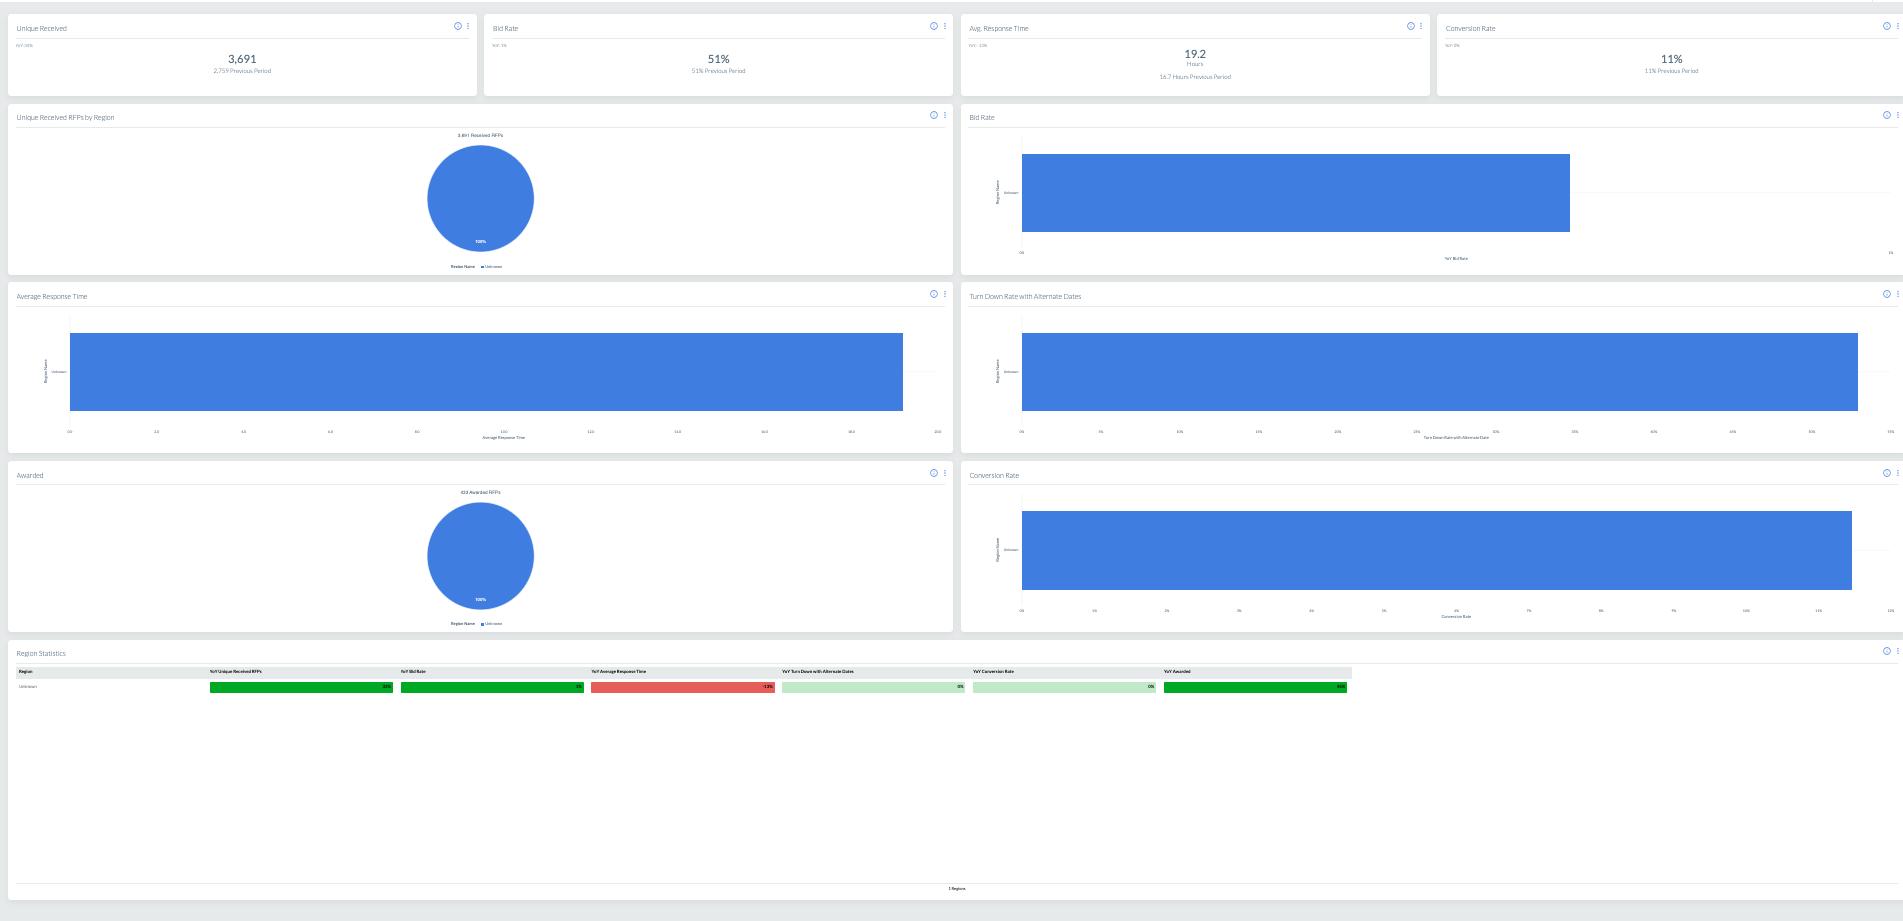
Take a deep dive into Visit Anaheim’s booking data, analyzing historical, current, and projected trends. This comprehensive evaluation helps establish baseline trends in origin markets, market segments, booking windows, and length of stay, enabling you to plan and execute events with precision and foresight.

• Future Pace Report
• Comp Set
• Events: Monthly Pace Target Variances
• Events: OTB vs Comp Set
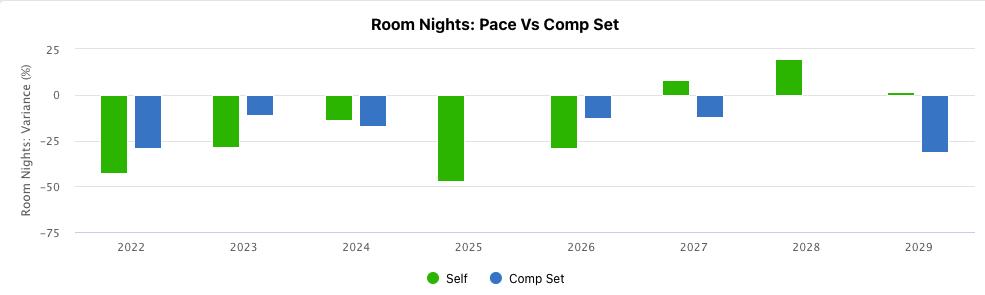
• Events: Pace vs Comp Set
• Long-Term Pace - Events
• Attendees: OTB vs Comp Set
• Attendees: Pace vs Comp Set
• Long-Term Pace – Attendees
• Mint +
• Latest meeting updates
• New meetings
• New organizations
• New histories
• Recommended meetings
• Booking Status
• Meeting list
• Cvent BI
• Market Report
• Performance by Region
• Trends and Pace
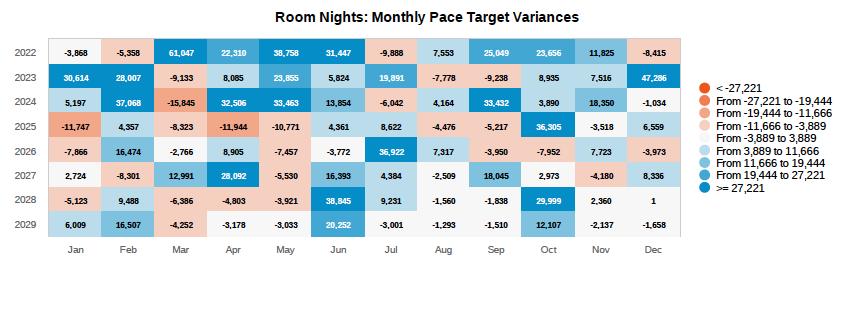
Benefit: EventAnalytics comprehensively incorporates an evaluation of VisitAnaheim's past, present and future booking data to establish baseline trending of origin markets, market segments, booking windows and length of stay.

Using data, Future Pace puts our events in a PACE calendar for future years to monitor progress with bookings.
- Comp Set

Meetings Information Network (MINT+) database is a shared repository of information on organizations and their meetings and events. Prospect intelligently for group business, armed with valuable information about historical meeting details and future bookings, as reported by yourself and fellow destination organizations.


Cvent BI is a Business Intelligence tool to understand your competitive set, assess your performance, and identify opportunities for growth.
Explore the far-reaching economic effects of tourism in our community, from boosting tax revenue and personal income to elevating standards of living and creating new employment opportunities.

Our analysis provides a detailed look at how tourism acts as a catalyst for economic growth and prosperity.
Reports Included:
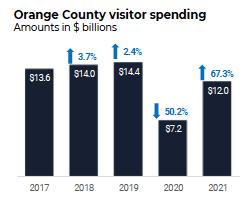
• Tourism Economics, Economic Impact
• Total Economic Impact
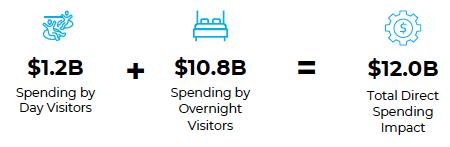
• Direct Visitor Spending
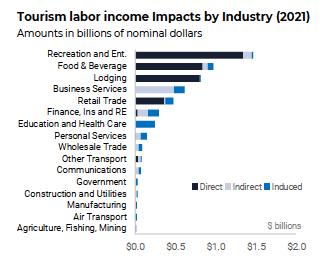
• Total Labor Income Impact
• Total Jobs Impact
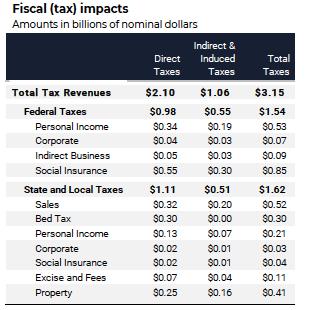
• Total State & Local Tax Revenues
• Sales Tax Revenues
• Lodging Tax Revenues
• Property Tax Revenues
Report Samples:
Benefit: EventAnalytics comprehensively incorporates an evaluation of VisitAnaheim's past, present and future booking data to establish baseline trending of origin markets, market segments, booking windows and length of stay.

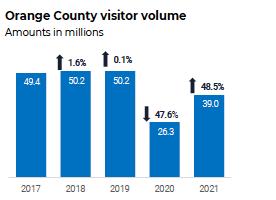
A comprehensive study of visitation to the destination and forecast for future years.
- Total Economic Impact
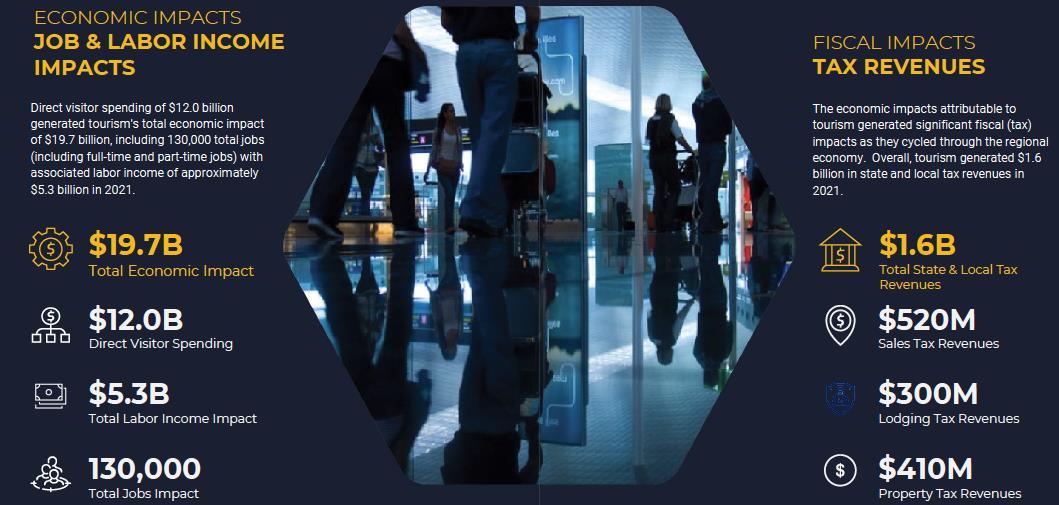
- Direct Visitor Spending Impact
- Visitor Volume and Spending
- Labor Income Impact
- Tax Impact
Gain insights into the movements and preferences of travelers through in-depth analysis of their origins, air travel throughput, and visitation patterns.

Our Visitor Analytics offers a detailed understanding of traveler behavior, helping you tailor services and experiences that resonate with your audience.
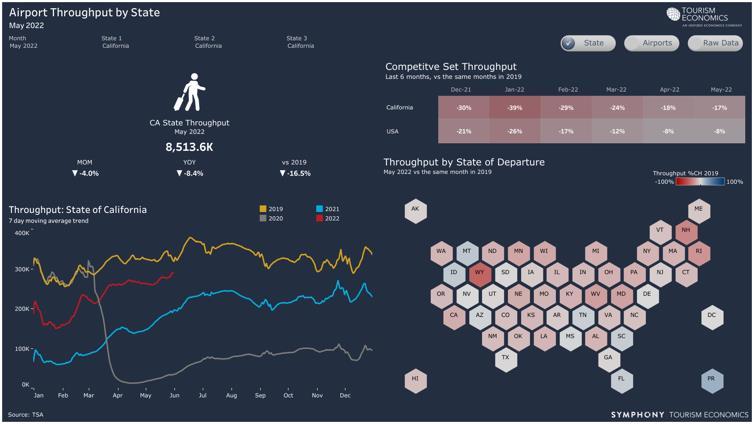
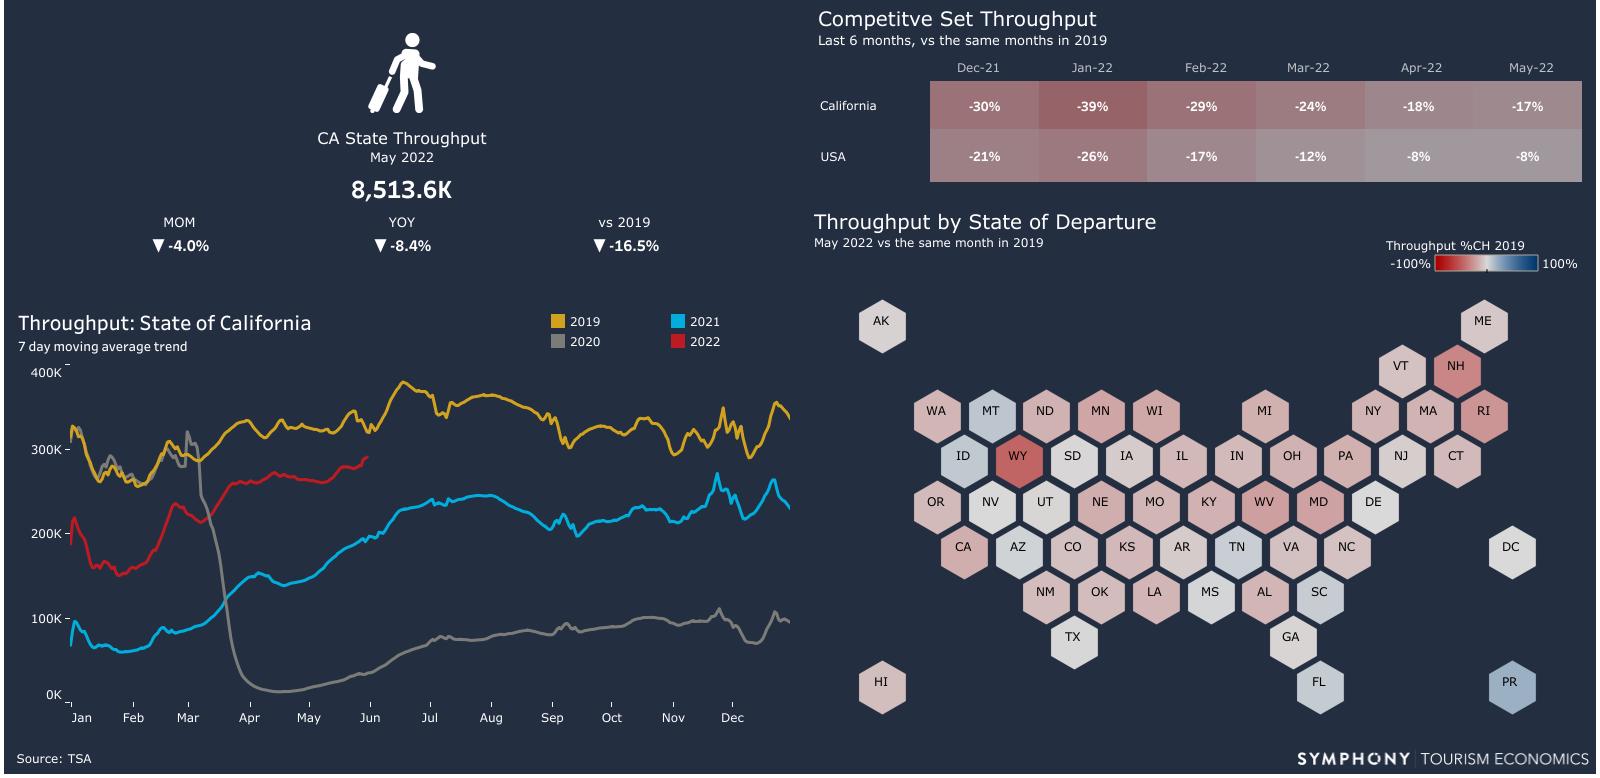
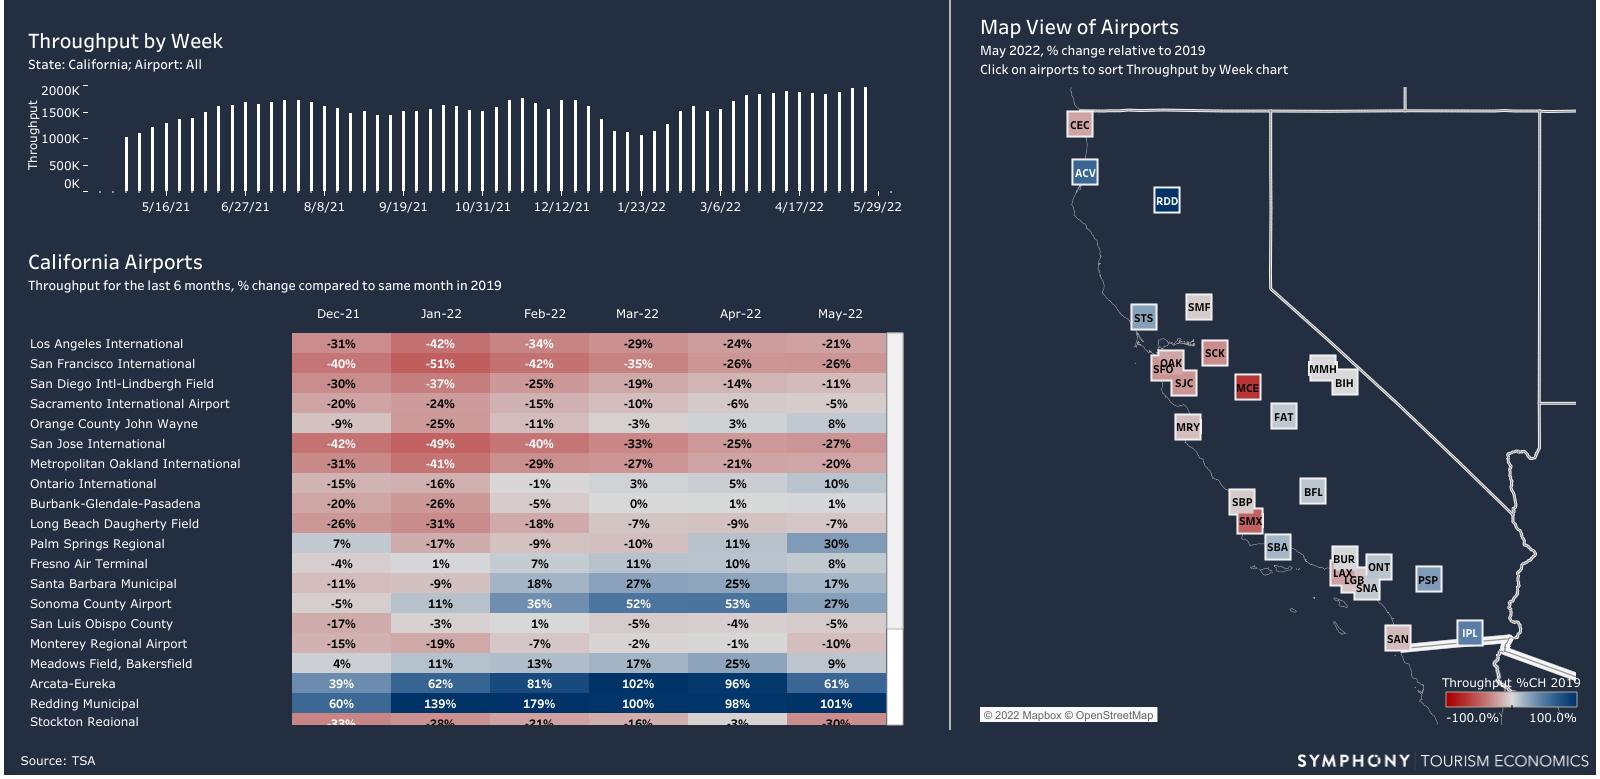
• TSAAirport
• Throughput by State
• Throughput byAirport
• OAG
• Air Passenger Summary
• •Global City Travel
• City Report
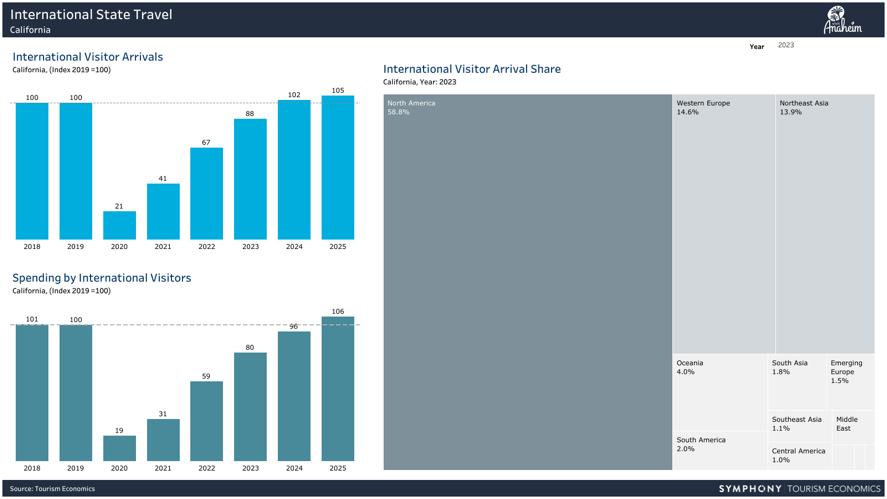
• Tourism Economics
• International State Travel
• Arrivalist | NEAR
• Demographic
• Anaheim
• International
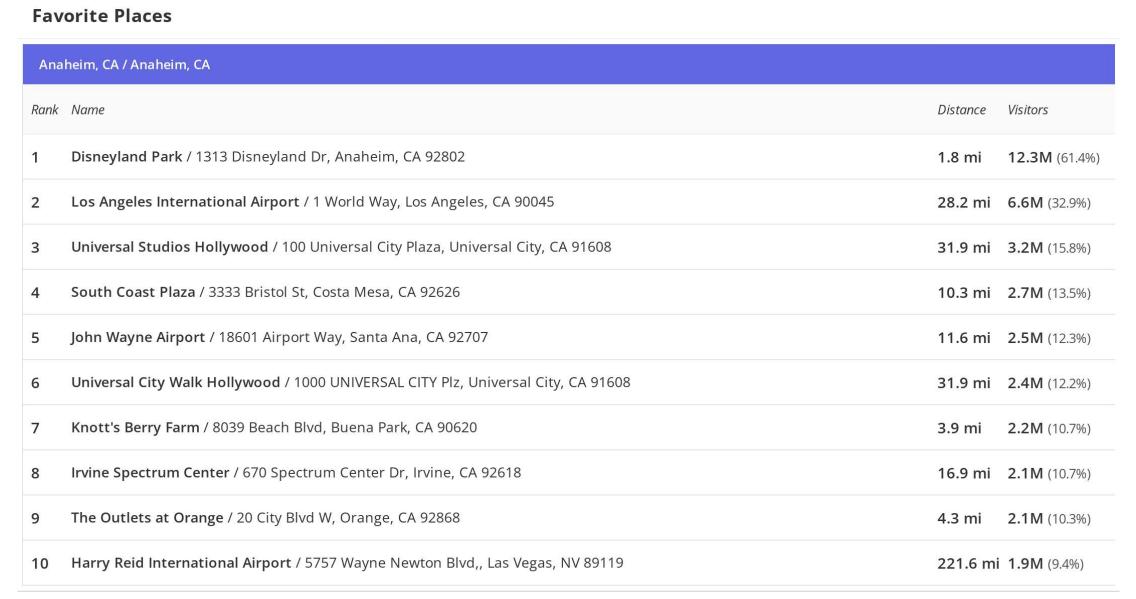
• Visitors to POI
• Visitors POI to Category
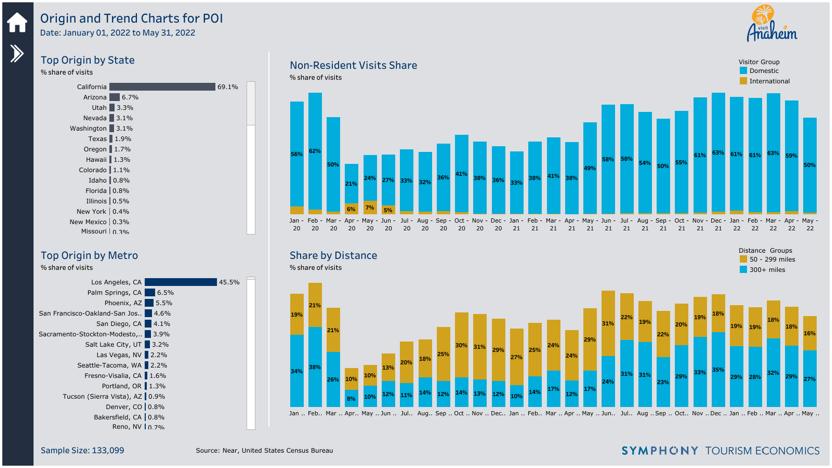
• Origin and Trend Charts for POI
• Datafy
• Vehicle Visitation
• MarketAnalysis
• Daily Visitor Trends
• Event Impact
• Placer.AI
• Demographics
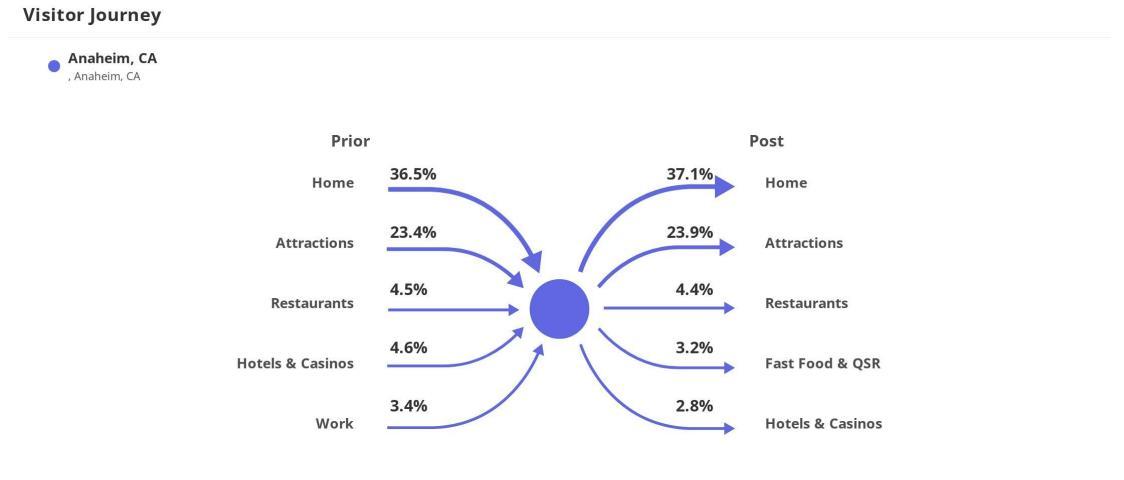
• Visitor Journey
• VoidAnalysis
• Traffic Trends
Benefit: Visitor data to understand what type of visitors chooseAnaheim as their travel destination.

A historical representation of the TSA throughput by airport and destination.
A historical review of air travel for John Wayne Airport.
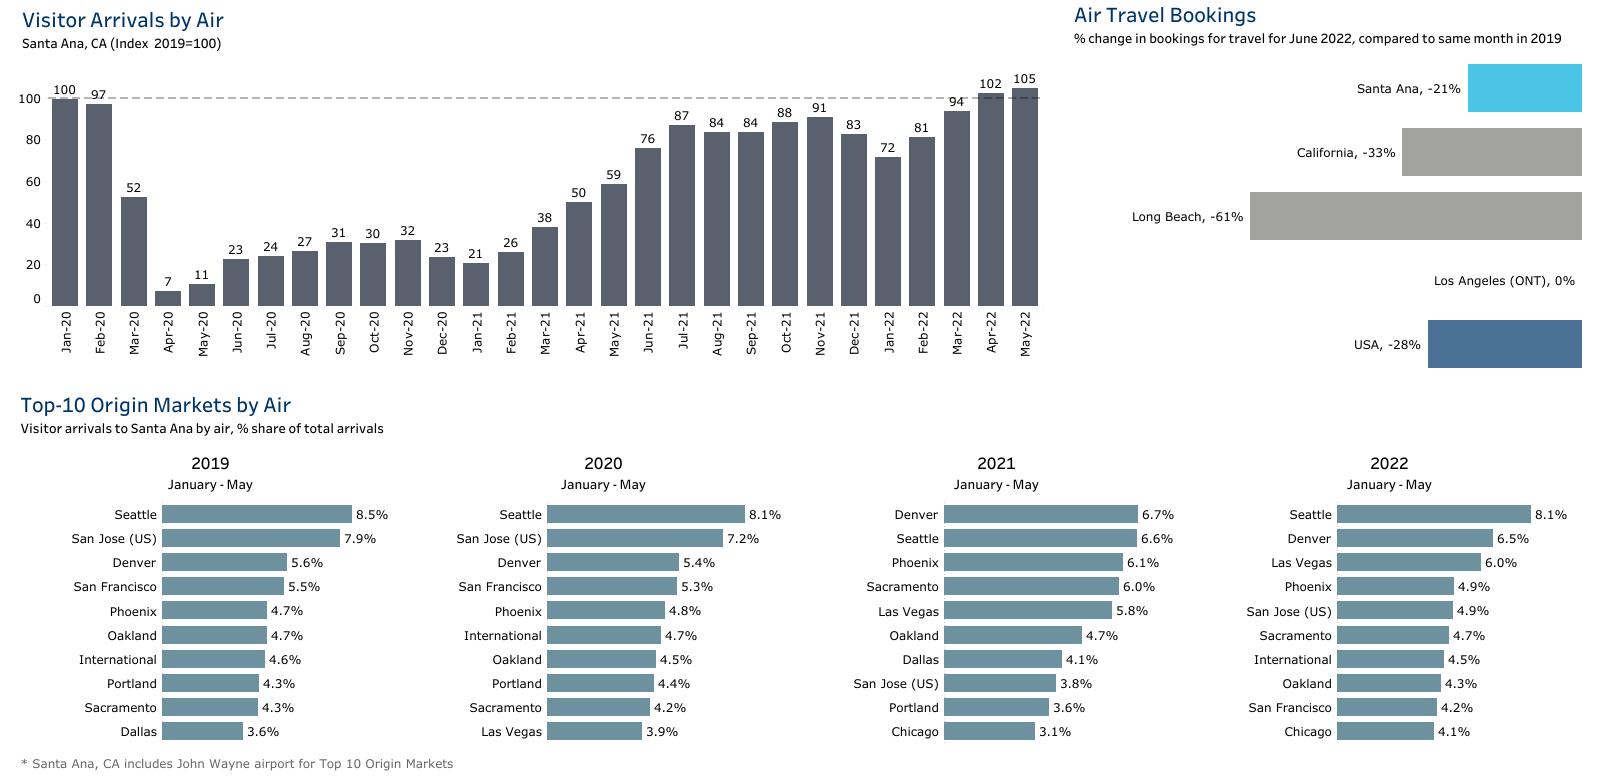
Source: OAG

A historical review of domestic air travel for Los Angeles.
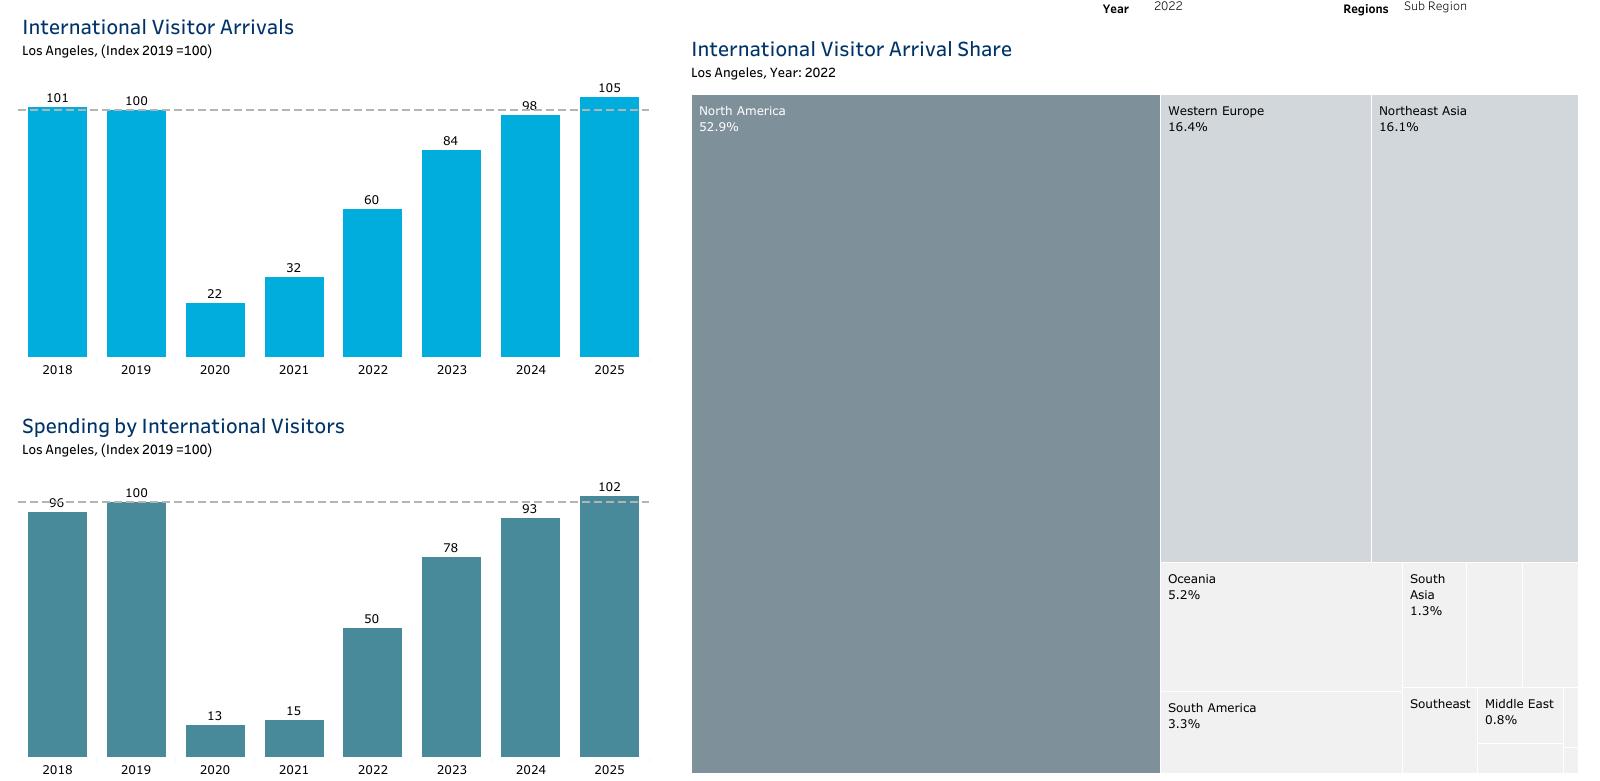
Source: Tourism Economics

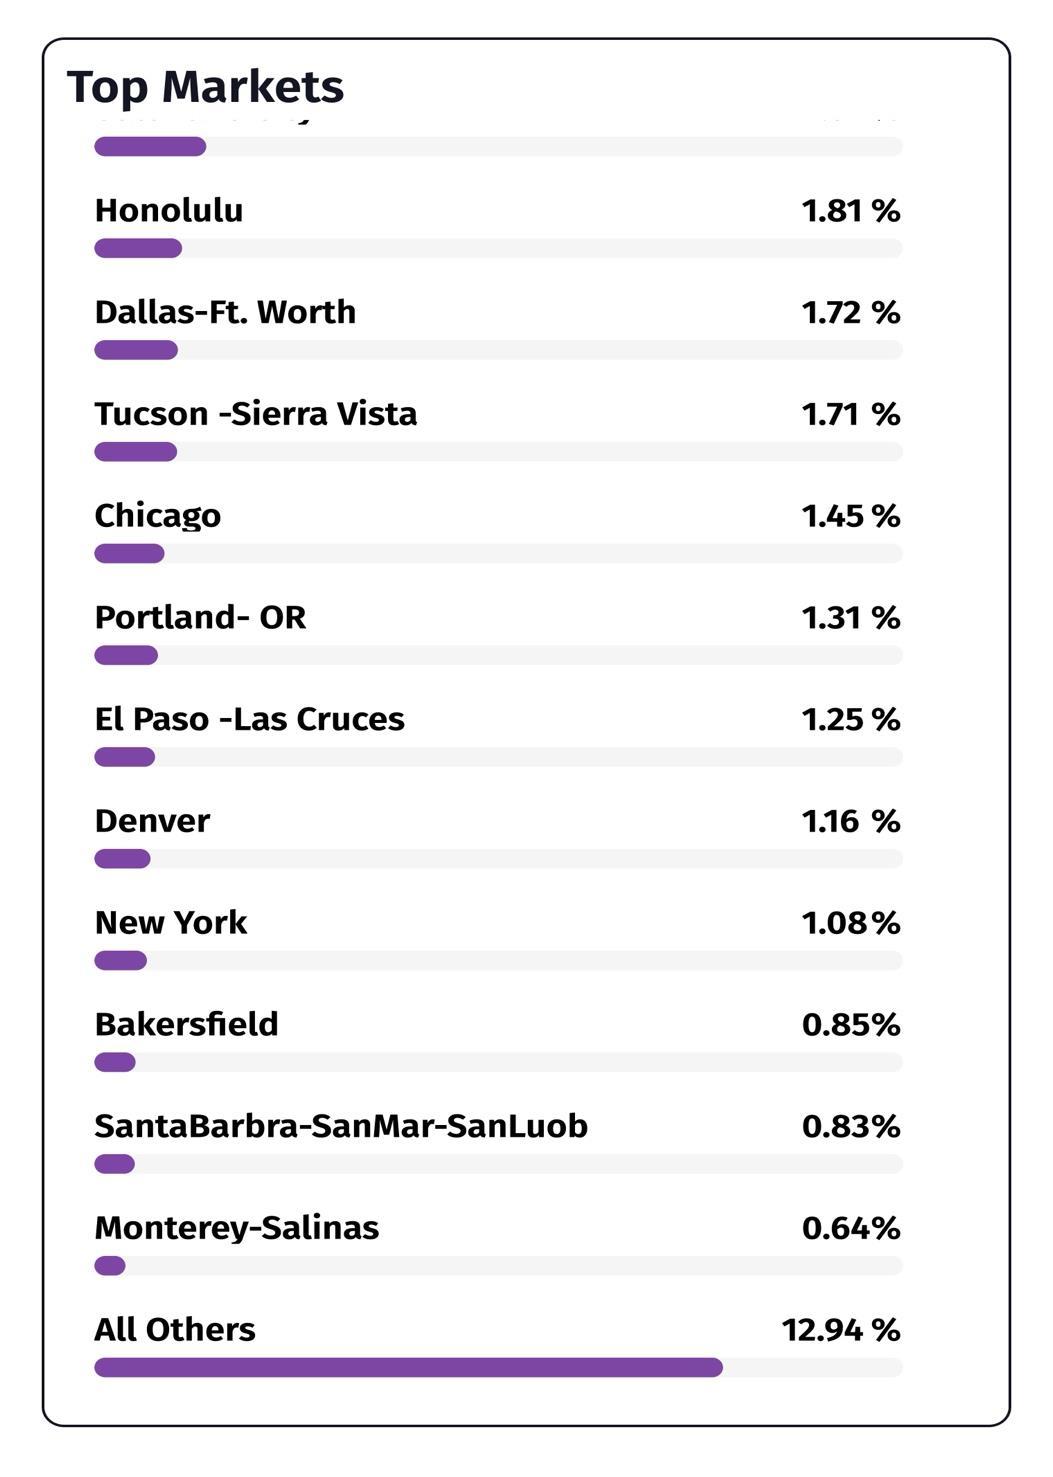
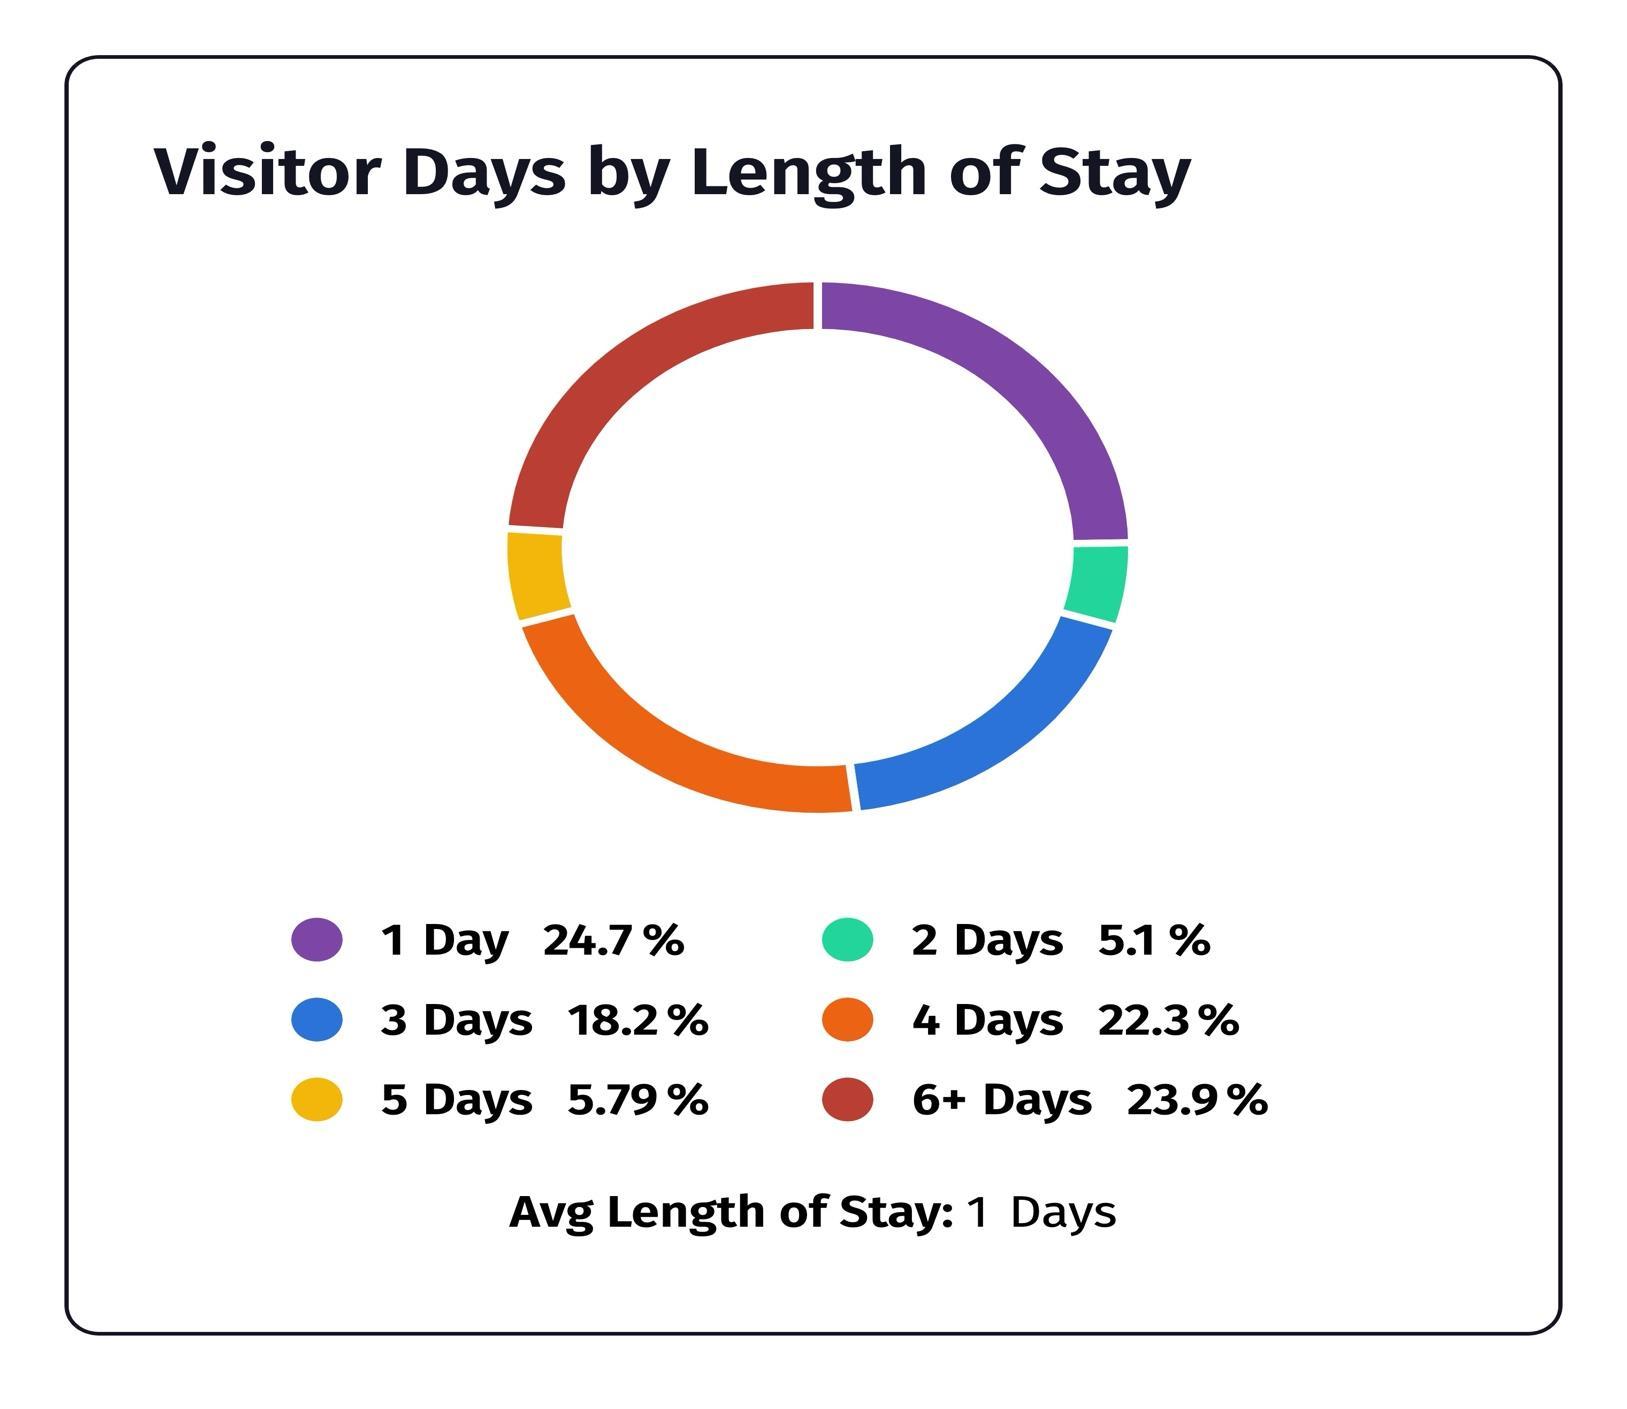
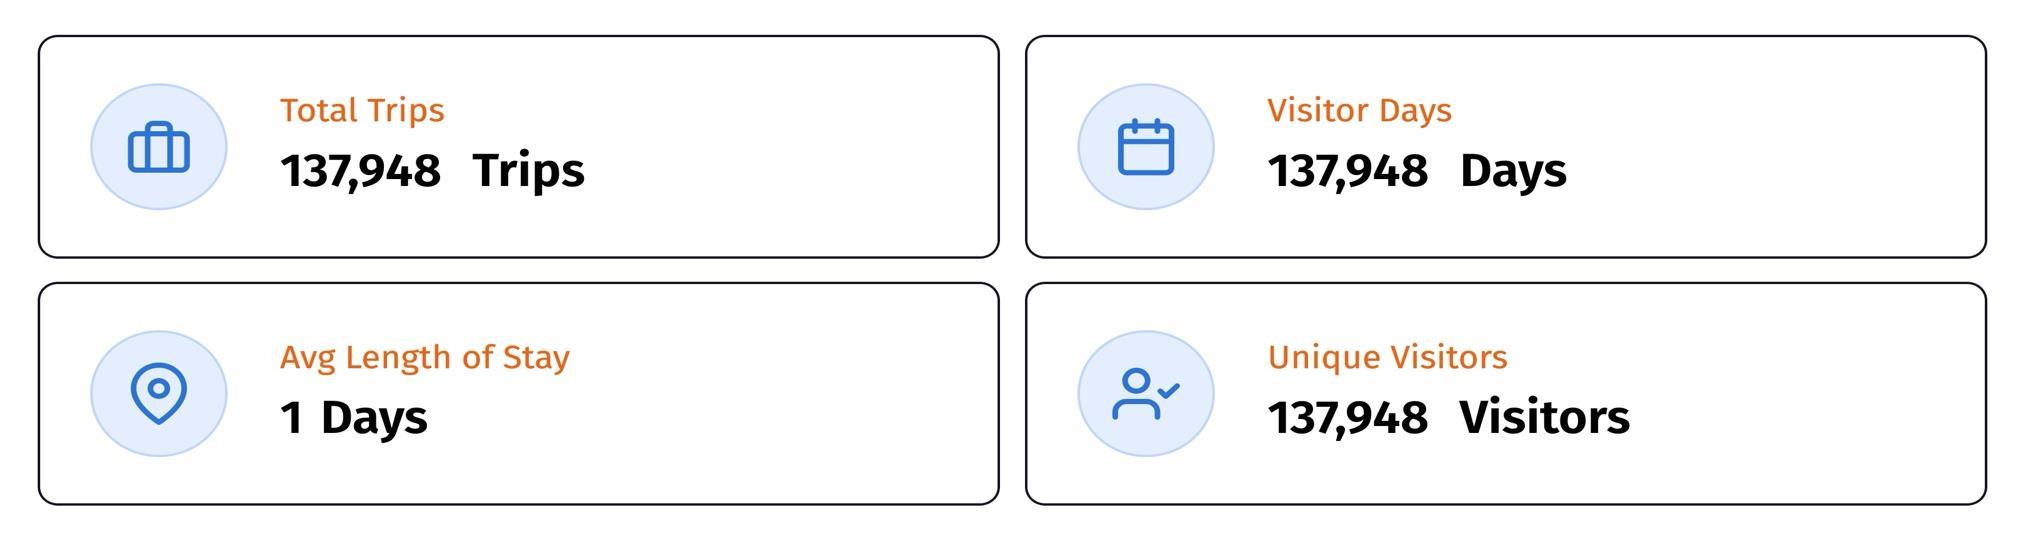
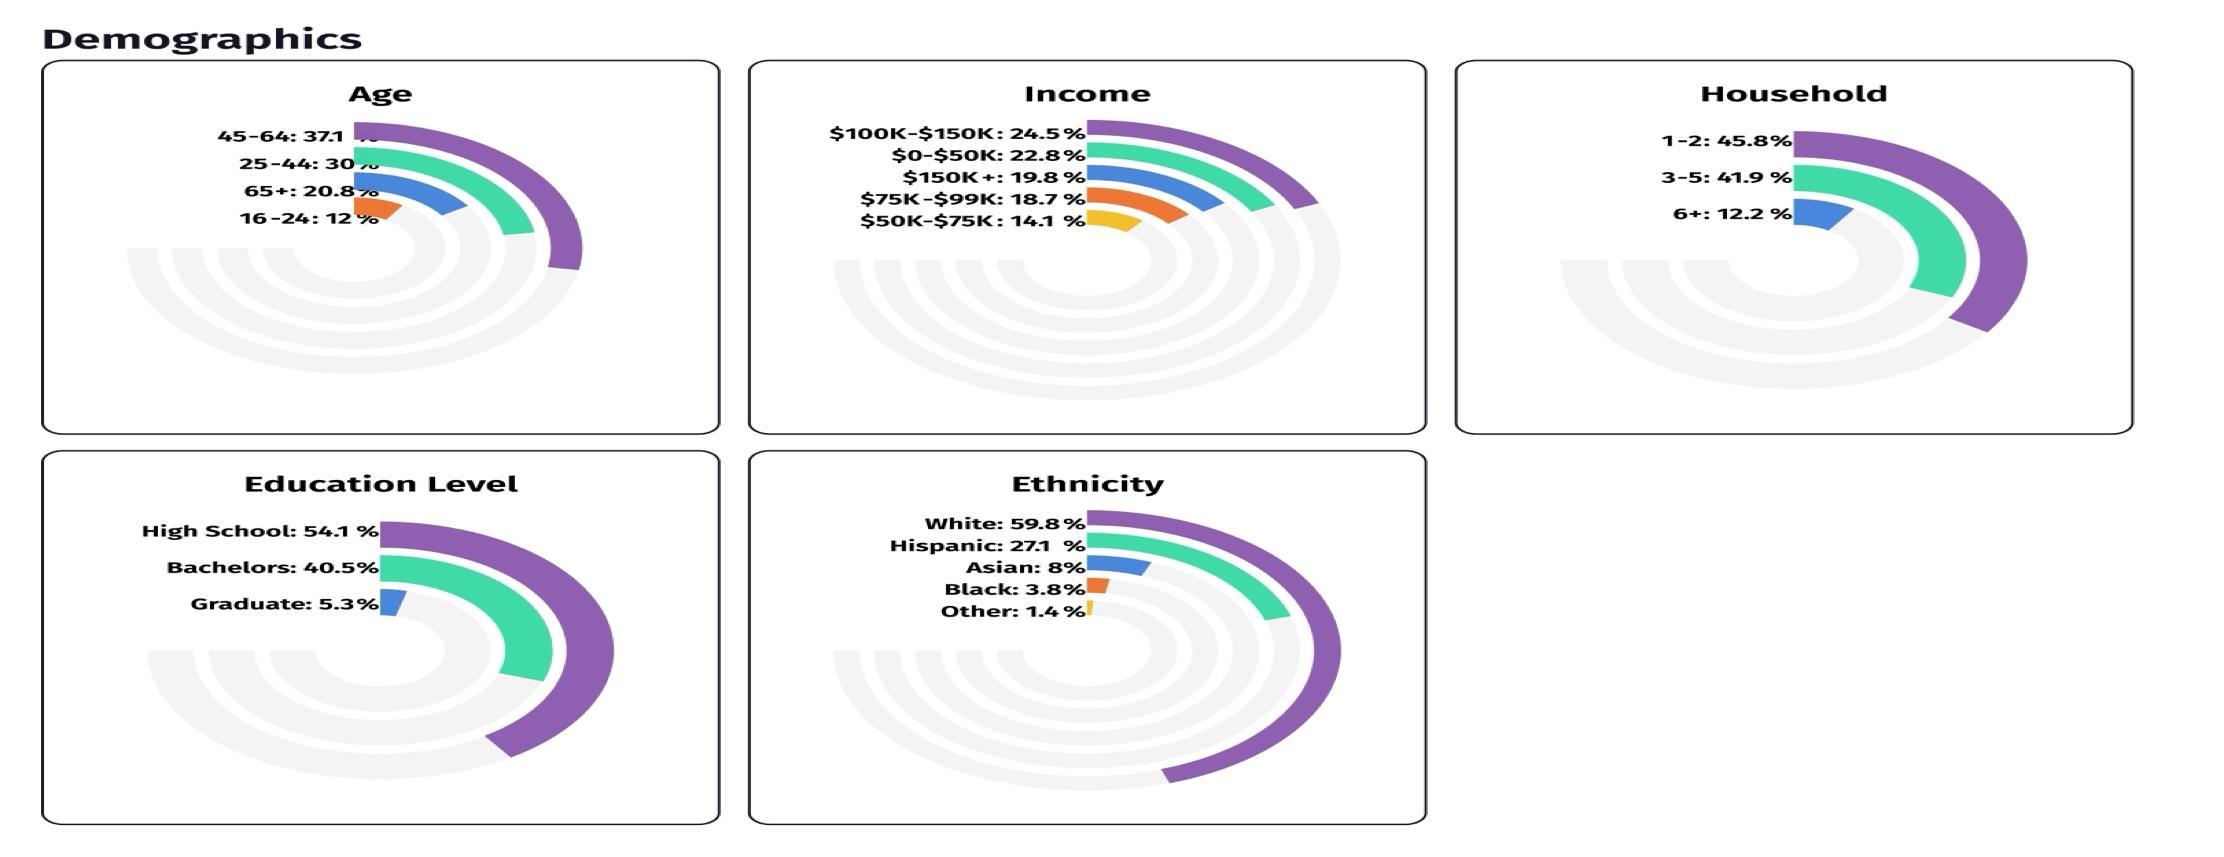
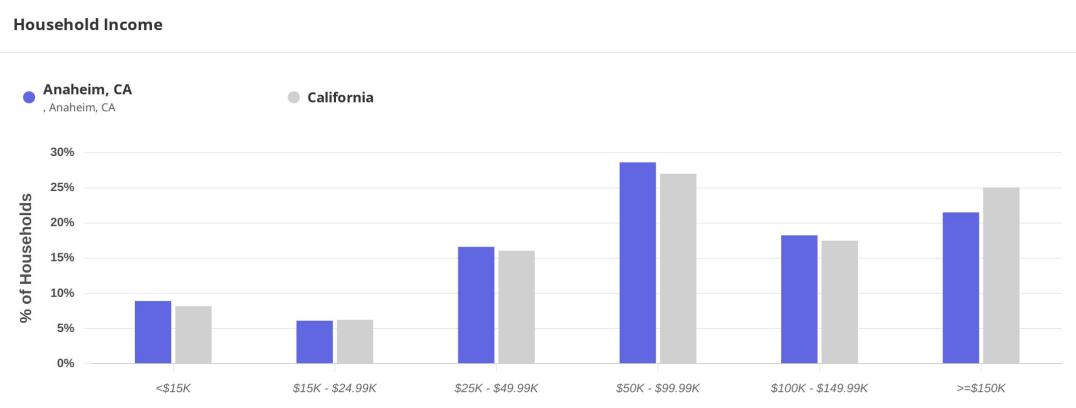
An intuitive profile on the type of visitors that come to our destination. Giving an in-depth review of their POI’s, household incomes, and travel preferences.
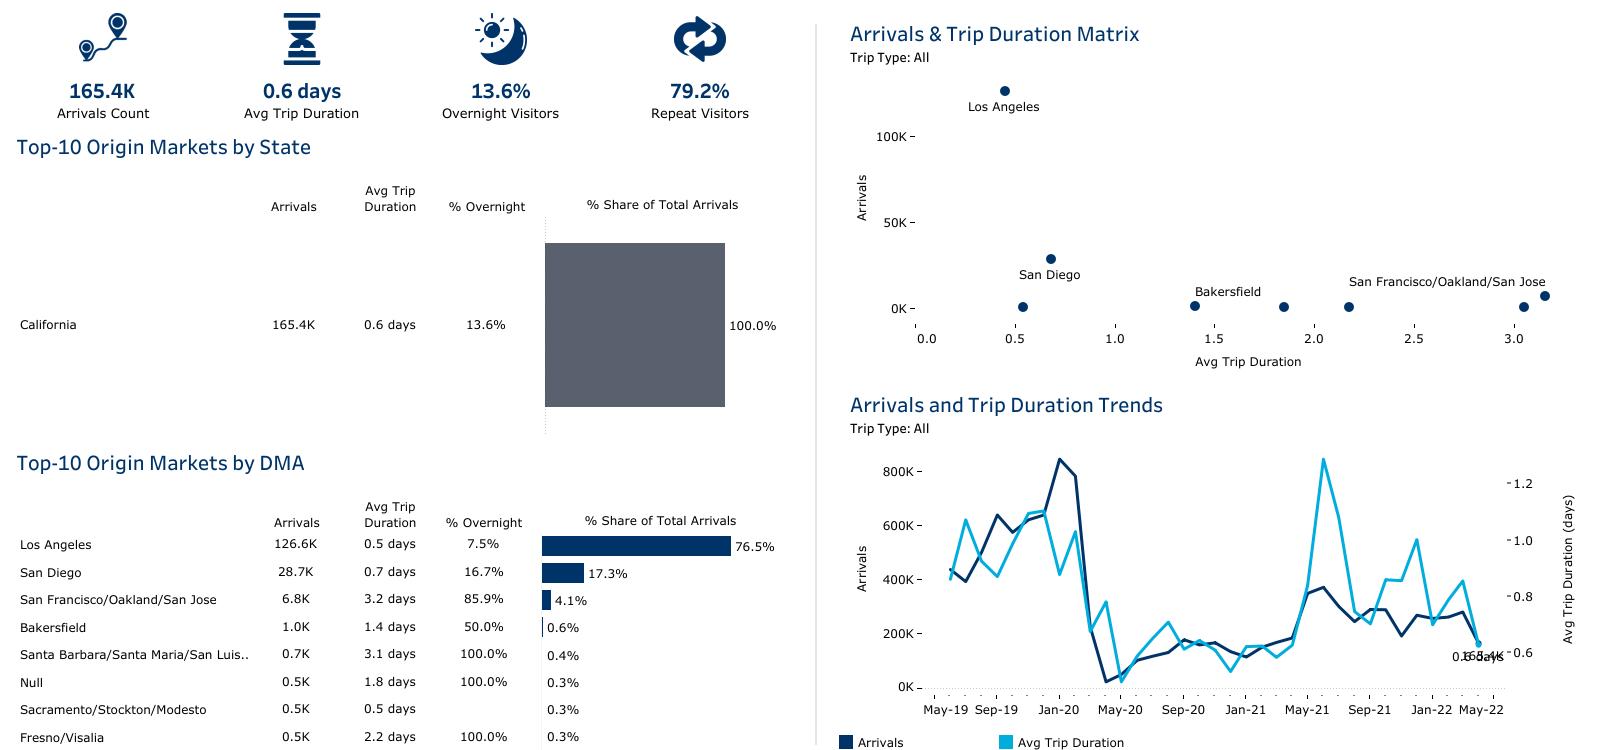
Source: Arrivalist

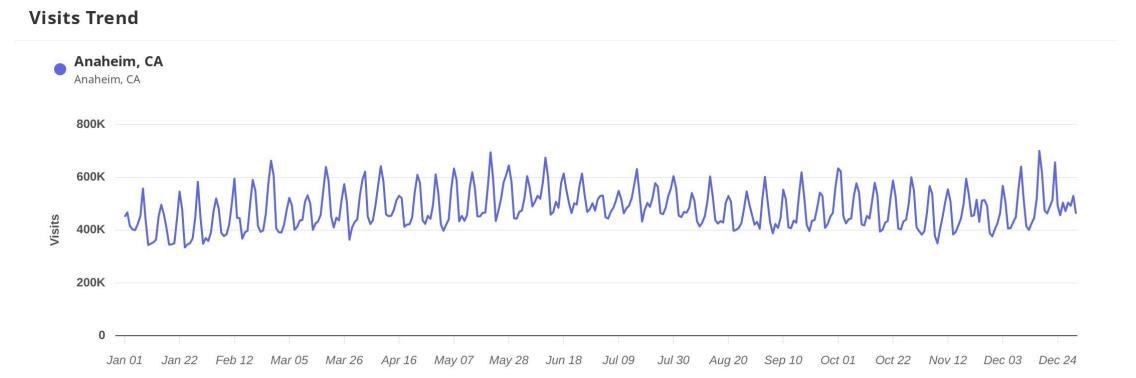
Visitation and visitor behavior that includes demographics, event impact analytics, and vehicle visitation.
Location analytics that includes visit trends, trade areas and demographics.
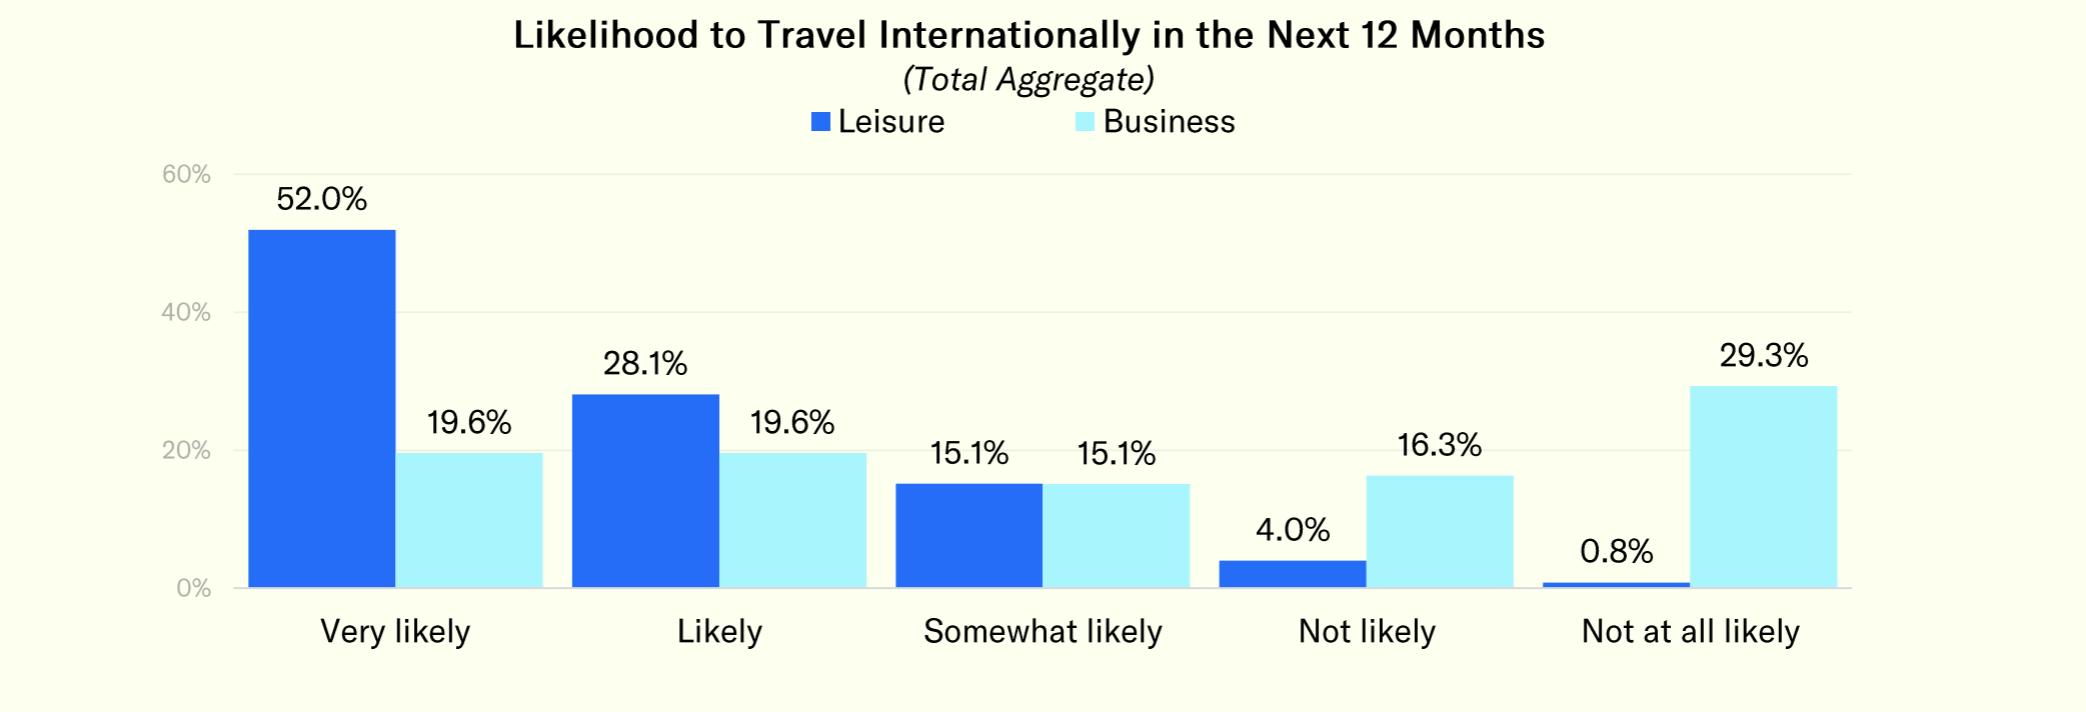
Annual tracking of likely international travelers in top global markets for the United States.
Customize your data sets with our new Custom Reports feature, designed to provide you with the specific insights that matter most to your business.

Whether you need granular details or broader overviews, our custom reports give you the flexibility to access and analyze data in a way that’s tailored to your goals.