
How to Trade Synthetic Indices
Disclaimer
The information and strategies presented in this book are intended for educational purposes only. They do not constitute financial advice, trading recommendations, or a comprehensive trading guide. The information within this book may become outdated. The past is not a reliable guide to future performance, and strategies that have worked in the past may not work in the future. For practical application and further learning, we encourage you to explore Deriv Academy1
The information presented is intended for EU and non-EU retail and professional clients.
Products offered on deriv.com are considered complex derivatives and may not be suitable for retail clients. CFDs are complex instruments and come with a high risk of losing money rapidly due to leverage. 72% of retail investor accounts lose money when trading CFDs with Deriv Investments (Europe) Limited. You should consider whether you understand how CFDs work and whether you can afford to take the risk of losing your money. The value of any trade, and the income derived from it, can go down as well as up, and your capital is at risk.
Trading conditions, products, and platforms may differ depending on your country of residence. For more information about our offerings, visit https://deriv.com or https://deriv.com/eu
Company information:
• Deriv Investments (Europe) Limited is a company incorporated in Malta with its registered address at W Business Centre, Level 3, Triq Dun Karm, Birkirkara, BKR 9033, Malta. Deriv Investments (Europe) Limited is licensed in Malta and regulated by the Malta Financial Services Authority, under the Investment Services Act, to provide investment services. It is both the manufacturer and distributor of its products.
• Deriv (BVI) Ltd is licensed and regulated by the British Virgin Islands Financial Services Commission.
• Deriv (FX) Ltd is licensed and regulated by the Labuan Financial Services Authority.
• Deriv (V) Ltd is licensed and regulated by the Vanuatu Financial Services Commission.
For more information, visit https://deriv.com/regulatory.
Copyright 2025
Date of publication: 15.05.2025

About Vince Stanzione
Vince Stanzione has been trading markets for over 37 years and is a self-made multi-millionaire. He is the New York Times bestselling author of The Millionaire Dropout and is the author of “Making Money from Financial Spread Trading” course. He has been quoted and featured favourably in over 200 newspapers, media outlets, and websites, including CNBC, Yahoo Finance, Marketwatch, Reuters.com, Independent, Sunday Independent, Observer, Guardian, The Times, Sunday Times, Daily Express, What Investment, Growth Company Investor, New York Times, Bullbearings, City Magazine, Canary Wharf, Institutional Investor China, and Shares Magazine.
He mainly lives in Mallorca, Spain, and trades financial markets including currencies, stocks, and commodities.
Follow him for updates on Twitter - X @vince_stanzione.
Introduction
Part 1
Understanding Synthetic Indices
Chapter 1. What are Synthetic Indices?
Chapter 2. Types of Synthetic Indices
Part 2
How to trade Synthetic Indices
Chapter 3. What’s a tick?
Chapter 4. Options
Chapter 5. Contracts for Difference (CFDs)
Part 3
Trading strategies
Chapter 6. Getting technical
Chapter 7. Technical indicators
Chapter 8. Patterns
Chapter 9. Swing trading and scalping
Chapter 10. Automated trading and bots
Top tips and resources
Chapter 11. Top tips on becoming a better trader
Chapter 12. Tools and resources
Final note
Introduction
Imagine a group of financial markets that never sleep, immune to economic news, political upheavals, and market gaps—where you can trade 24/7/365, yes, even on Christmas Day, with predictable volatility and a diverse range of opportunities to profit from, whether the market is going up, down, or ranging sideways.
Welcome to the world of Synthetic Indices trading, offered exclusively by Deriv, which has been growing in popularity over the last decade. If you’re seeking a controlled, transparent, and consistently active trading environment, then it’s well worth taking the time to learn about Synthetic Indices trading strategies.
In this comprehensive guide, I will explore the range of markets available on Deriv, effective strategies, and risk management practices. I will provide you with valuable insights and actionable tips to elevate your trading success.
Whether you’re a beginner looking to understand the essentials or an advanced trader seeking to refine your approach, I am certain this guide will help you. I’ve traded financial markets for over 37 years and used synthetic products for about 20 years, and it’s my pleasure to share my knowledge to help you avoid mistakes new traders often make. I will draw on my trading experience, using realworld situations, not textbook theories. Many techniques and trading tools covered will also apply to other financial markets, such as Forex, Commodities, Stocks, and Cryptocurrencies; however, Synthetic Indices have unique characteristics, which I will explain in depth as they are the focus of this book.
A closer look at the book
This book has 3 main parts:
Part 1
In this part, I’ll help you understand Synthetic Indices and learn what products are available. We will look at the growing range of Synthetic Indices and the general characteristics of different indices, such as Volatility Indices and Crash/Boom Indices. I will also cover some newer indices, like Drift Switch Indices (DSI) and Step Indices.
Part 2
I will cover the mechanics of placing synthetic trades using both Digital Options and Contracts for Difference (CFDs).1 We will also explore the different platforms on which you can trade Synthetic Indices, including MetaTrader 5 (MT5), cTrader, and Deriv X, which also features TradingView.2
For Options, we will look at Deriv Trader and SmartTrader, and I will tell you about the platforms and products that are best for new traders.3 Whether you prefer trading on a laptop, desktop, mobile device, or a combination, you’ll have many features at your disposal to personalise your Synthetic Indices trading experience. We will also explore Deriv Bot, a unique web-browser trading robot that allows you to auto-trade Options without needing coding skills.4
Part 3
In this part, I reveal actual trading strategies using technical analysis and charting tools. We will also look at copy trading, automated trading, and new developments from Deriv. Just as we don’t all wear the same style or colours, Synthetic Indices are not a one-sizefits-all market. Some traders will prefer fastpaced, short-term trades, while others will opt for longer-term, slower, and steadier markets. I will explain different trading styles, including scalping, range trading, breakout trading, swing trading, and trend trading.
I will also explain the importance of trading psychology, which is often overlooked but plays a significant role in trading success. Staying in control is just as important, so I’ll share money management techniques to help you do that.
Before bringing the book to an end, I will share some top tips to help you become a better trader, along with a glossary of terms and links to useful resources that I personally use. I will also include links to videos where you can learn by watching trades being made.
The aim is to provide you with actionable insights and a practical trading plan without overwhelming you with excessive information or technical jargon.

Start with a free practice account then step up to real trading
The great news about trading with Deriv is that you can open a free practice account, allowing you to trade Synthetic Indices and other major financial markets using real live prices and conditions without risking real capital. The account comes with $10,000 in virtual funds, which can be reset as needed.
As you become more confident, you can start trading Digital Options with small, fixed-risk stakes as low as US$0.50 total risk. You can also step up to trading Contracts for Difference (CFDs) with much lower margin requirements than those offered by traditional brokers.
You can have a practice and real account open simultaneously, allowing you to keep learning and testing trading ideas on your practice account while making real trades on your
funded account. As traders, we never stop learning and testing new strategies.
To open a practice account, just go to deriv. com. While you’re there, you can also open a real account, which can be funded with as little as US$5. To open a real account, you’ll need to provide some information, such as a government-issued ID. This is in line with financial regulations and can all be done online. In most cases, your account can be live and ready within 10 minutes.
Note: Deriv is a licensed and regulated broker that follows Know Your Client (KYC) rules. These measures protect both you and the company by ensuring that only legitimate transactions and clients are accepted. This commitment to security and compliance is one of the reasons why Deriv has remained in business for 25 years, while many other companies have failed.

Part 1 Understanding Synthetic Indices
Chapter 1 What Are Synthetic Indices?
Synthetic Indices are financial instruments that mimic real-world market behaviour but are not influenced by actual market events.
They allow traders to speculate on market movements without the risks associated with geopolitical events or economic changes.
Synthetic Indices use a proprietary mathematical generator with cryptography that is securely stored and cannot be accessed or tampered with. They do not rely on any external data that can be manipulated. Since they do not have an order book, they are resistant to manipulation, where large orders can move prices or the insiders may have an unfair advantage.
Key features and benefits
24/7/365 trading: Synthetic Indices are available for trading around the clock, offering flexibility for traders worldwide without the need to wait for traditional financial markets to open. They trade 365 days a year, including weekends and public holidays.
Deep liquidity: Deriv has constant deep liquidity, allowing you to buy or sell in large
market sizes without experiencing price gaps, which are common in many traditional financial markets. Even in highly liquid Forex markets, there can be periods of thin trading.
Volatility: Synthetic Indices are designed with predictable volatility patterns, making them ideal for technical analysis. As I’ll explain shortly, you can choose your risk tolerance and the level of volatility you’re comfortable with.
Long, stable history: Deriv has been established for over 25 years, and Synthetic Indices have been used by millions of clients around the globe.
Ideal for smaller account sizes: If you’re starting with an account size of $1,000 or less, nothing compares to Synthetic Indices in terms of trading conditions and opportunities. Forex, stocks, commodities, and cryptocurrencies typically require larger account sizes to achieve the same trading exposure and conditions as Synthetic Indices.
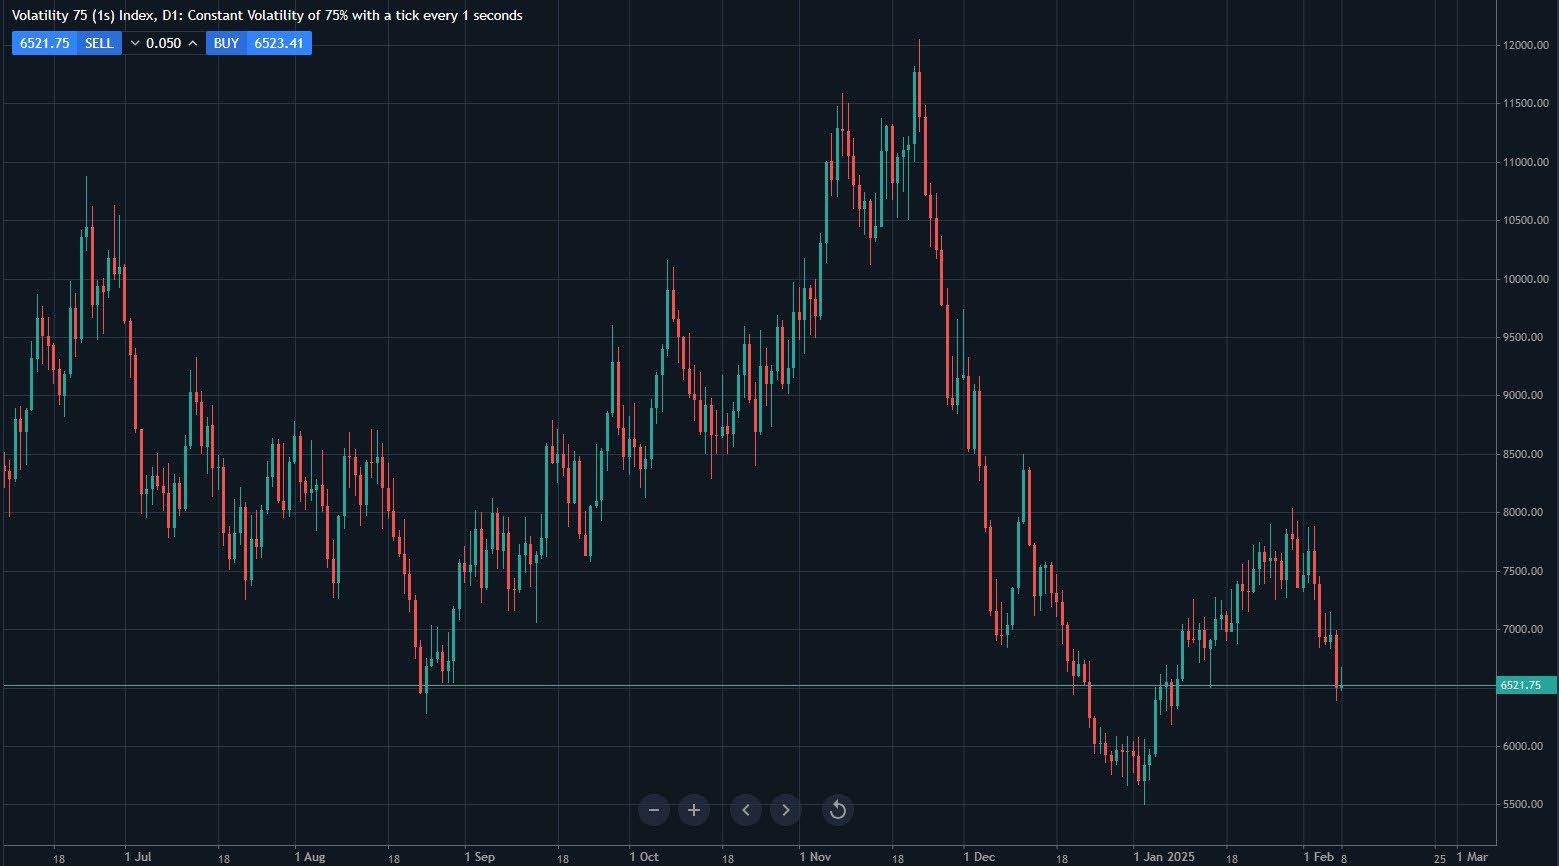
Fig. 1.1. Volatility 75 Index chart showcasing price fluctuations
Tight, continuous spreads: Synthetic Indices offer very tight bid/offer spreads. When trading any market, you want the spread to be as small as possible. For example, if the price is 1.2025 BID – 1.2026 OFFER, and you buy at 1.2026 then immediately sell at 1.2025, you have lost one point without the market moving. That’s the hurdle you need to cross—the smaller the spread, the quicker you can move into profit.
Generous rates of leverage: When trading CFDs, you can use leverage—sometimes as high as 1:10001—which means you can control a large position with a relatively small upfront margin. Of course, leverage can also work against you in a losing trade, but I will explain the pros and cons further on. Digital Options also offer leverage with strictly fixed risk.
No negative balance: Negative balance protection is a safeguard provided by Deriv that ensures traders cannot lose more money than they have deposited in their accounts, preventing debt to the broker from trading losses. This applies to CFD trading and is a valuable feature to have.
New innovation: New Synthetic Indices are continuously being developed and launched, providing traders with more opportunities and choice.
Chapter 2 Types of Synthetic Indices
Volatility Indices
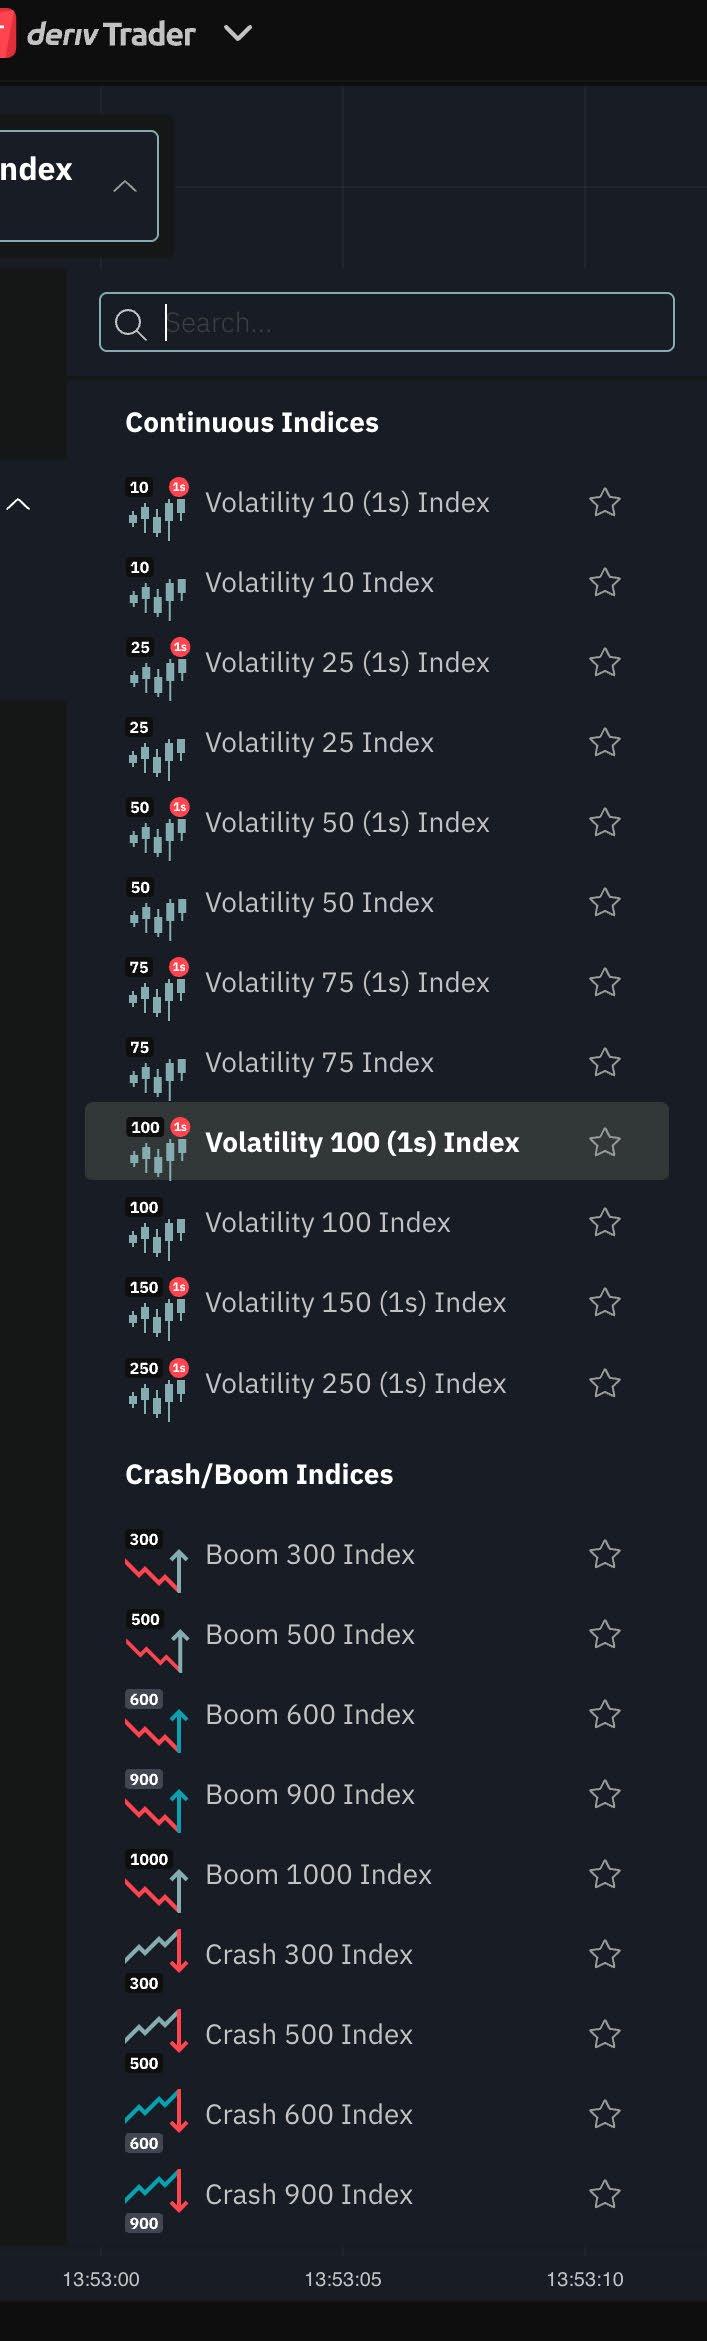
Choose from a range of constant volatilities, from a calmer 10% to a highly volatile 250%. You can also set your pace with tick speeds of every 2 seconds for normal trading or every second for faster trading action. Currently, you can trade Volatility Indices with 10, 25, 50, 75, 100, and 250, available in both the standard format and the 1-second speed.
If you’re just starting out, I suggest beginning with Volatility 10 or 25 while you get familiar with trading these products. In time, you can step up to Volatility 75 and 100, which are very popular, and eventually to 250.
A Volatility Index has characteristics similar to a major Stock Index, with up, down, and sideways trends. The main difference is that volatility is much higher.
In the chart example, the Volatility 250 Index is shown on a daily chart. In just five days, it dropped over 30%, which is something you wouldn’t normally see on a major financial index. Previously, it had risen around 90% in 14 days.
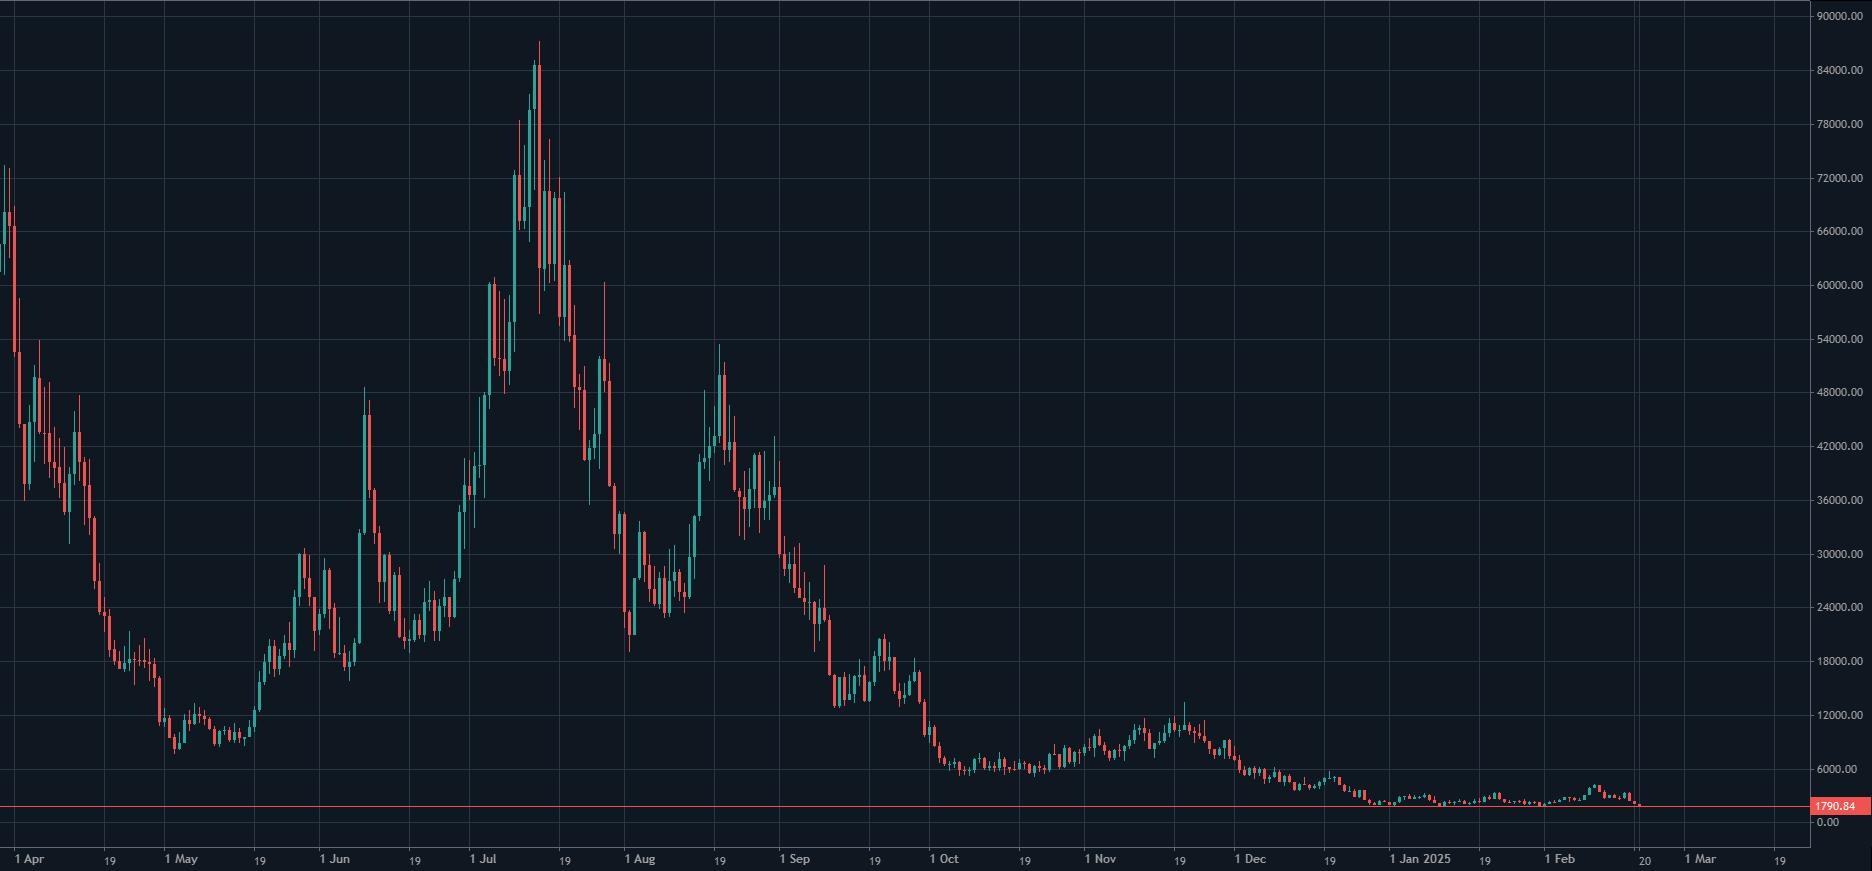
This is why I wouldn’t recommend starting with the Volatility 250 Index, but it demonstrates the opportunities available in a relatively short time frame. Remember, most Deriv traders use leverage, so these potential gains can be magnified significantly.
Crash/Boom Indices
Crash Indices are programmed for sudden downturns, while Boom Indices are designed for rapid surges. Deriv offers tick frequencies of 300, 500, 600, 900, or 1,000, which determine how often (on average) the chosen market will crash or boom.
Crash and Boom Indices simulate market reactions to major events, similar to how a company’s stock value might move up when it releases better-than-expected earnings or go down if earnings fall short.
I recommend starting with Crash or Boom 300, which is currently the least volatile.
Fig. 2.1. Volatility 250 Index daily chart showing sharp price swings and high volatility
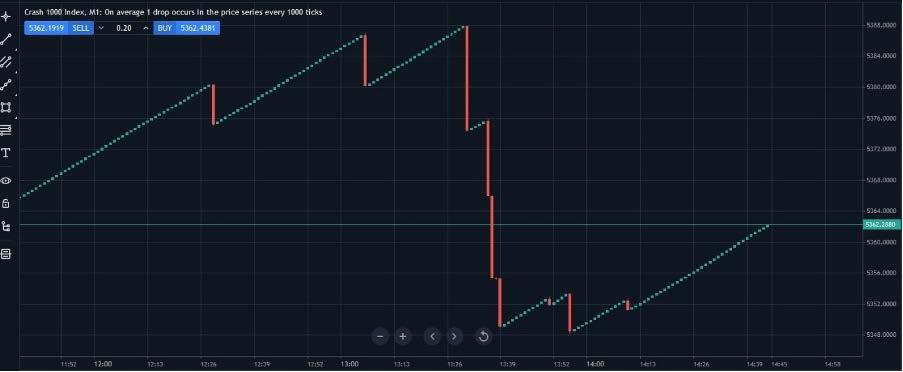
Example of the Crash 1000 Index on a one-minute chart: You can also buy (go long) a Crash Index, meaning you profit if the price keeps rising. However, the key is to exit before a crash candle appears (the long red ones). If you’re already in a trade when a crash occurs, your position can quickly lose value. Notice that crashes can happen back-to-back, but there can also be long periods without any crashes.
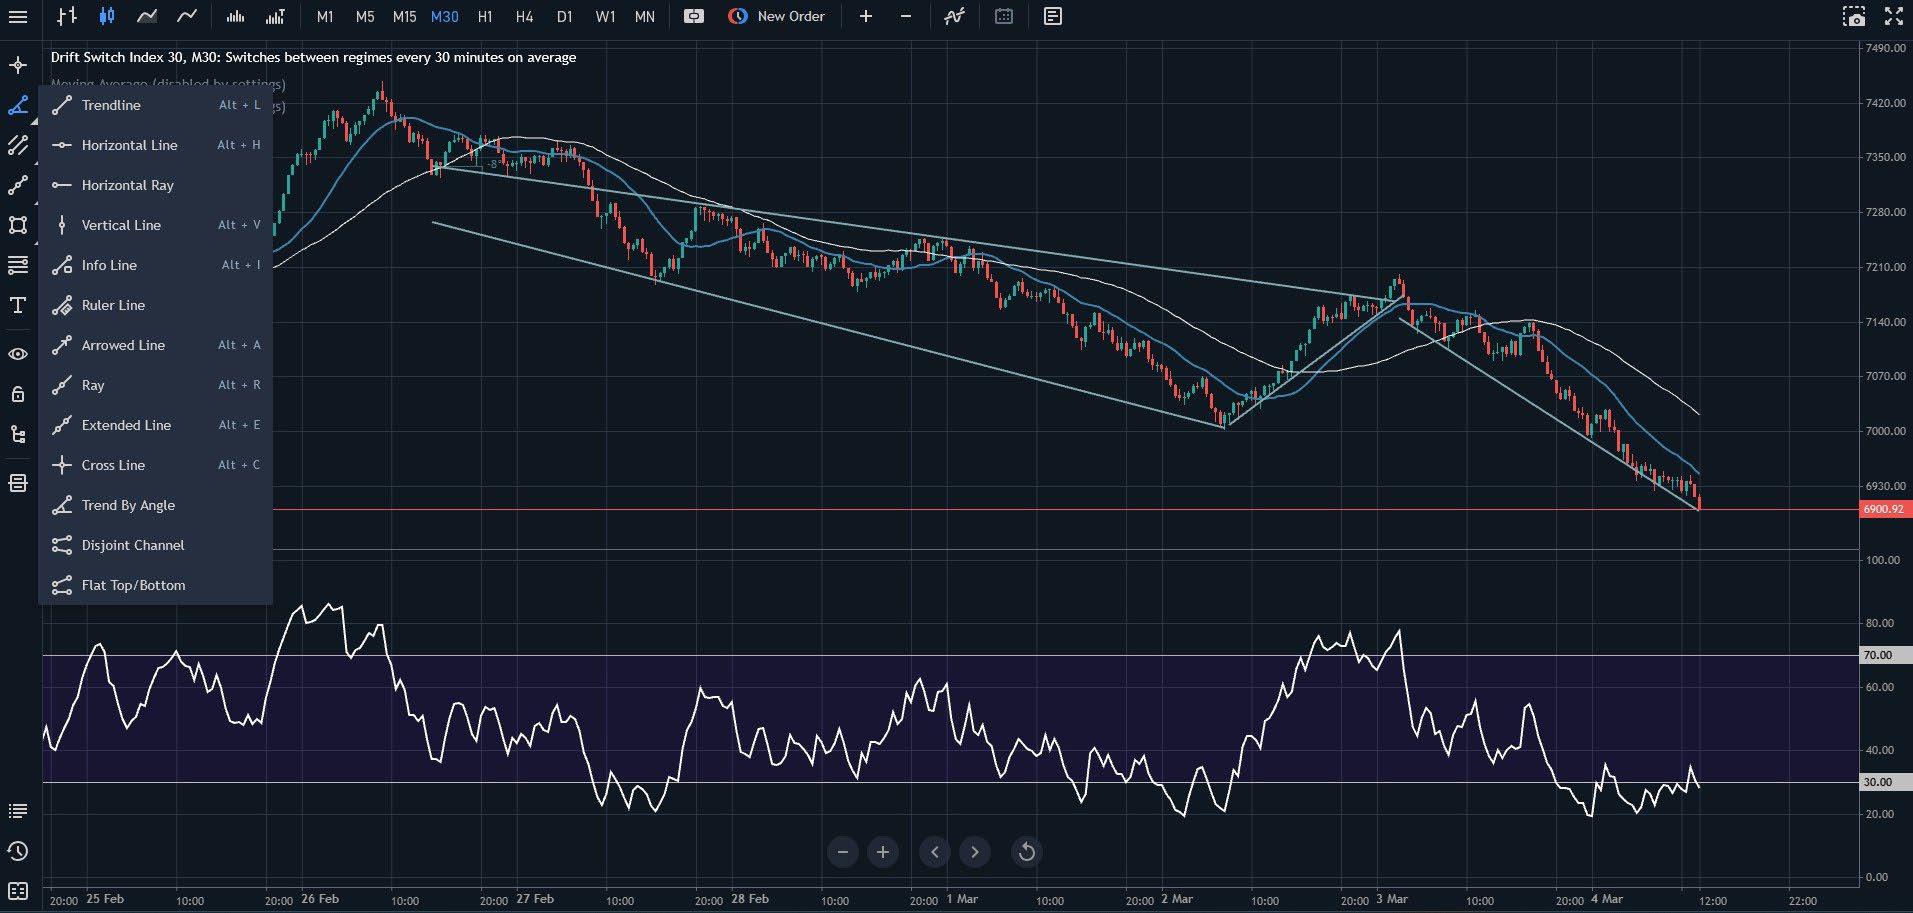
Drift Switching Indices
These instruments shift between bullish, bearish, and sideways trends. They are ideal for swing traders who can use stop-and-reverse strategies, such as going long, closing the position, and then switching to a short trade.
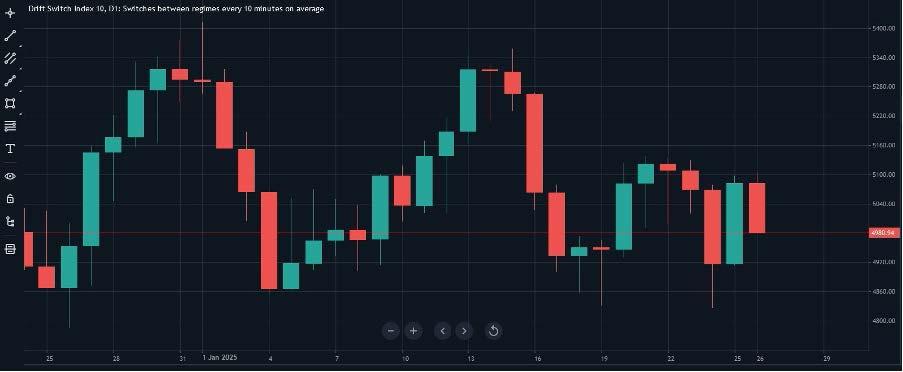
Drift Switch Index 10 (DSI) switches direction every 10 minutes on average. This is a daily chart, and you can see how the index alternates between upward and downward movements while remaining within a range-bound band.
Deriv also offers DSI 20 and DSI 30, which switch every 20 and 30 minutes on average. Further on, I will show you a trading system that could work well on Drift Switching Indices.
Fig. 2.2. Crash 1000 Index one-minute chart showing a sharp drop and recovery
Fig. 2.3. Drift Switch Index 10 daily chart showing range-bound movements
DEX Indices
DEX Indices dramatically spike and drop every 15, 30, or 45 minutes on average, with smaller fluctuations in between.
Jump Indices
With Jump Indices, expect prices to leap every 20 minutes on average, with an equal chance of soaring or plunging at around 30 times the normal volatility of the index. You can choose from 10%, 25%, 50%, 75%, and 100% volatility.
Step Indices
With each tick, the price of this instrument steps up or down by 0.1, 0.2, 0.3, 0.4, or 0.5—no wild swings or complicated trends, just fixed, step-by-step movements. These are good for trend trades using tools such as moving averages or Donchian price channels.
Range Break Indices1
This is a ranging market where the price bounces between upper and lower boundaries, with sudden breakouts creating a new range. You can tailor it to your pace with a choice of break frequencies: every 100 or 200 boundary hits on average.
Daily Reset Indices2
These instruments simulate simplified bull (rising) and bear (falling) market trends, mirroring realworld economic upturns driven by positive sentiment or downturns driven by pessimism. Each index resets daily to a baseline.
Multi Step Indices3
These indices typically jump or dip by 0.1 but can occasionally move up or down by 0.2, 0.25, 0.3, or 0.5 steps. Multi Step Indices generally exhibit lower volatility compared to other Synthetic Indices on Deriv, some of which can reach levels as high as 250%. This is illustrated in the volatility comparison plot below.
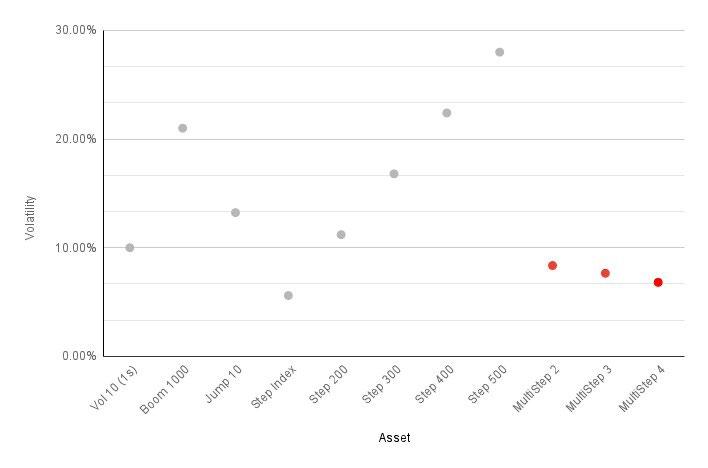
Fig 2.4. Volatility comparison of Synthetic Indices, highlighting the lower volatility of Multi Step Indices
Hybrid Indices4
Experience the predictability of Crash and Boom Indices with a 20% volatility boost. Capture movements based on real markets, combining steady patterns with dynamic jumps.
Skewed Step Indices5
Move beyond traditional Step Indices and trade with asymmetric step sizes and probabilities. With 80% or 90% probabilities for small shifts and 10% or 20% for sharp movements, every tick offers an opportunity to capitalise on dynamic market changes.
As you can see, there is a wide range of synthetic markets. You can trade multiple indices simultaneously; for example, you could have one trade on Volatility 10 Index, which is slower and steady, while also having an open trade on Boom 300 Index.
See Deriv’s latest synthetic products and specifications
Also, remember that you can try any of the abovementioned indices with a demo account.

Part 2 How to trade Synthetic Indices
Chapter 3
What’s a tick?
Before we focus on ways to trade Synthetic Indices on Deriv, let’s first understand a basic trading concept: a tick.
Ticks are the smallest price movements in the financial markets. For example, if the price of a stock moves from $50.00 to $50.01, that onecent change is a tick.
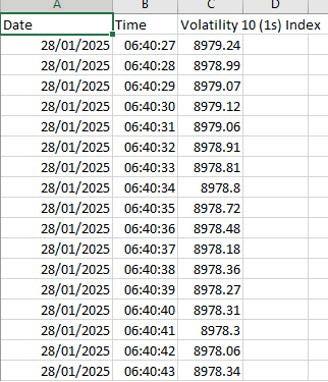
In this example of the Volatility 10 (1s) Index, we see it trading at 8,980.51. A tick would be the movement from .51 to the next price, which may be larger than just one point. For instance, it could be from .51 to .59 and still be classed as a tick. Table 3.1 shows a spreadsheet with real historical prices and times, giving you an idea of how prices move.
One-second ticks (1s): Smaller, more frequent price changes.
Two-second ticks: Larger price changes that occur less frequently. The two-second tick is shown as the Volatility 10 Index, making two seconds the default.
The choice depends on your trading style; one-second ticks cater to those seeking quick actions, while two-second ticks suit those who prefer a slower pace.
It is important to note that even if two indices share the same volatility number (such as Volatility 10 (1s) and Volatility 10), their prices do not necessarily move in tandem. Each index operates independently and may exhibit distinct price movements.
With Deriv Digital Options on Synthetic Indices, you’re in control of choosing not only the rate of volatility but also the contract length, ranging from ticks to seconds to days. Digital Options settle automatically, so there’s no need to make a closing trade. If the trade moves in your favour, any profit is added to your account balance instantly, with no waiting for settlement.
You can also have multiple trades open simultaneously. For example, you could have a Rise (buy) trade on the Volatility 10 Index to settle in 1 hour and also have a Fall (sell) trade on the same index to settle in 1 minute.
Some Options also offer a resale opportunity, allowing you to take a profit or close out at a loss if the trade isn’t going as expected, helping you salvage part of the premium.
When you trade Synthetic Indices on Deriv Trader, there are many Digital Option trades to choose from, and Deriv is always adding more. Each Option type has its own risk and reward profile, giving you flexibility in your trading strategies.
I will go through the main ones here with example trades. Remember, you can practise trading risk-free using your demo account, so I encourage you to explore Option trades without any risk. Deriv Trader offers a simple trading platform to back Synthetic Indices with numerous outcomes.
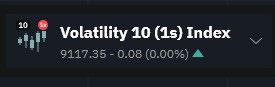
Fig. 3.1. Volatility 10 (1s) Index trading at 9,117.35 with a -0.08 change
Table 3.1. Spreadsheet showing historical prices and timestamps for the Volatility 10 (1s) Index
Whether you predict the market will go up, down, or even move sideways (range), there is an Option available.
Now that you’re familiar with ticks, it’s time to introduce you to the two main ways to trade Synthetic Indices: Options and Contracts for Difference (CFDs). I also trade both simultaneously. For example, I can have a CFD on a Volatility Index while also trading Digital Options on the same index. This can be used to enhance returns or protect gains.
In Figure 3.2, we see MT5 on web (CFDs) and Deriv Trader (Options) open simultaneously, allowing me to trade CFDs while placing Option trades at the same time. This was done using a web browser, where you can open multiple windows. A desktop setup is more suitable for opening multiple windows.
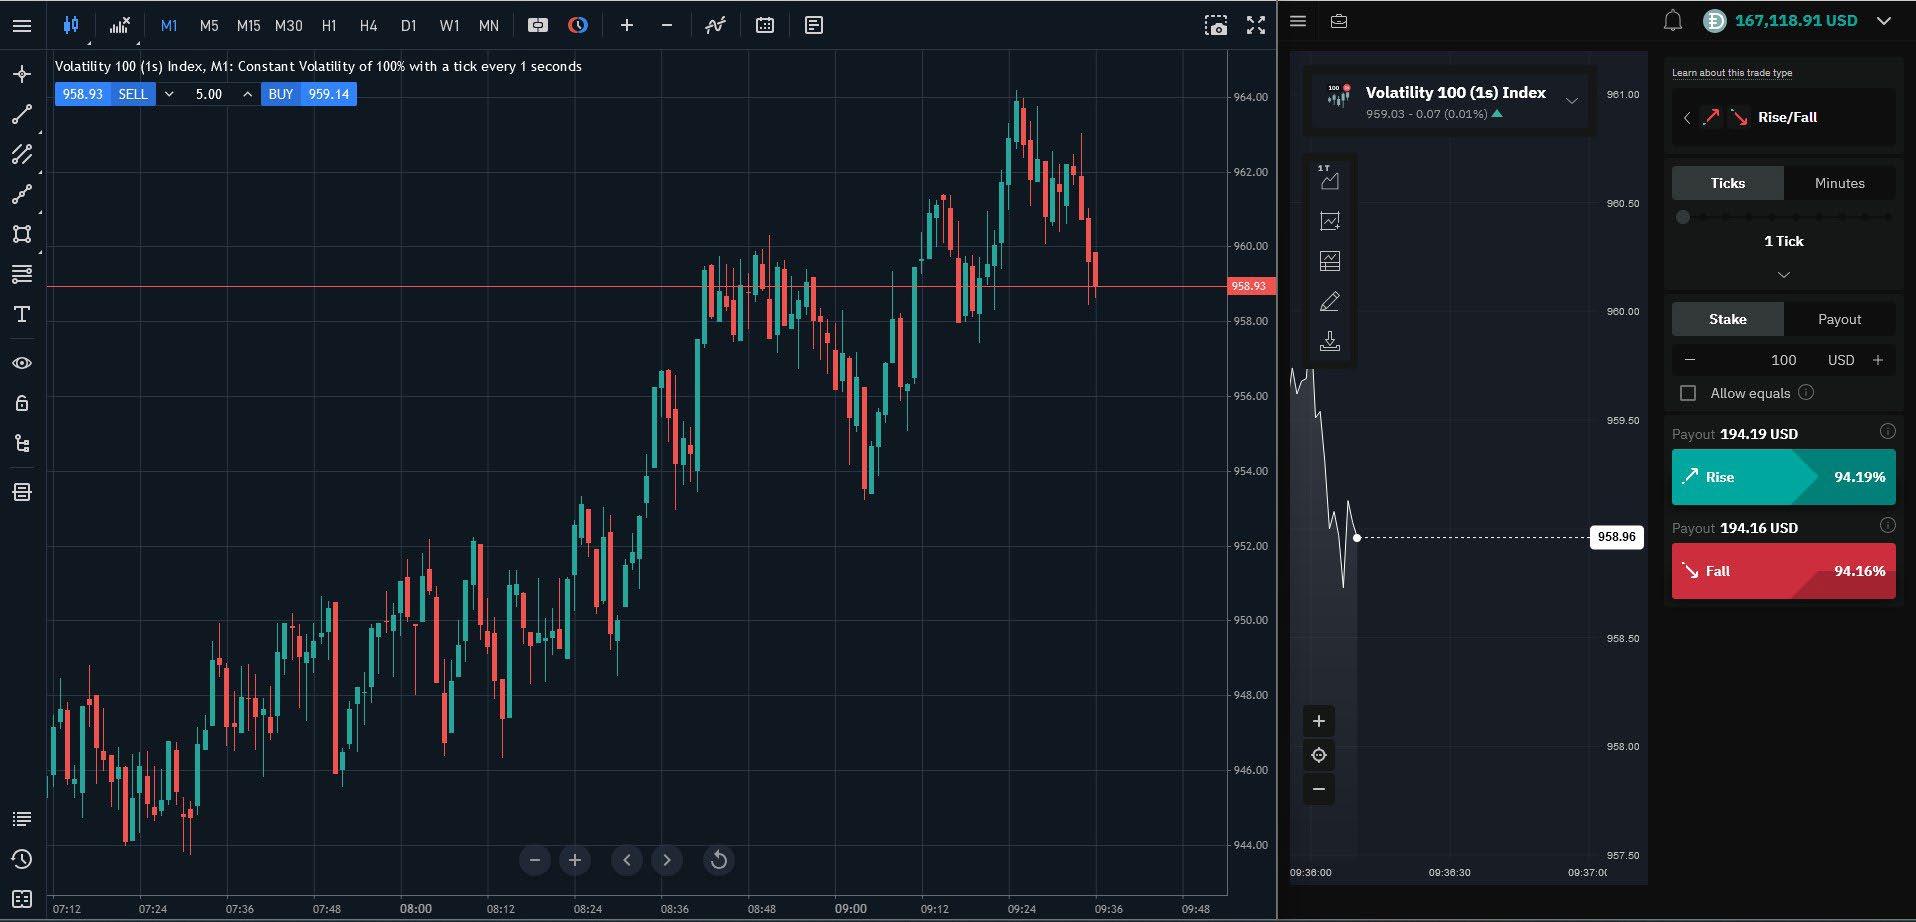
Fig. 3.2. MT5 and Deriv Trader open on a web browser, allowing for both CFD and Digital Options trading on Synthetic Indices
Chapter 4 Options1
Options, often referred to as traded options, allow you to speculate on the price movements of a Synthetic Index with a clear understanding of your risk (the premium you pay) and the potential rewards you can earn. These versatile contracts come in various forms, with durations ranging from seconds to weeks, though many traders favor shorter-term expirations for quick results. Options let you predict market outcomes, tailoring your strategy to your goals and risk appetite.
Here are the main types of Options that Deriv offers:
Digital Options: Digital Options allow you to predict the outcome from two possible results and earn a fixed payout if your prediction is correct.
Accumulator Options: Accumulator Options amplify your profit with up to 5% compounding growth per tick as long as the market price stays within a specified range.
Vanilla Options: Vanilla Options let you predict if the market price will be higher (Call) or lower (Put) than a target price at the contract’s end. The more the market moves in your favour, the higher your payout.
Turbo Options: Turbo Options let you predict if the market price will stay above (Up) or below (Down) a barrier during the contract. Your payout increases the further the price moves in your favour, based on your chosen payout per point.
Multipliers: With Multiplier Options, you select a multiplier (up to 2,000x) and predict if the market price will rise or fall from the entry price. Your payout increases as the price moves in your favour, amplified by the multiplier.

Digital Options
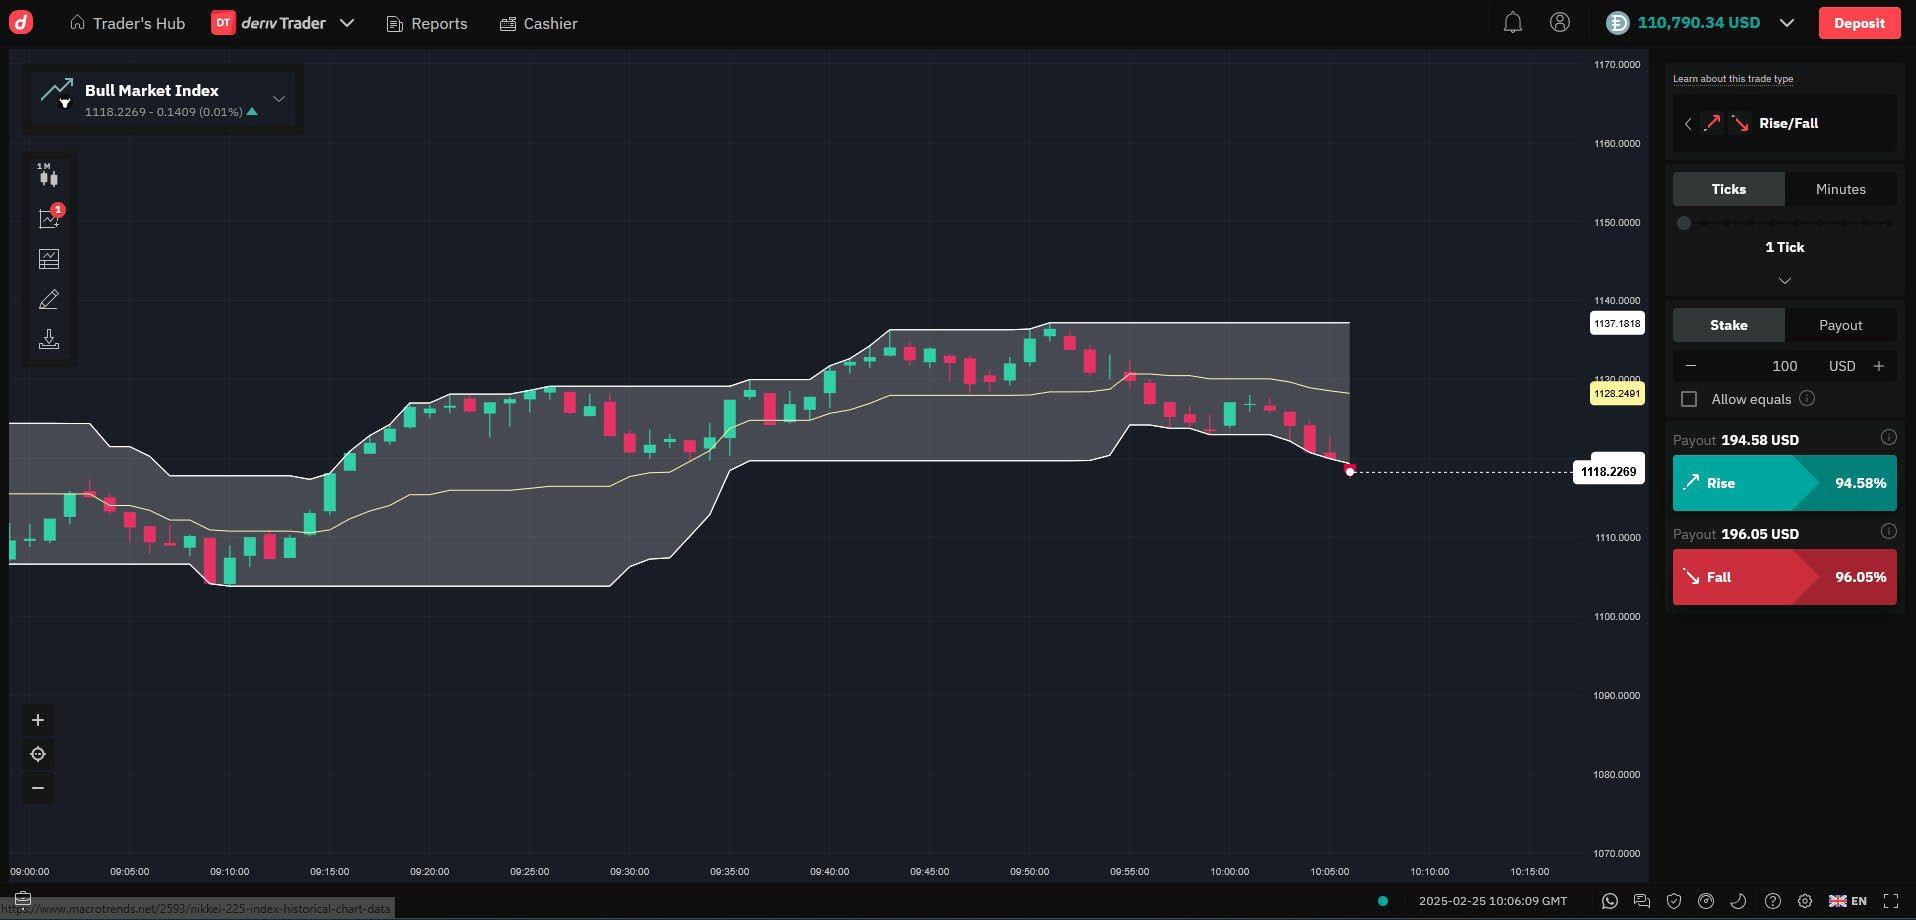
Rise/Fall
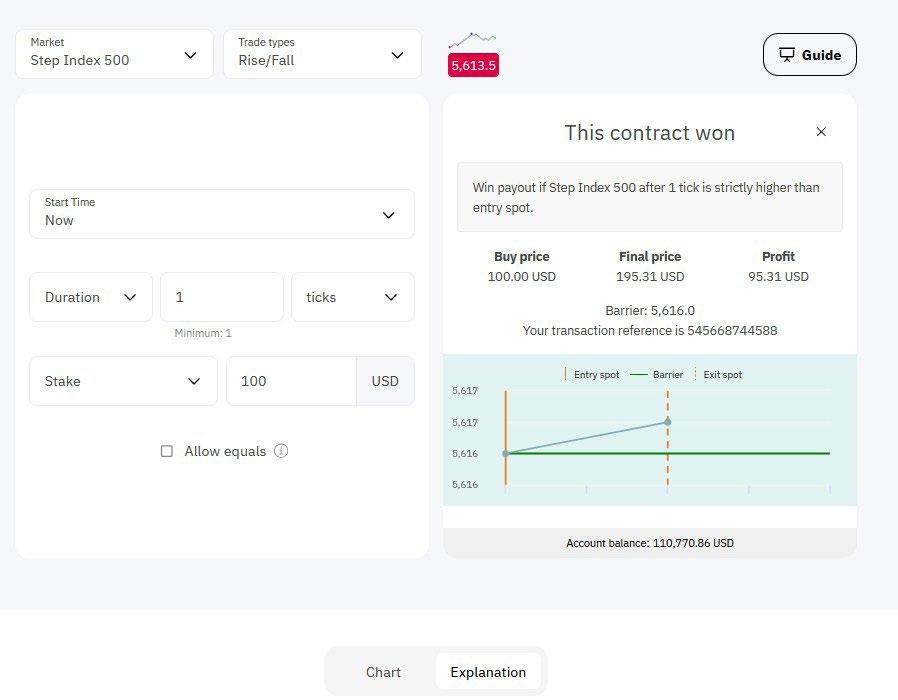
This is one of the most popular Digital Option trades and a fairly simple Option to understand. You need to predict whether the exit spot will be strictly higher or lower than the entry spot at the end of the contract period.
Let me walk you through an example in three steps:
1. Choose the underlying index – in this case, I have selected the Volatility 10 (1s) Index.
2. Decide on the duration – I have chosen a short duration of 5 ticks.
3. Choose your stake or option premium – in this case, 10 USD.
Now, decide between Rise or Fall – I have chosen Rise, which has a potential return of 94.20%.
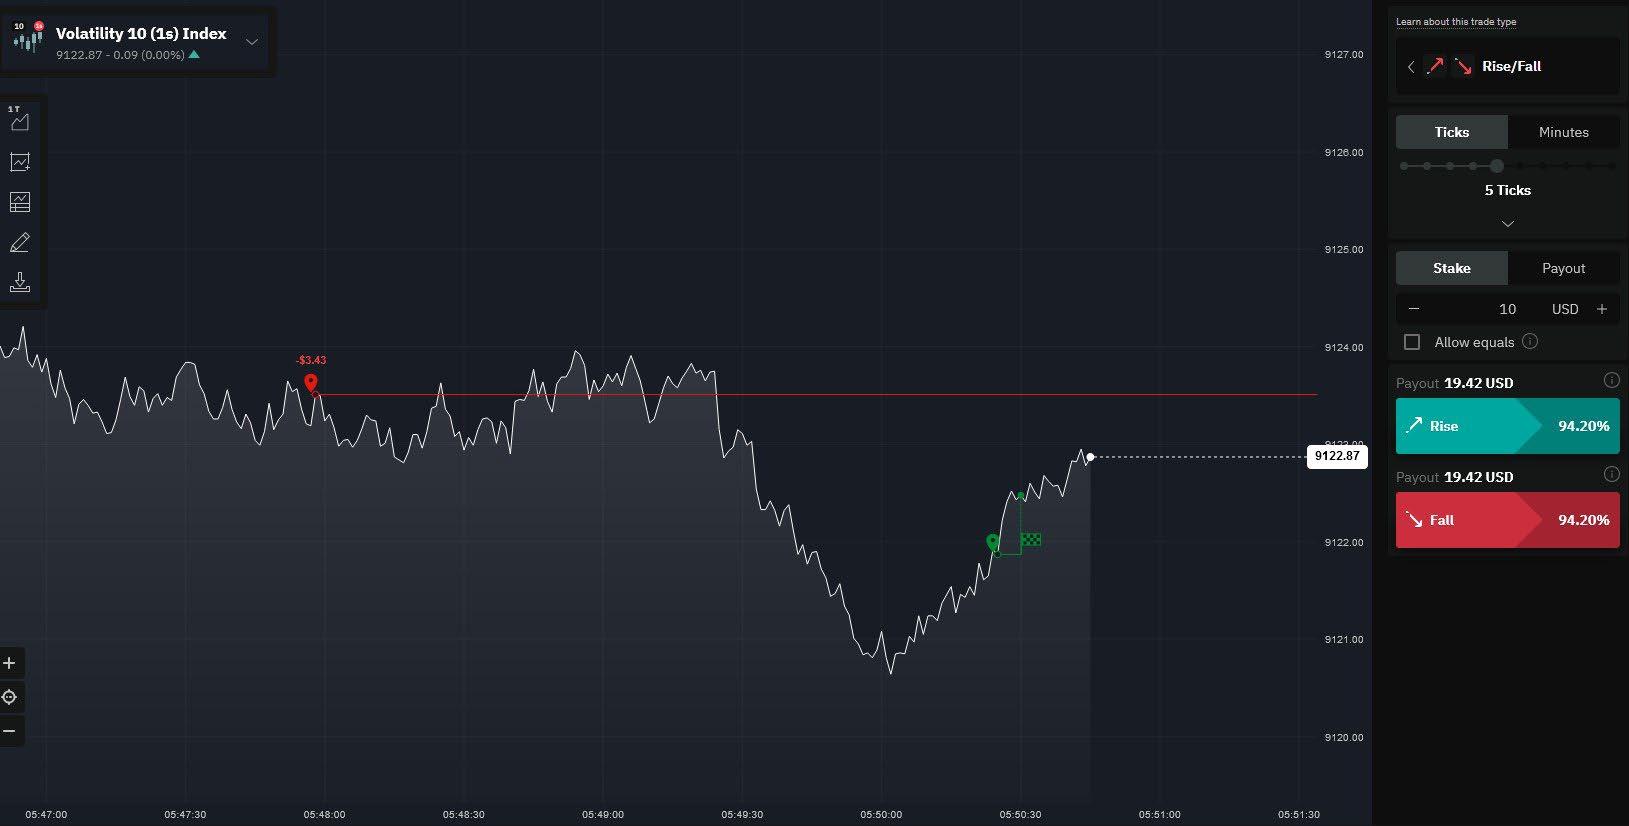
Fig. 4.1. Rise/Fall trade example on the Volatility 10 (1s) Index with a 5-tick duration and a potential 94.20% return
As you can see in Figure 4.2, the trade won and settled automatically. My account was recredited with the $10 stake plus $9.42 in profit.
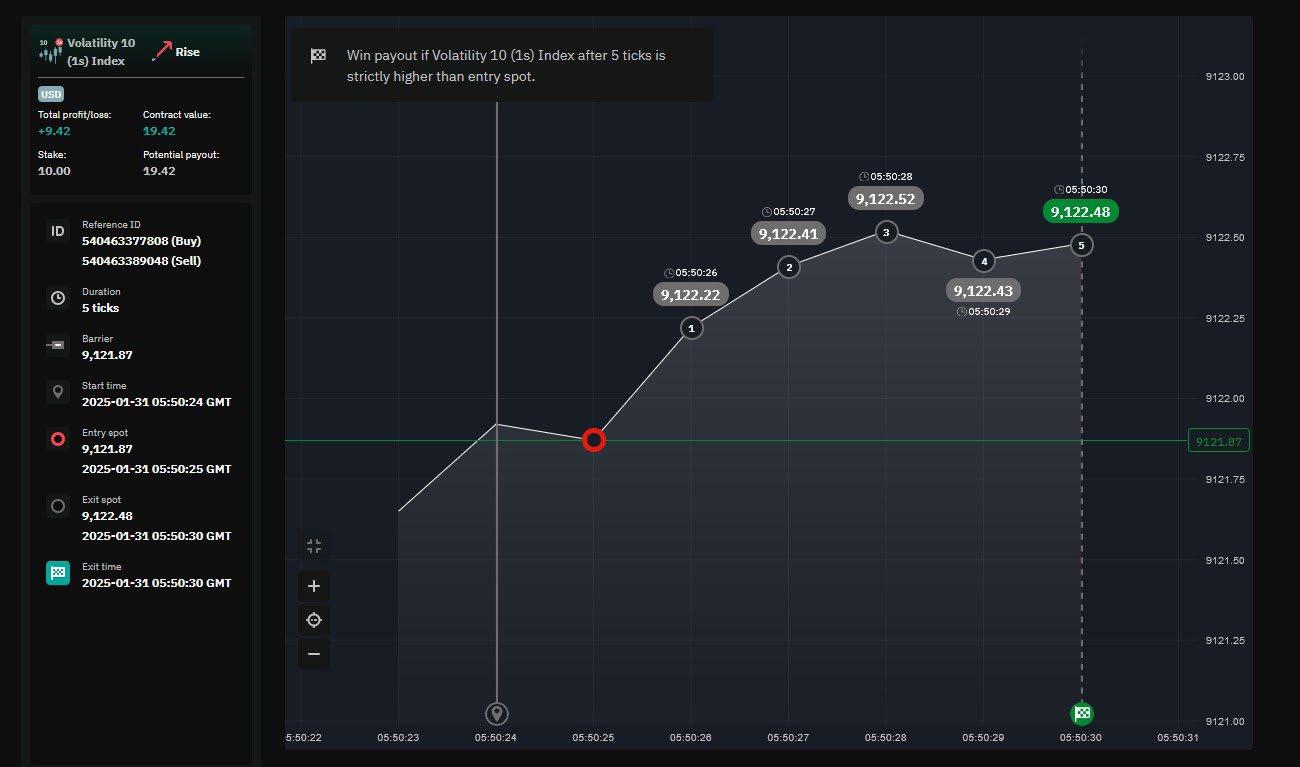
You can see the entry spot and the exit spot. Remember, it’s not about the magnitude of the move: as long as the price closes above the entry spot, the trade ends in profits.
Note: Every contract, whether on a real account or a demo account, is fully audited and transparent. You can see a Reference ID for both the opening and closing of the trade. Should any disputes arise with Deriv, the trade can be traced back and investigated.
Once the trade is placed, it’s on the Deriv server. If you lose internet access or your phone freezes, the trade stays active, which is good to know if you’re on the move.
Fig. 4.2. Price closed above the entry spot, resulting in a winning Rise/Fall trade
Higher/ Lower
In this Digital Option trade type, you choose a target price (barrier) and predict whether the market price will be higher or lower than the target at the end of the contract.
• If you select “Higher”, you earn the payout if the exit spot is strictly higher than the barrier.
• If you select “Lower”, you earn the payout if the exit spot is strictly lower than the barrier.
• If the Exit spot is equal to the Barrier, you don’t earn the Payout.
Tip: Click on the “Learn about the trade type” link in Deriv Trader to watch a short video explaining the trade.
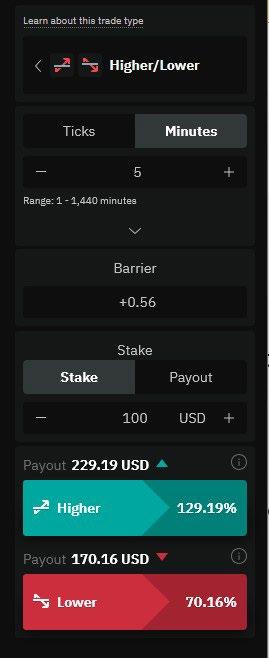
Fig. 4.3. Higher/Lower Digital Option setup with a 5-minute duration and +0.56 barrier
Touch/No Touch
When trading this Digital Option type, you’ll choose a target price (barrier) and predict if the market price will touch or not touch the target during the contract period.
• If you select “Touch”, you earn the payout if the market touches the barrier at any time during the contract period.
• If you select “No Touch”, you earn the payout if the market never touches the barrier at any time during the contract period.
In this example, I’m using a longer 30-minute duration. As before, you can select the underlying index and stake. The key difference here is the barrier: if the barrier is set further from the spot price, the “No Touch” potential returns would go down.
If the barrier is set closer, the potential returns are higher—in this case, a potential 412.50% return. However, this generous return is available because it is less likely that this trade will succeed.
It’s similar to buying a far out-of-the-money Option with a short time value. The cost of the Option (premium) is low because it is unlikely to pay out. It offers a high potential reward but a lower probability of success.
Some traders buy a selection of these out-ofthe-money Options, knowing that most will expire worthless. However, if just one or two expire with a high return, they can still achieve an overall profit.
If we look at the Touch trade with the same market, it offers a 20.6% return—still a good return for a 30-minute option. The reason for the lower potential return is the higher chance of the index touching the barrier.
Note: If you select a 30-minute duration and choose “Touch,” the trade wins and settles immediately if the barrier is reached within, say, 3 minutes. You don’t have to wait for the contract to expire. Similarly, for “No Touch,” if the barrier is touched before the 30 minutes are up, the Option loses and expires at zero.
Remember, with Digital Options, your maximum risk is always known: it’s your stake or premium, in this case, $10. There are no margin calls or maintenance requirements.
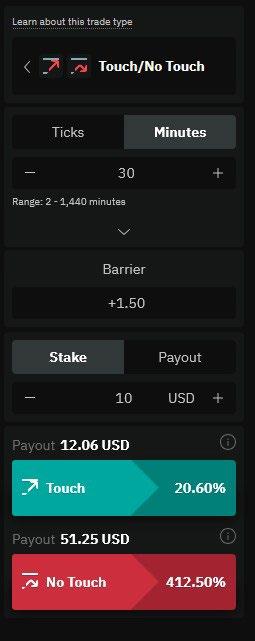
Fig. 4.4. Touch/No Touch Digital Option setup with a 30-minute duration and a +1.50 barrier
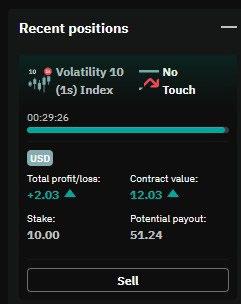
Close/Sell back: With most Deriv Options, you can close the trade before expiration.This could be with a profit or loss: either to lock in a profit or recover part of your stake if the trade isn’t going your way. However, you usually cannot sell back Options with less than 60 seconds remaining until expiration.
In the example seen in Figure 4.4, a sell-back price is offered. I can close the trade for a $2.03 profit, even though the Option had only been open for 34 seconds.
Digits
These are typically short-term Options based on the last digit of an index. For example, if you trade Matches/Differs, you’ll predict if the last digit of the last tick will either match or not match a specific digit, such as 0.
We also have Even/Odd, which is self-explanatory, and Over/Under. For example, if you select Over 3, the trade loses if the index expires with a 0, 1, 2, or 3. If it ends with 4 to 9, the Option wins.
The available digits range from 0 to 9, and Options run from 1 tick to 10.
Again, we select the underlying index and stake.
Let’s go through an example. Here, I have gone with Volatility 10 (1s) index.
I have chosen 1 tick, a $100 stake, and Under 7, which offers a 40.45% return.
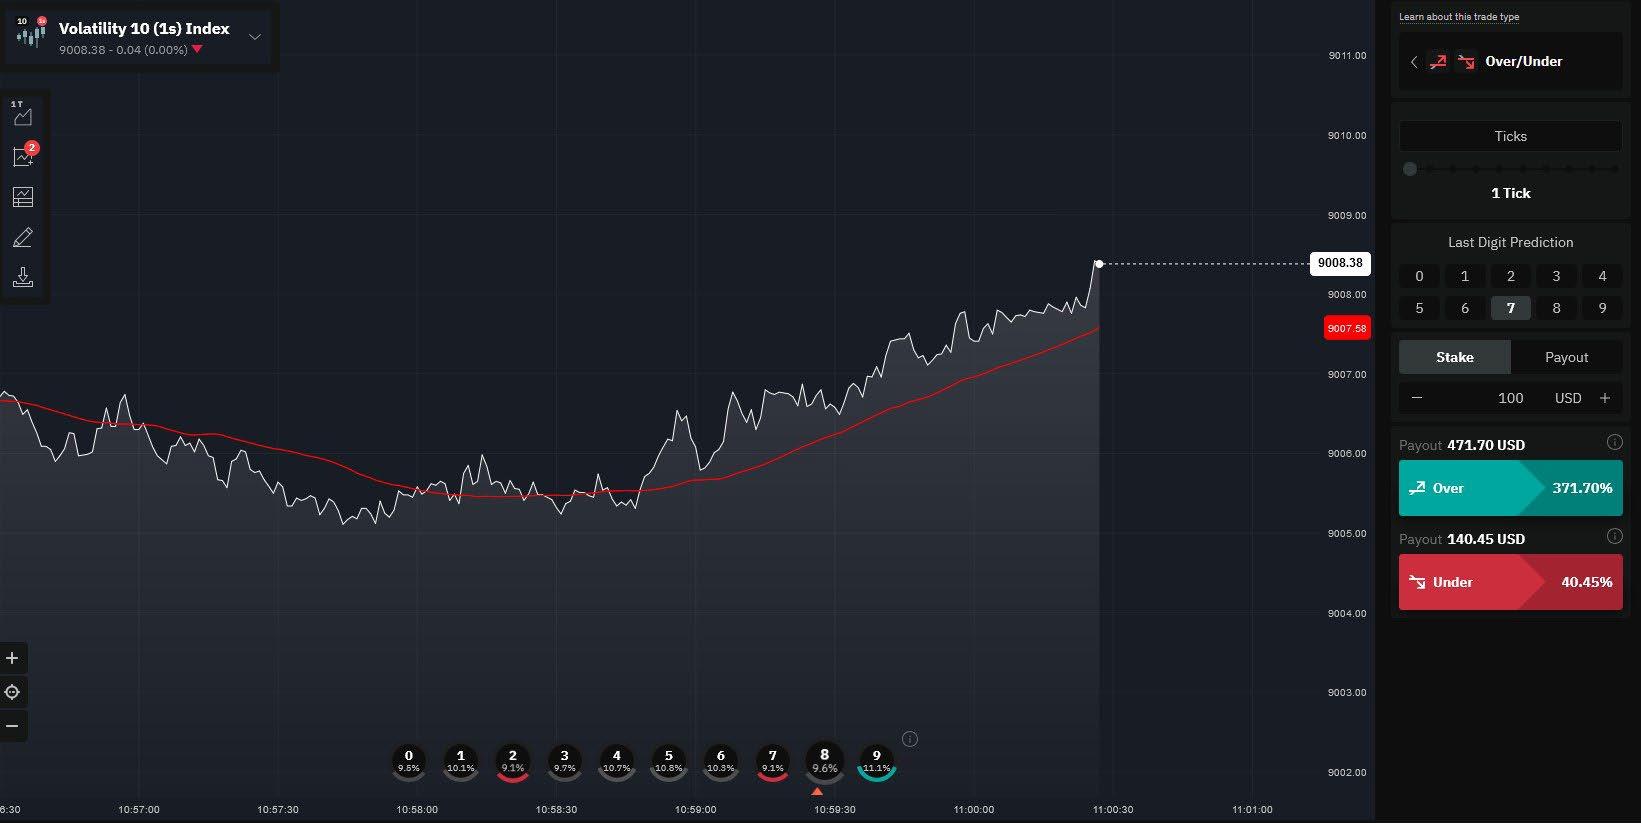
Fig.
To win, the next digit needed to be 0 to 6. If it was 7, 8, or 9, I would lose the $100 stake.
As you can see, the exit spot was 1, which is under 7, so the trade won. My account was recredited with the $100 stake plus $40.45 profit.
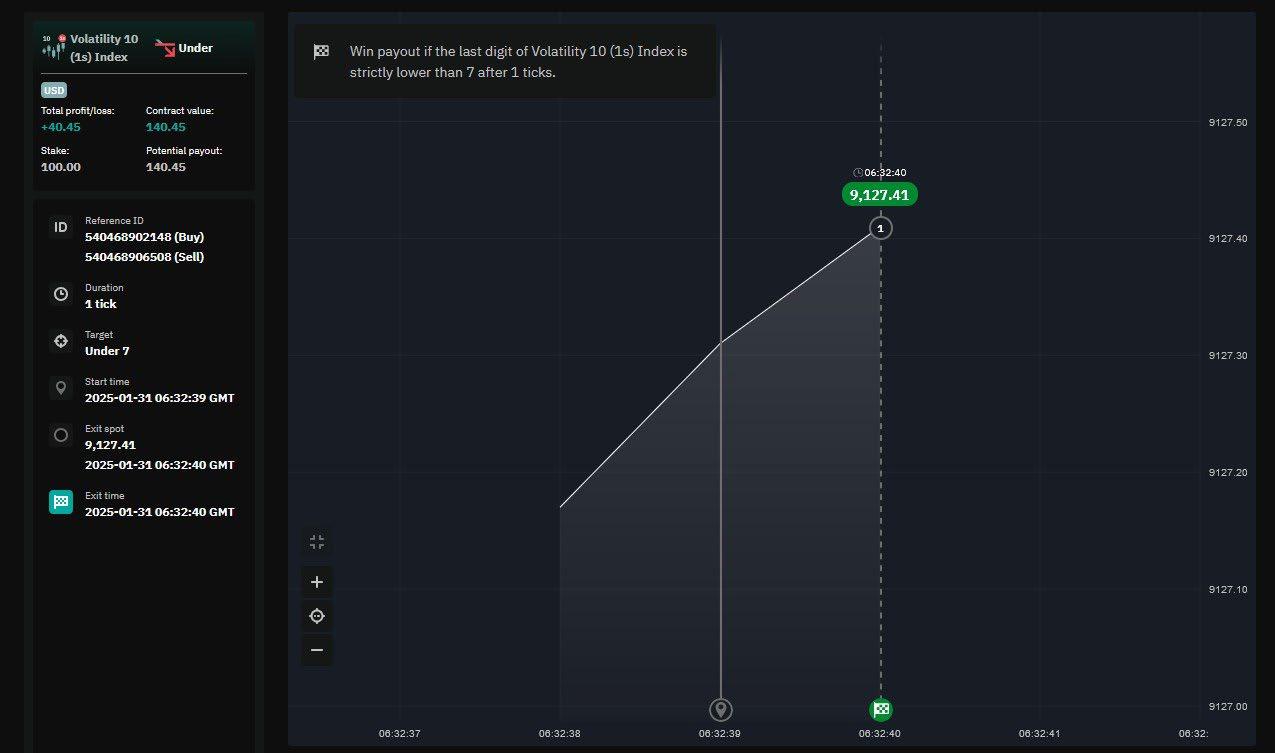
Fig. 4.6. Winning ‘Under 7’ Digital Option trade on Volatility 10 (1s) Index with a 1-tick duration.
Automating trades
So far, I’ve focused on manual trading, which is a good place to start. However, with advancements in technology and Artificial Intelligence (AI), the trend is shifting towards automated trading.
Deriv offers Deriv Bot, which allows you to set parameters and automate trades without placing them manually. Other software providers can also integrate with Deriv via API, enabling you to link your Deriv account to external trading software.
I’ll cover Deriv Bot in more detail later, but it’s worth considering. You can test strategies using Deriv Bot with a demo account, and it also provides ready-made templates to help you get started quickly.
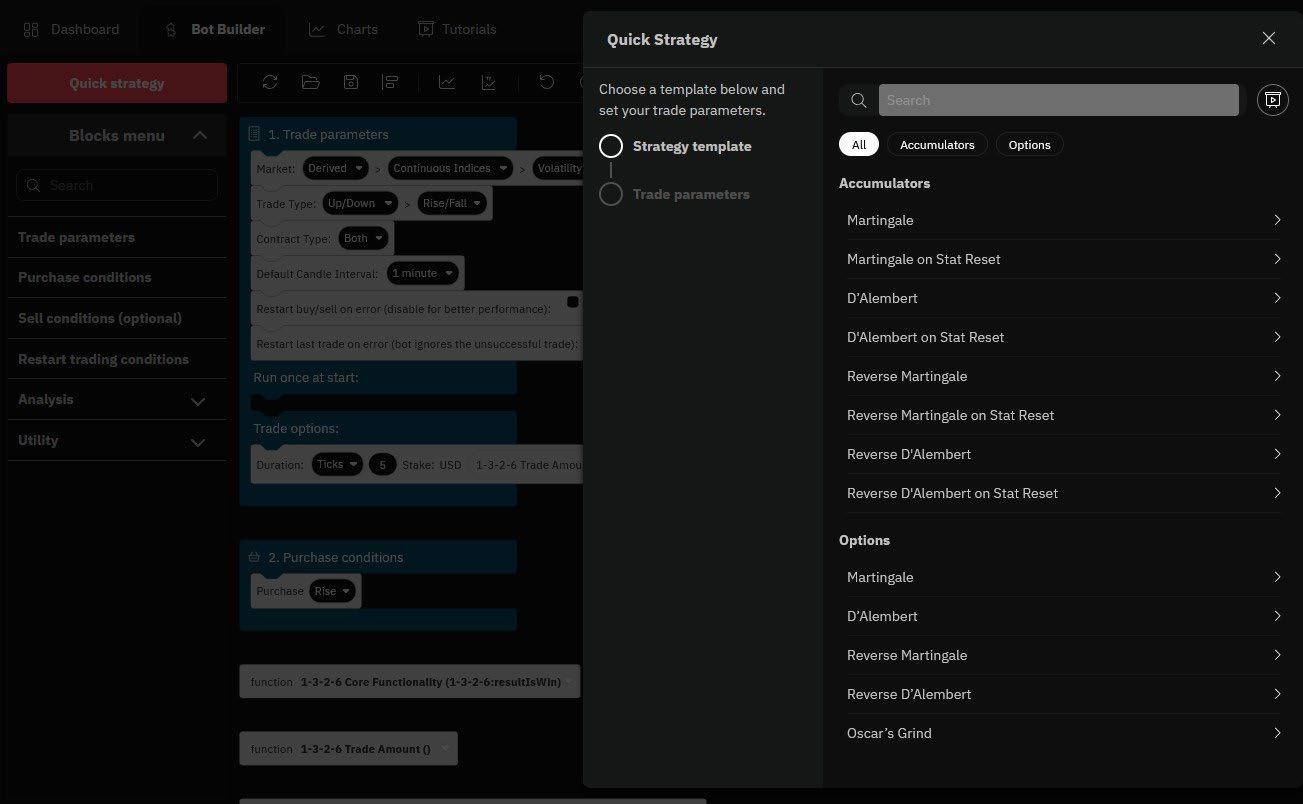
Fig. 4.7. Deriv Bot’s strategy builder interface, showcasing quick strategy templates for automated trading
Accumulator Options
This is a product I personally like, as it has strictly limited risk but high potential rewards. The risk is fixed (for example, $10), but the potential profit is not—unlike some of the Options mentioned. Instead, it runs or accumulates over time, hence the name.
The skill with this type of Option is timing the exit—closing the trade before the barrier range is reached. If the barrier is breached before you close out, your stake and any accumulated gains are lost.
You can set an auto take profit or close the trade manually.
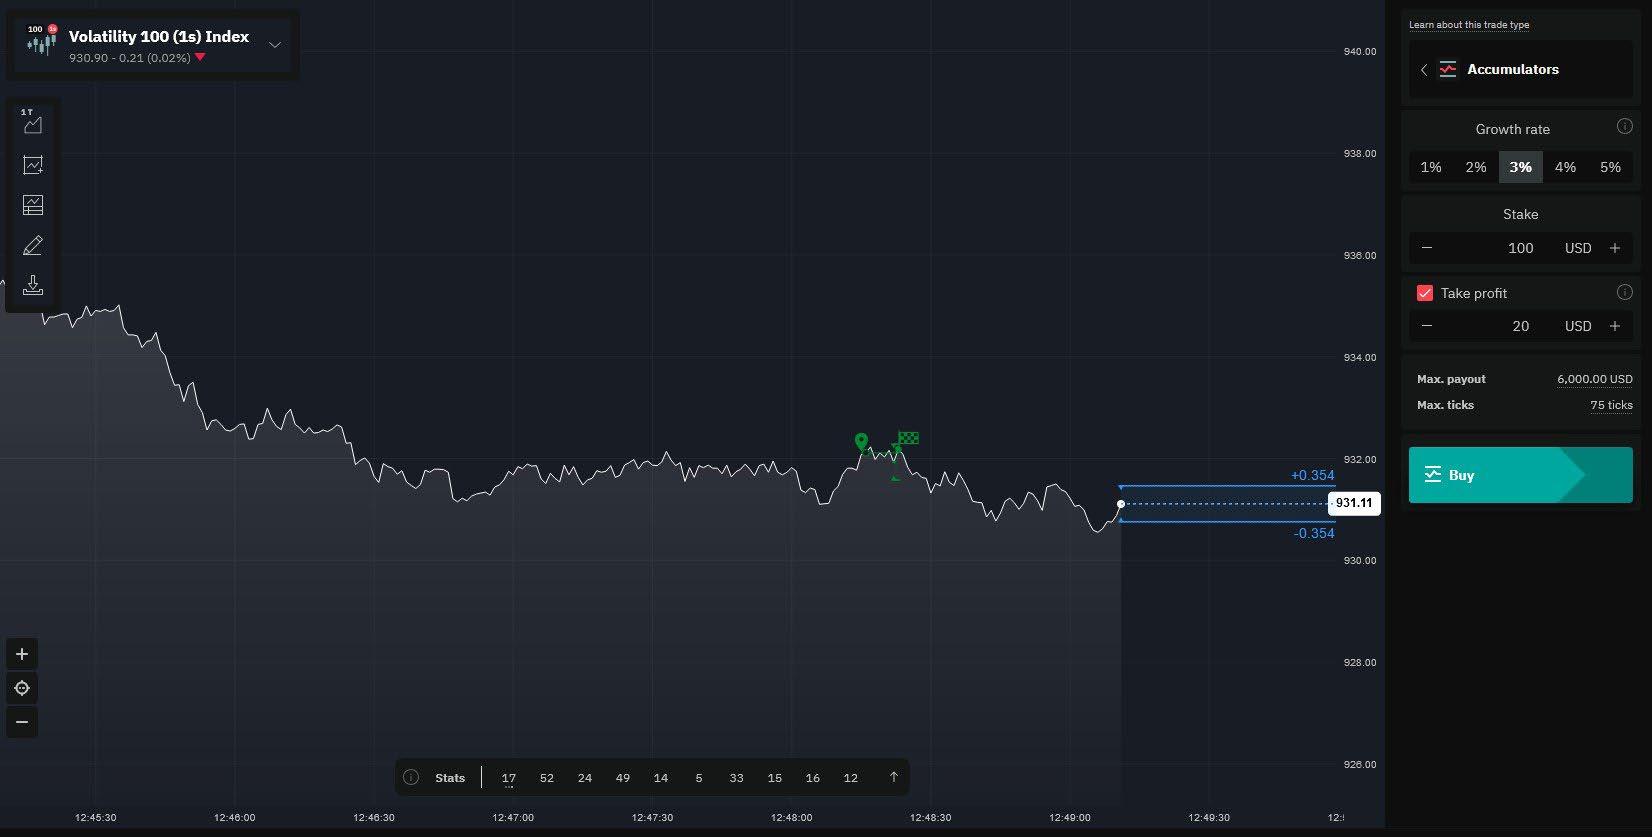
Let’s go through an Accumulator Option. In Deriv Trader, select Accumulators, then choose the underlying index—in this case, Volatility 100 (1s) Index.
Next, select your stake, which in this example is $100. You can also choose a growth rate between 1% and 5%. A higher growth rate means narrower bands and higher risk, while a lower growth rate (such as 1%) offers wider bands with lower risk.
This example was done using a 3% growth rate.
Then, press Buy—with an Accumulator Option, you always buy first.
Once the trade is active, the Buy button turns into a Sell button, displaying the trade’s value and accumulated gains. To secure profits, you need to press Sell before the barrier is triggered. If you don’t sell in time and the barrier is reached, the trade will close, and you’ll lose your $100 stake along with any accumulated profits.
Fig. 4.8. Accumulator Option trade on the Volatility 100 (1s) Index, showing growth rate selection and take profit settings
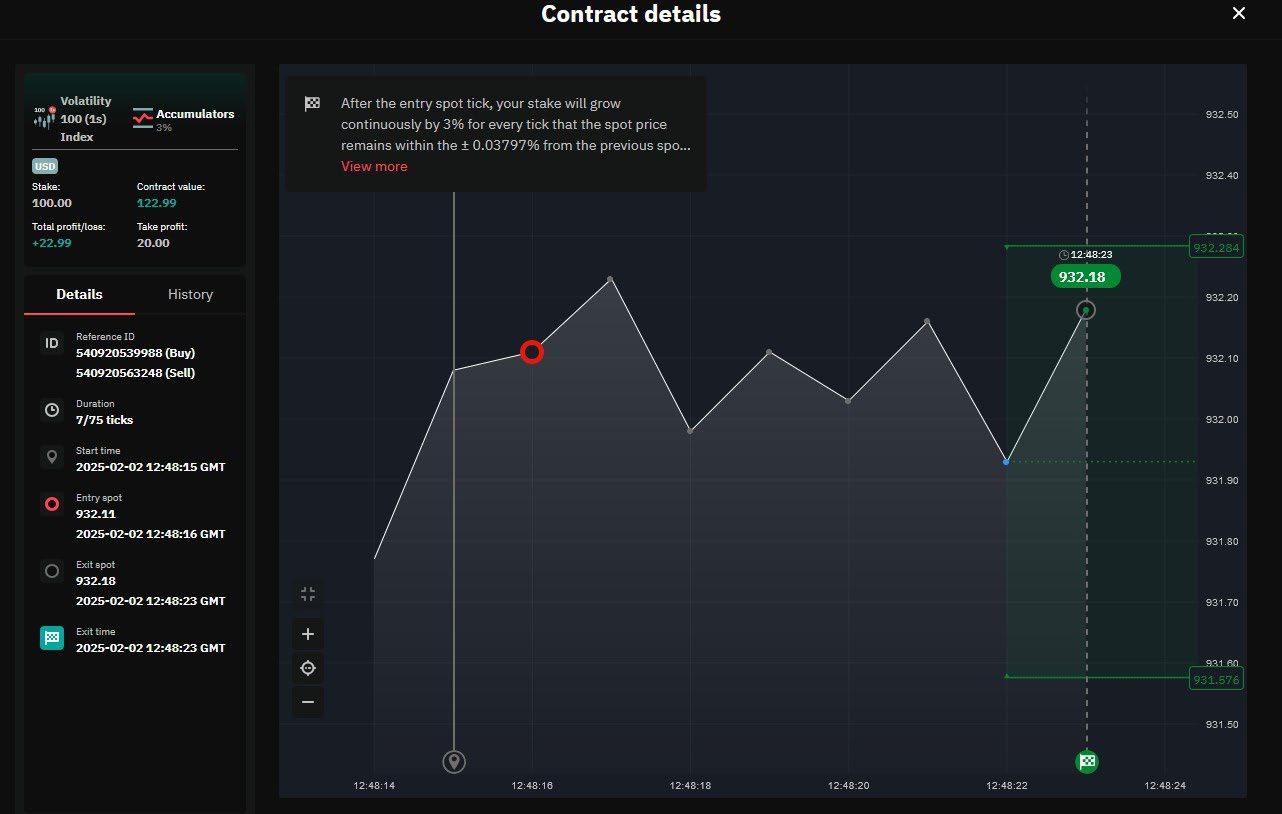
You can also set an automatic take profit. In this example, I set a $20 take profit, but the trade actually settled slightly higher at $22.99.
You can trade Accumulators with a demo account. I’ve also written a dedicated guide on Accumulators, which you can download here: Accumulators Guide
Additionally, check out the Deriv YouTube channel, where you’ll find videos on various financial products, including Accumulators. I also demonstrate trades step by step in these videos.
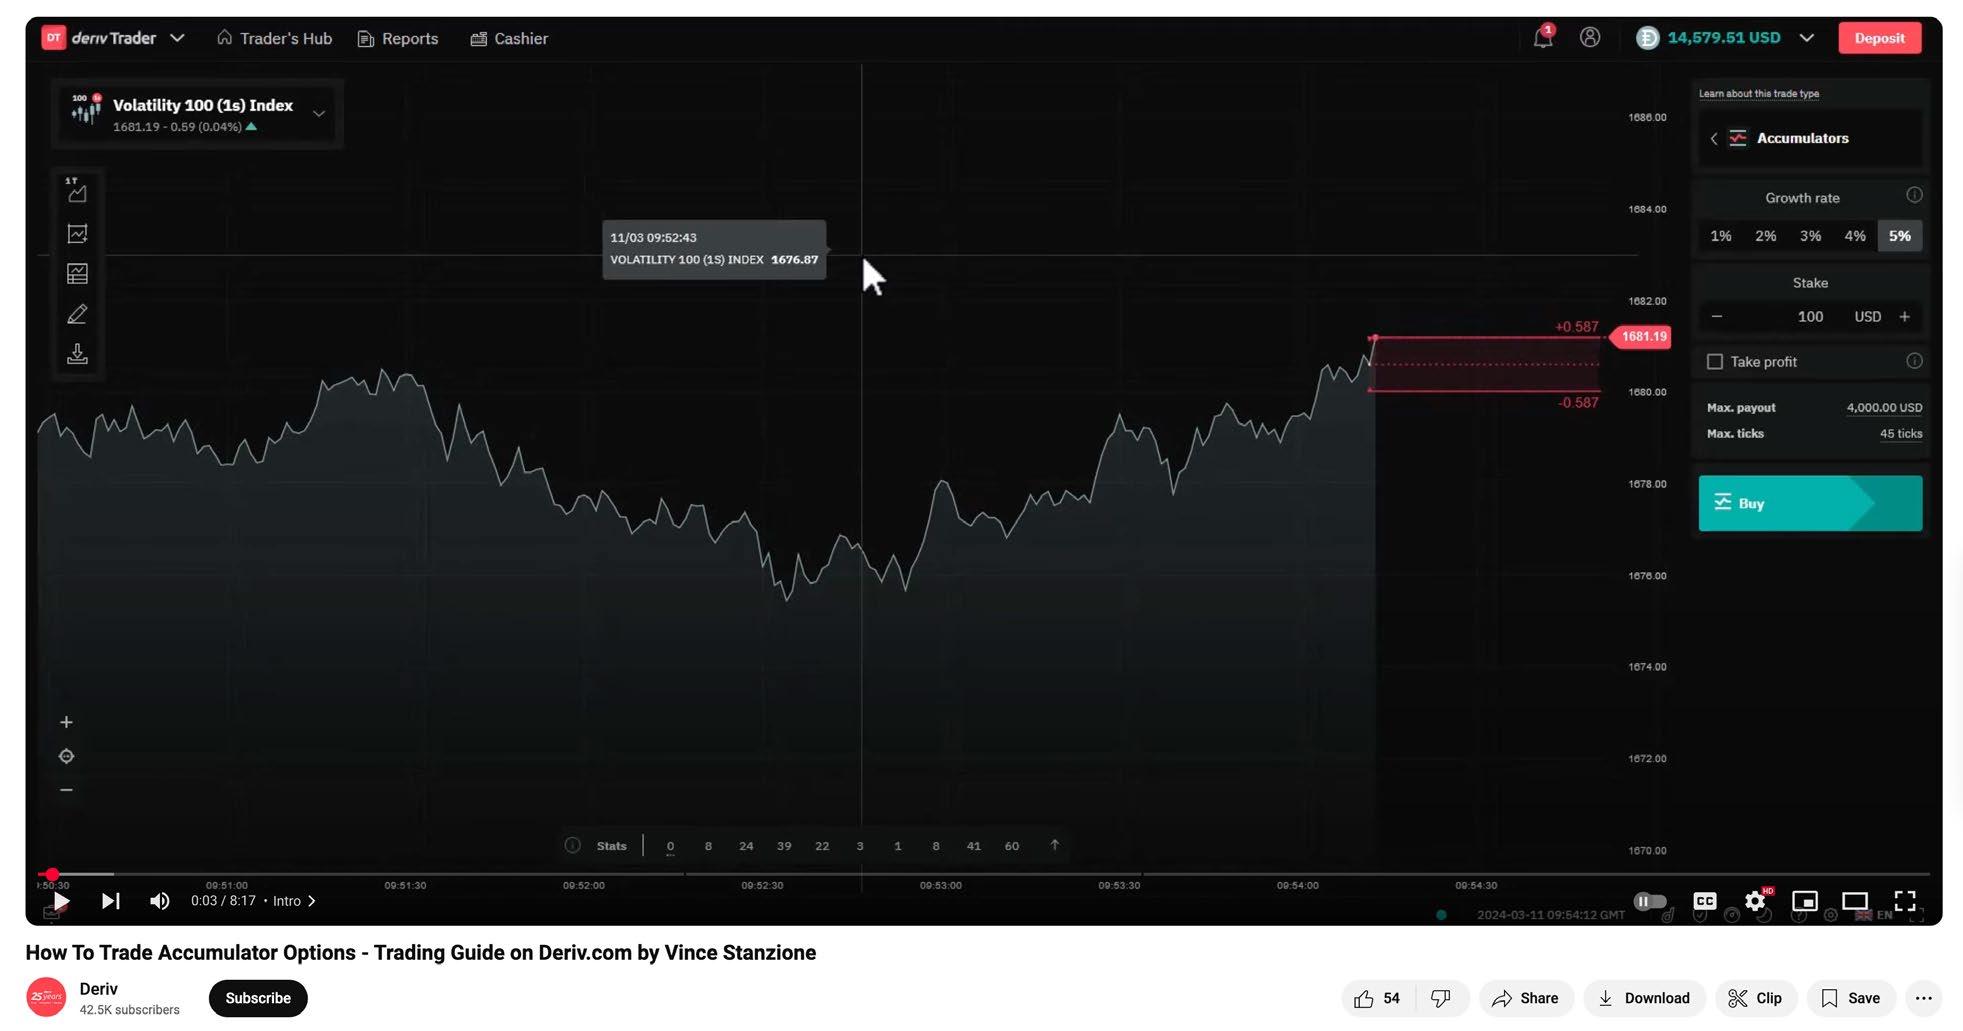
Fig. 4.9. Accumulator Option trade on Volatility 100 (1s) Index with a 3% growth rate, successfully reaching the take profit target.
Fig. 4.10. Deriv YouTube tutorial on trading Accumulator Options
Turbo Options
With Turbo Options, you can earn a payout if your prediction is correct and the spot price does not touch or breach a predetermined barrier.
Turbo Options allow you to predict the direction of the underlying asset’s movement.
• You receive a payout at expiry if the spot price never breaches the barrier during the contract period. If it does, the contract terminates early.
• If you select “Up”, you earn a payout if the spot price never drops below the barrier.
• If you select “Down”, you earn a payout if the spot price never rises above the barrier.
Your payout is calculated as:
Payout per point × Distance between the final price and the barrier
To make a profit, your payout must be higher than your initial stake.
You can sell the contract up to 15 seconds before expiry, in which case Deriv will pay you the contract value. However, if you choose a tick-based duration, you won’t be able to terminate the contract early.
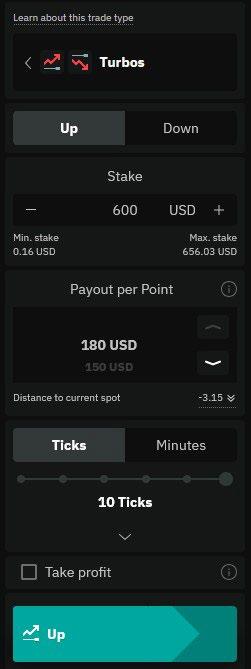
Fig. 4.11. Turbo Options trade setup with a 10-tick duration, $600 stake, and payout per point of $180.
Multipliers
Multipliers give you the opportunity to profit by up to 2,000x if the market moves in your favour. Losses are limited only to your initial capital.
• Choose a multiplier (up to 2,000x) and predict whether the market price will go up (bullish) or down (bearish) compared to the entry price.
• Your potential payout increases as the market moves in your predicted direction, boosted by the multiplier.
• Losses are limited to the initial amount you put into the contract.
• There are no margin calls or maintenance requirements.
If you select “Up”, your total profit/loss is calculated as:
(Percentage increase in the asset price × Multiplier × Stake) – Commissions.
If you select “Down”, your total profit/loss is calculated as:
(Percentage decrease in the asset price × Multiplier × Stake) – Commissions.
Additional risk management features include:
• Take Profit – Automatically closes the trade when a set profit level is reached.
• Stop Loss – Limits potential losses by closing the trade automatically at a predefined level.
• Deal Cancellation – Allows you to cancel the trade within a specified time frame.
You can close your trade anytime to secure profits or limit losses.
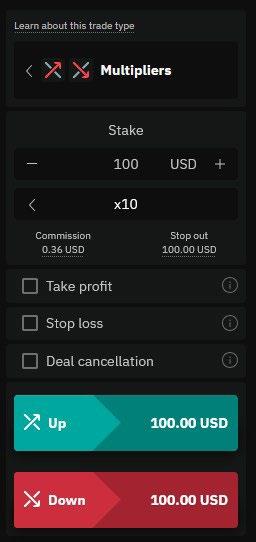
Fig. 4.12. Multipliers trade setup with a $100 stake, 10x multiplier, and risk management options.
Vanilla Options
Earn a potentially high payout with Vanilla Options by making correct predictions within a timed contract based on market conditions.
Vanilla Options allow you to predict the market direction by purchasing a Call for an upward (bullish) move or a Put for a downward (bearish) move.
If you select Call, you earn a payout if the final price is above the strike price at expiry. Otherwise, you receive nothing.
If you select Put, you earn a payout if the final price is below the strike price at expiry. Otherwise, you receive nothing.
Your payout is calculated as:
Payout per point × (Final price – Strike price)
You will only earn a profit if your payout exceeds your initial stake.
Figure 4.13 shows a Vanilla Option trade I made:
• My stake was $100, and I purchased a Put Option, expecting the price to move lower.
• The duration was 5 minutes, and the trade resulted in a $119.92 profit.
• I let the Option run to expiration, so it closed automatically, but I could have closed it earlier.
• The transaction times show the trade lasted exactly 5 minutes.
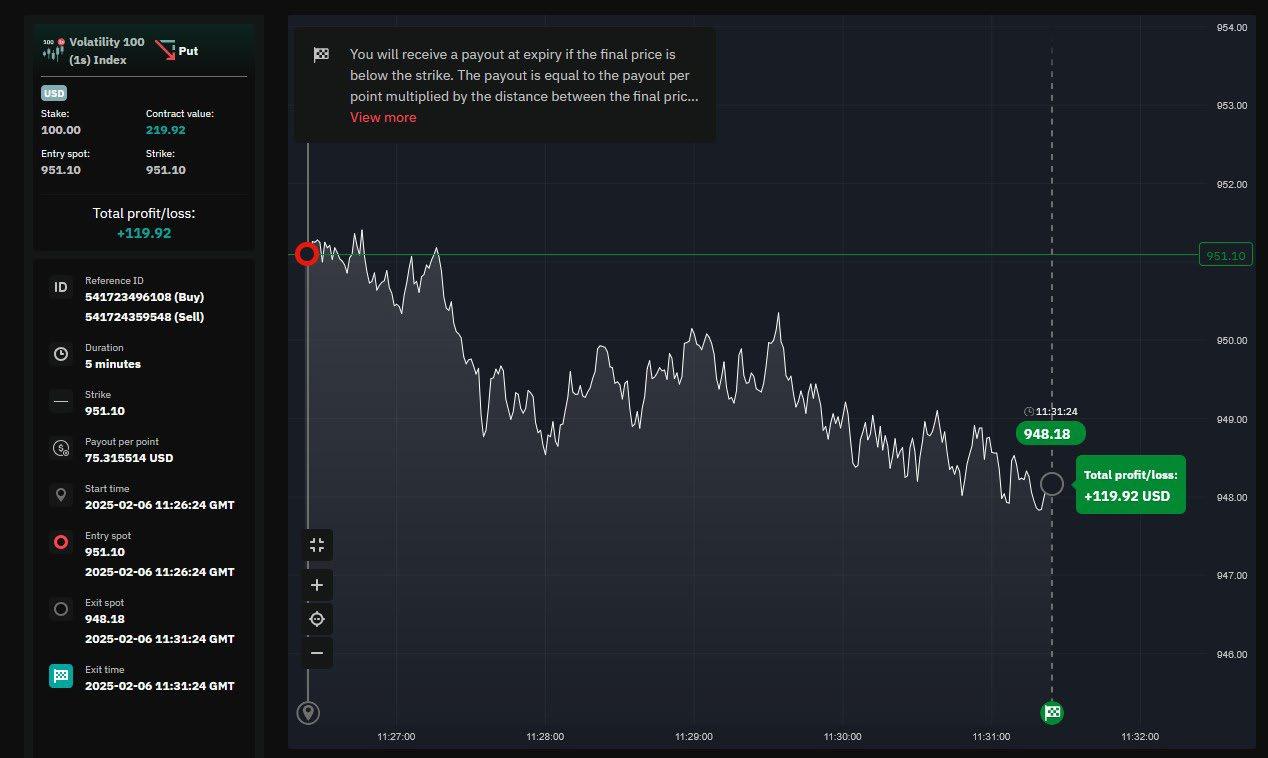
Fig. 4.13. Vanilla Option Put trade on Volatility 100 (1s) Index, earning a $119.92 profit in 5 minutes
Options on other markets
While I have focused on Synthetic Indices, it’s good to know that Deriv also offers Options on Forex currency pairs like EUR/USD, commodities like Gold, and Stock Indices like US Tech 100 (NASDAQ 100). These can all be traded using Deriv Trader, so there’s no need for an additional account.
The main differences are:
• Traditional markets have set trading hours and are closed on weekends, unlike Synthetic Indices, which operate 24/7.
• Very short-duration Options (e.g., under 5 minutes) are not typically available for these markets— the current minimum is 5 minutes.
• Maximum trade size limits may be smaller compared to Synthetic Indices, which offer higher liquidity and larger trade sizes.
Here we see an example of a rise/fall option on Gold. The parameters are the same as a synthetic index.
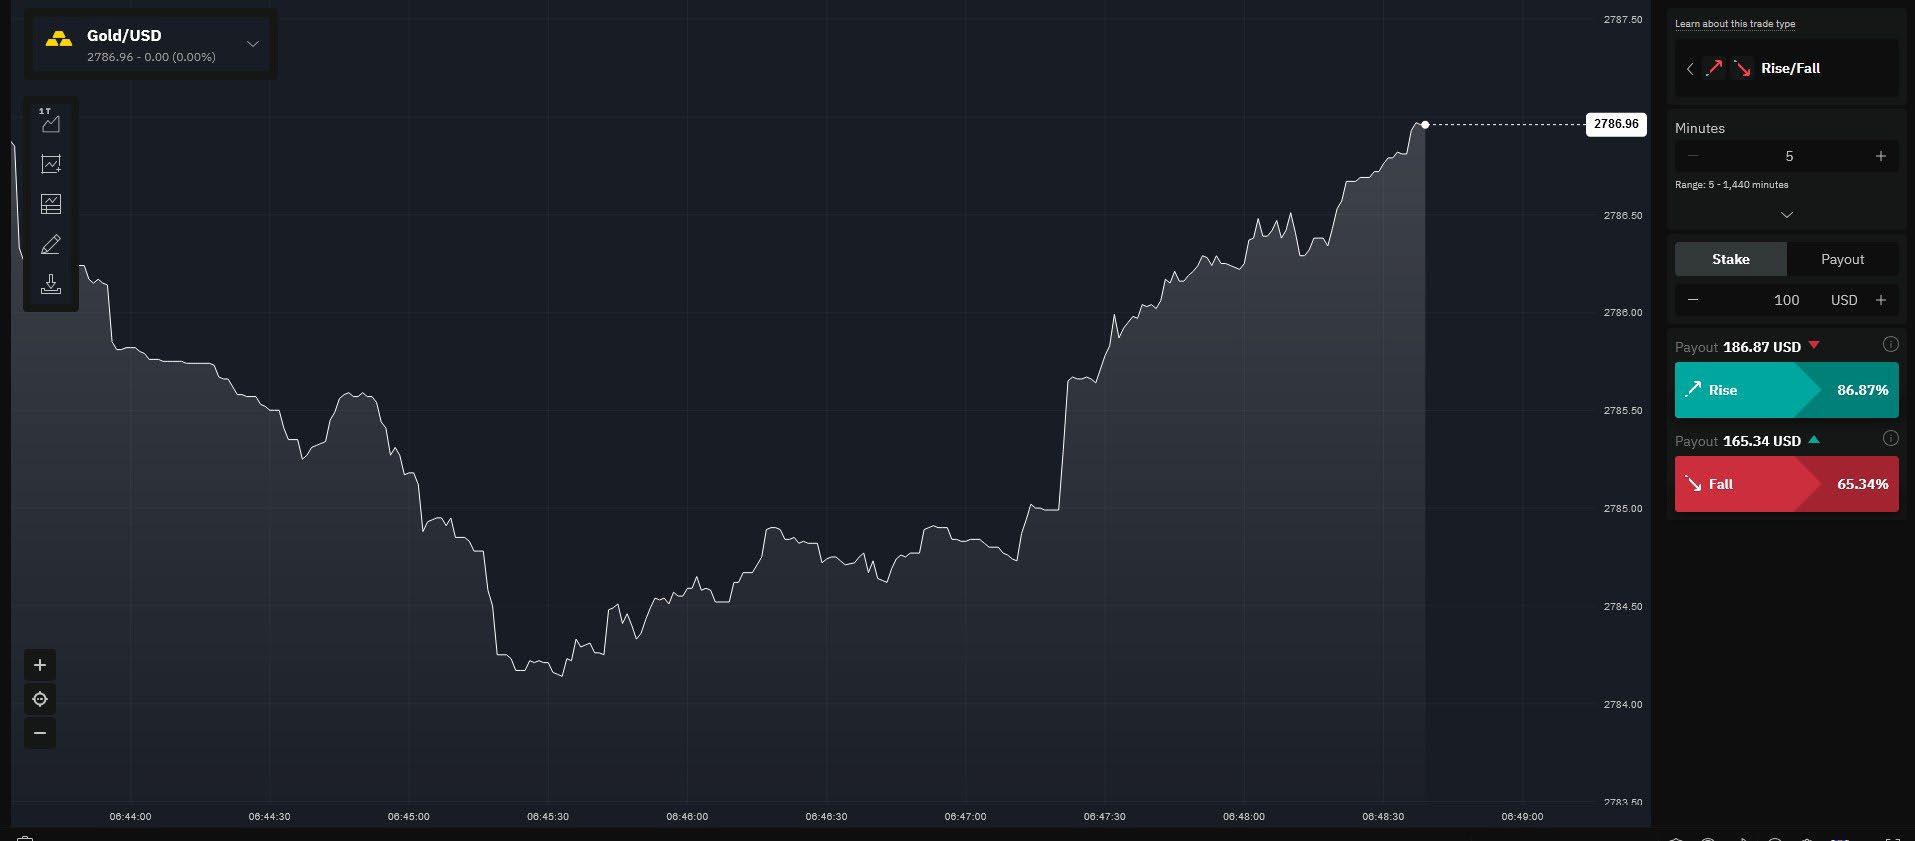
Fig. 4.13. Vanilla Option Put trade on Volatility 100 (1s) Index, earning a $119.92 profit in 5 minutes
In Figure 4.16, we see Deriv Trader on a mobile phone, featuring the popular US Wall Street 30 Index, which tracks the top 30 US-listed stocks. This index is widely followed and reported, alongside the US 500, another major US index. In this example, a Rise/Fall trade lasts 15 minutes, with a maximum risk (stake) of $80.
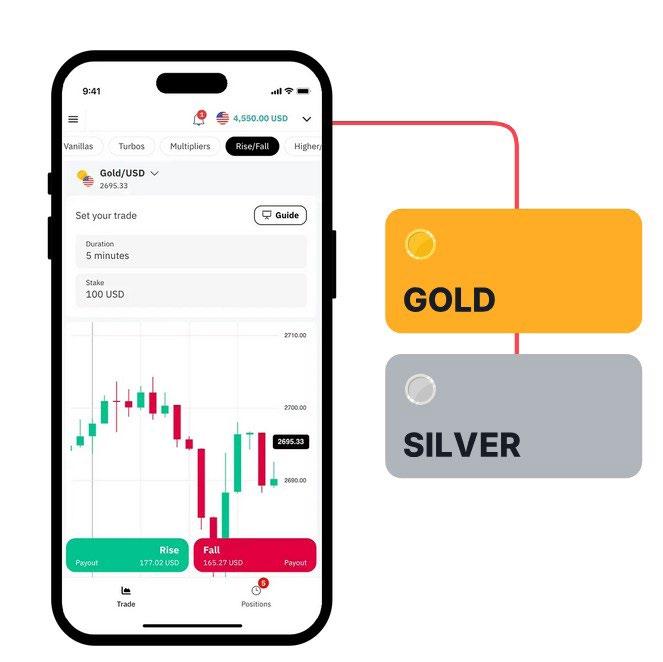
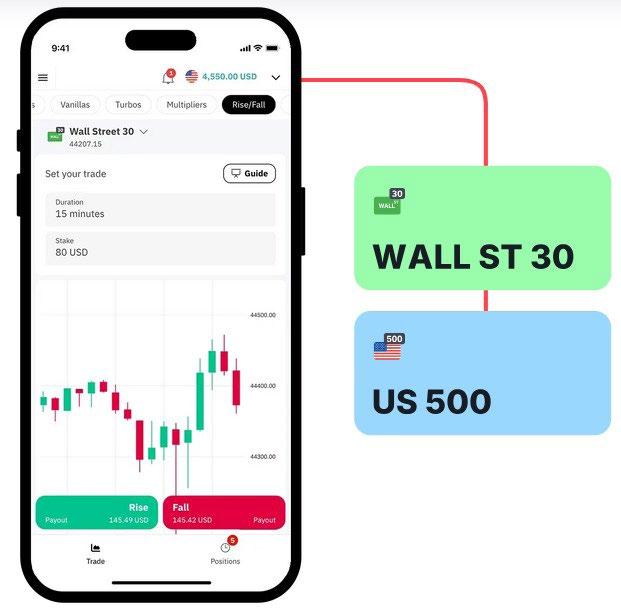
Fig. 4.15. Deriv Trader mobile interface with a Rise/Fall trade on Gold/USD
Fig. 4.16. Deriv Trader mobile interface with a Rise/Fall trade on Wall Street 30 Index
SmartTrader
I’ll keep this brief, as Deriv Trader is Deriv’s main Options platform. However, some traders may prefer SmartTrader, the original legacy platform. It’s web-based and accessible via Trader’s Hub, allowing you to trade Volatility Indices, Forex, Commodities, and Stock Indices.
If you’re new to Deriv, I recommend starting with Deriv Trader, but you’re welcome to give SmartTrader a try. It works with your existing Deriv account, so your funds will appear on SmartTrader.
Summary
In this chapter, we’ve covered Options on Synthetic Indices. However, the same principles apply to other markets, as shown in the gold example. Deriv continues to expand its range of Options, allowing clients to trade on markets moving up, down, or even sideways (range).
Options can be traded on multiple devices without the need to download software as Deriv Trader is web-based.
Most traders start with manual trading and then progress to automated trading or a combination of both.
You can choose lower-risk Options with lower volatility and smaller, more predictable payouts or higher volatility Options with higher potential payouts but a lower chance of success.
No matter your approach, you’re always in control, and your risk is strictly known before entering a trade: you’ll only risk your stake.
You can trade Options with as little as $0.50 maximum risk, making it a great way to start trading and build your skills and confidence.
Fig. 4.17. A Winning Rise/Fall Digital Option trade on Step Index 500 on SmartTrader
Chapter 5 Contracts for Difference (CFDs)
A Contract for Difference (CFD) is a financial derivative that allows traders to speculate on the price movements of various markets—such as Stocks, Stock Indices, Commodities, Forex, Cryptocurrencies, and Synthetic Indices— without owning the underlying asset. In CFD trading, you enter into an agreement with your broker (Deriv) to exchange the difference in the asset’s price from the trade’s opening to its closing.
In this chapter, I will cover CFDs on Synthetic Indices, though the same principles apply to other financial markets.
I started trading CFDs around 28 years ago, when the first broker to offer them was London-based GNI. In fact, my first CFD trade was on the UK FTSE 100 Index.
Later, CFDs became popular on individual stocks, allowing traders to take positions with a degree of leverage.
CFDs allow you to profit from both rising (long) and falling (short) markets.
They are available on platforms like Deriv MT5, Deriv cTrader, and Deriv X, which includes TradingView charts for direct trade execution. You can also trade on your mobile device for added flexibility.
How do CFDs work? A trading perspective
Let’s say you believe the price of an asset will rise. You can open a trade by placing a buy order for that asset. If the price increases as you expected, you close the trade with a sell order, and the difference between the buying and selling prices is your profit.
This strategy is known as going long in CFD trading.
Unlike a Digital Option, which has a fixed payout, a CFD is variable and points-based— the more accurate your prediction, the greater your potential profit. However, the opposite is also true, meaning losses can grow if the market moves against you. Additionally, CFDs do not have a fixed expiry date.
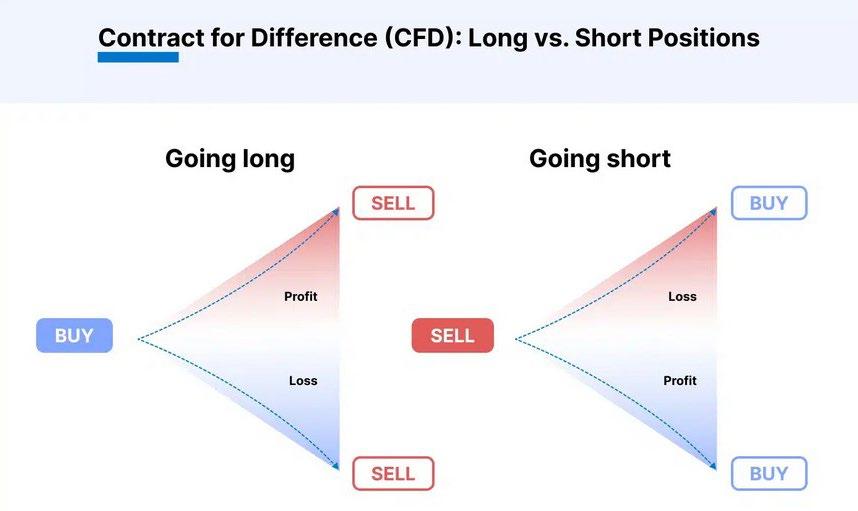
Going long in CFD trading: When you go long in CFD trading, you’re speculating that the price of an asset will rise.
For example, if you buy a CFD on an index trading at 8080.00 and later sell it at 8080.10, that’s a 10-point gain. If you’re trading at $1 per point, your profit would be $10. However, if the price drops to 8079.90, you would have lost 10 points, or $10.
Going short in CFD trading: On the other hand, if you think the price of an asset will decrease, you can open a trade with a sell order. When the price drops, you close the trade by placing a buy order at the lower price, profiting from the difference.
Going short might seem counterintuitive because you start with a sell order without owning the asset. However, in CFD trading, you’re trading the contract, not the underlying asset. A sell order simply means you’re predicting a price decline.
Example:
• You sell a CFD on an index at 900.00 and later buy it back at 890.00.
• The difference is 100 points (to the last decimal point).
• If you’re trading at $1 per point, your profit would be $100.
If you sell a CFD on an index at 900.00 and buy it back at 899.00, the 100-point difference (measured to the last decimal point) multiplied by your unit size (e.g. $1 per point) determines your profit. In this case: 100 points × $1 = $100 profit.
With Deriv CFDs, trades are executed in Lot sizes, and you can check the minimum lot sizes for each index here: Deriv trading specifications
MT5 Web CFD example: You can open the Order Ticket using the F9 hotkey or by clicking New Order. Some traders prefer hotkeys for faster execution. I’ll show more examples later.
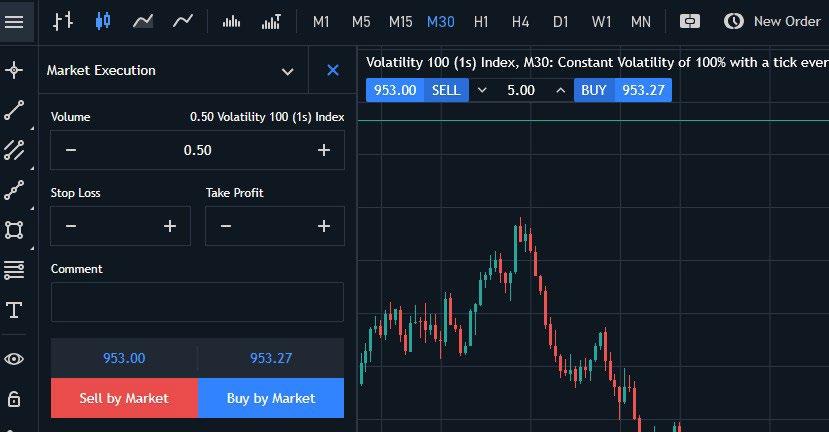
Fig. 5.1. Going long vs. short and potential profits/losses in CFD trading
Fig. 5.2. MT5 Web order ticket for Volatility 100 (1s) Index with market execution
Once you press New Order, the ticket opens. Select the LOT size (0.50 in this case). You can also set a Stop Loss and Take Profit. Under Market Execution, the drop-down menu will show different order types. If you don’t select anything, the default is Buy or Sell “At Market”.
You can adjust Stop Loss (SL) and Take Profit (TP) orders anytime, as long as the price hasn’t been reached.
The role of margin in CFD trading
When trading CFDs, you don’t need to pay the full trade value upfront. Instead, you deposit a small percentage, known as the margin. This lets you control a larger position with less capital, a practice called trading on margin or leveraged trading.
This is what attracts many to CFD trading—the gains are amplified by the margin. Of course, losses are also amplified. In markets such as Forex (FX), daily price movements are relatively small, and leverage is what makes a big difference to trades.
Deriv offers attractive leverages, but you should always be aware of your maximum risk. When starting out, it’s best to stick to lower leverages.
I like to think of leverage as a tool that should be used with caution. It’s similar to a speed limit—just because the maximum is 80 mph doesn’t mean you have to drive at that speed. You can choose to go at 70, 60, or even 50, depending on what feels safe and manageable.
While leverage can amplify your profits, it also increases potential losses. When starting out, it’s best to use less leverage than what’s offered. Even with 1:5 or 1:10 leverage, you can still see moves on a highly volatile product.
It’s important to remember that CFDs do not have an expiry date—they roll over from one trading day to the next. However, there is a financing cost, also known as a swap charge, which is added or deducted depending on whether you are long or short.
Deriv provides a trading calculator to help determine these costs.
Example: Trading the Volatility 100 (1s) Index with 1:10 leverage (a fairly low leverage rate)
1. You decide to trade the Volatility 100 (1s) Index on the Deriv platform.
2. Expecting the index to rise, you go long (buy).
3. You open a trade with 1:10 leverage. This means you can control a $10,000 position with just $1,000 of your own capital.
4. Calculating Position Size
a. With $1,000 in your account and using 1:10 leverage, you open a position worth $10,000.
b. Your initial margin requirement is $1,000 (10% of the position value).
5. Monitoring the trade
a. The index moves in your favour, increasing by 0.5%.
b. Your position is now worth $10,050.
6. Closing the trade
a. You decide to close the trade when the index has increased by 1%.
b. With your initial $10,000 position, a 1% increase means the index is now worth $10,100.
c. You close the trade, realizing a $100 profit.
7. Accounting for leverage
a. While leverage can amplify profits, it also amplifies losses.
b. A 1% loss in the index with 1:10 leverage would result in a $100 loss, which is 10% of your account balance.
8. Risk management: Always use risk management strategies, such as stop-loss orders, to protect your capital otherwise you could lose your whole account balance in one trade.
a. Stop-Loss Order: You set a stop-loss at -2% to limit potential losses if the trade moves against you.
b. Position Sizing: Many traders risk only 1% to 2% of their account balance on a single trade to ensure they can withstand a series of losses.

Summary
By using leverage, we were able to control a larger position with a smaller capital investment.
In this example, a $1,000 investment generated a $100 profit, but it’s important to remember that leverage also increases the risk of significant losses. This is why using a stop-loss order is crucial—without one, you could lose your entire balance.
Deriv also offers a no negative balance guarantee, ensuring that your account cannot go below zero, but it’s not a situation you want to experience.
Deriv MT5
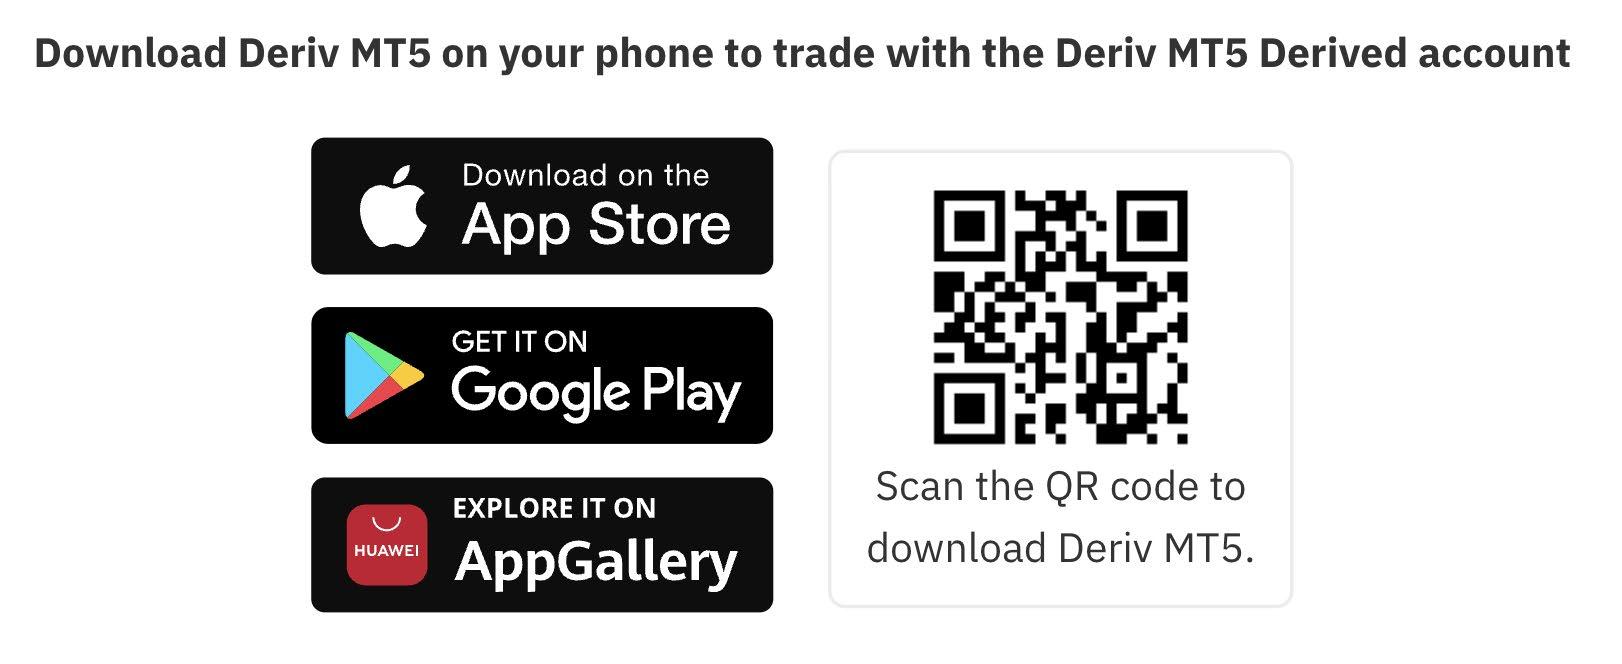
The most popular trading platform for CFD trading worldwide is MetaTrader 5 (MT5). It is provided free of charge and can be used on mobile devices, including iPhone, Android, and Huawei, as well as desktop PCs or Macs. The app can be downloaded from the App Store, Google Play Store, or the Huawei AppGallery.
You may also come across an older version called MT4, but I recommend going straight to MT5, as it is the platform supported by Deriv.
If you scan this QR code with your mobile device, it will direct you to the correct app for downloading Deriv MT5.
For desktop, I prefer MT5 Web, as it doesn’t require a download and runs directly in a web browser. While it doesn’t have all the features of the downloadable version, it’s a good place to start if you’re new. As shown in the screenshot, you can access all the popular synthetic products, customise the layout and charts, and place trades in just a few clicks.
You can also trade financial products such as Forex, Stocks, Stock Indices, Cryptocurrencies, and Commodities.
This is also available with a demo account, allowing you to test the features without using real funds.
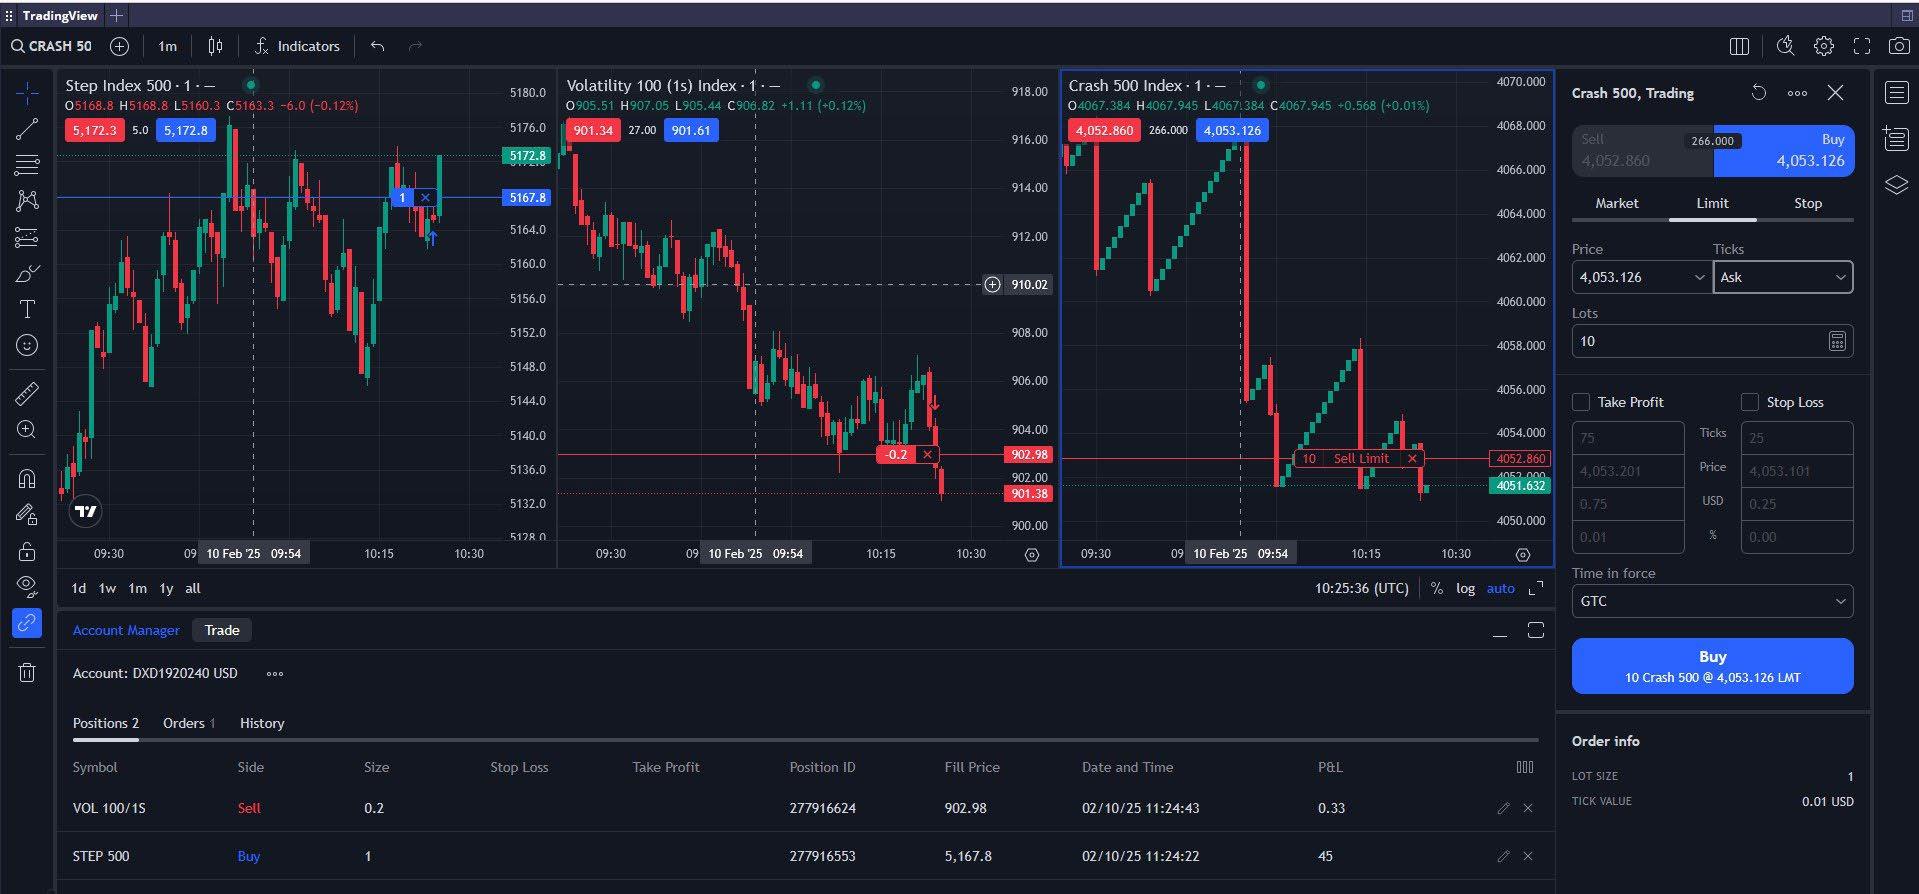
Another popular platform is TradingView, which is accessible via Deriv X. In this example, I am showing the web browser version, where you can trade multiple markets simultaneously with several windows open at the same time.
Fig. 5.3. Download Deriv MT5 on iPhone, Android, or Huawei
Risk management
Trading CFDs on highly volatile assets carries risks. One of the key advantages of trading CFDs on Deriv is the availability of risk management features, such as stop loss and take profit. Using these features, you can handle high volatility trades more effectively.
• Take profit automatically closes your trade once it reaches the profit level you’ve set. This ensures you secure your gains without needing to monitor the market constantly.
• Stop loss functions similarly but limits potential losses. If the asset price reaches your stop loss level, the trade closes automatically to prevent further losses.
• In fast-moving markets, slippage may occur, meaning the exact stop loss level might not always be met. However, most of the time, it will be close to the set level.
Order types
Market Orders
A market order is the most straightforward and common type of order. It is an instruction to buy or sell a Synthetic Index (or any traded asset) at the current market price. Market orders are executed immediately at the best available price, as long as there are willing buyers and sellers. On MT5, this is referred to as “instant execution.”
Pending Orders
These are orders that you set up to trigger at a future price level. They instruct your trading platform to buy or sell a Synthetic Index when it reaches a specified price.
The four main types of pending orders are Buy Limit, Sell Limit, Buy Stop, and Sell Stop. There are also combined types like Buy Stop Limit and Sell Stop Limit.
BUY LIMIT | PENDING ORDER
This is an order to buy an asset at a price lower than the current market price. Traders use this when they anticipate that the price of an asset will fall to a certain level before rising again.
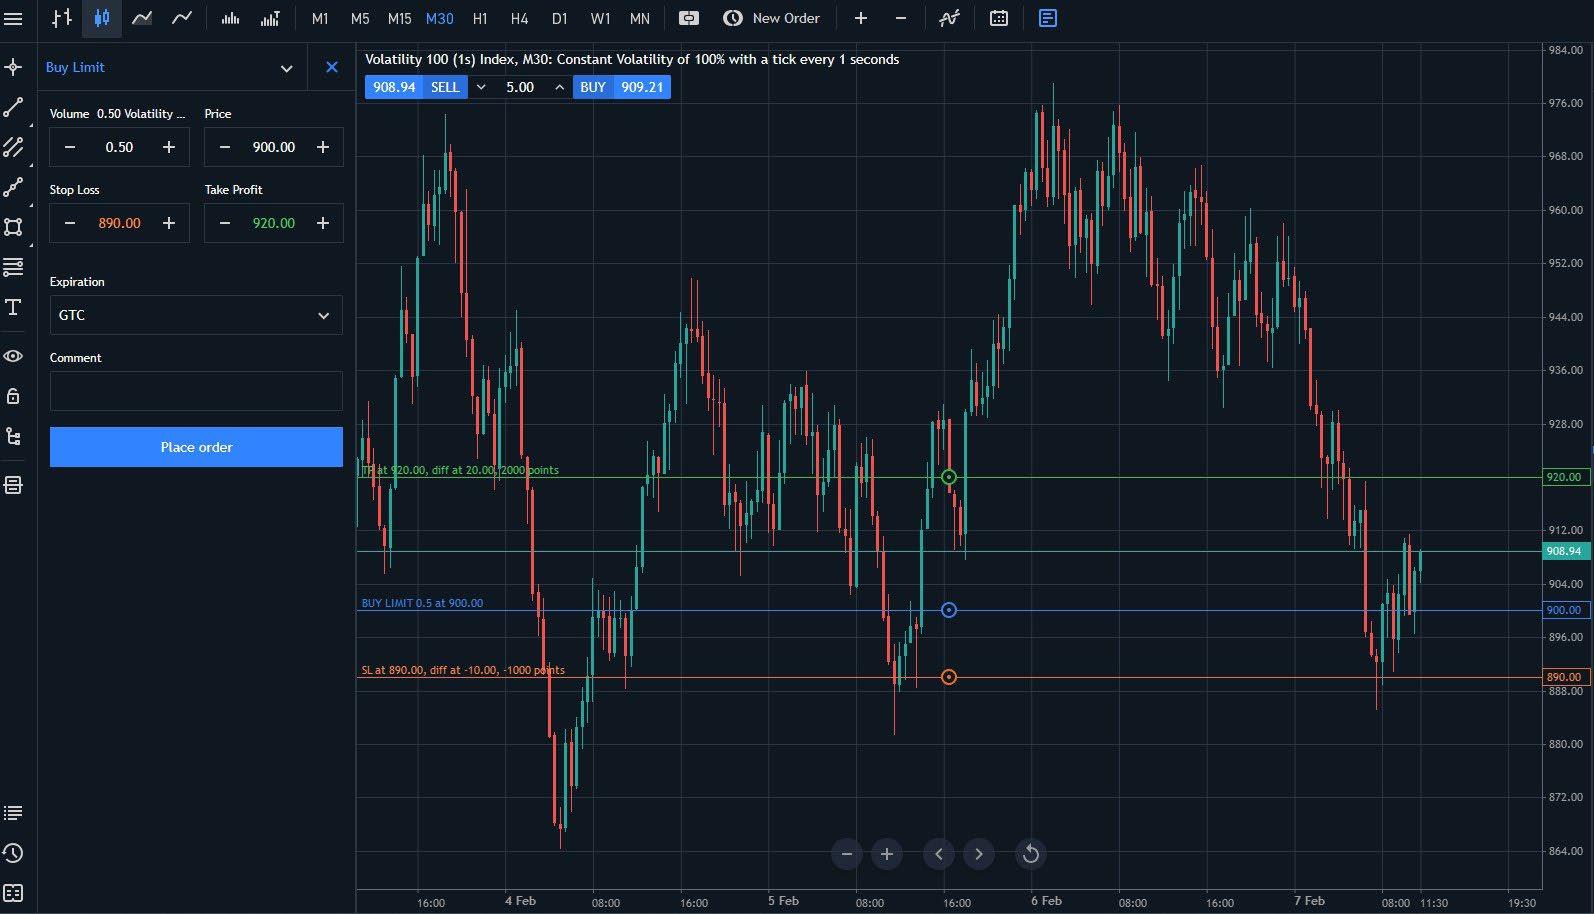
Example: If Volatility 100 (1s) Index is currently trading at 908.50, and you think it will drop to 900.00 before moving back up, you can place a Buy Limit order at 900.00.
If the price reaches USD 900.00, the order becomes a “market order” and moves to “instant execution.”
Example of a market order on Deriv MT5 App: In this example, I have also added a stop loss and take profit level.
Tip: When using MT5 Web, you can adjust your take profit (TP) level by clicking and dragging the TP line. The take profit value in the numbers box will update automatically.
Fig. 5.4. Deriv X’s TradingView interface displaying multiple market charts and trade execution choices
SELL LIMIT | PENDING ORDER
A Sell Limit order is placed to sell an asset at a price higher than the current market price. Traders use this when they expect the price to rise to a certain level before falling.
Example: If Volatility 75 is trading at 6201.10, and you believe it will rise to 6250.0 before falling, you can place a Sell Limit order at 6250.00.
Note: An order can be cancelled as long as the price has not been triggered. Most orders are GTC (Good ‘Til Cancelled).
BUY STOP | PENDING ORDER
A Buy Stop order is set to buy an asset at a price higher than the current market price. Traders use this when they expect the price to continue rising after reaching a certain level. This order type is commonly used in breakout strategies, which will be covered later.
SELL STOP | PENDING ORDER:
A Sell Stop order is set to sell an asset at a price lower than the current market price. Traders use this when they expect the price to continue falling after reaching a certain level.
Example: If Volatility 10 is trading at USD 800.00 and you want to go short if the price breaks the support level at USD 780.00, you can place a Sell Stop order at USD 780.00.
BUY STOP LIMIT | PENDING ORDER
This is a combination of a Buy Stop order and a Buy Limit order. You set 2 prices:
1. Stop price – The price that triggers the order.
2. Limit price – The highest price you are willing to pay.
If the market price reaches the stop price, a Buy Limit order is placed at the limit price.
This order type is used when you expect the price to rebound after reaching a specific level above the current price.
SELL STOP LIMIT | PENDING ORDER
This is the opposite of a Buy Stop Limit order. You set 2 prices:
1. Stop price – The price that triggers the order.
2. Limit price – The lowest price you are willing to sell at.
If the market price reaches the stop price, a Sell Limit order is placed at the limit price.
This order type is used when you expect the price to rebound after reaching a specific level below the current price.
Fig. 5.5. Buy Limit order setup on Volatility 100 (1s) Index with stop loss and take profit levels
TAKE PROFIT(TP)
A Take Profit order is used to lock in profits at a predetermined price level.
• If you are long (buying an asset expecting the price to rise), you set the Take Profit above the current price.
• If you are short (selling an asset expecting the price to fall), you set the Take Profit below the current price.
When the market reaches your Take Profit level, the trade is automatically closed and your profit is locked in.
STOP LOSS (SL)
This is an order to limit your losses. It’s the opposite of a Take Profit. You set a Stop Loss order at a specific price level:
• If you are long (buying an asset expecting the price to rise), you set the Stop Loss below the current price.
• If you are short (selling an asset expecting the price to fall), you set the Stop Loss above the current price.
When the market reaches your Stop Loss level, the trade is automatically closed, preventing further losses.
Key takeaways for order types
• These orders help you trade without constantly monitoring the market, but they do not guarantee profits.
• It’s essential to develop a solid understanding of market trends and have a robust risk management strategy in place.
• You can practise these orders risk-free using a Deriv MT5 demo account to experience real market conditions.
• For those interested in advanced features and automated trading, I’d suggest downloading the full MT5 app or desktop software.
• MT5 has a large community of developers offering support, trading tools, and plugins. You can explore more on MQL5. If you search for deriv.com, you’ll find specific posts related to Deriv.

Money management
Before diving into trading systems, it’s essential to understand money management.
Over my years of trading, I have coached thousands of traders and worked with brokers, where I have been able to see what clients do. One key observation is that most losing traders focus too much on entry points—deciding when to enter a trade—while neglecting exit strategies— determining when to close a trade.
While we all want to be optimistic and believe every trade will be profitable, the reality is that many trades will not work out. The key is to ensure that losing trades do not cause you so much financial or emotional distress that you cannot recover.
Table 5.1 shows you the percentages needed to recover from a loss
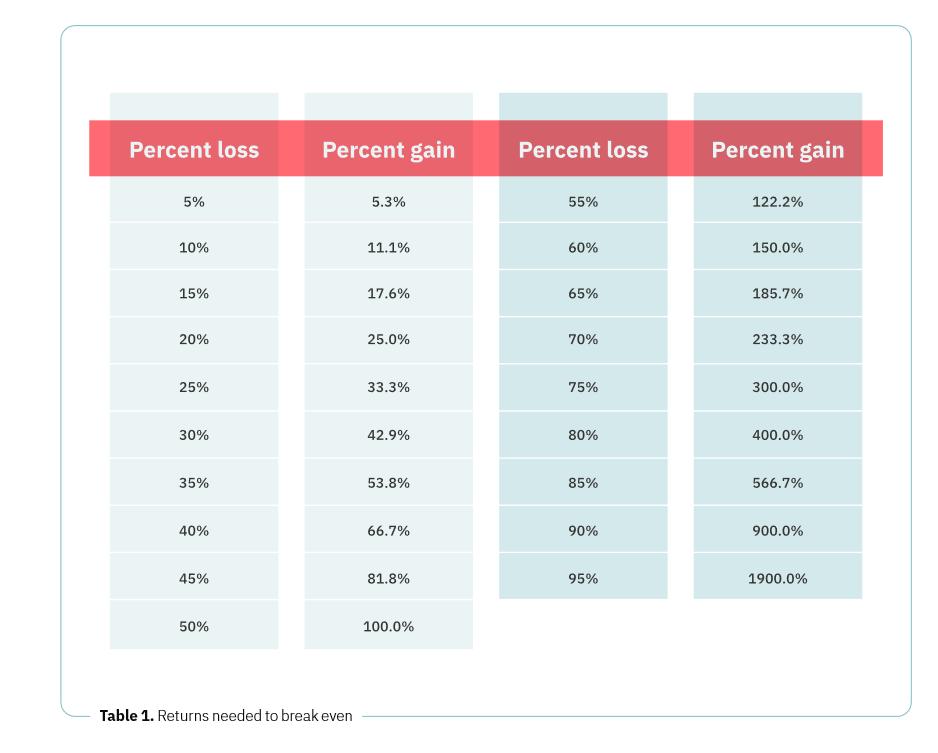
Remember, trading success isn’t just about the number of winning or losing trades—it’s about the size of your profits versus the size of your losses. A few well-managed profitable trades can outweigh multiple small losses, making risk management and trade sizing crucial.
Let’s say we have seven losing trades, each losing $10, and three successful trades, each making $30. Even though 70% of the trades are losses, the 30% of profitable trades cover all the losses and still put us ahead.
Many traders do the opposite—they take small profits quickly for instant gratification but let losing trades run, often ignoring their trading rules or stop-loss levels.
Psychologically, new traders need to be right more often than wrong. They seek positive confirmation in their trades. However, ask yourself: Do you want to be right, or do you want to make money? As I have shown with my example, it’s not the same thing.
Fig. 5.5. Buy Limit order setup on Volatility 100 (1s) Index with stop loss and take profit levels
Back in the 1970s and early 1980s, Swedish tennis player Björn Borg was one of the most dominant athletes of his time. Nicknamed the “Ice Man”, he won 11 major singles titles in just seven years, including six straight Wimbledon championships. You can still watch some of his legendary matches on YouTube.
The reason I mention Borg is his unshakable temperament. Whether he was winning or losing, he remained calm, never arguing with umpires or showing frustration. This mindset is something all traders should strive for—staying level-headed, avoiding overconfidence after a streak of successful trades, and not becoming discouraged after a losing run.
Trading and sports psychology have a lot in common and are worth studying more.
I have an ebook that covers seven key traits of successful traders, which you can download here: 7 Traits of Successful Financial Traders
Deriv cTrader

Deriv cTrader is another popular trading platform used by many traders for copy trading and automated trading. You can access cTrader on both mobile and desktop, and Deriv provides this platform to its clients at no extra charge.
• cTrader Mobile is an app-based platform.
• cTrader Web requires no download and runs directly in a web browser.
Deriv offers Synthetic Indices and other financial markets on cTrader, and you can try the platform with a demo account to explore its features.
Try Deriv cTrader

Fig. 5.6. Legendary tennis player Björn Borg was famous for his composure
Fig. 5.7. To download cTrader, scan this QR code with your mobile phone
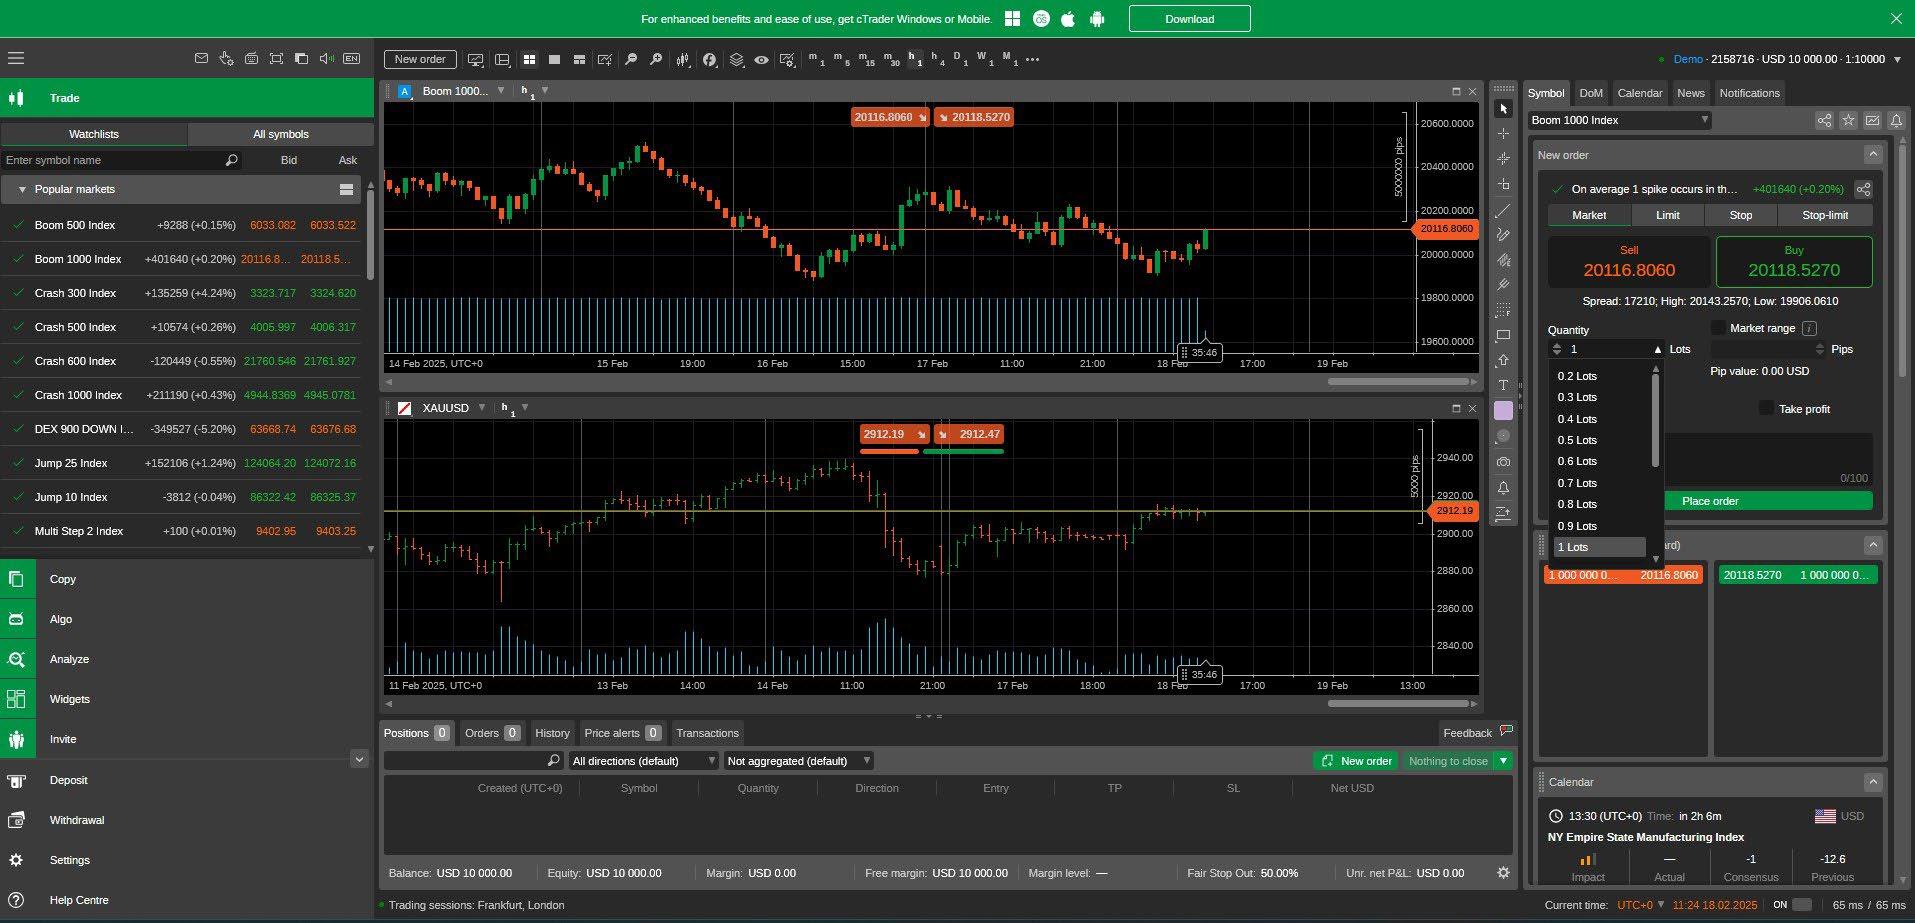
Deriv cTrader’s layout
In cTrader, you can trade all synthetic products as well as financial markets. In this screen, I have both the Boom 1000 Index and Gold displayed simultaneously.
Key features of cTrader:
• Allows copy trading, enabling you to follow successful traders.
• Provides advanced analytics for better decision-making.
• Offers an opportunity to let other users copy your trades, allowing you to earn a commission.
Here is an example of traders offering their services on cTrader. They charge a performance fee of course. As with all trading, there are no guarantees of profitability over time, and Deriv does not endorse any specific traders.
You can set a fixed risk amount, typically as low as $100, to allocate to a copy trading system.
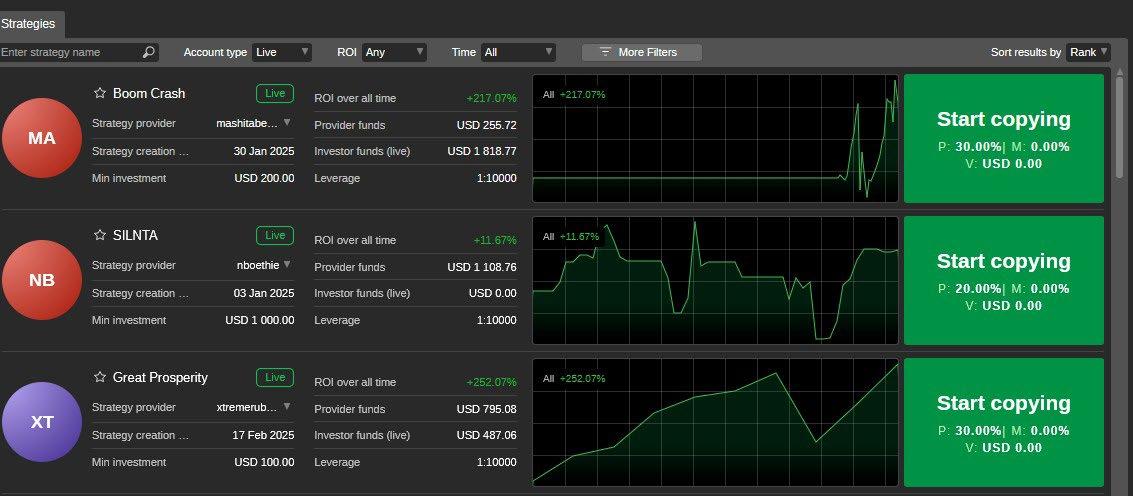
Fig. 5.8. Deriv cTrader platform displaying Boom 1000 Index and Gold charts
Fig. 5.9. cTrader copy trading interface showing strategy providers, performance metrics, and investment options

There is also a feature called cTrader Algo, which is a trading bot. This allows you to program trading systems—including some of the strategies I will cover later—so you can automate your trades. It enables both opening and closing trades around the clock without manual intervention. cTrader has a large community where traders share hints, tips, and strategies.
It’s worth mentioning that Deriv provides excellent trading tools and platforms completely free of charge for its clients. While you may choose to use some third-party services or plugins, there’s no need to pay for expensive software or data feeds.

Part 3 Trading strategies
Chapter 6 Getting technical
There is no guarantee that analysing past market performance, whether on financial or Synthetic Indices, will lead to successfully predicting future market movements. Technical analysis tools are designed to help traders better understand market behaviour and analyse data for more informed decision-making.
Remember, trading always involves risk, and you should carefully consider this before engaging in any trades.
Technical analysis ignores the news and economic data, focusing purely on price trends and volume. It primarily involves studying chart patterns, which display the trading history and statistics of a market being analysed. You would start with a basic price chart which would show the indices trading price in the past and look for a trend or pattern that could help determine future pricing. Let’s look at a few tools for technical analysis in more detail.
As this guide focuses on Synthetic Indices, we will explore tools that are best suited to these products. However, if you have traded other markets such as Forex or Stocks, you will find that many of the tools and terms are familiar.
As mentioned earlier, Synthetic Indices are not affected by news, company earnings, or other factors that influence traditional markets.
For example, when the world went into lockdown in March 2020 due to the Covid-19 pandemic, many markets and industries—such as airlines and hospitality—suffered significant losses. However, Synthetic Indices continued to trade unaffected, and Deriv remained open 24/7.
Since Synthetic Indices are unaffected by news events, there is no need to consider fundamental analysis when analysing them.
Bar chart – Displays price data over a chosen time frame, from 1-minute bars to 1-month bars.
Candlestick chart – Similar to bar charts but visually clearer, making it a preferred choice for traders analysing price patterns over different time frames.
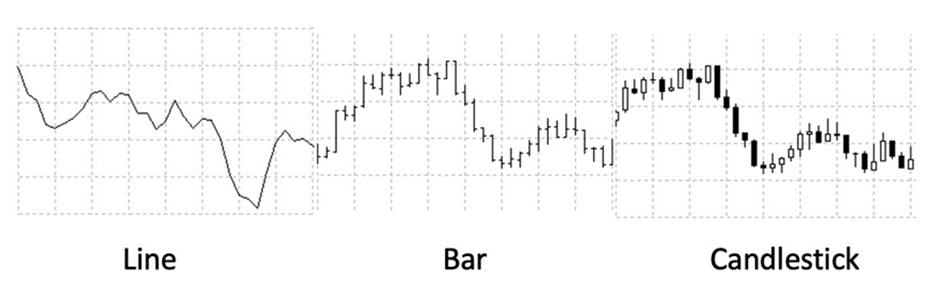
Line
Bar
Candlestick
Fig. 6.1. Comparison of line, bar, and candlestick charts used in market analysis
Charting packages like MT5 allow you to analyse a market, such as Volatility 10 Index, across different time frames.
Tip: In MT5, you can quickly switch chart styles by holding ALT and pressing 1, 2, 3, or 4.
Note: The same market can look very different depending on the time frame you choose. The same applies to indicators—for example, a 20-period moving average:
• On a 1-minute chart, it represents 20 minutes.
• On a 1-day chart, it represents 20 days.
• On a weekly chart, it represents 20 weeks.
Here, we see the top bar of MT5, displaying time frames ranging from 1-minute (M1) to monthly (MN) bars.
Trend following
The old saying “let the trend be your friend” applies here. With trend following, we can profit from both uptrends and downtrends.
Markets generally move in three states:
1. Uptrend – Higher highs and higher lows
2. Downtrend – Lower highs and lower lows
3. Sideways (range-bound) – Price moves within a defined range
Regardless of whether you’re trading Volatility 10 or Volatility 250, you will see similar patterns repeat over time. As you gain experience, you’ll learn to identify these trends and know how to react accordingly.
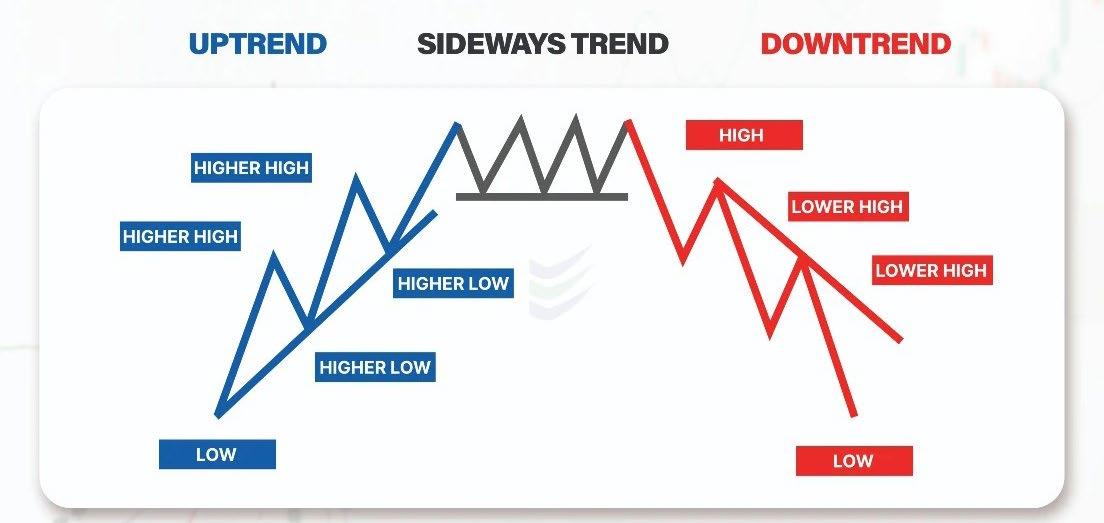
Fig. 6.2. MT5 top bar displaying time frames from 1-minute (M1) to monthly (MN) charts
Fig. 6.3. Uptrend, sideways trend, and downtrend patterns of market price movement
Once you identify the market trend, you can set your trading strategy:
• In an uptrend, you want to be long (buy) a CFD or buy Call Options to benefit from rising prices.
• In a sideways range, Options such as No Touch can be effective. You can also trade CFDs long and short within the range:
• Go short at the top of the range (resistance). Set a stop loss just above resistance.
• Go long at the bottom of the range (support). Set a stop loss just below support.
At some point, the price is likely to break out of the range, so having stop loss protection is essential to limit risk.
• In a downtrend, you want to go short (sell) a CFD or buy Put Options to profit from falling prices.
Note: I have written an ebook specifically on chart patterns, which is available from Deriv at no charge.
Since this ebook covers chart patterns in detail, I will not go in-depth on them here or even in Chapter 8, where I return to the topic of chart patterns. You can refer to that ebook for a comprehensive guide.
Download here: Chart Patterns

Chapter 7 Technical indicators
I will focus on a few basic indicators in this chapter, as I prefer to keep trading simple and avoid overcomplicating analysis. Using too many indicators can lead to confusion, often referred to as “paralysis by analysis.”
If you’re constantly searching for the “perfect” trade setup, you may never take action— because there is no such thing. Instead, the goal is to identify trades with a good probability of success and execute them with a solid risk management plan.
Moving averages
Moving averages are used to smooth out price data and identify trends. Common types include Simple Moving Average (SMA) and Exponential Moving Average (EMA). There are also more advanced moving averages, such as Variable Moving Average (VIDYA), which adjusts dynamically based on market volatility. I have used this in my trading, though it requires a deeper understanding.
Using a technical system like the moving average helps reduce the impact of emotions on trading decisions. Instead of trading based on what you believe should happen, this approach ensures your trades are grounded in actual market data. A moving average can also prevent you from making foolish mistakes, such as trading against a trend.
Moving averages work best when prices are “moving” either up or down. In a sideways range, the moving average will go flat and give out many false signals also known as “chop”.
A moving average crossover system is a popular trading strategy used to identify potential buy and sell signals by analyzing the interaction of two moving averages. Here’s a basic outline of how this system works:
Components:
1. Short-term Moving Average (SMA or EMA): A faster-moving average that reacts quickly to price changes. Example: 6-minute moving average.
2. Long-term Moving Average (SMA or EMA): A slower-moving average that smooths out price fluctuations. Example: 21-minute moving average.
Signals:
1. Buy signal: When the short-term moving average crosses above the long-term moving average, it suggests a potential upward trend and a buying opportunity.
2. Sell signal: When the short-term moving average crosses below the long-term moving average, it indicates a potential downward trend and a selling opportunity.
These crossovers help traders identify trend reversals and align their trades with the market direction.
You can also experiment and test different moving average combinations to find what works best for your trading style. The time frames can be adjusted to suit different market conditions. For example, a 21/6-day crossover system can be modified into a 21/6-hour crossover system simply by changing the chart time frame.
Example of a 21/6 crossover system on Volatility 75 (1s)
This example uses a 21/6 moving average crossover on a 1-minute chart, where each candle represents one minute. I have marked the buy and sell points on the chart. Not every trade makes money, but a successful trade offsets smaller false crosses, keeping us ahead.
The system is always in the market, switching from long to short and short to long—a method known as Stop and Reverse (SAR).
You can test this system with a demo account and log your results to see how it performs. To start, identify the first crossover, which determines the first trade—either a buy or a sell. In my case, the first trade marked on the chart was a sell.
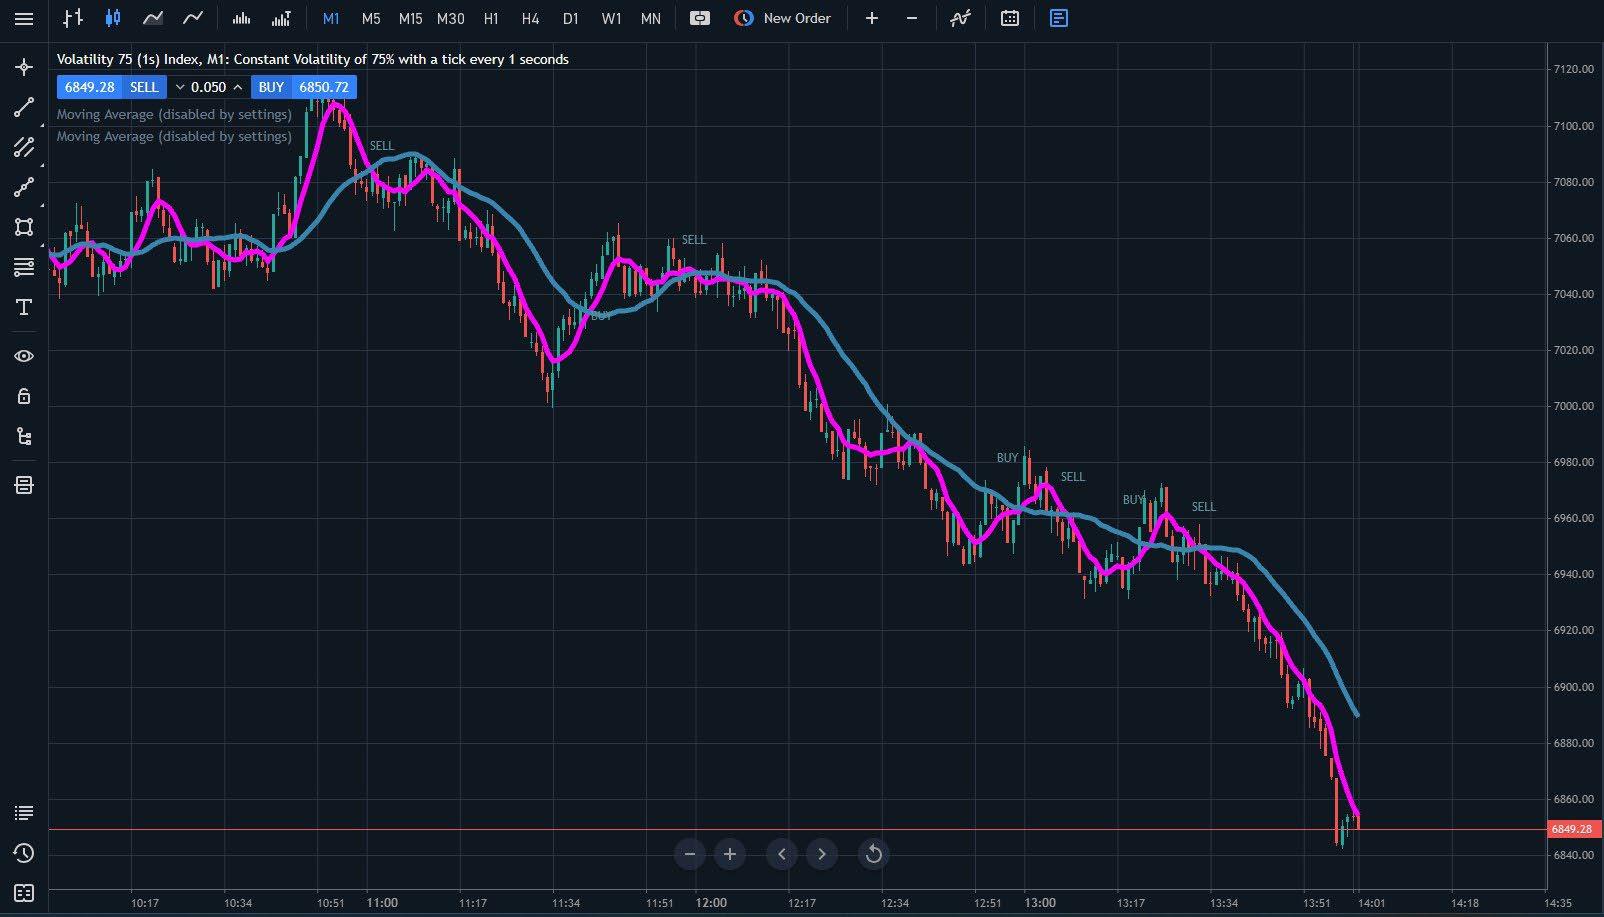
The current open trade is a SELL (short) position. You would remain short until the next crossover occurs, at which point you would close the short trade and open a new long trade.
EMA (exponential moving average) puts more weight on the most recent data, making it more responsive to price changes, whereas SMA (simple moving average) gives equal weight to all data points in the selected period, making it smoother but slower to react to price movements.
Choosing between EMA and SMA depends on your trading style—EMA is better for fastmoving markets, while SMA is useful for identifying long-term trends.
Trendlines in trading
You can also add trendlines to confirm signals from the moving average.
A trendline is a straight line drawn on a chart to connect two or more price points, illustrating the direction of the price trend over time. It helps traders identify potential buying and selling opportunities based on an asset’s trend.
They can be applied to charts of varying timeframes and are used in technical analysis to identify potential buying and selling
opportunities based on an asset’s current trend. Trendlines are commonly used with chart patterns to confirm or validate the pattern and to identify key support and resistance levels.
In Deriv Trader, trendlines can be found under Drawing Tools.
In MT5, double-click the trendline tool to open a drop-down menu with variations. You can also use hotkeys for quick access: ALT + L draws a diagonal trendline and ALT + H draws a horizontal trendline. These shortcuts make it easier to customise and adjust your charts for better trend analysis.
Fig. 7.1. 21/6 moving average crossover system on Volatility 75 (1s) using a 1-minute chart, showing buy and sell signals
Trendline trading strategy
This strategy can be applied to all Volatility Indices and helps traders identify trend direction and potential entry points.
Steps to use trendlines in a trading strategy:
1. Identify the trend – Look for higher highs and higher lows to confirm an uptrend or lower highs and lower lows for a downtrend.
2. Draw the trendline – Connect the low points for an upward trendline and the high points for a downward trendline.
3. Use trendline breaks for trading signals – A break below an upward trendline or above a downward trendline may signal a potential trend reversal.
4. Confirm the breakout – Use additional technical indicators (e.g., RSI, moving averages) or chart patterns to confirm a valid breakout.
5. Determine entry and exit points – Enter a long position above an upward trendline or a short position below a downward trendline, setting a stop-loss order below or above the trendline.
6. Use risk management – Apply stop-loss orders and position sizing to limit potential losses.
7. Backtest your strategy – Test the strategy using historical data to refine and improve it before applying it to live trading.
Using trendlines effectively can help traders spot trade opportunities while minimising risk.
Price channels – Donchian Channels breakout trading system
Richard Donchian, an American commodities and futures trader, pioneered managed futures trading in 1949 and developed price channel trading systems.
Donchian Channels are a technical analysis tool used to identify price volatility and potential breakouts. They consist of three lines:
1. Upper band – The highest price over a set period.
2. Middle band – The average of the highest and lowest prices over the period.
3. Lower band – The lowest price over the same period.
These channels help traders spot breakout opportunities, determine support and resistance levels, and assess market volatility.
Fig. 7.2. Trendline tool in MT5
Using Donchian Channels in trading – The 4-week rule
The 4-week rule was devised by Richard Donchian and is a simple yet effective breakout trading strategy.
The rule:
1. Buy when a new 4-week high is reached – Hold the position.
2. Sell when a new 4-week low is hit – Close the long trade and go short.
Most trading platforms allow you to add Donchian Channels:
• In TradingView, you can find them under Indicators.
• In Deriv Charts (Deriv Trader), they are under Indicators → Volatility.
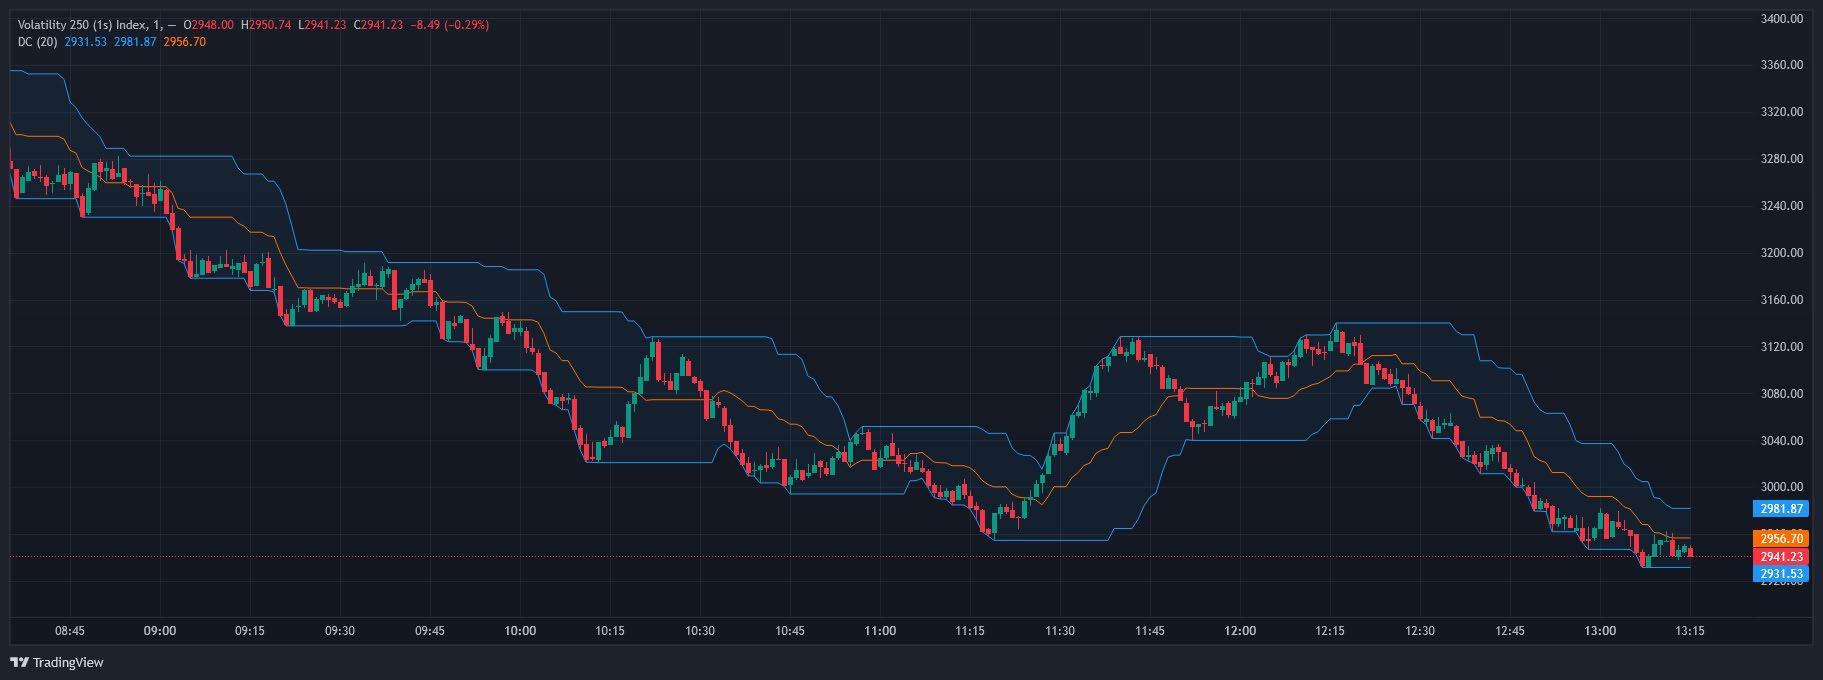
This example uses the standard 20-period setup on a 1-minute chart. The current signal is short, indicating a potential downtrend.
1. Identify trends – A rising upper band indicates an uptrend, while a falling lower band signals a downtrend. Use a 20-period setting for the channels, though you can experiment with shorter (10-period) or longer (30-period) settings.
2. Spot breakouts – When the price crosses above the upper band, it signals a bullish breakout; when it crosses below the lower band, it signals a bearish breakout.
3. Set entry and exit points –
• Enter long when the price breaks above the upper band.
• Enter short when the price breaks below the lower band.
• The middle band can serve as an early warning sign for potential reversals.
4. Risk management – Place stop-loss orders just outside the bands to limit potential losses.
5. Monitor and adjust – Adjust stop-loss and take-profit levels as the trade progresses to lock in profits or minimize risk.
This system can be applied to a variety of markets. I first used it on commodities over 30 years ago, but since then, I have successfully used it on Forex, Stocks, Synthetic Indices, and even Cryptocurrencies.
A well-known group of traders called the “Turtle Traders” used a similar channel trading system combined with position sizing rules. Their approach became one of the most famous trend-following strategies in trading history.
For more details, you can read about the Turtle Trading System here: Investopedia - Turtle Trading System.
The original system was designed for daily charts, making it a longer-term strategy. However, shorter time frames have also been used successfully.
Fig. 7.3. Donchian Channels applied to Volatility 250 (1s) Index
Example: Using Donchian Channels on a 1-minute chart for Digital Options
In this example, Donchian Channels are applied to a 1-minute chart to identify potential trade setups for Digital Options.
The price is hitting the lower channel, indicating a possible downward breakout.
The correct trade in this scenario would be a Fall Option, anticipating that the price will continue to decline.
This setup demonstrates how Donchian Channels can be used to identify breakout opportunities in short-term trading.
Relative Strength Index (RSI)
The relative strength index (RSI) indicator measures a share’s performance against itself. It is often used to identify buying opportunities during market dips and selling opportunities during market rallies. The RSI value always falls between 0 and 100. The indicator was developed and introduced in 1978 by an American engineer, J. Welles Wilder, a real estate developer and a well-known technical analyst. It is still widely in use.
Fig. 7.4. Donchian Channels on a 1-minute chart in Deriv Trader, suggesting a Fall Option as price hits the lower channel
The chart below shows an example of Volatility 250, where we can apply this tool to inform trading decisions. A low number (30 or below) indicates a more oversold market, while a high value (70 or above) indicates a more overbought market. The upper and lower horizontal lines on the graph are set at 70 and 30, respectively—levels at which markets are often regarded as overbought or oversold.
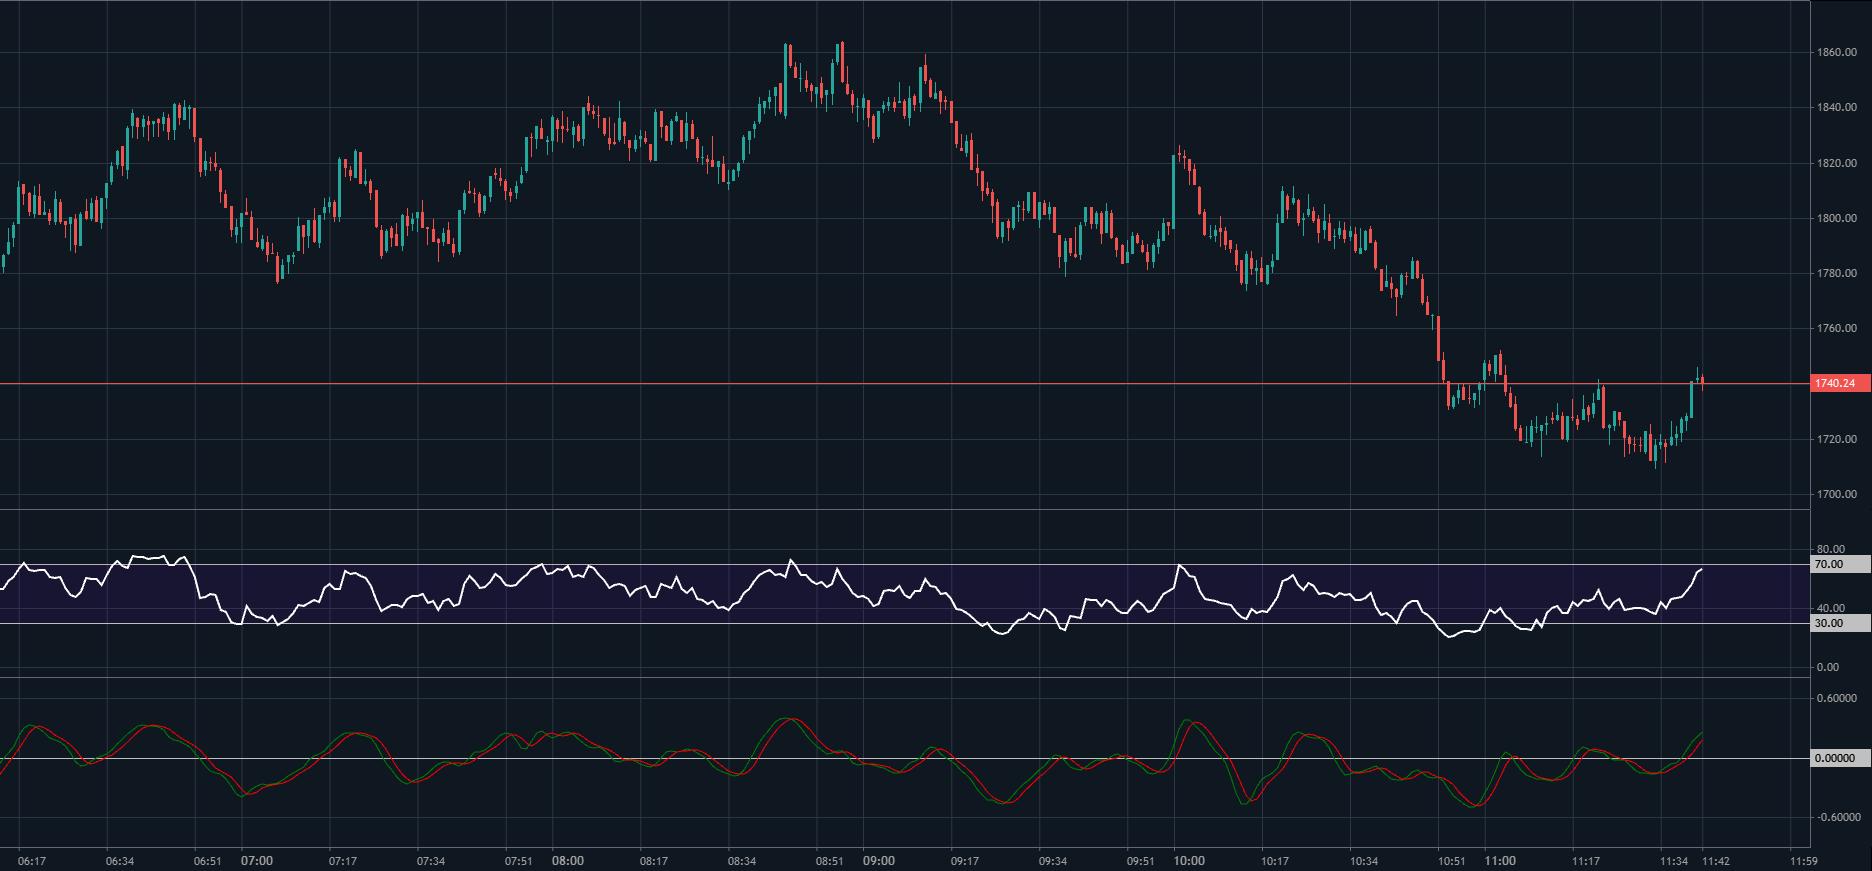
When the RSI moves to 70, it’s a good time to consider short trades or closely monitor a long trade, as a price reversal may be approaching. In the chart, the white RSI line is at 70 and looks like we are about to move lower.
When the RSI reaches 30, it’s a good time to consider long trades.
For Digital Options, we would look to buy (up – call – rise) Options when the RSI is at 30. If it is at 70 or above, it’s time for sell (down – put –fall) Options.
The RSI is widely followed and can be added to trading platforms like MT5, TradingView, and cTrader. You can also test other RSI levels, such as 20 and 80.
Relative Vigor Index
The relative vigor index (RVI) is a lesser-known oscillator worth considering. It’s the bottom indicator in Figure 7.5.
RVI is a momentum indicator used in technical analysis to measure trend strength by comparing a security’s closing price to its trading range.
Using
RVI in trading
1. Identify overbought/oversold conditions: The RVI ranges between -0.5 and 0.5. Values above 0.5 indicate overbought conditions, while values below -0.5 indicate oversold conditions.
2. Look for crossovers: When the short-term moving average (red line) crosses above the long-term moving average (green line), it signals a potential bullish trend, and vice versa for a bearish trend.
3. Watch for divergences: Divergences between the RVI and price movements can signal potential trend reversals. For example, if the price is making new highs but the RVI is making lower highs, it may indicate a weakening trend.
4. Combine with other indicators: To reduce false signals, use the RVI alongside other technical indicators like the stochastic oscillator or relative strength index (RSI).
Fig. 7.5. Volatility 250 price movements with the RSI indicator (white) and RVI indicator (red)
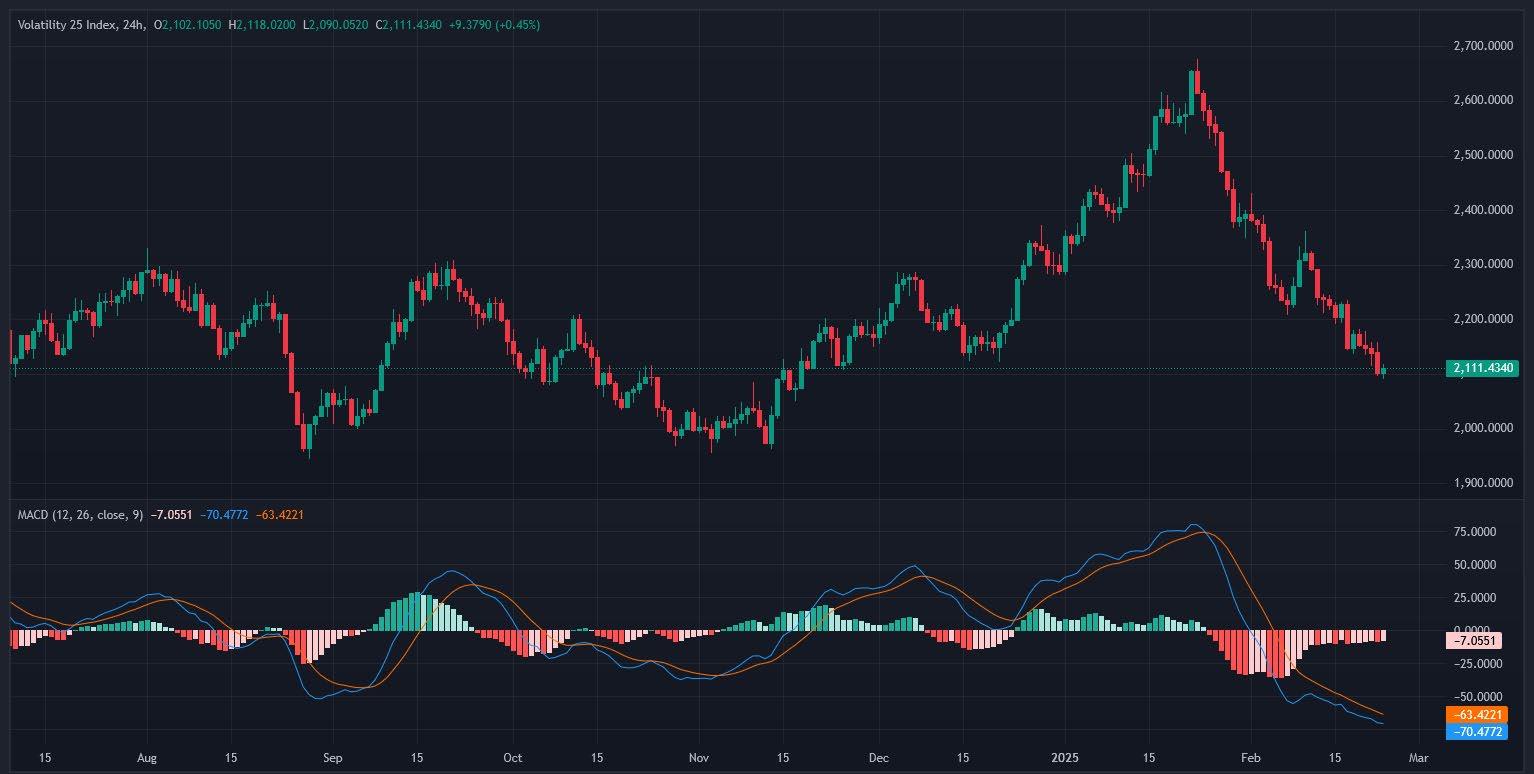
Moving average convergence divergence (MACD)
The moving average convergence divergence (MACD) is a popular technical analysis tool used to identify potential buy and sell signals. It is a trend-following momentum indicator that shows the relationship between two moving averages of a security’s price.
MACD trading system breakdown:
• MACD line: Calculated by subtracting the 26-period exponential moving average (EMA) from the 12-period EMA.
• Signal line: The 9-period EMA of the MACD line, acting as a trigger for buy and sell signals.
• Histogram: Represents the difference between the MACD line and the signal line, helping to visualise the momentum of the price movement.
Here, I am using TradingView with settings of 12, 26, and 9, along with a histogram.
Using MACD in trading
Buy signal
• MACD line crosses above signal line: When the MACD line crosses above the signal line, it is considered a bullish signal, indicating that it may be a good time to buy.
• Histogram turns positive: When the histogram moves from negative to positive, it can also be seen as a buy signal. In the chart example, dark green is positive.
Sell signal
• MACD line crosses below signal line: When the MACD line crosses below the signal line, it is considered a bearish signal, indicating that it may be a good time to sell.
• Histogram turns negative: When the histogram moves from positive to negative, it can also be seen as a sell signal. Dark red is negative and good for potential short positions.
All major software packages like MT5, cTrader, and TradingView allow you to add MACD, and you can also try different parameters, not just 12-26-9.
Remember: The great advantage of trading CFDs or Options with Deriv is that we can profit from up or down moves and switch between the two. The example of the Volatility 25 Index had some great long and short trading opportunities, with the MACD giving some great signals.
Fig. 7.6. Volatility 25 Index chart with MACD showing trend momentum and trade signals
Chapter 8 Patterns
Chart patterns
Technical analysts look for specific patterns in price charts, such as head and shoulders, double tops and bottoms, triangles, and flags. These patterns can indicate potential future price movements.
I have written a guide, 10 Chart Patterns Every Pro Trader Should Know, available for free from Deriv, where I explore chart patterns in more depth. These patterns apply to Synthetic Indices and other financial markets.
Download your copy here
Example of chart patterns
You can learn more about chart patterns in the ebook just mention, so I will keep this part short. As with everything in trading, nothing works 100% of the time. The key is money management and setting stop losses, as previously explained. We can also use orders to enter, take profits, and place stop losses in case the pattern fails.
Here, we see a popular pattern called a triangle and its three variations. We can profit from long trades on an upside breakout and short trades on a downside breakout.
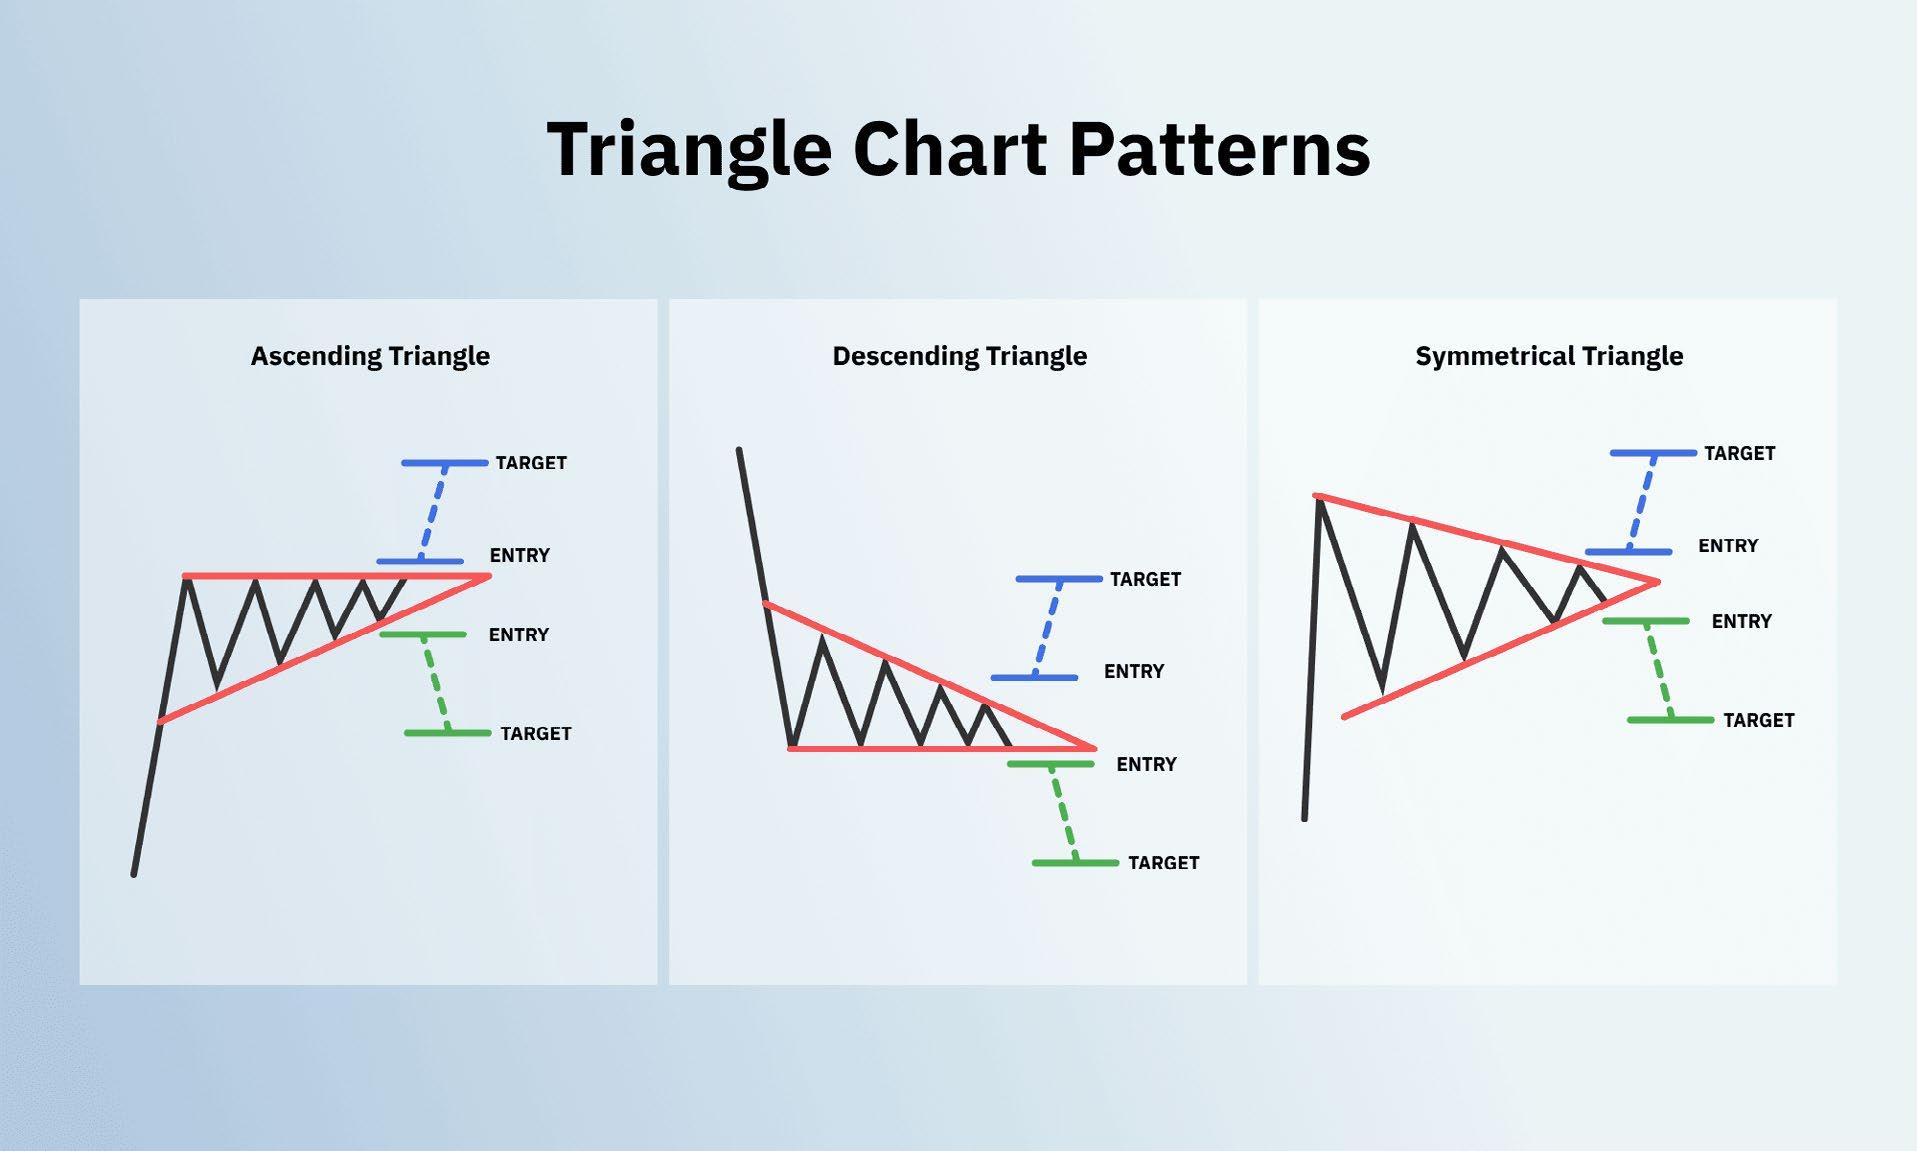
patterns: ascending, descending, and symmetrical, showing potential breakout targets
As well as chart patterns, we also have candlestick formations known as Japanese candlesticks. I have previously shown candlestick charts, but we can also analyse candlestick patterns. By condensing price data into an easy-to-read format, candlestick charts help traders visualise the battle between buyers and sellers in a market.
When used properly, candlesticks can provide powerful insights into market psychology and help identify potential trading opportunities. As with all trading tools, they serve as a guide, not a guarantee.
Fig. 8.1. Triangle chart
The anatomy of a candlestick
Candlesticks have three main components:
The body – represents the price range between the opening and closing prices.
The wicks or shadows – show the highest and lowest prices reached.
The colour – indicates sentiment: bullish (positive, often green or white) or bearish (negative, often red or black).
A long body suggests stronger conviction, while long wicks indicate rejection by either buyers or sellers. The relationship between the body, wick, and colour provides insights into market supply and demand dynamics.
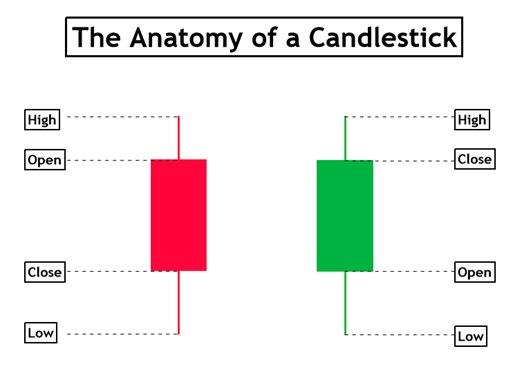
Candlestick patterns
There are three major candlestick pattern types:
• Reversal patterns – indicate potential trend reversals and shifts in momentum.
• Indecisiveness patterns – show a struggle between buyers and sellers with no clear control.
• Continuation patterns – suggest a pause or consolidation within an overall trend.
Within these categories, there are dozens of uniquely named candlestick patterns, each offering its own nuanced interpretation and potential trading signal.
You can find more information on candlestick chart patterns online and at Deriv Academy2.
We are also seeing new developments in software, such as MT5, which can now spot and label common candlestick patterns. Here are 27 common patterns:
1. Doji
2. Dragonfly Doji 3. Gravestone Doji
4. Bullish Spinning Top 5. Bearish Spinning Top 6. Marubozu Up 7. Marubozu Down 8. Hammer
Hanging Man 10. Inverted Hammer
Shooting Star
Bullish Engulfing 13. Bearish Engulfing
Tweezer Top
Tweezer Bottom
Three White Soldiers 17. Three Black Crows 18. Three Inside Up
Three Inside Down
Morning Star
Evening Star
Bullish Harami 23. Bearish Harami 24. Bullish Three-Line Strike 25. Bearish Three-Line Strike 26. Three Outside Up 27. Three Outside Down
Fig. 8.2. The anatomy of a candlestick: key price levels for bullish and bearish candles
Example of a candlestick pattern
Hanging Man: This pattern consists of a small-bodied candle with a long lower shadow. It suggests potential weakness in an uptrend, indicating a possible trend reversal.
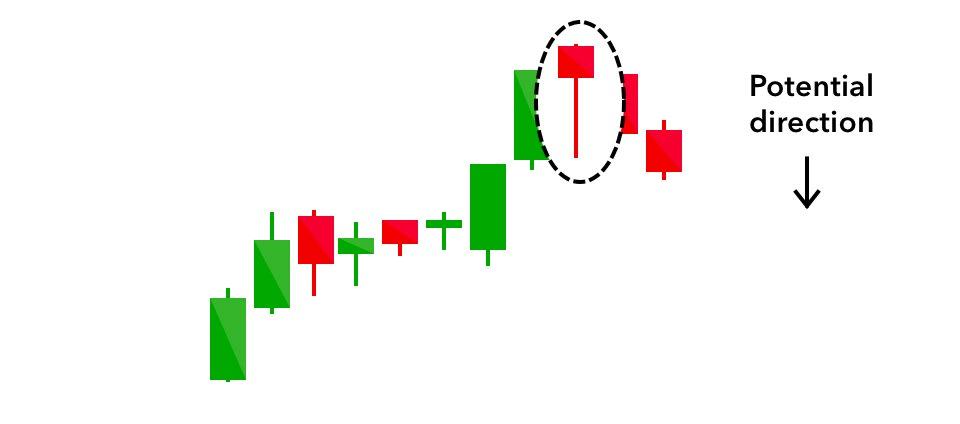
Summary
I have kept this brief as another ebook covers it in more detail. More information and examples of Japanese candlestick patterns can be found online, including at Deriv Academy3
No pattern works 100% of the time—some traders find them useful, while others see little or no value in them. It’s best to test and use them as part of a trading system rather than relying solely on chart patterns.
With the rise of pattern recognition software and websites, spotting patterns is becoming much easier.
Fig. 8.3. Bearish reversal signal: a hanging man pattern indicating potential downward movement
Chapter 9 Swing trading and scalping
Swing trading
Swing trading systems aim to capture short to medium-term price movements by holding trades for hours, days, or weeks. Oscillators and momentum indicators can help identify entry and exit points.
Here, we see TradingView with various tools for swing traders. I am using the Deriv Boom 500 Index with 5-minute bars. This is a fairly volatile index with frequent direction changes, making it a good choice for swing trading.
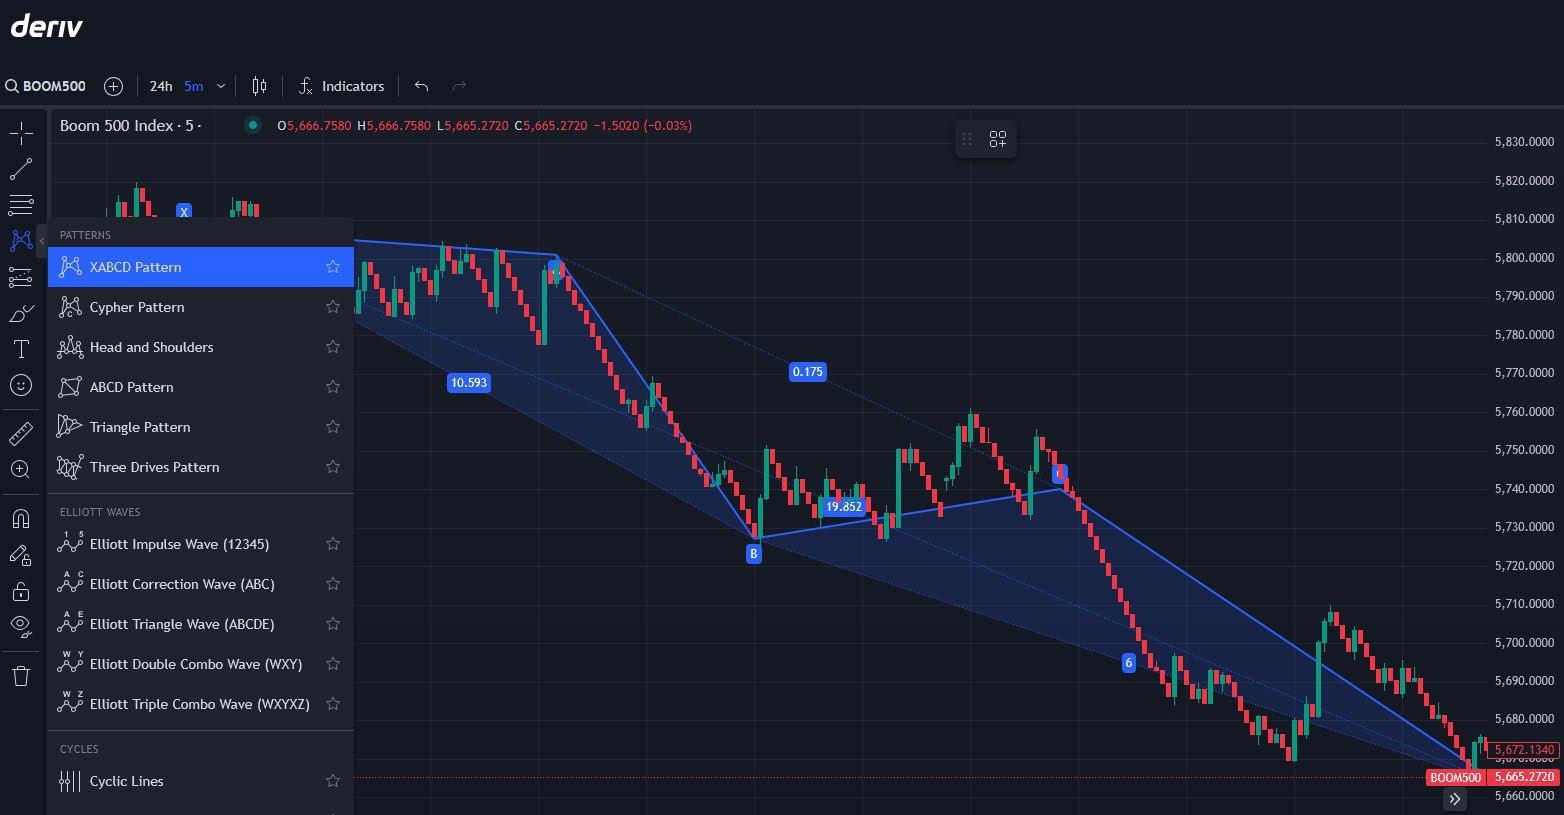
Swing trading Deriv’s Synthetic Indices can be a great way to capitalise on short- to mediumterm price movements, especially since these indices mimic real-world market volatility while running 24/7.
Below, I’ll outline a simple, beginner-friendly swing trading system tailored for Deriv’s Synthetic Indices, such as the Volatility 10, 25, 50, 75, or 100 Indices. This system uses basic technical analysis tools available on platforms like Deriv MT5 or Deriv Trader, keeping it straightforward and actionable.
There’s no need for programming skills, as we’ll use standard built-in indicators.
Simple swing trading system for Deriv Synthetic Indices
Overview
This system uses two widely used indicators— moving averages and the relative strength
index (RSI), which I have previously covered— to identify trends and potential reversal points.
Tools needed
• Platform: Deriv MT5 (recommended for its charting capabilities) or Deriv X –TradingView.
• Timeframe: 1-hour (H1) or 4-hour (H4) charts—ideal for swing trading, balancing frequency and clarity. Shorter timeframes can be used but may increase trading “noise” and lead to more false signals.
Indicators
• 50-period simple moving average (SMA): Identifies the overall trend.
• 20-period simple moving average (SMA): Tracks shorter-term price direction.
• RSI (14-period): Gauges overbought and oversold conditions.
Fig. 9.1. Swing trading on Deriv Boom 500 Index using pattern recognition tools in TradingView
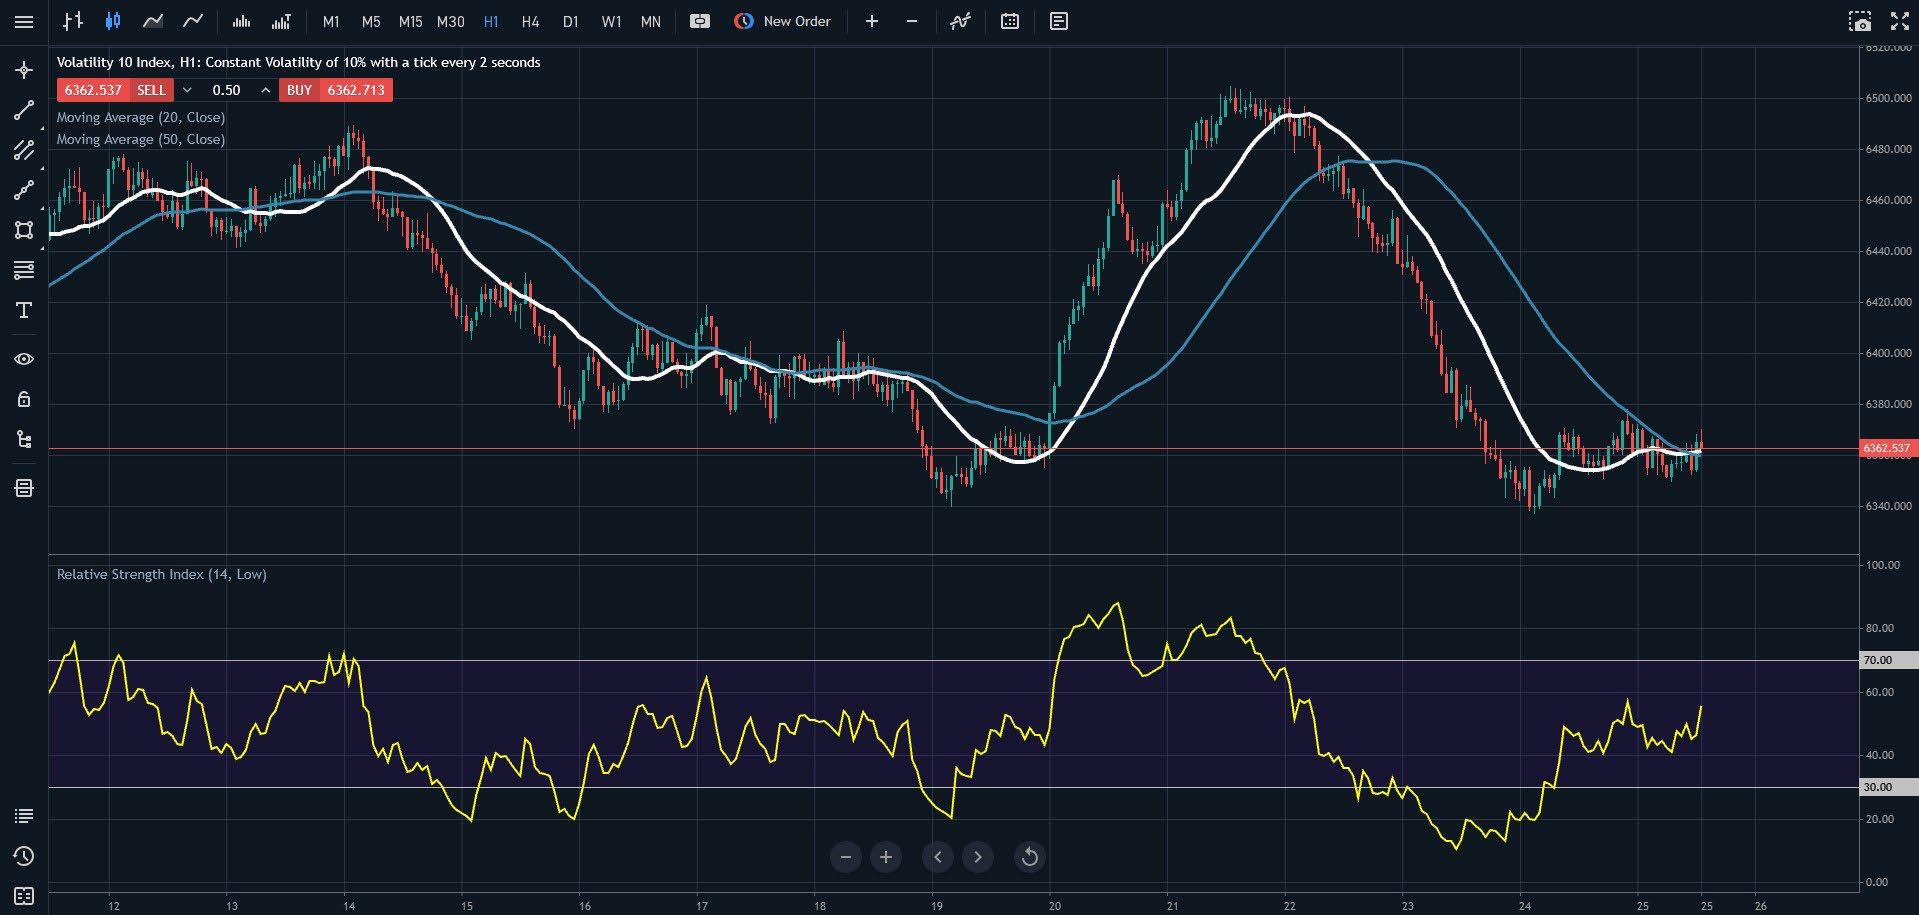
Setup instructions
Open your chart
• Log into Deriv MT5, select a Synthetic Index (e.g., Volatility 10 Index), and set the timeframe to H1 or H4.
• In my chart example, I am using H1 and Volatility 10 (2s) instead of Volatility 10 (1s). This slows down the trading action, which is helpful when you’re just starting.
Add indicators
• Add the 50 SMA and 20 SMA to your chart—these will appear as lines tracking the average price over 50 and 20 periods, respectively.
• Add the RSI (14) indicator, typically displayed below the price chart, with levels set at 70 (overbought) and 30 (oversold).
Trading rules
Entry
Buy signal:
• The 20 SMA crosses above the 50 SMA, indicating a bullish trend.
• RSI is above 50 but below 70, showing upward momentum without being overbought.
• Wait for a pullback to the 20 SMA (price dips toward it but doesn’t break below significantly) to enter the trade.
Sell signal:
• The 20 SMA crosses below the 50 SMA, indicating a bearish trend.
• RSI is below 50 but above 30, showing downward momentum without being oversold.
• Wait for a pullback to the 20 SMA (price rises toward it but doesn’t break above significantly) to enter.
Exit
Take profit:
• Aim for a target based on recent swing highs (for buys) or swing lows (for sells). On Synthetic Indices, these can be roughly 1-2% moves, depending on volatility (e.g., Volatility 100 moves faster than Volatility 10).
• Alternatively, exit when the 20 SMA crosses back over the 50 SMA in the opposite direction.
Stop loss:
• Place below the recent swing low (for buys) or above the recent swing high (for sells).
• Typically set 0.5-1% away from your entry, adjusted for the index’s volatility.
Fig. 9.2. Trading setup for swing trading Deriv Synthetic Indices using moving averages and RSI
Risk management
Risk no more than 1–2% of your account per trade. Synthetic Indices can be volatile, so calculate your position size accordingly (Deriv MT5 has a built-in calculator).
Start with a demo account to test the system and adjust based on the specific index’s behaviour. Begin with lower volatility indices, such as the Volatility 10 Index, before trading more volatile ones.
Summary of this system
• Trend clarity: The moving average crossover filters out noise and confirms the trend, which is crucial since Synthetic Indices lack fundamental drivers.
• Pullback entry: Waiting for price to retest the 20 SMA helps avoid chasing moves, a common pitfall in volatile markets.
• RSI filter: Ensures you’re trading with momentum but not entering when the market is exhausted.
• Choose the right index: Start with a lower-volatility index like Volatility 10 or 25 for more predictable swings. Higher-volatility indices like Volatility 100 can work but require tighter stops and faster decisions.
• Practise first: Use Deriv’s demo account to get comfortable with the system and the index’s movement patterns.
• Be patient: Swing trading isn’t about constant action—wait for clear setups, which might take hours or days depending on the timeframe. You can trade other markets while waiting.
• Avoid overtrading: Synthetic Indices run 24/7, but stick to your plan and don’t force trades outside your rules.
This system keeps things simple, leveraging trends and pullbacks without overcomplicating the process. Test it on a demo account, adjust it to fit your style, start small, and build up.
Swing trading system on a Deriv Drift Switch Index
I have used the same rules as previously mentioned, with one change—using the M30 (30-minute) timeframe on the DSI 30 Index, which typically switches every 30 minutes.
This highlights the advantage of using charting platforms like MT5, where you can easily tweak a system and test small adjustments.
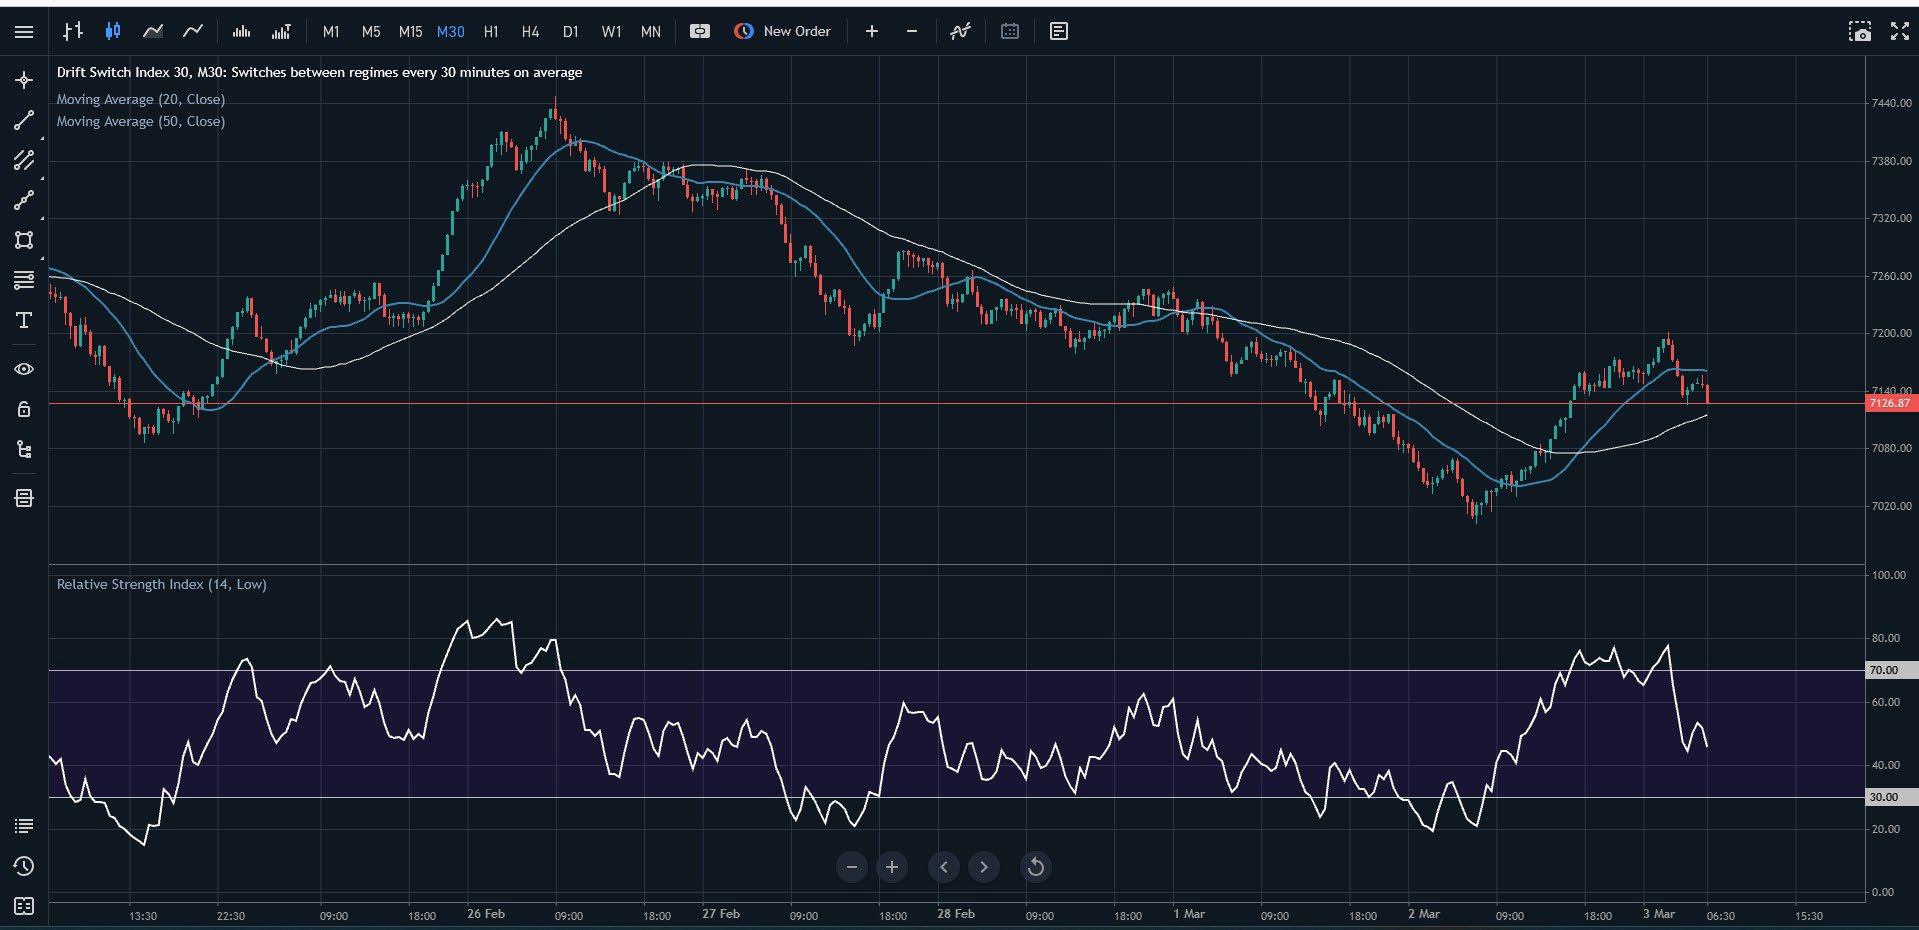
Fig. 9.3. Swing trading setup on Deriv Drift Switch Index 30 using M30 timeframe with moving averages and RSI
Scalping: Make multiple small trades to accumulate profits over time
Focus on short timeframes and quick executions.
Scalping Deriv’s Synthetic Indices is a fastpaced strategy that takes advantage of their continuous price movements and volatility.
Since these indices operate 24/7 without real-world event interruptions, they provide consistent trading opportunities.
Below, I’ll outline a simple, beginner-friendly scalping system tailored for Synthetic Indices— such as Volatility 10, 25, 50, 75, 100, or 250— using basic technical tools available on Deriv MT5 or Deriv Trader platforms.
There’s no complex setup or programming required, and you don’t need to pay for additional software.
This system focuses on quick entries and exits to capture small profits (0.5-1% moves) multiple times a day.
Simple scalping system for Deriv Synthetic Indices
Overview
This system uses the exponential moving average (EMA) for trend direction and the stochastic oscillator to time entries in overbought or oversold conditions.
It’s designed for short timeframes, keeping trades quick and manageable—perfect for scalping Synthetic Indices.
Tools needed
Platform: Deriv MT5 (recommended) but also works on TradingView, Deriv cTrader, and Deriv X.
Timeframe: 5-minute (M5) chart – fast enough for scalping while reducing noise. M1 can be considered, but I would start with M5. Test M1 as you gain more experience.
Indicators
8-period EMA (exponential moving average): A fast-moving average to catch short-term trends.
Stochastic oscillator (5,3,3): Used to identify overbought (above 80) and oversold (below 20) levels.
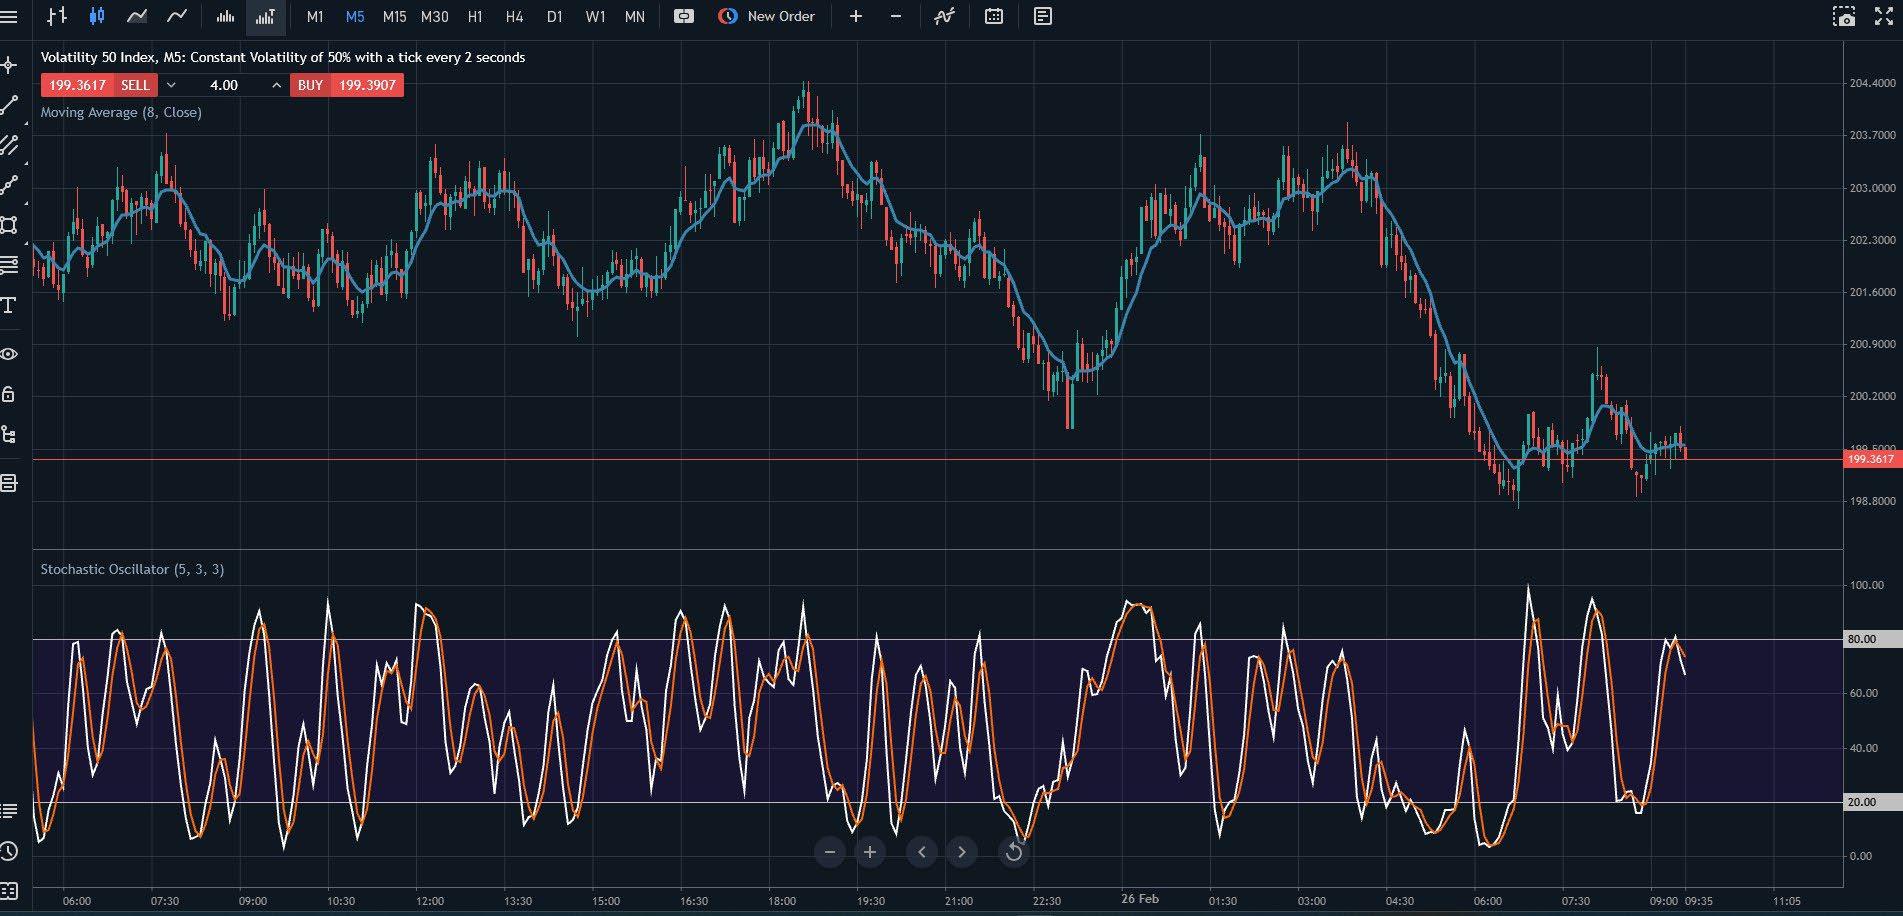
Fig. 9.4. Scalping setup on Volatility 50 Index (M5) using the 8 EMA and Stochastic Oscillator for trade entries
Setup instructions
Open your chart:
• Log into Deriv MT5, select a Synthetic Index (e.g., Volatility 50 Index), and set the timeframe to M5.
Add indicators:
• Add the 8 EMA to your chart—it will overlay as a line tracking the average price over 8 periods.
• Add the stochastic oscillator (5,3,3) below the chart, with default overbought (80) and oversold (20) lines, as shown in my example chart on Volatility 50 Index.
Trading rules
Entry
Buy signal:
• Price is above the 8 EMA, indicating a shortterm uptrend.
• Stochastic drops below 20 (oversold) and then crosses back upward (%K line crosses above %D line).
• Enter on the next candle after the Stochastic crossover confirms.
Sell signal:
• Price is below the 8 EMA, indicating a shortterm downtrend.
• Stochastic rises above 80 (overbought) and then crosses back downward.
• Enter on the next candle after the Stochastic crossover confirms.
Exit
Take profit:
• Aim for a small, fixed gain: 0.5-1% of the index price (e.g., 5-10 points on Volatility 50, depending on its level).
• Alternatively, exit when Stochastic hits the opposite extreme (above 80 for a buy, below 20 for a sell).
Stop loss:
• Place 0.5% below the entry for buys (or above for sells), typically near the recent swing low/high.
• For example, on Volatility 75, this might be 5-7 points from entry.
Risk management
Risk only 1-2% of your account per trade. Synthetic Indices move fast, especially highvolatility ones, so use small lot sizes (e.g. 0.01 lots on MT5) to stay safe.
Limit daily trades to 5–10 to avoid overtrading— scalping can be tempting with 24/7 markets.
Test on Deriv’s demo account first to get familiar with execution speed and index behaviour.
Why consider this system on Synthetic Indices?
Trend filter: The 8 EMA keeps you trading with the immediate momentum, which is critical for scalping’s hit-and-run style.
Stochastic timing: Helps catch quick reversals in overextended markets, which are common in the volatile swings of Synthetic Indices.
Speed: The M5 timeframe balances rapid trades (5-15 minutes each) while avoiding the chaos of lower timeframes.
Tips for success
Pick the right index: Start with Volatility 25 or 50—they offer enough movement for scalping without the extreme spikes of Volatility 75, 100, or 250. Lower-volatility indices like Volatility 10 might be too slow.
Stay disciplined: Exit trades quickly, even if it’s tempting to hold—scalping isn’t about big wins per trade.
Watch spreads: Deriv’s spreads on Synthetic Indices vary (tighter on Volatility 10, wider on Volatility 100). Factor this into your profit targets. While Deriv doesn’t charge commission, you must cover the spread before reaching profit.
Time of day matters: Though Synthetic Indices run 24/7, trade when you’re sharp and focused, not fatigued.
Consider automation: A trading bot or algo system can help maintain discipline and execute trades with precision, as a computer is always sharp!

Example
On a Volatility 50 M5 chart:
• Price is above the 8 EMA at 5000.00.
• Stochastic drops to 18, then %K crosses above %D at 20.
• You buy at 5002.00.
• Set a stop loss at 4997.00 (5 points below) and take profit at 5009.00 (7 points up, ~0.7% gain).
• Five minutes later, price hits 5009.00, and you exit with a quick profit.
• If Stochastic hits 80 first, exit early.
Scaling up
Once comfortable, try:
• Adding a 21 EMA for a stronger trend filter—only trade when the 8 EMA aligns with it.
• Switching to Volatility 75 for bigger moves (adjust stops and targets accordingly).
• Using Deriv Bot to automate this setup if you prefer hands-off scalping.
This system is simple, relying on two indicators to keep decisions clear and fast—ideal for scalping Synthetic Indices.
Test it on a demo account, tweak profit/stop levels based on your index’s volatility, and let me know how it performs for you!
Chapter 10 Automated trading and bots
Deriv Bot
I have previously mentioned Deriv Bot, which allows you to automate a system on Deriv Options products. In addition to using ready-made systems, you can also program your own within Deriv Bot.
If you’re not comfortable coding, you can hire a freelancer to create a system for you. Websites like Fiverr have freelancers offering these services—search for “Deriv Bot”, “Deriv trading systems”, or “Options”.
Just to be clear, these freelancers are not endorsed by Deriv, so do your own checks before parting with money and ask questions to ensure you get what you need.
Here are a few examples from Fiverr for Deriv Bot services.
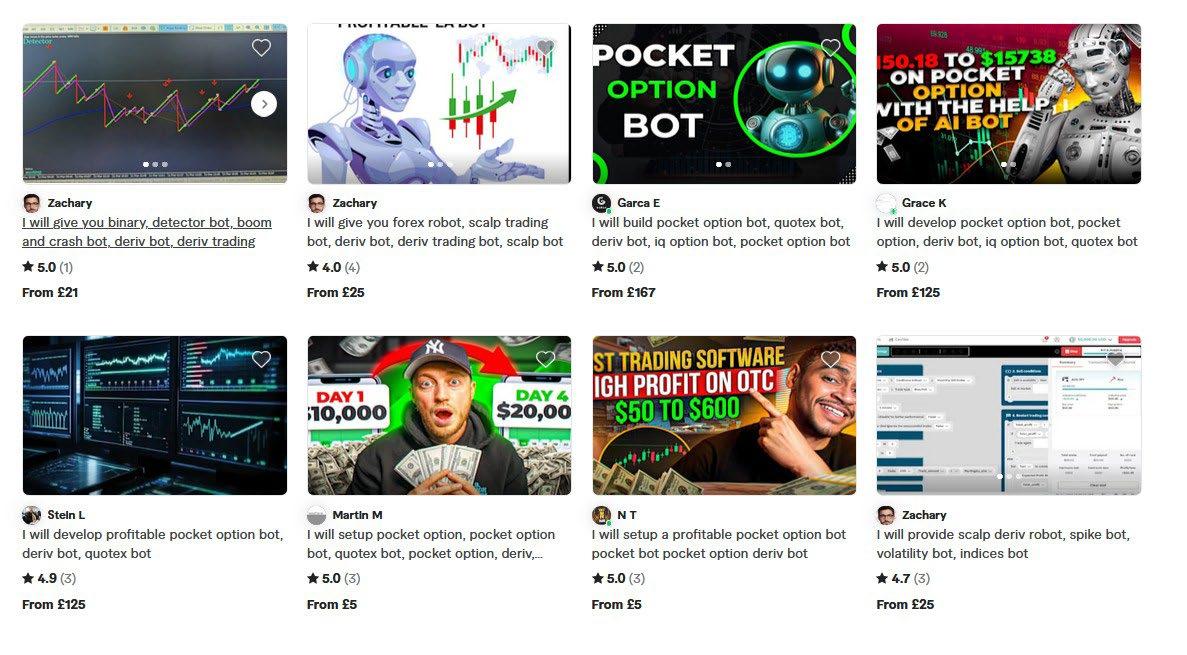
If you visit the Deriv Bot page, you can learn more about bot trading and try out free ready-made systems with a demo account. These include Martingale, D’Alembert, and Oscar’s Grind, along with their variations.
To learn more about these strategies and more, read this article.
There are also various videos on YouTube about Deriv Bot trading systems. However, to be clear, these are not endorsed by Deriv, so do your own research before following any strategies.
Fig. 10.1. Freelancers offering Deriv Bot development and trading automation services on Fiverr
MT5 trading systems
MT5 has a vast trading community covering all major financial markets, with Forex traders being the largest users. You can implement system trading on MT5 and even find developers to help code your strategies.
MQL5 is the programming language used for MT5 systems. You can learn more here: https://www.mql5.com/en/docs/basis
Many Forex trading systems can also be applied to Synthetic Indices, but be cautious—don’t pay large sums to have a system coded.
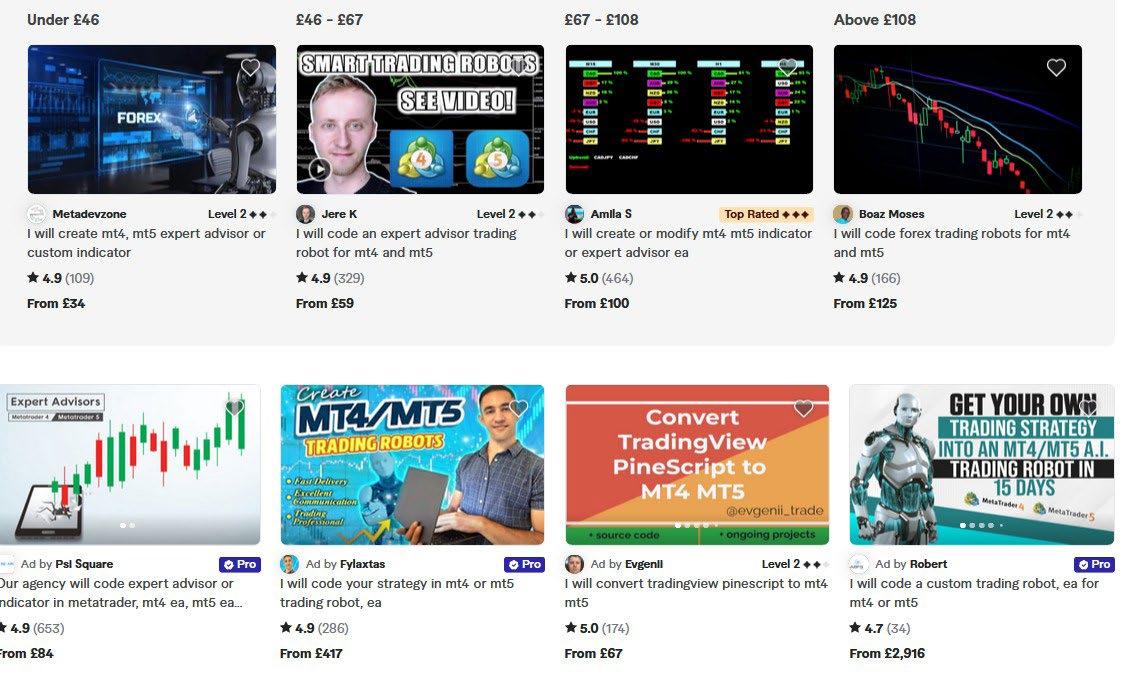
Fig. 10.2. Deriv Bot strategy builder interface with pre-set trading templates for automated trading strategies
Fig. 10.3. Freelancers offering MT4/MT5 expert advisor (EA) development and trading bot services on Fiverr
Summary
In Part 3, I have covered popular technical analysis tools that can help you develop your trading system.
• It’s not just about when to enter a trade—it’s equally important to have an exit plan and know when to close a position.
• Money management is crucial. No matter how good a trade setup looks, keep your emotions in check and manage your risk using stop losses and take profit tools.
• You can also explore automated trading systems using Deriv Bot, cTrader, and MT5.

Top tips and resources
Chapter 11
Top tips on becoming a better trader
Since this ebook focuses on Synthetic Indices, these tips are tailored to becoming a better Synthetic Indices trader, but many also apply to other markets on Deriv, such as Forex, Commodities, Cryptocurrencies, and Stocks.
Becoming a successful trader requires a combination of knowledge, skills, and discipline.
Here are my top ten tips to help you on your journey:
1. Start small and build up
Albert Einstein was once asked what mankind’s greatest invention was. He replied, “Compound interest.” There’s even a claim that Einstein called compound interest the “eighth wonder of the world.”
I have been in the trading business for over 37 years, and I started small. It was through the power of compounding that I built up to where I am now.
Here’s an illustration of the growth of $1,000 at 1% daily compound interest over 12 months (using 30-day months for simplicity, totalling 360 days). I’ll list the amount at the end of each month.
Just to be clear, no one is guaranteeing 1% daily returns—this is simply to show the power of compounding, even with a relatively small amount.
Starting with $1,000, after 12 months (360 days) at 1% daily compound interest, you’d have approximately $33,985.90, including your $1,000 starting amount.
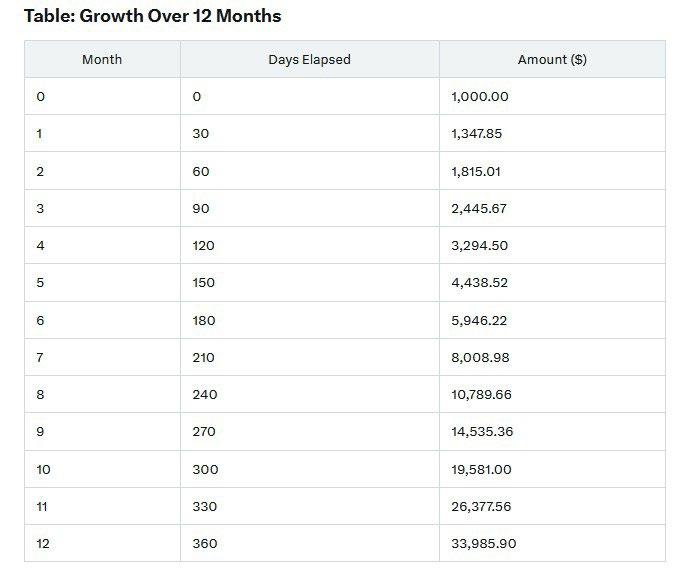
Table 11.1. Growth of $1,000 at 1% daily compound interest over 12 months, illustrating the power of compounding
For my own success, reinvesting profits from one investment into another really helped build my wealth. Yes, you’ll want to spend some of your profits along the way, but I have always been a disciplined saver and would reinvest the majority of my gains.
Begin with a small amount of capital that you can afford to risk. This will help you learn, manage risks, and gain experience while gradually growing your trading account.
2. Trade CFDs & Options
Some traders focus solely on CFDs, while others trade only Options. However, there are many advantages to trading both. As shown previously, it’s easy to have both the Options and CFD platforms open simultaneously.
For example, holding a core CFD position— such as long Volatility 75 Index—while trading Options around it can help limit risk and increase potential profitability.
Sticking to just CFDs or just Options may limit your potential. Additionally, Options can be useful for profiting from a sideways market (trading range), offering more flexibility in different market conditions.
3. Diversify your Synthetic Indices
Many traders focus on just one product, such as Boom 500 Index, without exploring other opportunities. While you don’t need to trade every market on Deriv, it makes sense to follow and trade 5 or 6 different markets for better diversification.
At some point, you can also consider expanding into other asset classes like Forex, Stocks, Cryptocurrencies, and Commodities, all of which can be traded on Deriv from the same account. This adds further diversification and helps manage risk across different market conditions.
4. Think more about your exit rather than your entry
Most new traders spend too much time finding new trades but little or no time planning their exit strategy. Having a clear exit plan before entering a trade helps manage both successful and losing trades effectively.
Remember, when you have an open trade, your psychology and decision-making change— whereas when you have no position, you remain neutral.
To stay disciplined, use stop losses (SL) and
take profit (TP) settings to automate your exit decisions and remove emotional bias from your trading.
5. Stay focused and follow your plan
We live in an era of information overload, with 24/7 access to articles, news sites, trading tools, chat rooms, business TV channels, and YouTube—each filled with “trading experts” eager to share their views.
While some of this information may be valuable, be cautious of information overload or paralysis by analysis.
Stay focused on your trading, keep a clear mind, and simplify your trading plan as much as possible. I’ve had so-called experts laugh at my trading systems, calling them “too basic,” yet these simple strategies have generated massive profits. Having 50 indicators and cluttered charts is nothing to boast about— clarity beats complexity.
Always use stop-loss orders to limit losses and protect your capital.
Never risk more than a small percentage of your trading capital on a single trade.
6. Have a backup device
As mentioned earlier, if you have an open trade—for example, a running Options trade on Deriv—and you lose internet access, the trade will continue running on Deriv’s servers, not your device. However, this means you lose access to monitoring your trade, taking profits, or adjusting stops.
So it makes sense to have two devices and, ideally, different internet sources. For example, you can use different SIM cards from separate providers or a combination of Wi-Fi and cellular data. And if you use a backup device, if your PC freezes, you can still access your trades via a mobile or tablet.
For short-term traders, this is especially important, as just a few minutes of downtime could make a big difference.
7. CANI – Constant And NeverEnding Improvement
CANI (Constant And Never-Ending Improvement) embodies a powerful philosophy of continuous self-betterment. It’s about striving for progress, not perfection, and taking proactive steps to learn and grow every day.
Stay updated with technology and new trading products. Use trading software and tools to analyse markets, automate trades, and stay ahead of the competition. Leverage AI—we are witnessing major leaps in Artificial Intelligence (AI), which is now accessible at little or no cost.
8. Use a demo account and real account
Many new traders start with a demo account before moving to a real account, but you don’t have to abandon the demo once you go live. You can keep both open. Use your demo account to try new ideas while making real trades on your funded account.
9. Keep emotions in check
Trading can be emotionally taxing. Avoid making impulsive decisions based on fear or greed. Stick to your trading plan and maintain a calm, rational approach.
You will have losing trades, and there will be times when nothing seems to go your way—this happens to every trader. Anyone who tells you otherwise is not being truthful.
The best thing you can do after poor sessions is to take a break—reset by playing a game, ping pong, running, taking a walk, going to the gym, or whatever helps you clear your mind.
Earlier, I mentioned tennis star Björn Borg. Trading and sports psychology share many similarities, and it’s worth spending some time working on your mindset.
10. Review and learn
Regularly review your trades to understand what worked and what didn’t. Learn from your mistakes and continuously refine your trading strategies. Success in trading doesn’t happen overnight. Be patient and give yourself time to learn and improve. Avoid the temptation to chase quick profits.
Chapter 12 Tools and resources
Deriv offers a range of tools and resources to help traders succeed:
Charting tools: Advanced charting with multiple timeframes, indicators, and drawing tools.
Educational resources: Tutorials, webinars, articles, and ebooks to help improve your trading skills. This ebook is just one of an expanding library of ebooks and resources.
Demo account: Practise trading with virtual funds to test strategies without risking real money.
Customer support: 24/7 assistance for any queries or issues.
Useful websites
Deriv Academy4
MetaTrader 5 (MT5)
cTrader
TradingView
Barchart.com (not for Synthetic Indices but very helpful for trading Forex, Stocks, and Commodities)
Fiverr — Here, you can find freelancers who offer services for trading systems, bot programming, and setting up indicators. Search for “Options,” “MT5,” or “Deriv” to find relevant sellers.
Deriv YouTube Channel — This is the official Deriv YouTube channel, where you’ll find a selection of videos I’ve made, showcasing MT5 in action. I have videos covering trading Gold, Volatility Index, and Bitcoin.
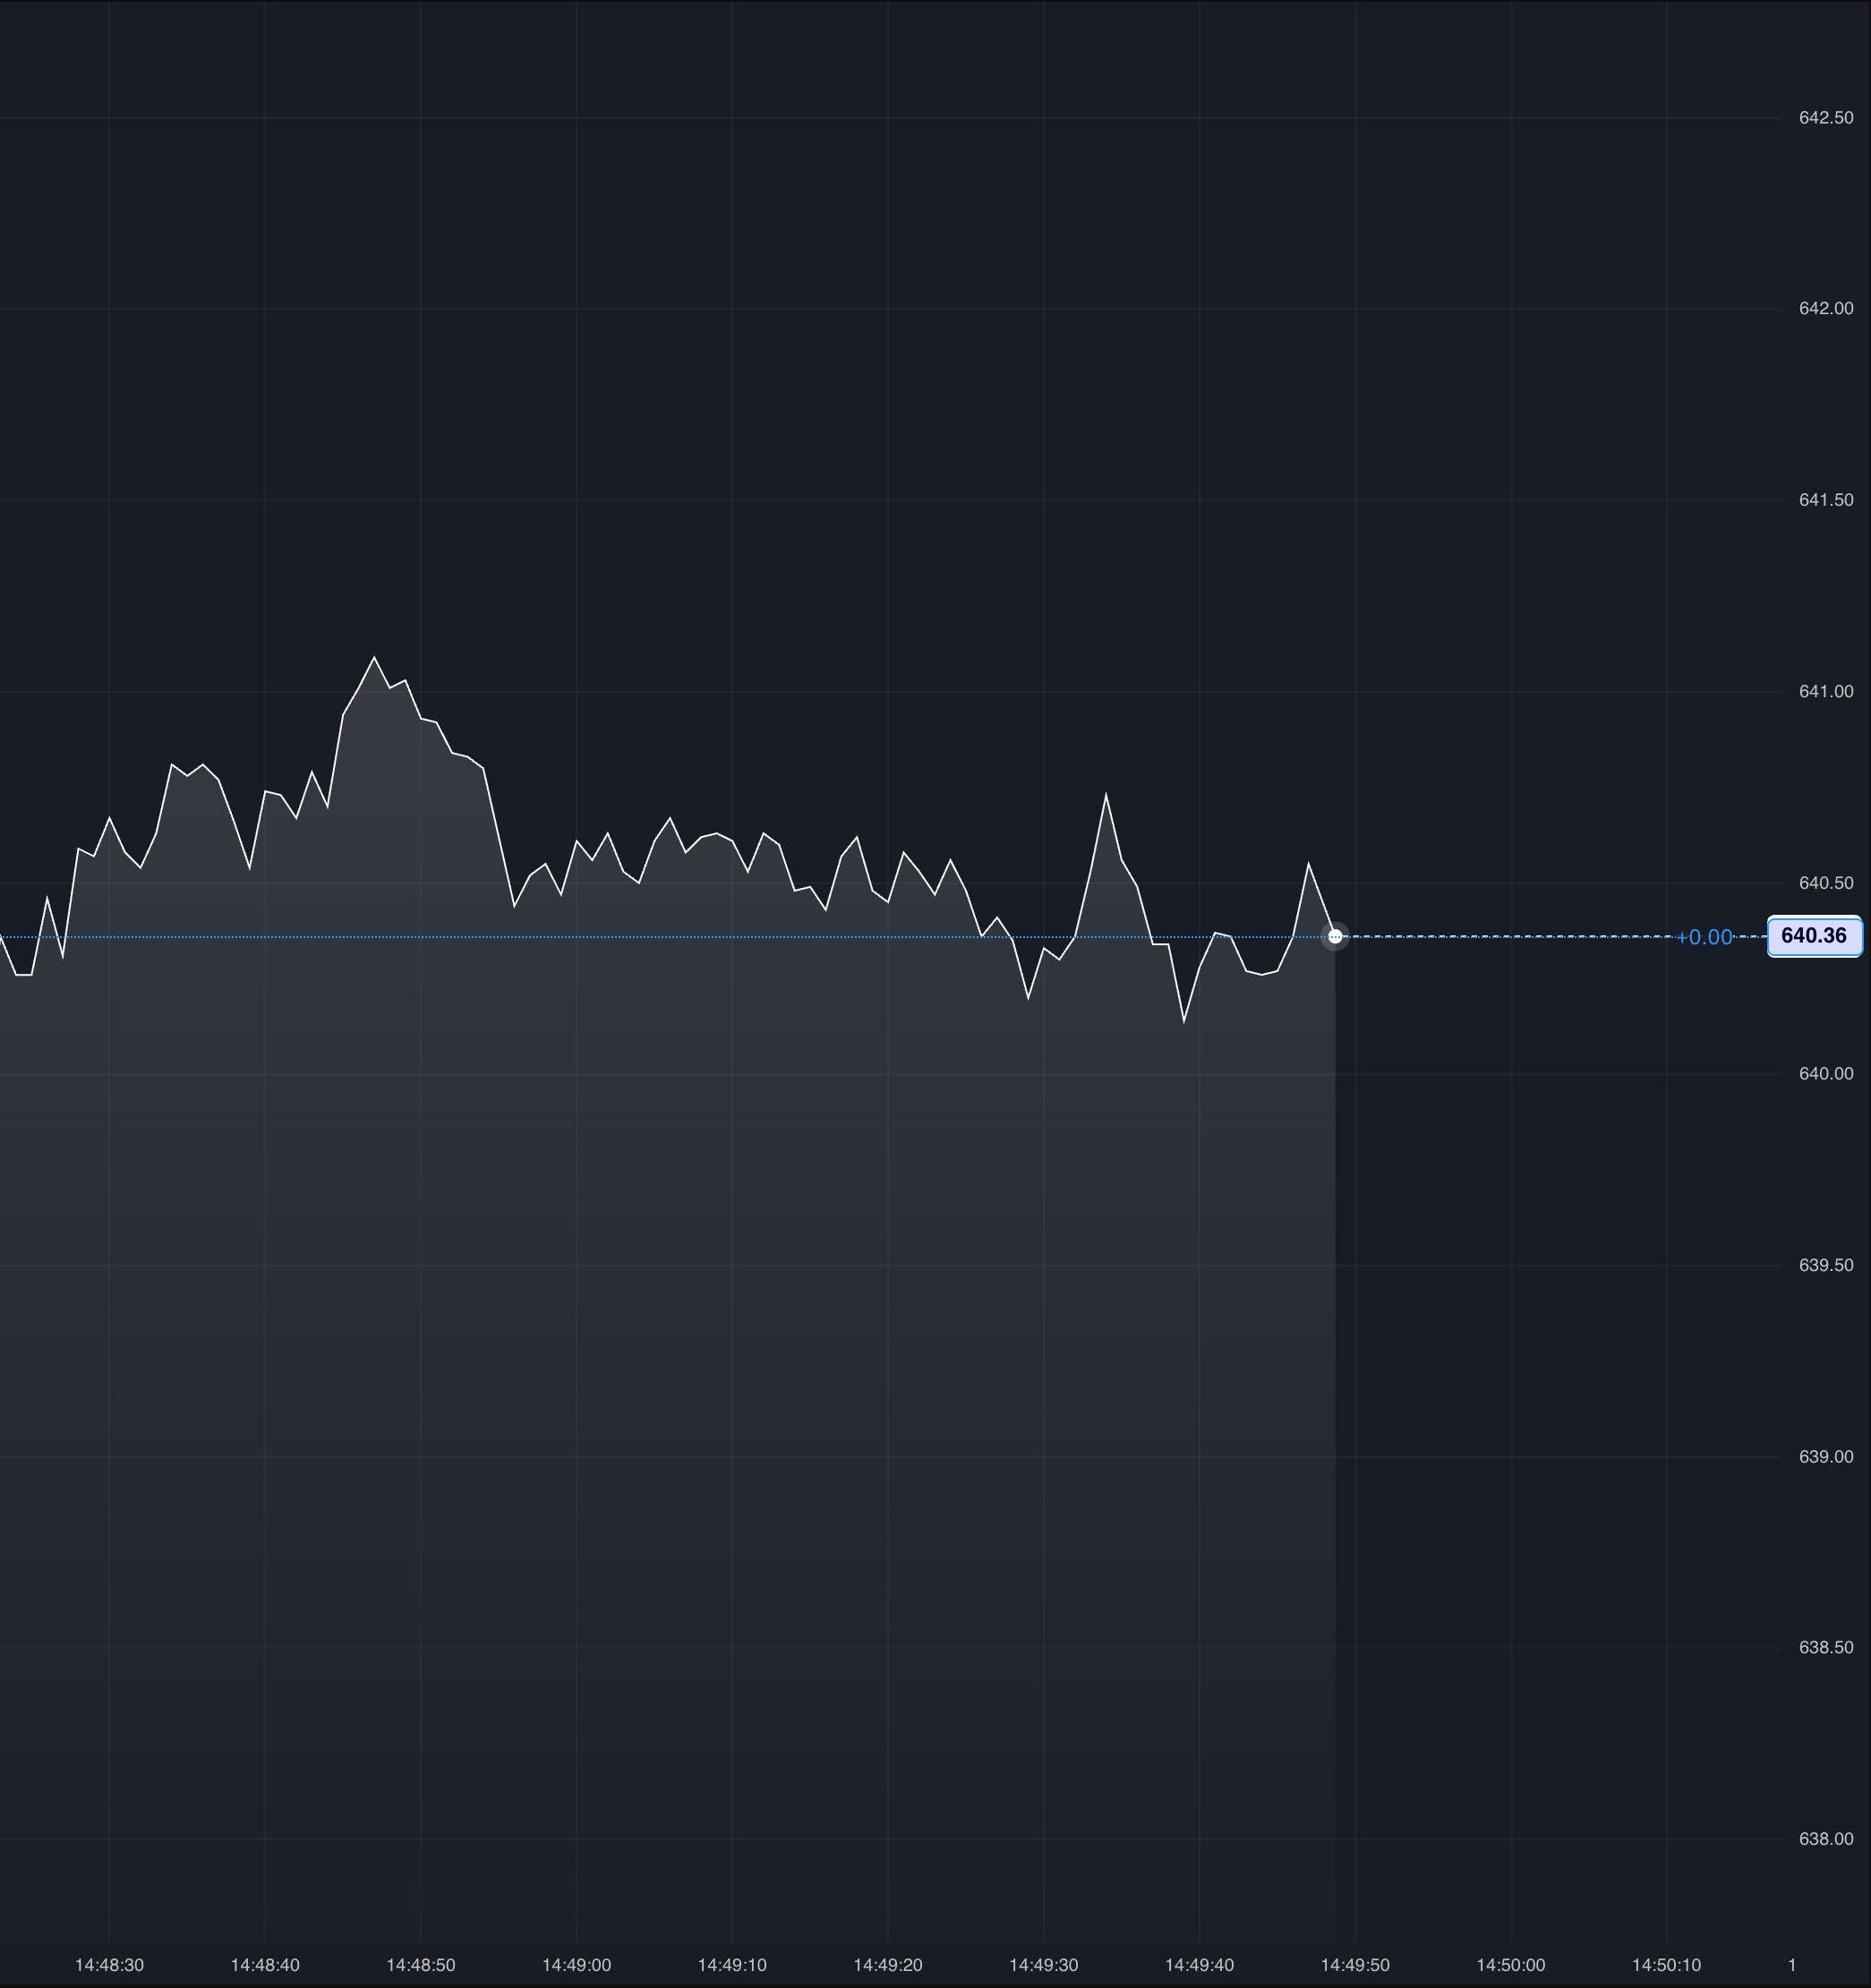
Let’s recap
• Choose your index: Select the Synthetic Index you want to trade based on your risk tolerance and trading strategy.
• Analyse the market: Use technical analysis tools to help predict market movements.
• Place your trade: Decide on the trade size and direction, then execute your trade.
• Monitor and close your trade: Keep track of your trade and close it when you reach your desired profit or loss level—this can be done automatically with orders.
• Automate trades: Consider moving to automated trading after testing and using systems manually. Automation can reduce human emotions and errors.
Final note
As I’m sure you’ll agree, Synthetic Indices provide a compelling opportunity for traders to speculate on market movements without the influence of real-world events.
By following this comprehensive guide, you’ll be well-equipped to trade Synthetic Indices with Deriv in both Digital Options and CFD formats.
No one can guarantee success in trading, but I’d like to think you now have a better understanding and a stronger chance of trading successfully.
Remember to practise good risk management and continually educate yourself to improve your trading skills.
Trading is a marathon, not a sprint—it takes time, dedication, and continuous learning to achieve long-term success.
Wishing you every success in your trading with Deriv.
Vince Stanzione
Frequently asked questions (FAQs)
Opening an account
I’m new to trading. Where do I start?
The first step is to open an account. You can apply online in just a few minutes. You can open a practice trading account.
Do I need to send any documents?
Deriv works to a high compliance standard as required by its regulators. Know Your Client (KYC) is now required in many countries. Deriv works hard to make this as simple as possible and not cause unnecessary delays.
Do you offer demo accounts?
Deriv offers a demo account so you can get the hang of trading before trading any real funds. There is no time limit on a demo account, and a real account and demo account can run concurrently.
Will I need to install any software?
Deriv is entirely web browser-based and requires no software installation. You can also use a tablet or mobile device for trading.
MT5 can be run in web mode, but the full version requires an app, which is available free of charge from Google Play and the Apple App Store.
Deriv also offers a mobile app called Deriv GO for trading on the go.
How soon can I start trading?
You can open a Deriv account, deposit funds, and begin trading within minutes.
How safe is my money with Deriv?
Your money is always safe with Deriv and held in segregated accounts at all times. Deriv has been in business for over 25 years and is licensed and regulated in established jurisdictions, ensuring a secure trading environment.
How does Deriv make money?
Deriv has thousands of clients taking a variety of positions on financial markets at any time and earns a small margin on these trades. It does not charge commissions to clients. However, some products, such as CFDs, may have an overnight interest charge, on which Deriv may earn a small margin.
If I make too much money, will my account be closed or will I be banned?
No. Deriv encourages successful clients and will not close or limit a winning account. Deriv can hedge trades into financial markets, which means they have no vested interest in the client’s final result.
Depositing and withdrawing funds
Do I need to deposit any funds to open an account?
You don’t need to deposit any money to open an account, but you need to deposit funds before you can start trading.
How do I fund my account?
Deriv offers a range of common deposit and withdrawal methods, from credit and debit cards to bank wires, e-cash, cryptocurrencies such as Bitcoin, and e-wallets. Deriv is continually adding new payment methods in local regions.
Is it possible to deposit and withdraw the same funds through different payment methods?
Unfortunately, no. Funds initially deposited through one payment method must be withdrawn through the same system; funds cannot be transferred to an alternate system for withdrawal. However, Deriv offers a wide variety of payment methods to suit your specific needs and preferences.
Have a question? You can contact Deriv via live chat 24/7.
Glossary of terms
This glossary is tailored to Deriv’s Synthetic Indices focusing on trading CFDs and Options. Some terms may have different meaning in other markets. For a more in-depth glossary, visit Deriv’s website.
AAsk Price: The lowest price a seller is willing to accept for a Synthetic Index when trading CFDs or Options. It’s the price you’d pay to enter a buy position. In this quote: 2301.99 –2302.59 the Ask or Offer is the higher price (2302.59).
At-the-Money (ATM): In Options trading, an Option is at-the-money (ATM) when the current price of the Synthetic Index matches the strike price. This means the Option is neither profitable nor unprofitable if exercised immediately.
Accumulator Option: A type of trade that allows you to profit from sideways market movements by earning a compounding payout as long as the price of the underlying asset stays within a predefined range. Your potential profit grows exponentially with each tick as long as the price remains stable within your chosen boundaries. Your maximum risk is limited to your initial stake if the price breaks out of the range. Growth rate can be chosen between 1% and 5%.
BBearish Trend: A downward price movement in a Synthetic Index, often replicated in indices like Volatility 100 Index on Deriv. Traders might look to sell short CFDs or buy Put Options to profit from this.
Bid Price: The highest price a buyer is willing to pay for a Synthetic Index in CFD trading. It’s the price you’d receive if selling a position. In this quote: 2301.99 – 2302.59 the Bid is the lower price (2301.99).
Boom Index: A Synthetic Index on Deriv designed to simulate sudden upward price spikes (booms), occurring on average every 300, 500, or 1,000 ticks. Available for CFDs and Options trading.
C
Call Option: An Options contract giving the buyer the right, but not the obligation, to purchase a Synthetic Index at a specified strike price before or at expiration. Used to speculate on rising prices.
Contract for Difference (CFD): A financial instrument allowing traders to speculate on the price movement of Synthetic Indices without owning the underlying asset. Profits or losses come from the difference between entry and exit prices.
Crash Index: A Synthetic Index on Deriv that mimics sudden downward price drops (crashes), occurring on average every 300, 500, or 1,000 ticks. Tradable via CFDs or Options.
Counterparty Risk: The risk associated with the party on the other side of a CFD or Option contract. In the case of Synthetic Indices, Deriv acts as the counterparty. It’s important to choose a stable and well-established counterparty, as a CFD or Option contract is only as reliable as the counterparty itself. Deriv provides a strong and secure trading environment.
DDeal Cancellation: A risk management feature on Deriv for Multipliers on Synthetic Indices, allowing traders to cancel a losing trade within a set time frame for a small fee, refunding the initial stake.
Derived Indices: Another term for Synthetic Indices on Deriv, which are algorithmically generated to mimic real-world market behavior, free from external news or liquidity risks.
Drift Switch Index: A Synthetic Index on Deriv that shifts between bullish and bearish trends with constant volatility, suitable for CFD trading and systems such as swing trading.
Digit: A type of Option that allows you to speculate on the last digit of the last tick of a trade contract. Deriv offers a selection of Digits such as Match/Differs, Even/Odd and Under/ Over.
EExpiration: The date and time when an Options contract on a Synthetic Index expires or settles. On Deriv, expiration can range from seconds to days or weeks depending on the contract. All Options are cash settled.
Equity: The total value of a trader’s account, including open CFD positions and unrealized profits or losses on Synthetic Indices.
Forex-Derived Indices: Synthetic indices on Deriv that replicate the volatility of Forex markets, such as Derived FX, tradable with CFDs.
G
Going Long: Opening a buy position in CFDs or a call Option on a Synthetic Index, expecting its price to rise. In Digital Options, they are also labelled as Lower traders.
Going Short: Opening a sell position in CFDs or a put Option on a Synthetic Index, anticipating a price decline. In Digital Options they are also labelled as Higher traders.
H
Hedging: Using CFDs or Options to offset potential losses in other trades or investments, reducing overall risk. This tends to be done in Forex, Stocks, and Commodities rather than Synthetic Indices.
IIn-the-Money (ITM): A call Option is ITM when the Synthetic Index price is above the strike price, and a put Option is ITM when the Synthetic Index price is below the strike price. This means the Option is profitable if it is closed. Deriv offers a resale price on most options up to 60 seconds before expiration, allowing traders to take profit or limit losses before the Option expires.
Intrinsic Value: For Options on Synthetic Indices, intrinsic value is the immediate profit if the Option were exercised at the current moment. It is calculated as the difference between the current index price and the strike price, but only if the option is in-the-money (ITM).
J
Jump Index: A Synthetic Index on Deriv that simulates markets with occasional sharp price jumps, offering high volatility for CFD and Options traders. Prices leap every 20 minutes (on average), with an equal chance of soaring or plunging around 30x the normal volatility of the index. Traders can choose from 10%, 25%, 50%, 75%, and 100% volatility options.
K
Knockout: A feature in some Synthetic Index Options trading where the contract ends if the price hits a predefined barrier, limiting potential losses or locking in gains.
L
Leverage: A tool in CFD trading on Synthetic Indices that allows traders to control a larger position with a smaller deposit (margin). For example, 1:1000 leverage means $1 controls $1,000 worth of index value.
Liquidity: The availability of buyers and sellers also known as depth. While Synthetic Indices don’t depend on real-world liquidity, Deriv ensures constant availability and fast execution, mimicking high-liquidity markets 24/7.
M
Margin: The initial deposit required to open a leveraged CFD position on a Synthetic Index. A percentage of the total trade value, it amplifies both profits and losses.
Multiplier: A trading type on Deriv that combines leverage with capped risk, applied to Synthetic Indices. Traders multiply their stake, but losses are limited to the initial investment.
MT5: A charting and trading software package designed by Metaquotes. The 5 indicates the 5th edition, which is the one used by Deriv and the newest edition. Some brokers still use MT4.
N
Notional Value: The total value of a CFD position on a Synthetic Index, calculated as the contract size multiplied by the current price, though only a margin is required to trade.
OOut-of-the-Money (OTM): An Options term where a call Option’s Synthetic Index price is below the strike price, or a put Option’s price is above it. This means the Option is unprofitable if it expires or is closed early.
Overnight Charges (Swaps): Fees applied to CFD positions on Synthetic Indices held open past a trading day. Some Deriv accounts offer swap-free options.
PPip: A small price movement unit in CFD trading, often relevant for forex-derived synthetic indices like Derived FX indices on Deriv.
Put Option: An Options contract giving the buyer the right, but not the obligation, to sell a Synthetic Index at a specified strike price, used to profit from falling prices. Also, a Fall or Lower contract is the same as a Put Option.
Quote Currency: In CFD trading of Forexderived Synthetic Indices, Quote Currency is the second currency in a pair (e.g. USD in EUR/ USD), used to express the index’s value.
RRange Break Index: A Synthetic Index on Deriv that fluctuates between support (floor) and resistance (ceiling) levels before breaking out, tradable with CFDs and Options.
Rollover: Extending a CFD position on a Synthetic Index to the next trading period, potentially incurring swap fees unless the account is swap-free. This is normally done automatically, as CFDs do not expire, and it typically occurs at 00:00 GMT.
SSpread: The difference between the bid and ask prices in CFD trading of Synthetic Indices, representing the cost of entering a trade.
Stake: The amount a trader invests in an Options contract on a Synthetic Index, determining the potential payout or loss (for example, $10).
Step Index: A Synthetic Index on Deriv with asymmetric price steps (e.g. 80% small moves, 20% sharp moves), ideal for CFD trading.
Stop Loss: A risk management tool in CFDs and Multipliers, automatically closing a position on a Synthetic Index if losses reach a set level.
Strike Price: The predetermined price at which an Options contract on a Synthetic Index can be exercised.
Synthetic Index: A simulated market created by Deriv using a random number generator, mimicking real-world volatility (e.g. Volatility 75 Index) without external influence, tradable 24/7 via CFDs and Options.
T
Take Profit: A feature in CFDs and Multipliers that closes a position on a Synthetic Index when a specified profit level is reached.
Tick: The smallest price movement in a Synthetic Index, used to measure changes in indices like Volatility 10 or Crash 500.
U
Underlying Asset: For Synthetic Indices, there’s no real-world asset; instead, price movements are derived from an algorithm designed to replicate market behaviour.
VVolatility Index: A popular Synthetic Index on Deriv (e.g. Volatility 10, 25, 50, 75, 100, 250) with constant volatility levels, available 24/7 for CFDs and Options trading.
WWithdrawal: Transferring funds from a Deriv trading account after realising profits or closing positions on Synthetic Indices.
YYield: The potential return on an Options trade on a Synthetic Index, often expressed as a percentage of the stake if the prediction is correct. For example a $10 rise Option yielding 94% returns $9.40.
ZZero Spread: A rare condition in CFD trading where the bid and ask prices are identical, though Synthetic Indices typically have tight spreads rather than zero.
Deriv is one of the world’s largest online brokers, offering CFDs and other derivatives on Forex, Stocks & Indices, Cryptocurrencies, Commodities, and Derived Indices to millions of registered users across the globe.
From inception, Deriv’s goal was to break free of the high commissions and clunky products offered by traditional brokers. The company also aims to deliver a first-class experience to digitally inclined traders, regardless of the size of their accounts.
In a journey spanning more than 25 years, Deriv has grown to over 2.5 million customers worldwide. But its mission has remained the same: Make trading accessible to anyone, anywhere