

Part 3 Trading strategies
Chapter 6 Getting technical
There is no guarantee that analysing past market performance, whether on financial or Synthetic Indices, will lead to successfully predicting future market movements. Technical analysis tools are designed to help traders better understand market behaviour and analyse data for more informed decision-making.
Remember, trading always involves risk, and you should carefully consider this before engaging in any trades.
Technical analysis ignores the news and economic data, focusing purely on price trends and volume. It primarily involves studying chart patterns, which display the trading history and statistics of a market being analysed. You would start with a basic price chart which would show the indices trading price in the past and look for a trend or pattern that could help determine future pricing. Let’s look at a few tools for technical analysis in more detail.
As this guide focuses on Synthetic Indices, we will explore tools that are best suited to these products. However, if you have traded other markets such as Forex or Stocks, you will find that many of the tools and terms are familiar.
As mentioned earlier, Synthetic Indices are not affected by news, company earnings, or other factors that influence traditional markets.
For example, when the world went into lockdown in March 2020 due to the Covid-19 pandemic, many markets and industries—such as airlines and hospitality—suffered significant losses. However, Synthetic Indices continued to trade unaffected, and Deriv remained open 24/7.
Since Synthetic Indices are unaffected by news events, there is no need to consider fundamental analysis when analysing them.
Bar chart – Displays price data over a chosen time frame, from 1-minute bars to 1-month bars.
Candlestick chart – Similar to bar charts but visually clearer, making it a preferred choice for traders analysing price patterns over different time frames.


Line
Bar
Candlestick
Fig. 6.1. Comparison of line, bar, and candlestick charts used in market analysis
Charting packages like MT5 allow you to analyse a market, such as Volatility 10 Index, across different time frames.
Tip: In MT5, you can quickly switch chart styles by holding ALT and pressing 1, 2, 3, or 4.
Note: The same market can look very different depending on the time frame you choose. The same applies to indicators—for example, a 20-period moving average:
• On a 1-minute chart, it represents 20 minutes.
• On a 1-day chart, it represents 20 days.
• On a weekly chart, it represents 20 weeks.
Here, we see the top bar of MT5, displaying time frames ranging from 1-minute (M1) to monthly (MN) bars.
Trend following
The old saying “let the trend be your friend” applies here. With trend following, we can profit from both uptrends and downtrends.
Markets generally move in three states:
1. Uptrend – Higher highs and higher lows
2. Downtrend – Lower highs and lower lows
3. Sideways (range-bound) – Price moves within a defined range
Regardless of whether you’re trading Volatility 10 or Volatility 250, you will see similar patterns repeat over time. As you gain experience, you’ll learn to identify these trends and know how to react accordingly.
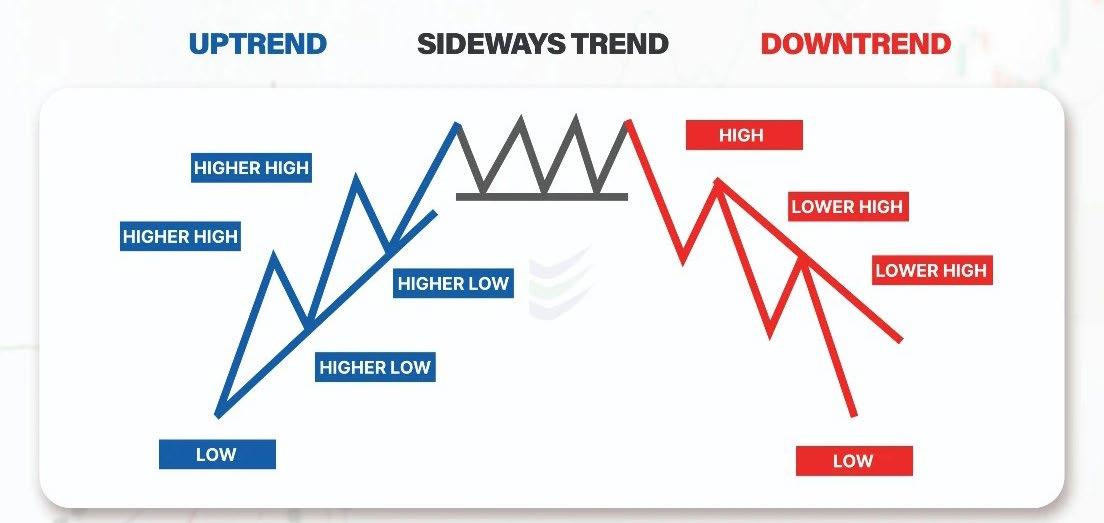
Fig. 6.2. MT5 top bar displaying time frames from 1-minute (M1) to monthly (MN) charts
Fig. 6.3. Uptrend, sideways trend, and downtrend patterns of market price movement
Once you identify the market trend, you can set your trading strategy:
• In an uptrend, you want to be long (buy) a CFD or buy Call Options to benefit from rising prices.
• In a sideways range, Options such as No Touch can be effective. You can also trade CFDs long and short within the range:
• Go short at the top of the range (resistance). Set a stop loss just above resistance.
• Go long at the bottom of the range (support). Set a stop loss just below support.
At some point, the price is likely to break out of the range, so having stop loss protection is essential to limit risk.
• In a downtrend, you want to go short (sell) a CFD or buy Put Options to profit from falling prices.
Note: I have written an ebook specifically on chart patterns, which is available from Deriv at no charge.
Since this ebook covers chart patterns in detail, I will not go in-depth on them here or even in Chapter 8, where I return to the topic of chart patterns. You can refer to that ebook for a comprehensive guide.
Download here: Chart Patterns

Chapter 7 Technical indicators
I will focus on a few basic indicators in this chapter, as I prefer to keep trading simple and avoid overcomplicating analysis. Using too many indicators can lead to confusion, often referred to as “paralysis by analysis.”
If you’re constantly searching for the “perfect” trade setup, you may never take action— because there is no such thing. Instead, the goal is to identify trades with a good probability of success and execute them with a solid risk management plan.
Moving averages
Moving averages are used to smooth out price data and identify trends. Common types include Simple Moving Average (SMA) and Exponential Moving Average (EMA). There are also more advanced moving averages, such as Variable Moving Average (VIDYA), which adjusts dynamically based on market volatility. I have used this in my trading, though it requires a deeper understanding.
Using a technical system like the moving average helps reduce the impact of emotions on trading decisions. Instead of trading based on what you believe should happen, this approach ensures your trades are grounded in actual market data. A moving average can also prevent you from making foolish mistakes, such as trading against a trend.
Moving averages work best when prices are “moving” either up or down. In a sideways range, the moving average will go flat and give out many false signals also known as “chop”.
A moving average crossover system is a popular trading strategy used to identify potential buy and sell signals by analyzing the interaction of two moving averages. Here’s a basic outline of how this system works:
Components:
1. Short-term Moving Average (SMA or EMA): A faster-moving average that reacts quickly to price changes. Example: 6-minute moving average.
2. Long-term Moving Average (SMA or EMA): A slower-moving average that smooths out price fluctuations. Example: 21-minute moving average.
Signals:
1. Buy signal: When the short-term moving average crosses above the long-term moving average, it suggests a potential upward trend and a buying opportunity.
2. Sell signal: When the short-term moving average crosses below the long-term moving average, it indicates a potential downward trend and a selling opportunity.
These crossovers help traders identify trend reversals and align their trades with the market direction.
You can also experiment and test different moving average combinations to find what works best for your trading style. The time frames can be adjusted to suit different market conditions. For example, a 21/6-day crossover system can be modified into a 21/6-hour crossover system simply by changing the chart time frame.
Example of a 21/6 crossover system on Volatility 75 (1s)
This example uses a 21/6 moving average crossover on a 1-minute chart, where each candle represents one minute. I have marked the buy and sell points on the chart. Not every trade makes money, but a successful trade offsets smaller false crosses, keeping us ahead.
The system is always in the market, switching from long to short and short to long—a method known as Stop and Reverse (SAR).
You can test this system with a demo account and log your results to see how it performs. To start, identify the first crossover, which determines the first trade—either a buy or a sell. In my case, the first trade marked on the chart was a sell.
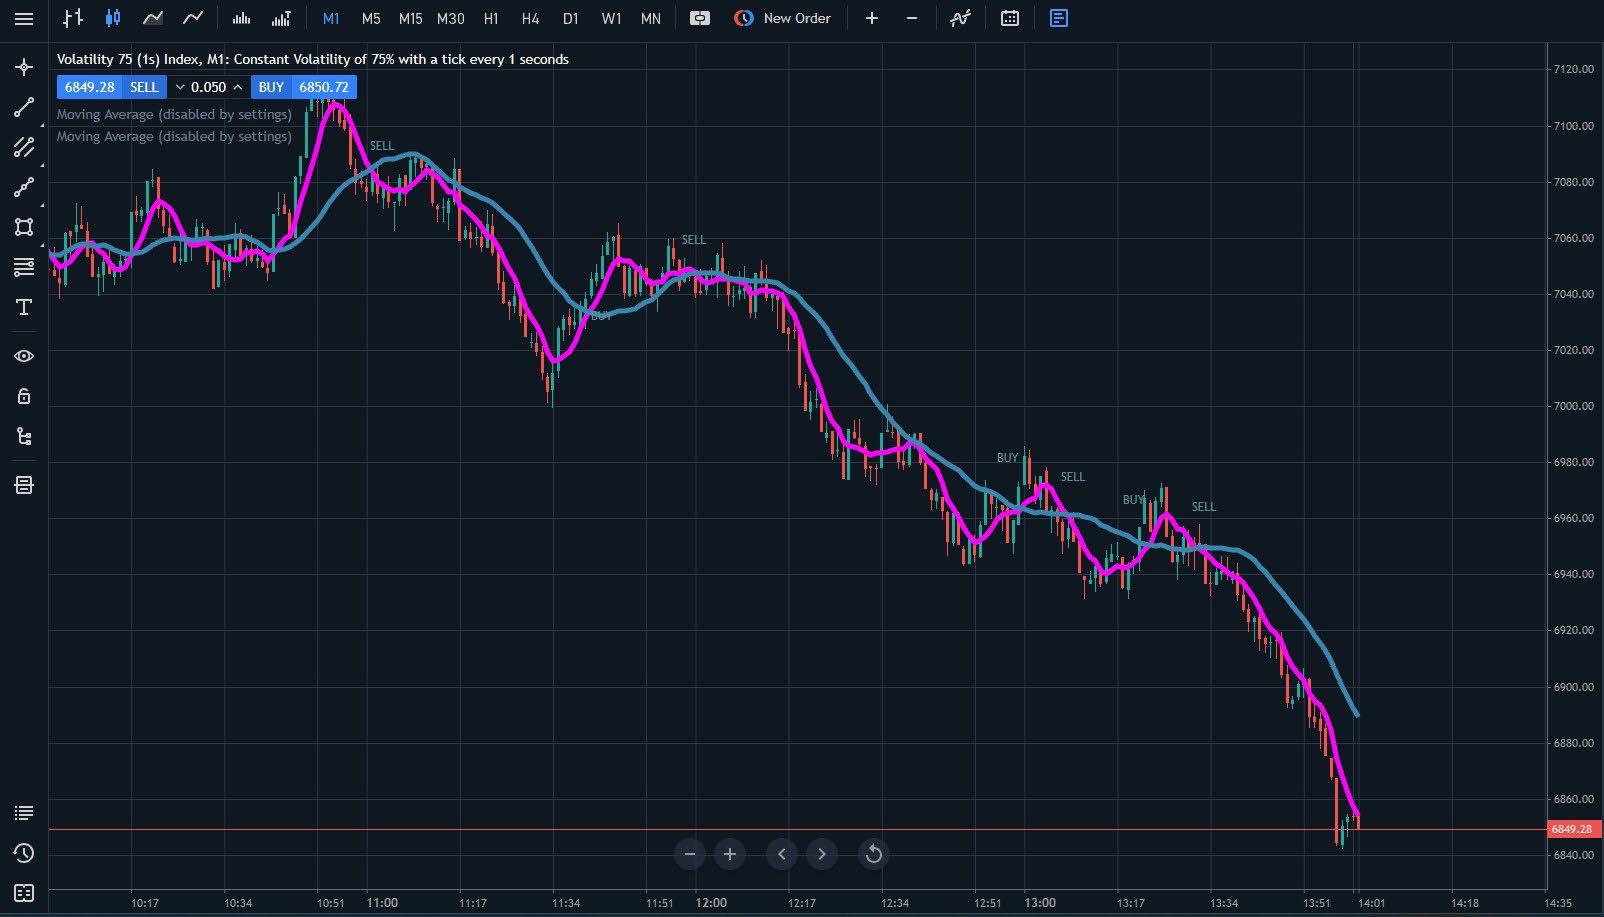
The current open trade is a SELL (short) position. You would remain short until the next crossover occurs, at which point you would close the short trade and open a new long trade.
EMA (exponential moving average) puts more weight on the most recent data, making it more responsive to price changes, whereas SMA (simple moving average) gives equal weight to all data points in the selected period, making it smoother but slower to react to price movements.
Choosing between EMA and SMA depends on your trading style—EMA is better for fastmoving markets, while SMA is useful for identifying long-term trends.
Trendlines in trading
You can also add trendlines to confirm signals from the moving average.
A trendline is a straight line drawn on a chart to connect two or more price points, illustrating the direction of the price trend over time. It helps traders identify potential buying and selling opportunities based on an asset’s trend.
They can be applied to charts of varying timeframes and are used in technical analysis to identify potential buying and selling
opportunities based on an asset’s current trend. Trendlines are commonly used with chart patterns to confirm or validate the pattern and to identify key support and resistance levels.
In Deriv Trader, trendlines can be found under Drawing Tools.
In MT5, double-click the trendline tool to open a drop-down menu with variations. You can also use hotkeys for quick access: ALT + L draws a diagonal trendline and ALT + H draws a horizontal trendline. These shortcuts make it easier to customise and adjust your charts for better trend analysis.
Fig. 7.1. 21/6 moving average crossover system on Volatility 75 (1s) using a 1-minute chart, showing buy and sell signals
Trendline trading strategy
This strategy can be applied to all Volatility Indices and helps traders identify trend direction and potential entry points.
Steps to use trendlines in a trading strategy:
1. Identify the trend – Look for higher highs and higher lows to confirm an uptrend or lower highs and lower lows for a downtrend.
2. Draw the trendline – Connect the low points for an upward trendline and the high points for a downward trendline.
3. Use trendline breaks for trading signals – A break below an upward trendline or above a downward trendline may signal a potential trend reversal.
4. Confirm the breakout – Use additional technical indicators (e.g., RSI, moving averages) or chart patterns to confirm a valid breakout.
5. Determine entry and exit points – Enter a long position above an upward trendline or a short position below a downward trendline, setting a stop-loss order below or above the trendline.
6. Use risk management – Apply stop-loss orders and position sizing to limit potential losses.
7. Backtest your strategy – Test the strategy using historical data to refine and improve it before applying it to live trading.
Using trendlines effectively can help traders spot trade opportunities while minimising risk.
Price channels – Donchian Channels breakout trading system
Richard Donchian, an American commodities and futures trader, pioneered managed futures trading in 1949 and developed price channel trading systems.
Donchian Channels are a technical analysis tool used to identify price volatility and potential breakouts. They consist of three lines:
1. Upper band – The highest price over a set period.
2. Middle band – The average of the highest and lowest prices over the period.
3. Lower band – The lowest price over the same period.
These channels help traders spot breakout opportunities, determine support and resistance levels, and assess market volatility.
Fig. 7.2. Trendline tool in MT5
Using Donchian Channels in trading – The 4-week rule
The 4-week rule was devised by Richard Donchian and is a simple yet effective breakout trading strategy.
The rule:
1. Buy when a new 4-week high is reached – Hold the position.
2. Sell when a new 4-week low is hit – Close the long trade and go short.
Most trading platforms allow you to add Donchian Channels:
• In TradingView, you can find them under Indicators.
• In Deriv Charts (Deriv Trader), they are under Indicators → Volatility.
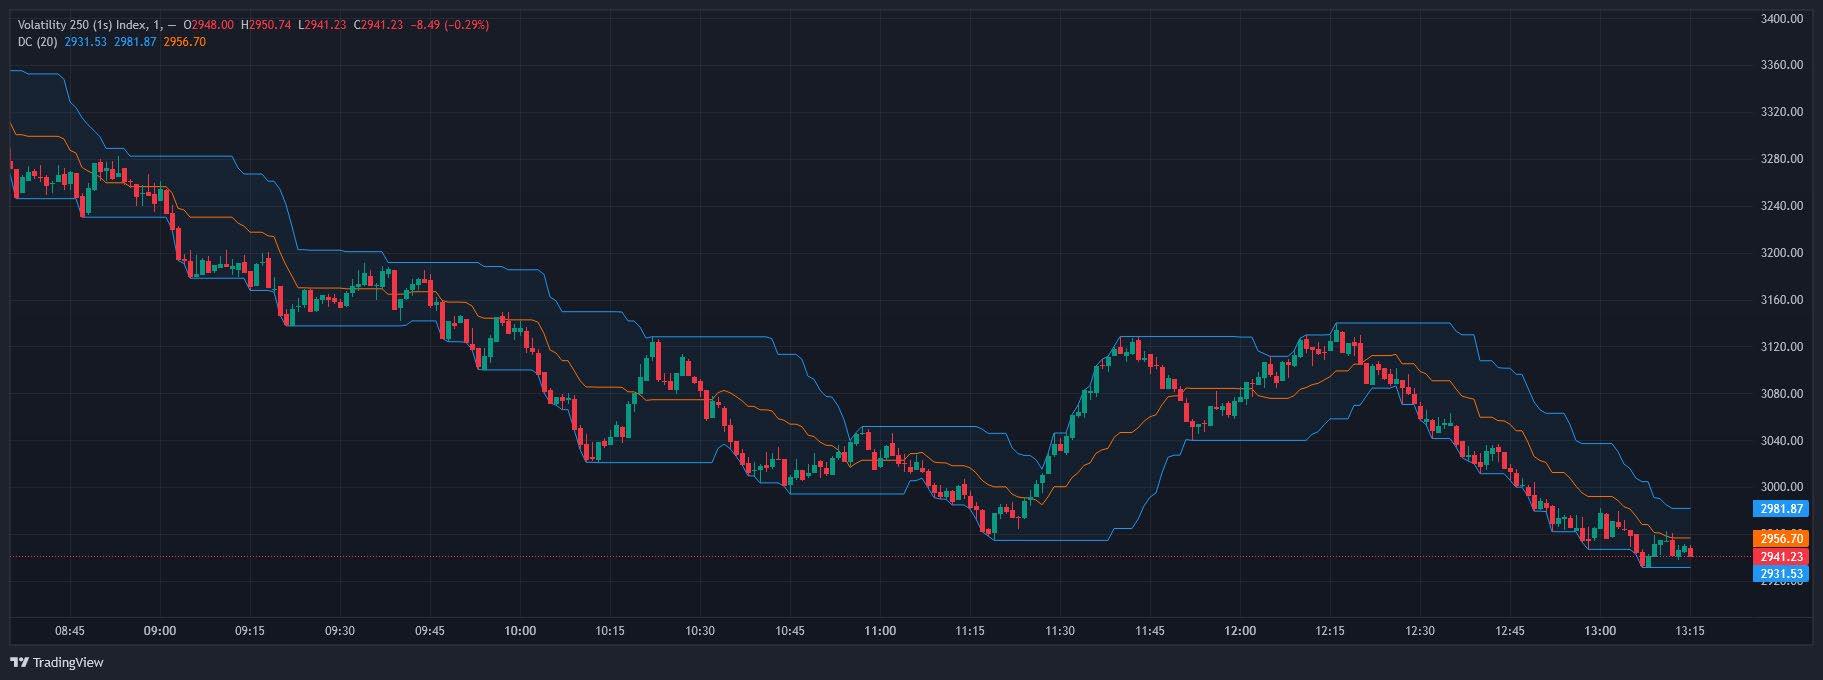
This example uses the standard 20-period setup on a 1-minute chart. The current signal is short, indicating a potential downtrend.
1. Identify trends – A rising upper band indicates an uptrend, while a falling lower band signals a downtrend. Use a 20-period setting for the channels, though you can experiment with shorter (10-period) or longer (30-period) settings.
2. Spot breakouts – When the price crosses above the upper band, it signals a bullish breakout; when it crosses below the lower band, it signals a bearish breakout.
3. Set entry and exit points –
• Enter long when the price breaks above the upper band.
• Enter short when the price breaks below the lower band.
• The middle band can serve as an early warning sign for potential reversals.
4. Risk management – Place stop-loss orders just outside the bands to limit potential losses.
5. Monitor and adjust – Adjust stop-loss and take-profit levels as the trade progresses to lock in profits or minimize risk.
This system can be applied to a variety of markets. I first used it on commodities over 30 years ago, but since then, I have successfully used it on Forex, Stocks, Synthetic Indices, and even Cryptocurrencies.
A well-known group of traders called the “Turtle Traders” used a similar channel trading system combined with position sizing rules. Their approach became one of the most famous trend-following strategies in trading history.
For more details, you can read about the Turtle Trading System here: Investopedia - Turtle Trading System.
The original system was designed for daily charts, making it a longer-term strategy. However, shorter time frames have also been used successfully.
Fig. 7.3. Donchian Channels applied to Volatility 250 (1s) Index
Example: Using Donchian Channels on a 1-minute chart for Digital Options
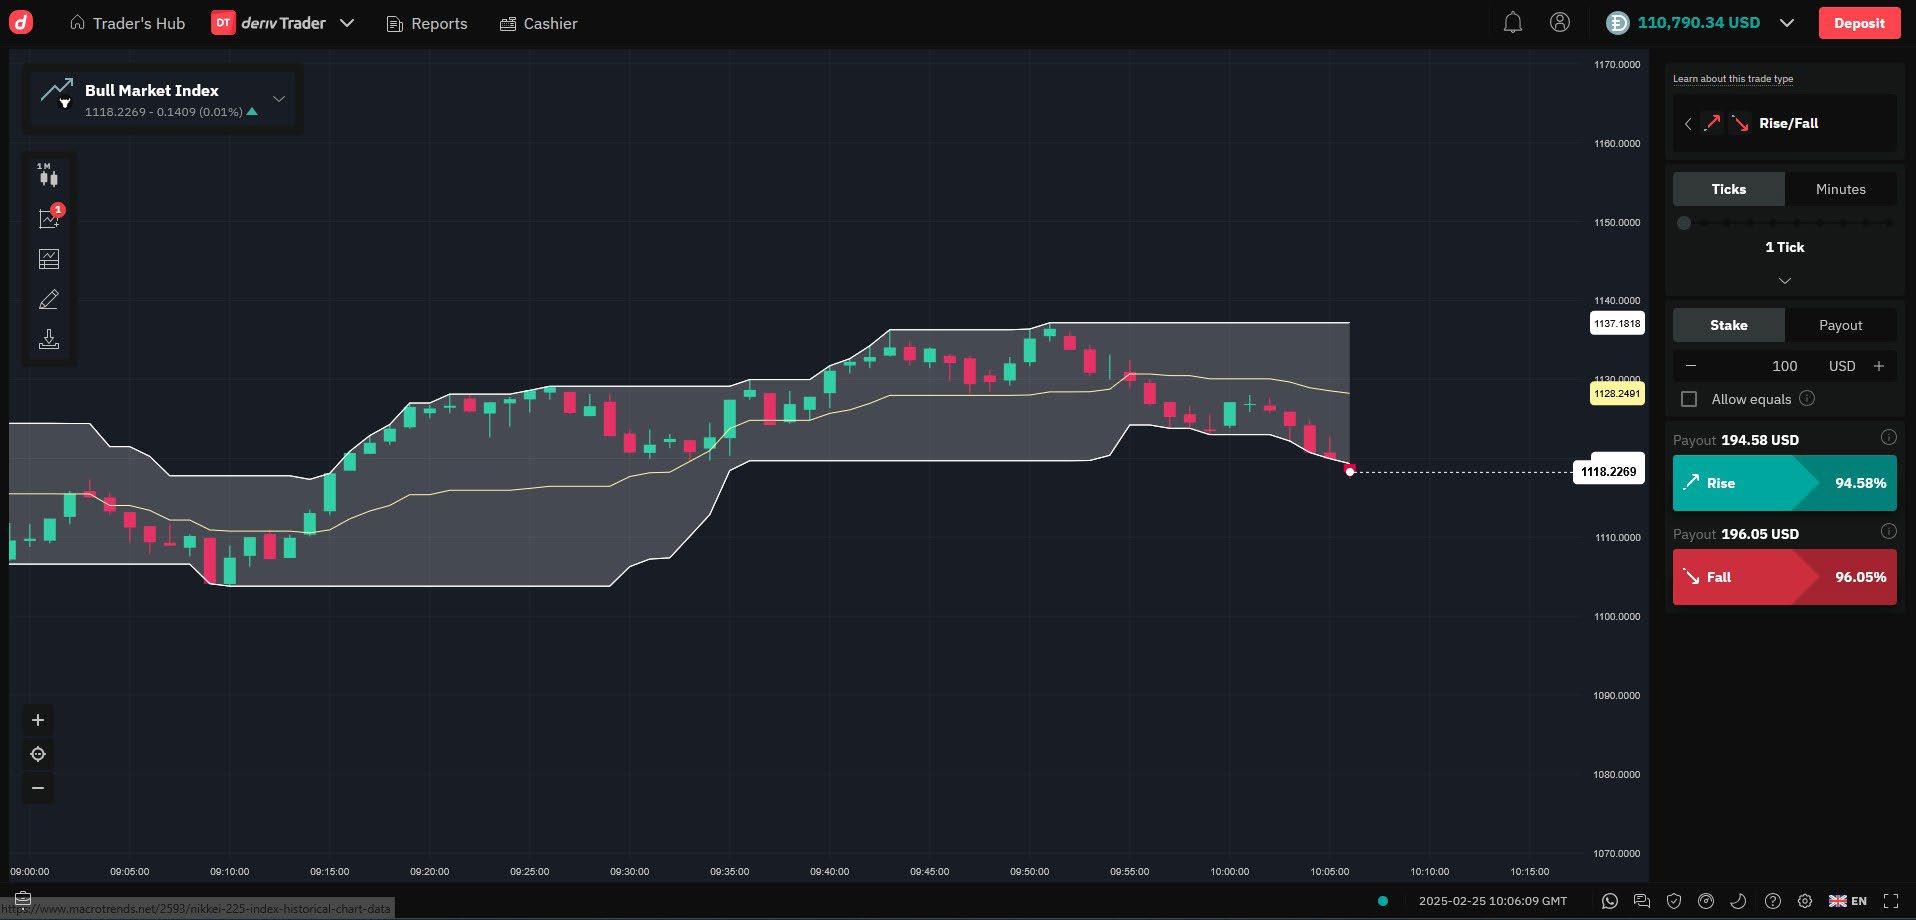
In this example, Donchian Channels are applied to a 1-minute chart to identify potential trade setups for Digital Options.
The price is hitting the lower channel, indicating a possible downward breakout.
The correct trade in this scenario would be a Fall Option, anticipating that the price will continue to decline.
This setup demonstrates how Donchian Channels can be used to identify breakout opportunities in short-term trading.
Relative Strength Index (RSI)
The relative strength index (RSI) indicator measures a share’s performance against itself. It is often used to identify buying opportunities during market dips and selling opportunities during market rallies. The RSI value always falls between 0 and 100. The indicator was developed and introduced in 1978 by an American engineer, J. Welles Wilder, a real estate developer and a well-known technical analyst. It is still widely in use.
Fig. 7.4. Donchian Channels on a 1-minute chart in Deriv Trader, suggesting a Fall Option as price hits the lower channel
The chart below shows an example of Volatility 250, where we can apply this tool to inform trading decisions. A low number (30 or below) indicates a more oversold market, while a high value (70 or above) indicates a more overbought market. The upper and lower horizontal lines on the graph are set at 70 and 30, respectively—levels at which markets are often regarded as overbought or oversold.
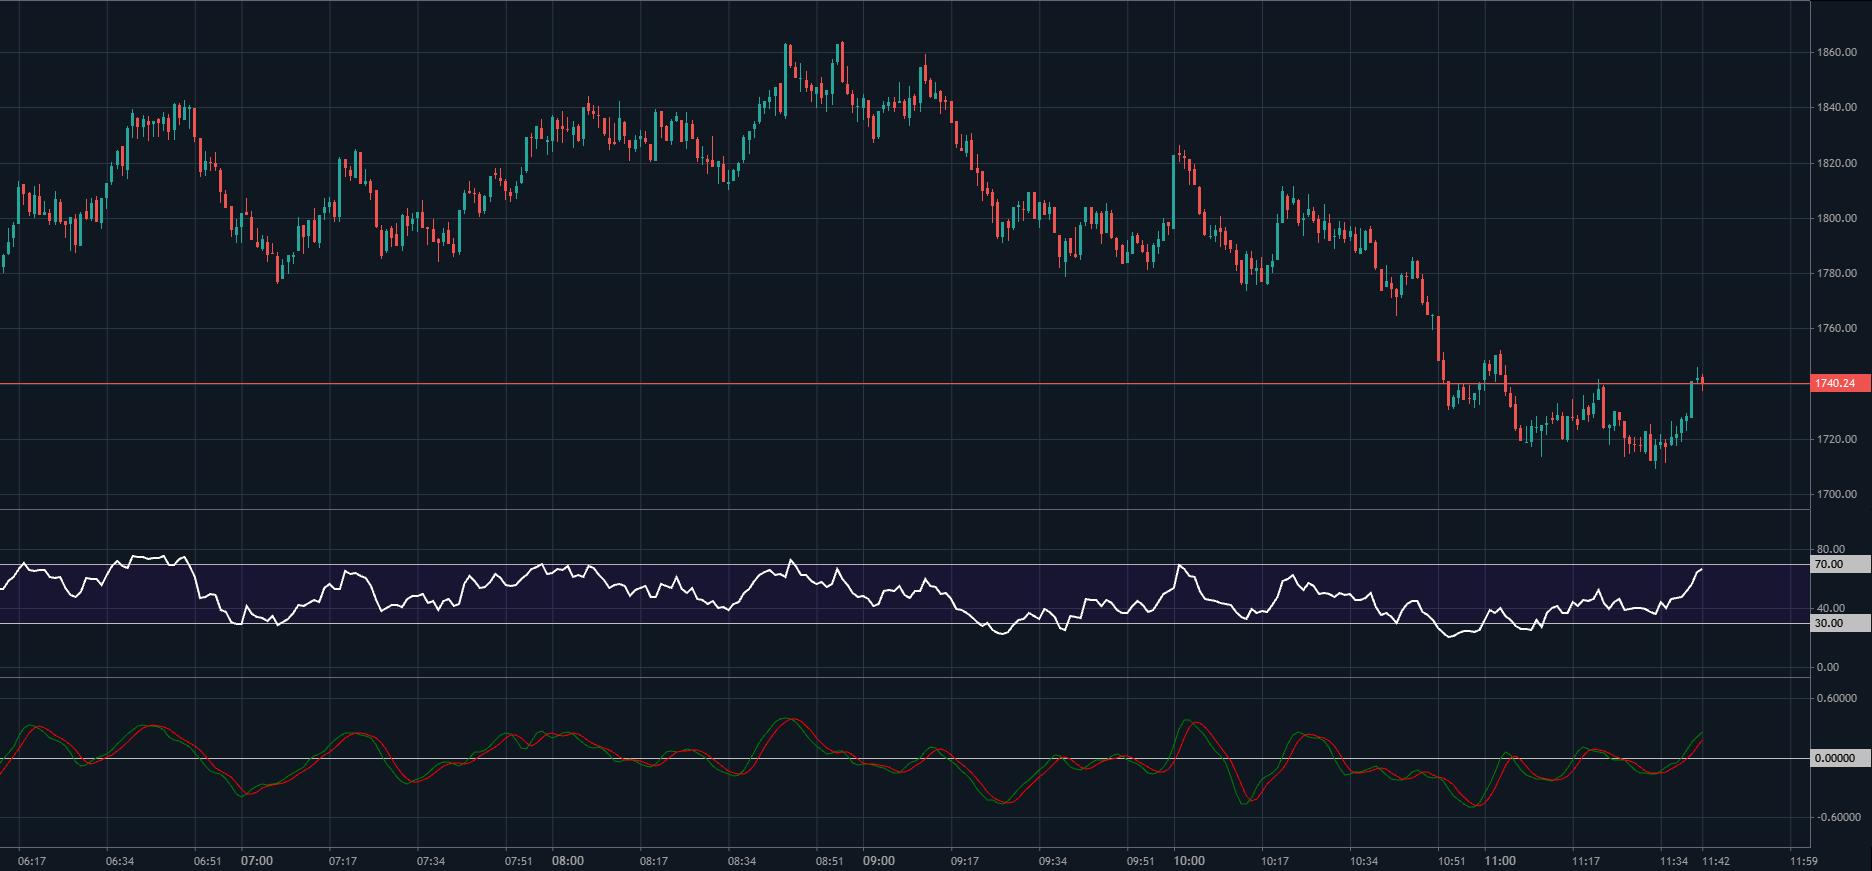
When the RSI moves to 70, it’s a good time to consider short trades or closely monitor a long trade, as a price reversal may be approaching. In the chart, the white RSI line is at 70 and looks like we are about to move lower.
When the RSI reaches 30, it’s a good time to consider long trades.
For Digital Options, we would look to buy (up – call – rise) Options when the RSI is at 30. If it is at 70 or above, it’s time for sell (down – put –fall) Options.
The RSI is widely followed and can be added to trading platforms like MT5, TradingView, and cTrader. You can also test other RSI levels, such as 20 and 80.
Relative Vigor Index
The relative vigor index (RVI) is a lesser-known oscillator worth considering. It’s the bottom indicator in Figure 7.5.
RVI is a momentum indicator used in technical analysis to measure trend strength by comparing a security’s closing price to its trading range.
Using
RVI in trading
1. Identify overbought/oversold conditions: The RVI ranges between -0.5 and 0.5. Values above 0.5 indicate overbought conditions, while values below -0.5 indicate oversold conditions.
2. Look for crossovers: When the short-term moving average (red line) crosses above the long-term moving average (green line), it signals a potential bullish trend, and vice versa for a bearish trend.
3. Watch for divergences: Divergences between the RVI and price movements can signal potential trend reversals. For example, if the price is making new highs but the RVI is making lower highs, it may indicate a weakening trend.
4. Combine with other indicators: To reduce false signals, use the RVI alongside other technical indicators like the stochastic oscillator or relative strength index (RSI).
Fig. 7.5. Volatility 250 price movements with the RSI indicator (white) and RVI indicator (red)
Moving average convergence divergence (MACD)
The moving average convergence divergence (MACD) is a popular technical analysis tool used to identify potential buy and sell signals. It is a trend-following momentum indicator that shows the relationship between two moving averages of a security’s price.
MACD trading system breakdown:
• MACD line: Calculated by subtracting the 26-period exponential moving average (EMA) from the 12-period EMA.
• Signal line: The 9-period EMA of the MACD line, acting as a trigger for buy and sell signals.
• Histogram: Represents the difference between the MACD line and the signal line, helping to visualise the momentum of the price movement.
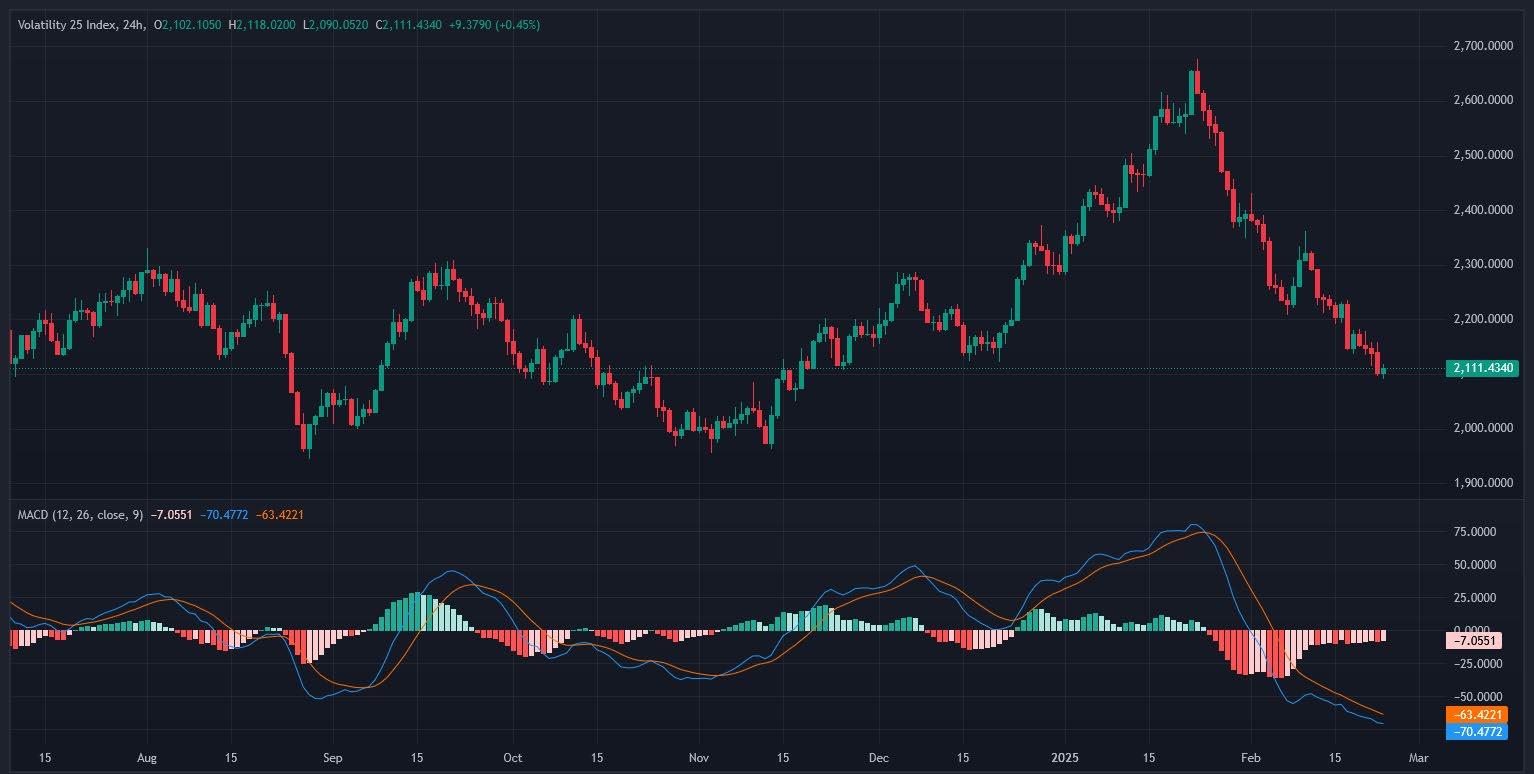
Here, I am using TradingView with settings of 12, 26, and 9, along with a histogram.
Using MACD in trading
Buy signal
• MACD line crosses above signal line: When the MACD line crosses above the signal line, it is considered a bullish signal, indicating that it may be a good time to buy.
• Histogram turns positive: When the histogram moves from negative to positive, it can also be seen as a buy signal. In the chart example, dark green is positive.
Sell signal
• MACD line crosses below signal line: When the MACD line crosses below the signal line, it is considered a bearish signal, indicating that it may be a good time to sell.
• Histogram turns negative: When the histogram moves from positive to negative, it can also be seen as a sell signal. Dark red is negative and good for potential short positions.
All major software packages like MT5, cTrader, and TradingView allow you to add MACD, and you can also try different parameters, not just 12-26-9.
Remember: The great advantage of trading CFDs or Options with Deriv is that we can profit from up or down moves and switch between the two. The example of the Volatility 25 Index had some great long and short trading opportunities, with the MACD giving some great signals.
Fig. 7.6. Volatility 25 Index chart with MACD showing trend momentum and trade signals
Chapter 8 Patterns
Chart patterns
Technical analysts look for specific patterns in price charts, such as head and shoulders, double tops and bottoms, triangles, and flags. These patterns can indicate potential future price movements.
I have written a guide, 10 Chart Patterns Every Pro Trader Should Know, available for free from Deriv, where I explore chart patterns in more depth. These patterns apply to Synthetic Indices and other financial markets.
Download your copy here
Example of chart patterns
You can learn more about chart patterns in the ebook just mention, so I will keep this part short. As with everything in trading, nothing works 100% of the time. The key is money management and setting stop losses, as previously explained. We can also use orders to enter, take profits, and place stop losses in case the pattern fails.
Here, we see a popular pattern called a triangle and its three variations. We can profit from long trades on an upside breakout and short trades on a downside breakout.
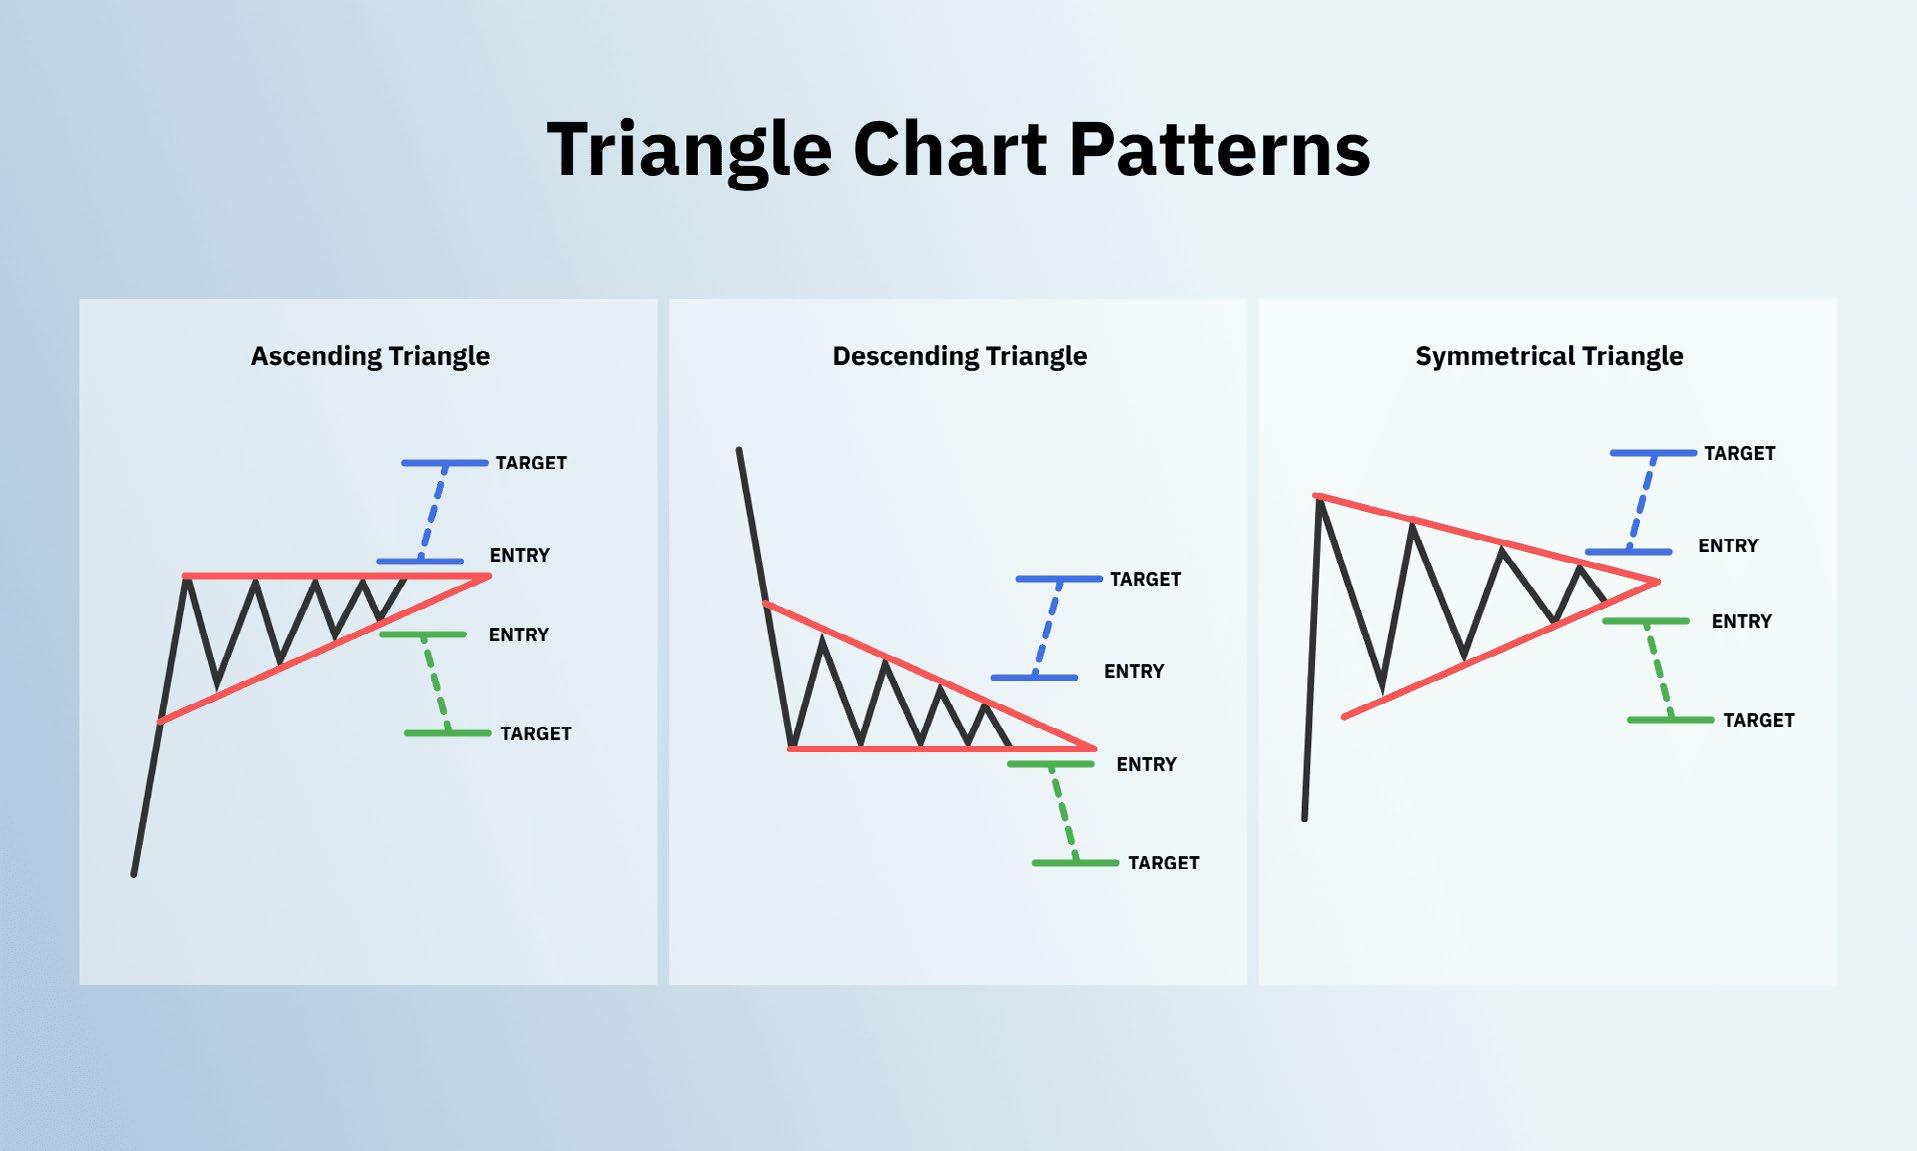
patterns: ascending, descending, and symmetrical, showing potential breakout targets
As well as chart patterns, we also have candlestick formations known as Japanese candlesticks. I have previously shown candlestick charts, but we can also analyse candlestick patterns. By condensing price data into an easy-to-read format, candlestick charts help traders visualise the battle between buyers and sellers in a market.
When used properly, candlesticks can provide powerful insights into market psychology and help identify potential trading opportunities. As with all trading tools, they serve as a guide, not a guarantee.
Fig. 8.1. Triangle chart
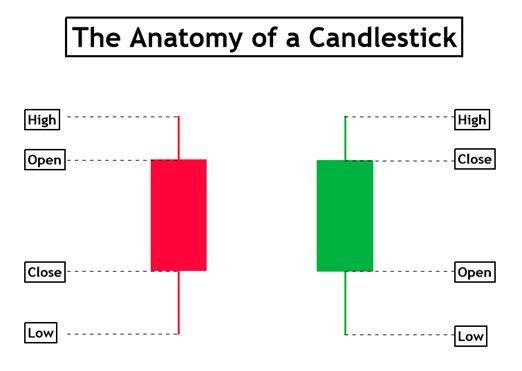
The anatomy of a candlestick
Candlesticks have three main components:
The body – represents the price range between the opening and closing prices.
The wicks or shadows – show the highest and lowest prices reached.
The colour – indicates sentiment: bullish (positive, often green or white) or bearish (negative, often red or black).
A long body suggests stronger conviction, while long wicks indicate rejection by either buyers or sellers. The relationship between the body, wick, and colour provides insights into market supply and demand dynamics.
Candlestick patterns
There are three major candlestick pattern types:
• Reversal patterns – indicate potential trend reversals and shifts in momentum.
• Indecisiveness patterns – show a struggle between buyers and sellers with no clear control.
• Continuation patterns – suggest a pause or consolidation within an overall trend.
Within these categories, there are dozens of uniquely named candlestick patterns, each offering its own nuanced interpretation and potential trading signal.
You can find more information on candlestick chart patterns online and at Deriv Academy2.
We are also seeing new developments in software, such as MT5, which can now spot and label common candlestick patterns. Here are 27 common patterns:
1. Doji
2. Dragonfly Doji 3. Gravestone Doji
4. Bullish Spinning Top 5. Bearish Spinning Top 6. Marubozu Up 7. Marubozu Down 8. Hammer
Hanging Man 10. Inverted Hammer
Shooting Star
Bullish Engulfing 13. Bearish Engulfing
Tweezer Top
Tweezer Bottom
Three White Soldiers 17. Three Black Crows 18. Three Inside Up
Three Inside Down
Morning Star
Evening Star
Bullish Harami 23. Bearish Harami 24. Bullish Three-Line Strike 25. Bearish Three-Line Strike 26. Three Outside Up 27. Three Outside Down
Fig. 8.2. The anatomy of a candlestick: key price levels for bullish and bearish candles
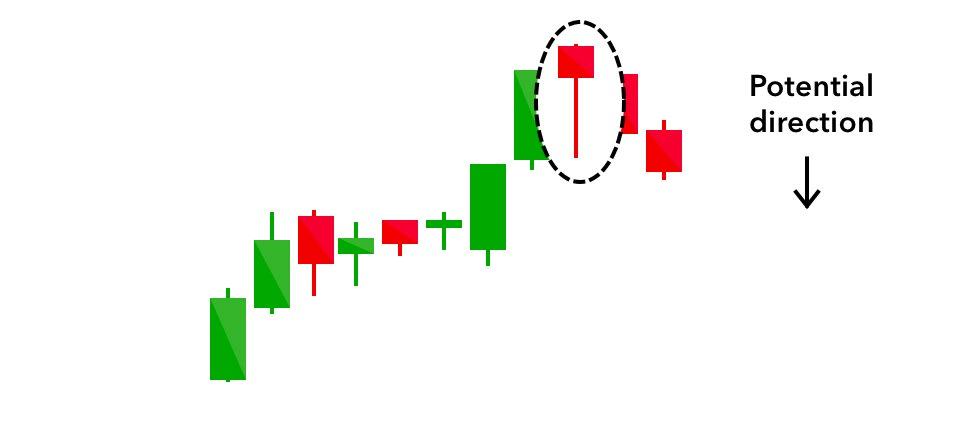
Example of a candlestick pattern
Hanging Man: This pattern consists of a small-bodied candle with a long lower shadow. It suggests potential weakness in an uptrend, indicating a possible trend reversal.
Summary
I have kept this brief as another ebook covers it in more detail. More information and examples of Japanese candlestick patterns can be found online, including at Deriv Academy3
No pattern works 100% of the time—some traders find them useful, while others see little or no value in them. It’s best to test and use them as part of a trading system rather than relying solely on chart patterns.
With the rise of pattern recognition software and websites, spotting patterns is becoming much easier.
Fig. 8.3. Bearish reversal signal: a hanging man pattern indicating potential downward movement
Chapter 9 Swing trading and scalping
Swing trading
Swing trading systems aim to capture short to medium-term price movements by holding trades for hours, days, or weeks. Oscillators and momentum indicators can help identify entry and exit points.
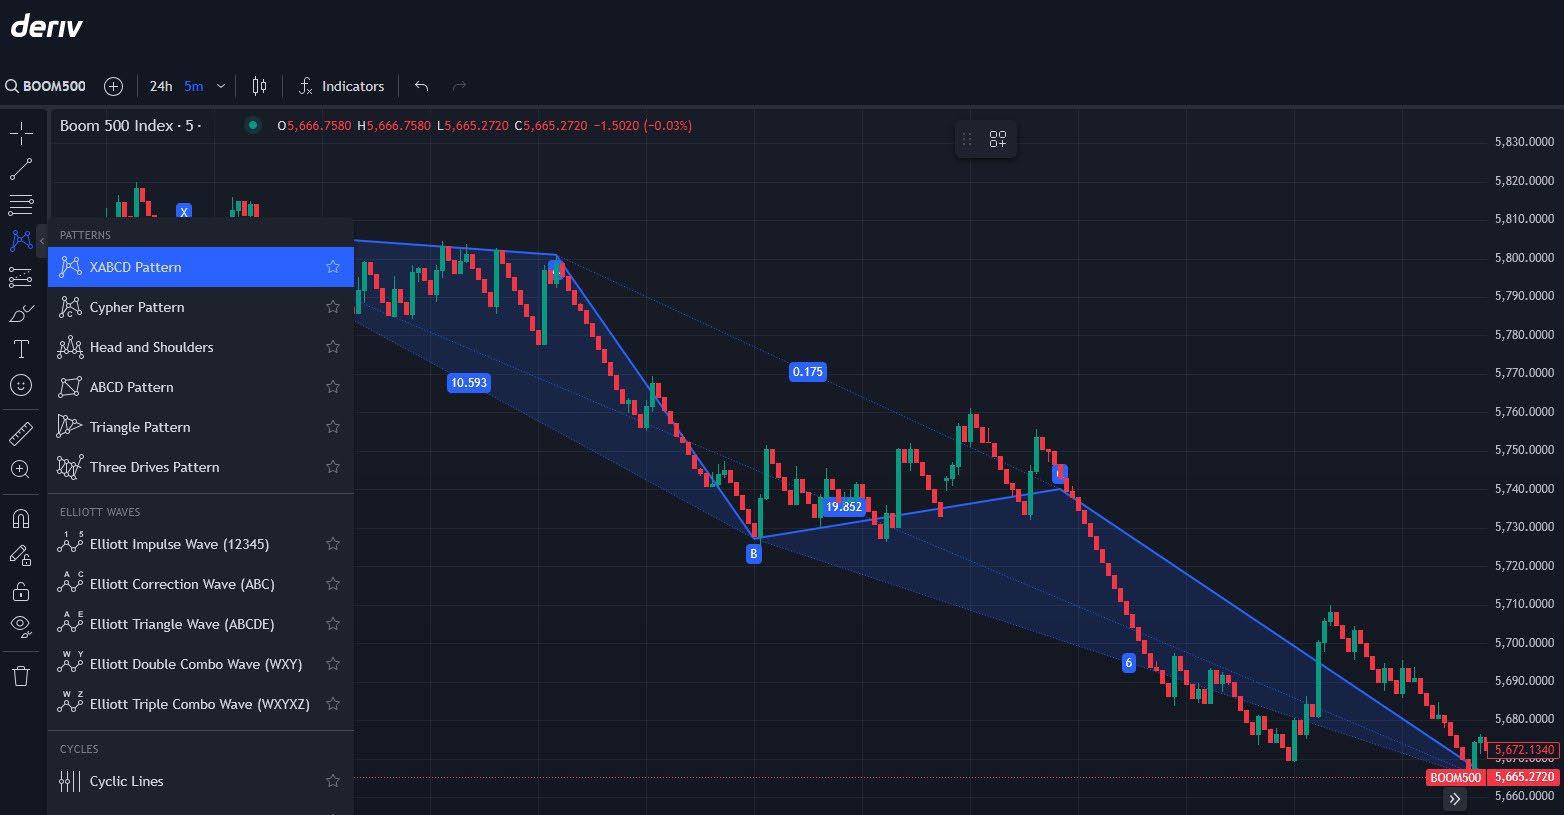
Here, we see TradingView with various tools for swing traders. I am using the Deriv Boom 500 Index with 5-minute bars. This is a fairly volatile index with frequent direction changes, making it a good choice for swing trading.
Swing trading Deriv’s Synthetic Indices can be a great way to capitalise on short- to mediumterm price movements, especially since these indices mimic real-world market volatility while running 24/7.
Below, I’ll outline a simple, beginner-friendly swing trading system tailored for Deriv’s Synthetic Indices, such as the Volatility 10, 25, 50, 75, or 100 Indices. This system uses basic technical analysis tools available on platforms like Deriv MT5 or Deriv Trader, keeping it straightforward and actionable.
There’s no need for programming skills, as we’ll use standard built-in indicators.
Simple swing trading system for Deriv Synthetic Indices
Overview
This system uses two widely used indicators— moving averages and the relative strength
index (RSI), which I have previously covered— to identify trends and potential reversal points.
Tools needed
• Platform: Deriv MT5 (recommended for its charting capabilities) or Deriv X –TradingView.
• Timeframe: 1-hour (H1) or 4-hour (H4) charts—ideal for swing trading, balancing frequency and clarity. Shorter timeframes can be used but may increase trading “noise” and lead to more false signals.
Indicators
• 50-period simple moving average (SMA): Identifies the overall trend.
• 20-period simple moving average (SMA): Tracks shorter-term price direction.
• RSI (14-period): Gauges overbought and oversold conditions.
Fig. 9.1. Swing trading on Deriv Boom 500 Index using pattern recognition tools in TradingView
Setup instructions
Open your chart
• Log into Deriv MT5, select a Synthetic Index (e.g., Volatility 10 Index), and set the timeframe to H1 or H4.
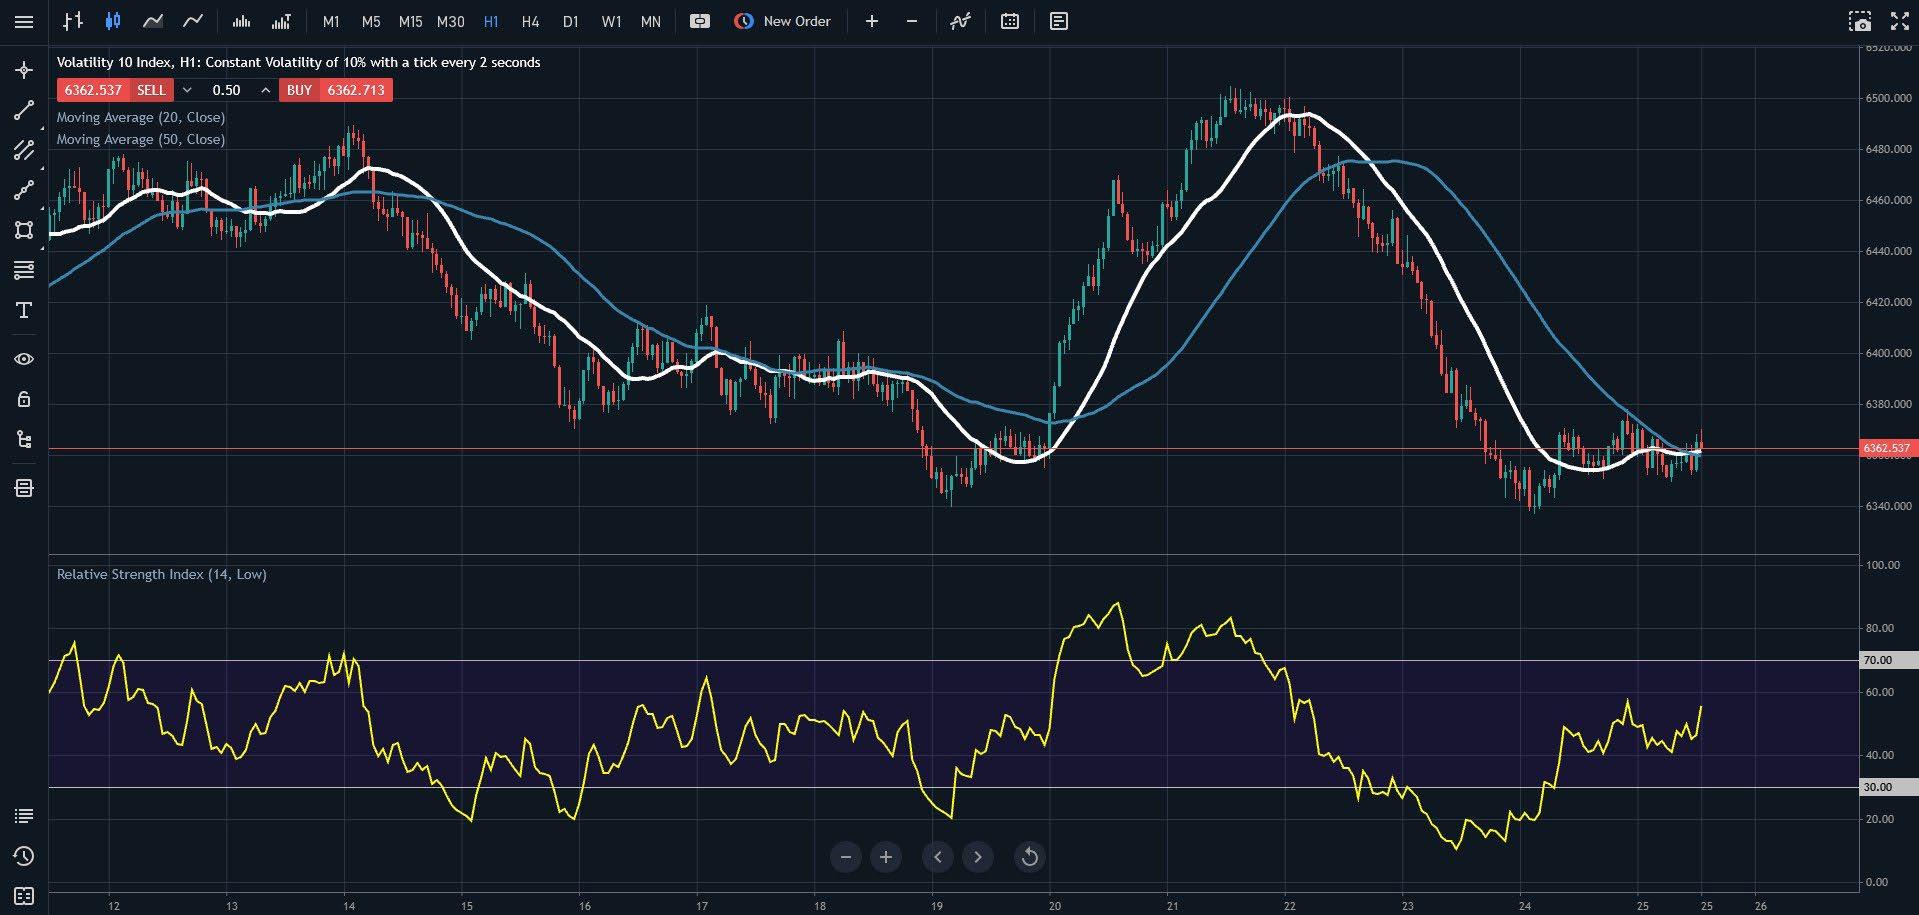
• In my chart example, I am using H1 and Volatility 10 (2s) instead of Volatility 10 (1s). This slows down the trading action, which is helpful when you’re just starting.
Add indicators
• Add the 50 SMA and 20 SMA to your chart—these will appear as lines tracking the average price over 50 and 20 periods, respectively.
• Add the RSI (14) indicator, typically displayed below the price chart, with levels set at 70 (overbought) and 30 (oversold).
Trading rules
Entry
Buy signal:
• The 20 SMA crosses above the 50 SMA, indicating a bullish trend.
• RSI is above 50 but below 70, showing upward momentum without being overbought.
• Wait for a pullback to the 20 SMA (price dips toward it but doesn’t break below significantly) to enter the trade.
Sell signal:
• The 20 SMA crosses below the 50 SMA, indicating a bearish trend.
• RSI is below 50 but above 30, showing downward momentum without being oversold.
• Wait for a pullback to the 20 SMA (price rises toward it but doesn’t break above significantly) to enter.
Exit
Take profit:
• Aim for a target based on recent swing highs (for buys) or swing lows (for sells). On Synthetic Indices, these can be roughly 1-2% moves, depending on volatility (e.g., Volatility 100 moves faster than Volatility 10).
• Alternatively, exit when the 20 SMA crosses back over the 50 SMA in the opposite direction.
Stop loss:
• Place below the recent swing low (for buys) or above the recent swing high (for sells).
• Typically set 0.5-1% away from your entry, adjusted for the index’s volatility.
Fig. 9.2. Trading setup for swing trading Deriv Synthetic Indices using moving averages and RSI
Risk management
Risk no more than 1–2% of your account per trade. Synthetic Indices can be volatile, so calculate your position size accordingly (Deriv MT5 has a built-in calculator).
Start with a demo account to test the system and adjust based on the specific index’s behaviour. Begin with lower volatility indices, such as the Volatility 10 Index, before trading more volatile ones.
Summary of this system
• Trend clarity: The moving average crossover filters out noise and confirms the trend, which is crucial since Synthetic Indices lack fundamental drivers.
• Pullback entry: Waiting for price to retest the 20 SMA helps avoid chasing moves, a common pitfall in volatile markets.
• RSI filter: Ensures you’re trading with momentum but not entering when the market is exhausted.
• Choose the right index: Start with a lower-volatility index like Volatility 10 or 25 for more predictable swings. Higher-volatility indices like Volatility 100 can work but require tighter stops and faster decisions.
• Practise first: Use Deriv’s demo account to get comfortable with the system and the index’s movement patterns.
• Be patient: Swing trading isn’t about constant action—wait for clear setups, which might take hours or days depending on the timeframe. You can trade other markets while waiting.
• Avoid overtrading: Synthetic Indices run 24/7, but stick to your plan and don’t force trades outside your rules.
This system keeps things simple, leveraging trends and pullbacks without overcomplicating the process. Test it on a demo account, adjust it to fit your style, start small, and build up.
Swing trading system on a Deriv Drift Switch Index
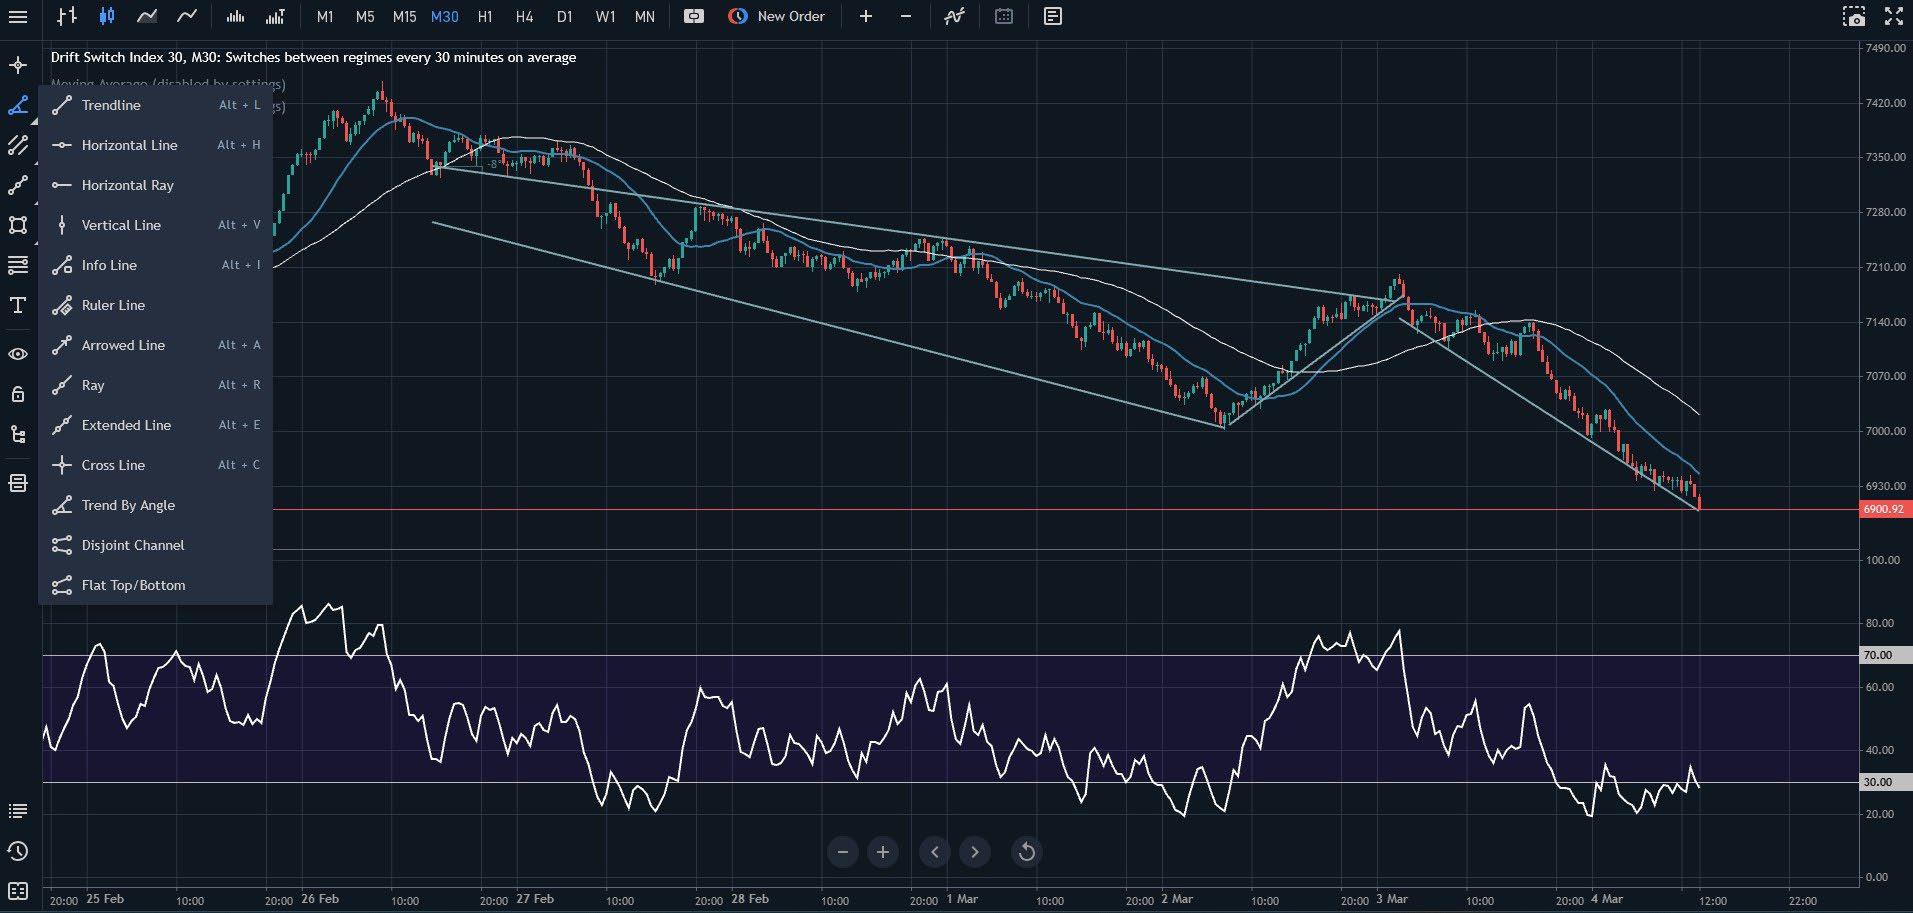
I have used the same rules as previously mentioned, with one change—using the M30 (30-minute) timeframe on the DSI 30 Index, which typically switches every 30 minutes.
This highlights the advantage of using charting platforms like MT5, where you can easily tweak a system and test small adjustments.
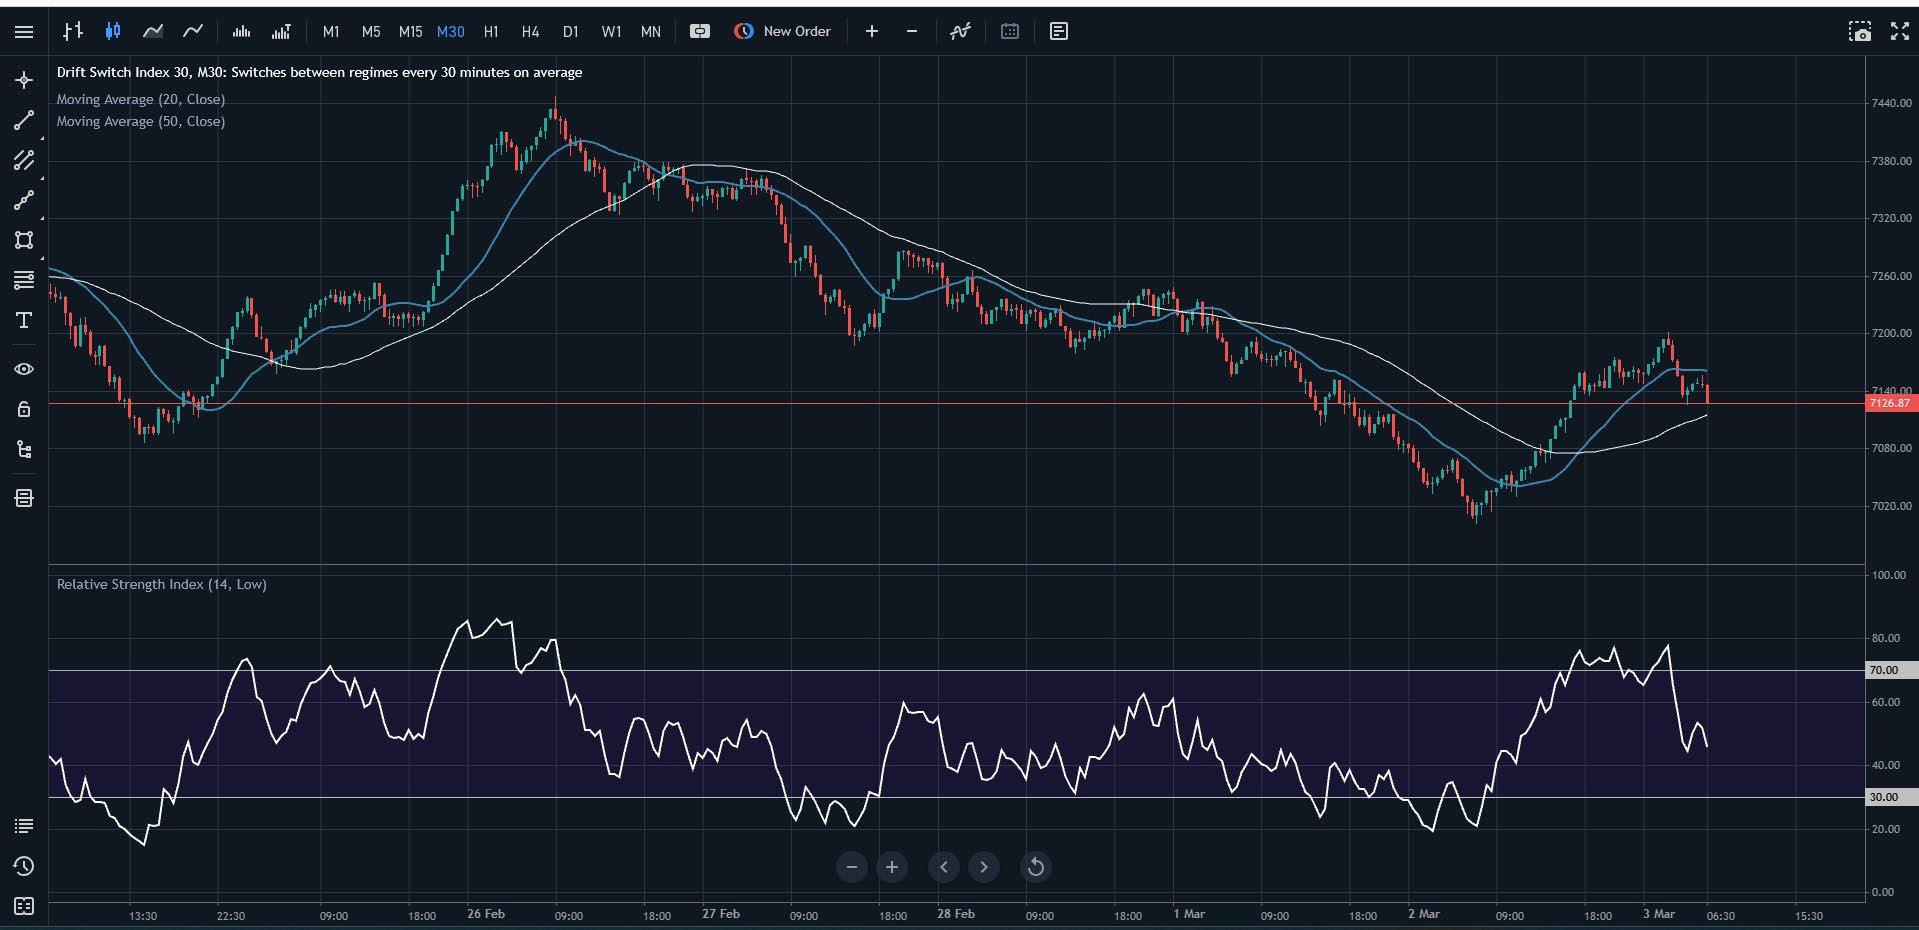
Fig. 9.3. Swing trading setup on Deriv Drift Switch Index 30 using M30 timeframe with moving averages and RSI
Scalping: Make multiple small trades to accumulate profits over time
Focus on short timeframes and quick executions.
Scalping Deriv’s Synthetic Indices is a fastpaced strategy that takes advantage of their continuous price movements and volatility.
Since these indices operate 24/7 without real-world event interruptions, they provide consistent trading opportunities.
Below, I’ll outline a simple, beginner-friendly scalping system tailored for Synthetic Indices— such as Volatility 10, 25, 50, 75, 100, or 250— using basic technical tools available on Deriv MT5 or Deriv Trader platforms.
There’s no complex setup or programming required, and you don’t need to pay for additional software.
This system focuses on quick entries and exits to capture small profits (0.5-1% moves) multiple times a day.
Simple scalping system for Deriv Synthetic Indices
Overview
This system uses the exponential moving average (EMA) for trend direction and the stochastic oscillator to time entries in overbought or oversold conditions.
It’s designed for short timeframes, keeping trades quick and manageable—perfect for scalping Synthetic Indices.
Tools needed
Platform: Deriv MT5 (recommended) but also works on TradingView, Deriv cTrader, and Deriv X.
Timeframe: 5-minute (M5) chart – fast enough for scalping while reducing noise. M1 can be considered, but I would start with M5. Test M1 as you gain more experience.
Indicators
8-period EMA (exponential moving average): A fast-moving average to catch short-term trends.
Stochastic oscillator (5,3,3): Used to identify overbought (above 80) and oversold (below 20) levels.
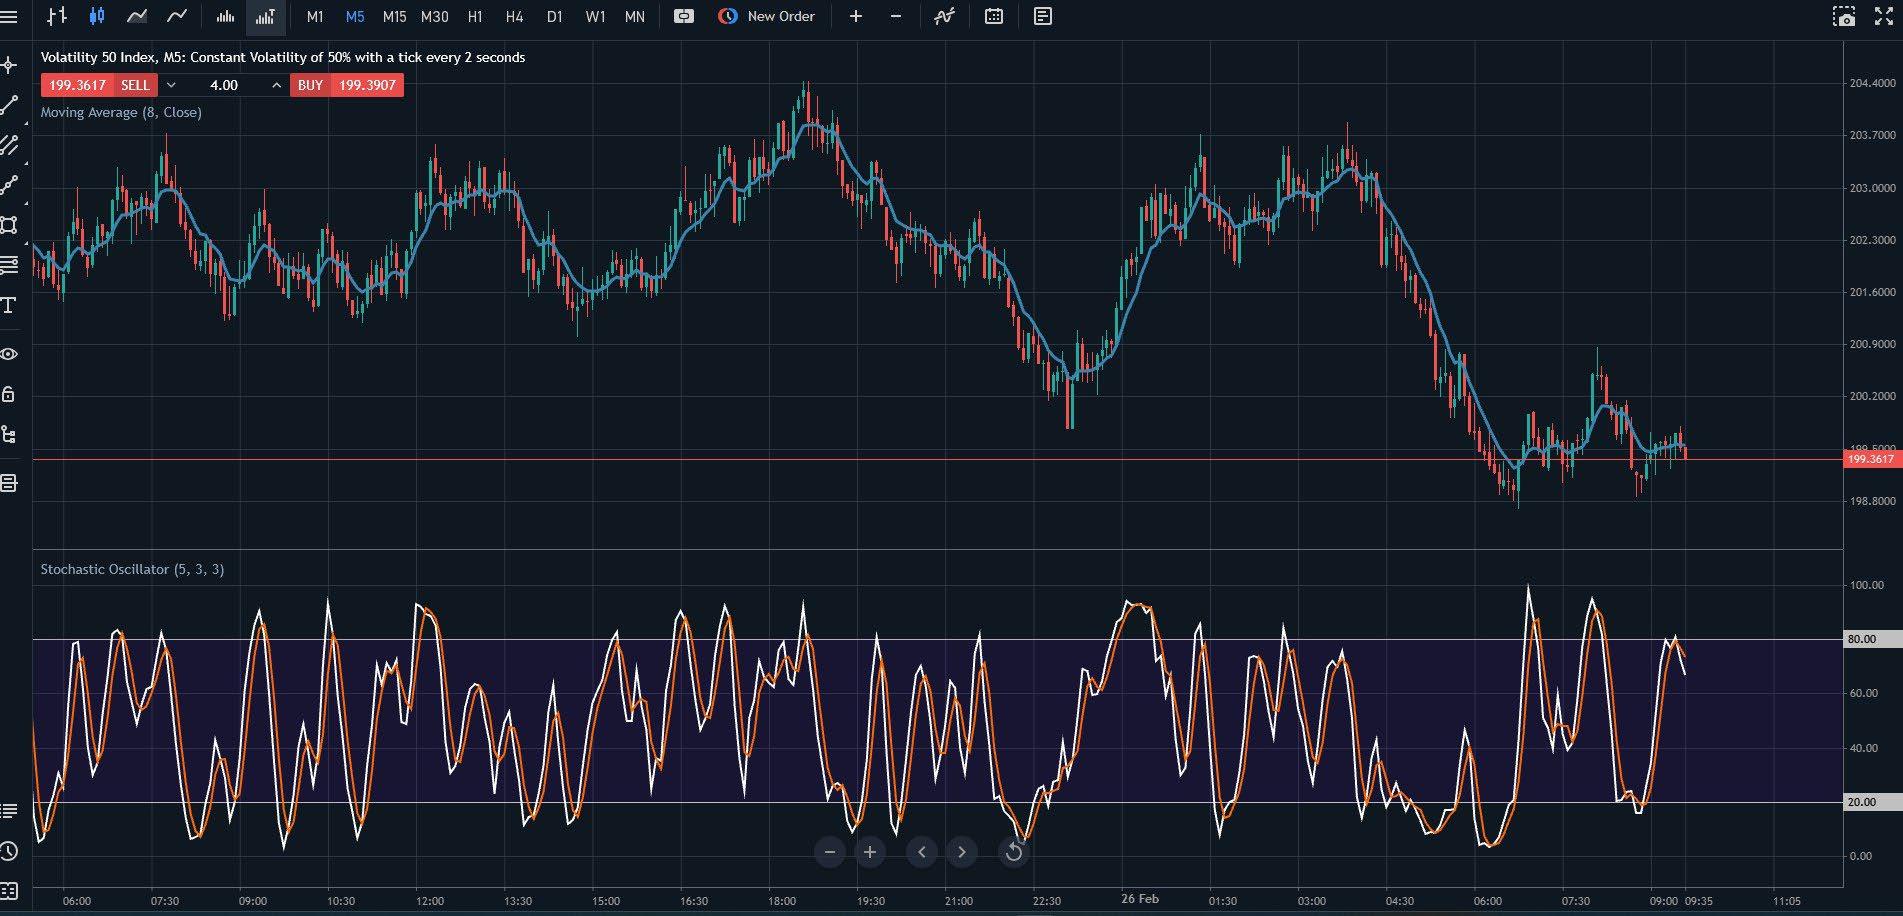
Fig. 9.4. Scalping setup on Volatility 50 Index (M5) using the 8 EMA and Stochastic Oscillator for trade entries
Setup instructions
Open your chart:
• Log into Deriv MT5, select a Synthetic Index (e.g., Volatility 50 Index), and set the timeframe to M5.
Add indicators:
• Add the 8 EMA to your chart—it will overlay as a line tracking the average price over 8 periods.
• Add the stochastic oscillator (5,3,3) below the chart, with default overbought (80) and oversold (20) lines, as shown in my example chart on Volatility 50 Index.
Trading rules
Entry
Buy signal:
• Price is above the 8 EMA, indicating a shortterm uptrend.
• Stochastic drops below 20 (oversold) and then crosses back upward (%K line crosses above %D line).
• Enter on the next candle after the Stochastic crossover confirms.
Sell signal:
• Price is below the 8 EMA, indicating a shortterm downtrend.
• Stochastic rises above 80 (overbought) and then crosses back downward.
• Enter on the next candle after the Stochastic crossover confirms.
Exit
Take profit:
• Aim for a small, fixed gain: 0.5-1% of the index price (e.g., 5-10 points on Volatility 50, depending on its level).
• Alternatively, exit when Stochastic hits the opposite extreme (above 80 for a buy, below 20 for a sell).
Stop loss:
• Place 0.5% below the entry for buys (or above for sells), typically near the recent swing low/high.
• For example, on Volatility 75, this might be 5-7 points from entry.
Risk management
Risk only 1-2% of your account per trade. Synthetic Indices move fast, especially highvolatility ones, so use small lot sizes (e.g. 0.01 lots on MT5) to stay safe.
Limit daily trades to 5–10 to avoid overtrading— scalping can be tempting with 24/7 markets.
Test on Deriv’s demo account first to get familiar with execution speed and index behaviour.
Why consider this system on Synthetic Indices?
Trend filter: The 8 EMA keeps you trading with the immediate momentum, which is critical for scalping’s hit-and-run style.
Stochastic timing: Helps catch quick reversals in overextended markets, which are common in the volatile swings of Synthetic Indices.
Speed: The M5 timeframe balances rapid trades (5-15 minutes each) while avoiding the chaos of lower timeframes.
Tips for success
Pick the right index: Start with Volatility 25 or 50—they offer enough movement for scalping without the extreme spikes of Volatility 75, 100, or 250. Lower-volatility indices like Volatility 10 might be too slow.
Stay disciplined: Exit trades quickly, even if it’s tempting to hold—scalping isn’t about big wins per trade.
Watch spreads: Deriv’s spreads on Synthetic Indices vary (tighter on Volatility 10, wider on Volatility 100). Factor this into your profit targets. While Deriv doesn’t charge commission, you must cover the spread before reaching profit.
Time of day matters: Though Synthetic Indices run 24/7, trade when you’re sharp and focused, not fatigued.
Consider automation: A trading bot or algo system can help maintain discipline and execute trades with precision, as a computer is always sharp!

Example
On a Volatility 50 M5 chart:
• Price is above the 8 EMA at 5000.00.
• Stochastic drops to 18, then %K crosses above %D at 20.
• You buy at 5002.00.
• Set a stop loss at 4997.00 (5 points below) and take profit at 5009.00 (7 points up, ~0.7% gain).
• Five minutes later, price hits 5009.00, and you exit with a quick profit.
• If Stochastic hits 80 first, exit early.
Scaling up
Once comfortable, try:
• Adding a 21 EMA for a stronger trend filter—only trade when the 8 EMA aligns with it.
• Switching to Volatility 75 for bigger moves (adjust stops and targets accordingly).
• Using Deriv Bot to automate this setup if you prefer hands-off scalping.
This system is simple, relying on two indicators to keep decisions clear and fast—ideal for scalping Synthetic Indices.
Test it on a demo account, tweak profit/stop levels based on your index’s volatility, and let me know how it performs for you!
