


The Village of Bensenville is in the midst of updating their existing comprehensive plan and creating a new place to outline the community’s desired development vision for its future. As part of that process, it was necessary to collect citizen stakeholder input. Having an accurate understanding of resident thoughts is an important step towards developing an appropriate and effective plan.
The survey was designed to gauge the thoughts of residents on a broad series of topics, all important to understand when updating the comprehensive plan. Survey questions related to:
• Housing
• Economic Development
• Recreation Opportunities and Open Space
• Transportation
• Sustainability
• Community Development
The survey questions can be found in the appendix at the conclusion of the report. Through these questions, the Village of Bensenville was seeking to create a general understanding of how residents wish to see the Village develop over the next 10 to 20 years. Their responses set a foundation for Village policies which hope to achieve that vision.
Beginning in December 2024, the engagement process for the 2025 Bensenville
Comprehensive Plan update lasted roughly 3 ½ months, concluding in the middle of March. During that time, the Village paired with the following community organizations in order to engage the residents of Bensenville:
• Bensenville School District 2
• Bensenville Community Public Library
• Bensenville Chamber of Commerce
• W.A Johnson School Parent Teacher Association
• Guatemalan Consulate of Chicago
• The Office of State Representative Norma Hernandez
• Zion Concord Lutheran Church
Their help was invaluable in collecting survey responses. Whether it was through promoting the survey via social media, a mailing list, or hosting a pop-up engagement event, the process would not have been possible without their collaboration.
Based on the previous planning process done by the Chicago Metropolitan Agency for Planning, the goal was to collect at least 133 survey responses.
Receiving that many survey responses would match the previous level of engagement. Thanks to the collaboration between Village staff and community organizations, 180 survey responses were collected. That exceed expectations by 35 percent, providing reliable and actionable data.
Engagement over the course of the 3 ½ months took many forms, mainly through a series of pop-up engagement events. A formal workshop was not held at this stage in the process, because Village staff instead wanted to go to the residents of Bensenville to get their input, instead of requiring them to come to a Village facility. It was hoped that by going to popular locations and events in Bensenville that a wider range of residents would be engaged than in the traditional planning process. Some examples of pop-up engagements were:
• Senior Luncheon at Village Hall
• VR Night at the Bensenville Community Public Library
• Hosting a booth at the Small Business Expo organized by State Rep. Norma Hernandez
• Holiday Toy Drive at W.A Johnson School
At these events, Village staff was present to encourage and aid residents in filling out the survey. At all times, surveys were available in English and Spanish, and able to be translated into other languages upon request. Further engagement was done via social media posts on official Village accounts as well as the accounts of partner organizations. The Bensenville Chamber of Commerce utilized their email list to encourage completing the survey. A letter was also sent out to all Village residents via the water billing notification. The latter two forms of engagement were especially effective. Postcards with a QR code linking to the survey were also available at various locations around Bensenville.
Within this report, survey responses will be broken down and analyzed. The following analysis aims to use data to properly illustrate citizen desires for growth in the near and long term.

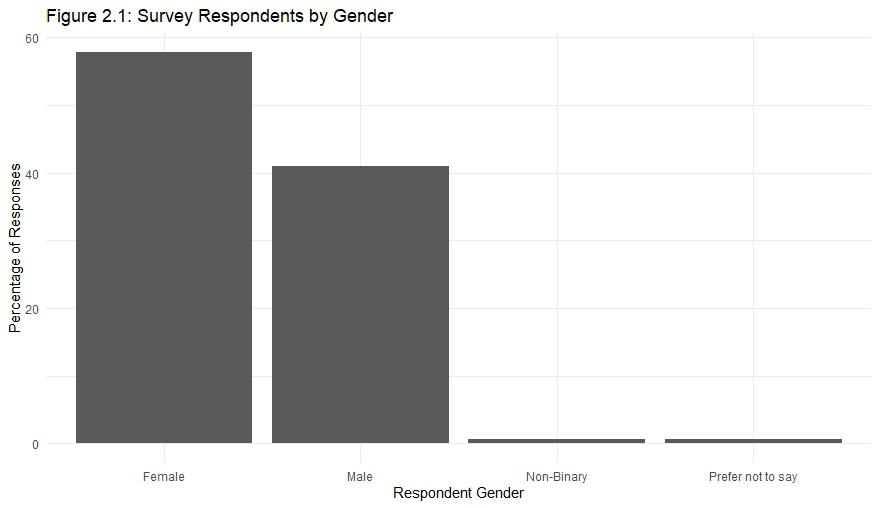
The survey began by asking respondents to answer several demographic questions. These were designed to provide an understanding of what audience the survey was reaching. Village staff had a goal of reaching those who are traditionally left out of the planning process- low-income residents, minority residents, and older residents were specifically targeted as demographic groups whose input would be invaluable during the plan update process. 180 respondents completed the survey.
Figure 2.1 shows the gender breakdown of survey respondents. There were more female respondents than male respondents, with one non-binary respondent and one person preferring not to state their gender. Pop-events were primarily held at family events- staff visually observed multiple times one parent/guardian taking the survey to ensure the household was represented while another supervised their children.
Figure 2.2 illustrates the survey respondents by age group. The most engaged age group of respondents were those over 65 years of age, followed by those in the 36-45 age range. They both make up over 20 percent of respondents, including a mix of aging residents and residents who are still likely to be working with families. The 26-35, 46-55, and 56-65 age groups all had similar levels of engagement. Younger age groups appear to be outliers with low levels of engagement. According to the 2018-2022 American
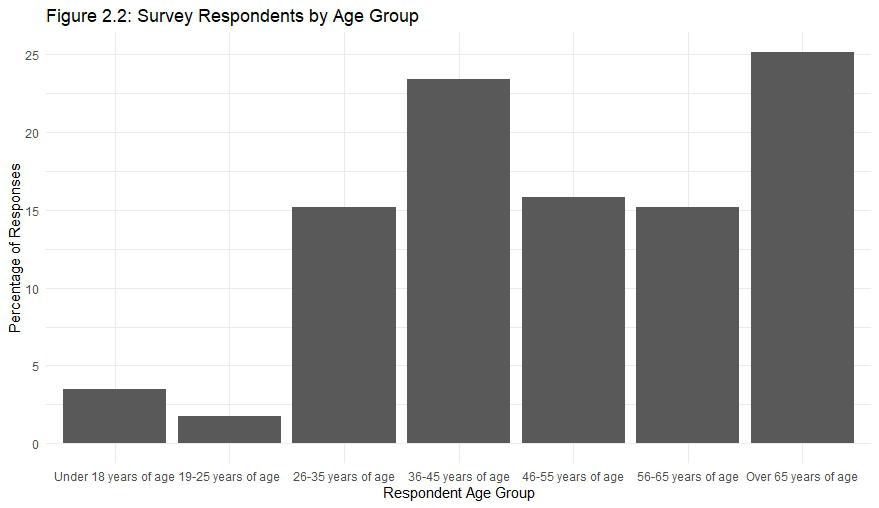
Community Survey (ACS), the median age of Bensenville residents was 37.0 years old. With the 36–45-year-old age group contributing the second highest response rate, the median age was well represented.
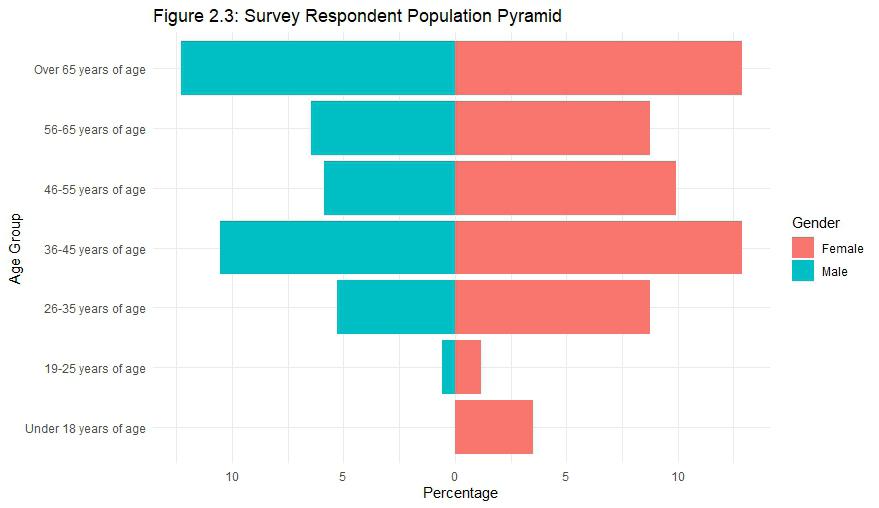
Figure 2.3 shows the population pyramid of survey respondents. There was an almost equal distribution of male and female respondents in the two largest respondent age groups. Other (non-binary and prefer not to say) respondents were removed for their privacy.
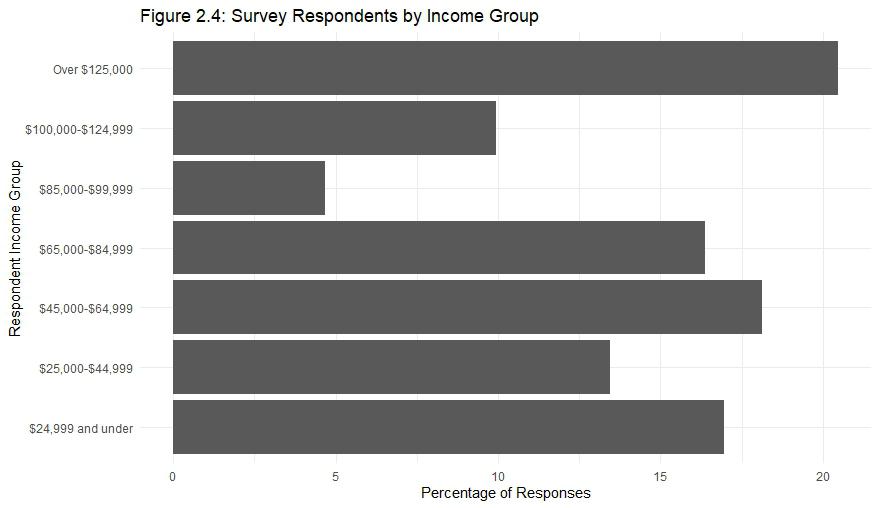
Figure 2.4 demonstrates survey respondents by income group. The group with the highest response rate (Over $125,000 income group) makes up roughly 20 percent of the responses. Income brackets from the survey do not line up with the ACS income brackets. However, the 2018-2022 ACS states that the median household income is $78,489, and Figure 2.4 shows that the income group that falls into is one of four categories with over a 15 percent response rate. High-, middle-, and low-income groups are all represented with over a 15 percent response rate, providing a diversity of perspective in later responses.
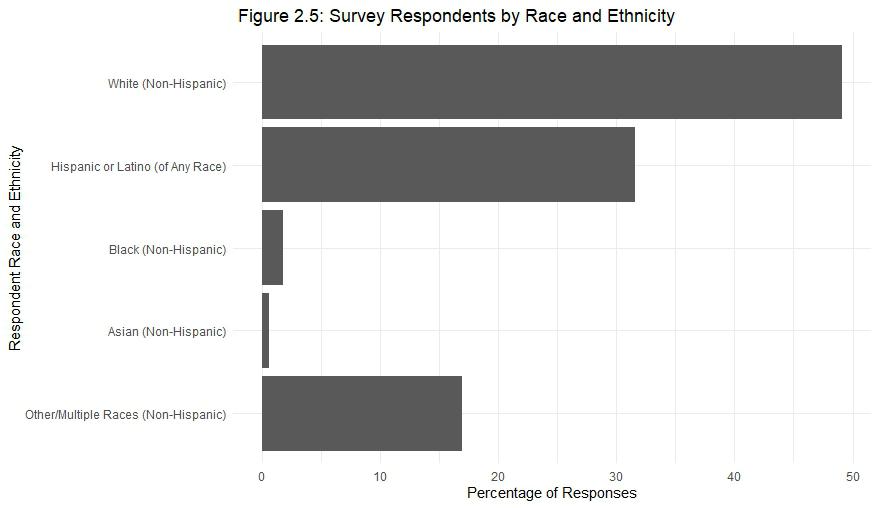
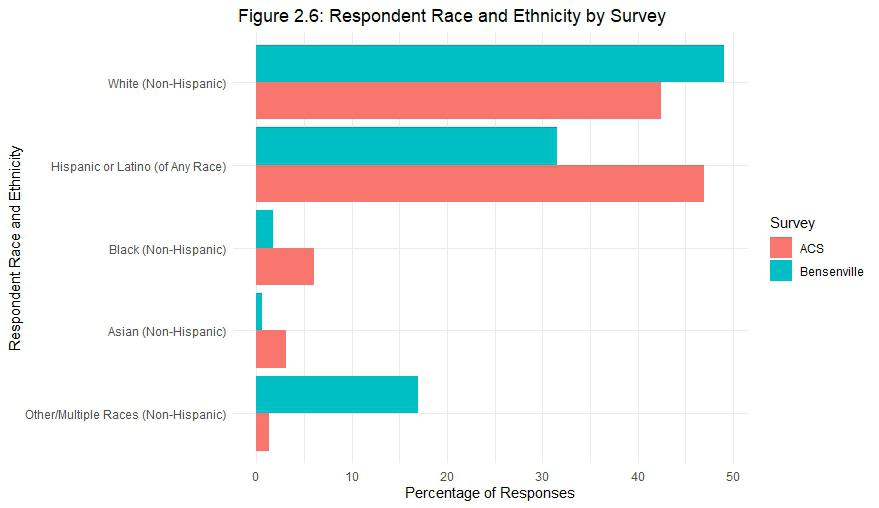
Figures 2.5 and 2.6 explore the race and ethnicity of survey respondents. They show that White (non-Hispanic) and Hispanic or Latino (of Any Race) respondents make up the most survey respondents. However, when compared to the 2018-2022 ACS population estimates, White (non-Hispanic) survey respondents are overrepresented
compared to their share of the population, and Hispanic or Latino (of Any Race) are underrepresented compared to their share of the population. Trends for Black and Asian (both non-Hispanic) respondents match overall trends, while the Other/Multiple Races (non-Hispanic) respondent group is notably overrepresented. A potential explanation- many survey respondents indicated multiple race and ethnicities that together might be considered white. As they mentioned multiple, that was grouped into the Other/Multiple Races (non-Hispanic) respondent group.
Key Findings
• Survey respondent engagement exceeded staff goals by 35 percent.
• Inclusion goals met, creating a diversity of perspectives for later survey responses.
• Respondent demographics similar to overall community makeup.
A significant portion of the survey’s questions were related to housing. Regional plans and past planning studies involving Bensenville call for the creation of more housing reflecting the nationwide housing shortage and affordability issues. By assessing the state of housing and resident’s perception of it, it will be possible for the Village to better understand how to provide housing in Bensenville.
Figure 3.1 shows the length of residence in Bensenville among survey respondents. The majority of respondents indicated that they have lived in Bensenville for over 20 years, showing that it is a community where residents prefer to age in place. A side effect of this phenomenon is that they may live in homes that no longer suit their housing needs. Figure 3.2 shows that the majority of survey respondents are homeowners. The 2018-2022 ACS data, which shows that roughly 53 percent of housing units in Bensenville were owner-occupied. This comparison (Figure 3.3) reveals that homeowners are likely overrepresented in the survey, which may impact certain findings.

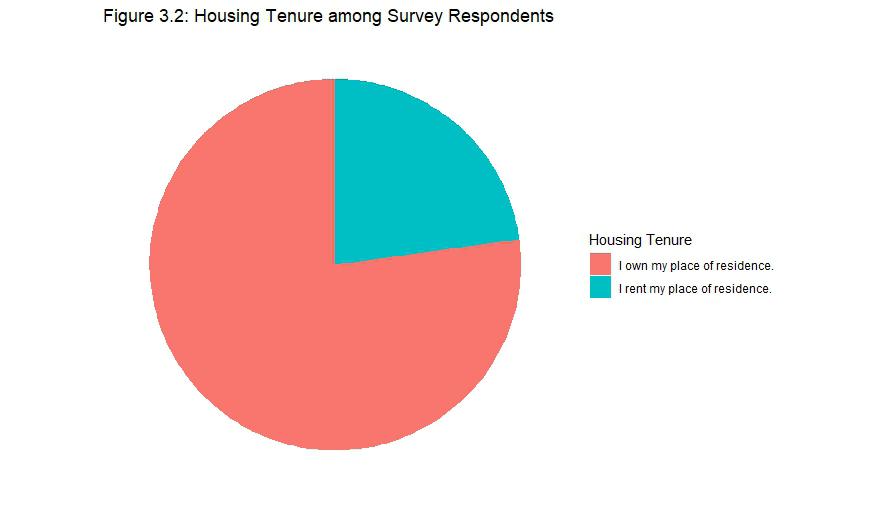
Figure 3.4 illustrates housing tenure by age group among survey respondents. Visually, there is a trend among respondents that the likelihood of renting decreases as one ages, with a spike in the renting population among the 65+ group. Similarily, there is a trend of increasing ownership with age.
There are similar trends associated with increasing income groups (Figure 3.5). The peak percentage of renting respondents can be found in the lowest income group, with a notable decline in renting status as income increases. On the other hand, there is a visible increase in the percentage of homeowning survey respondents as respondent income increases. No survey respondents indicated that they rented and fell within the $85,000-$99,999 income group. This income group is also an outlier compared to other ownership trends among survey respondents.
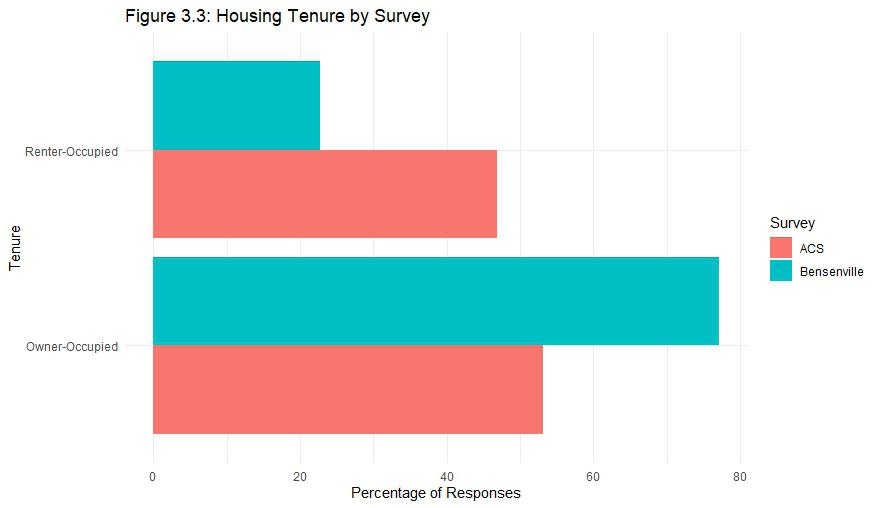
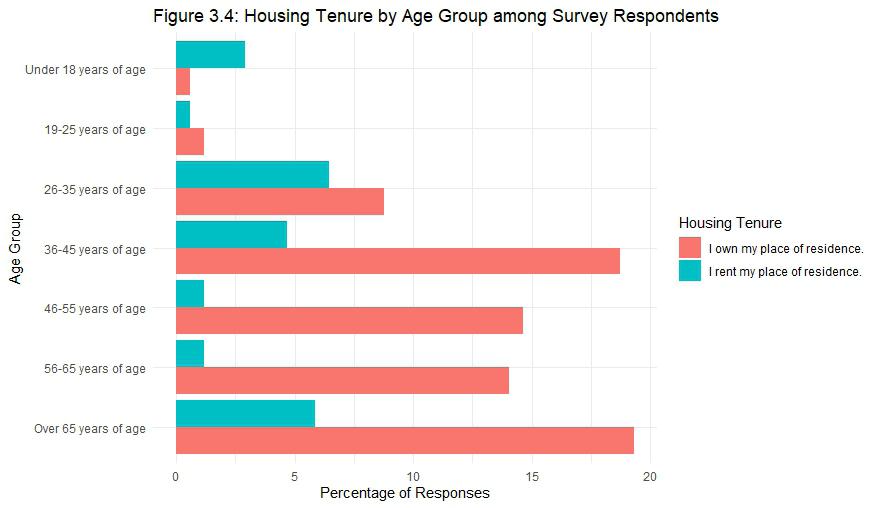
Figure 3.6 demonstrates the perception of housing affordability among survey respondents. There is an overall feeling of relative levels of affordabililty- the average response on the perception of affordability is 6.4 out of 10. Combining neutral and respondents who responded below a 5, indicating dissatisfaction, roughly 1/3 of all respondents indicated not being satisfied with the current levels of housing affordability in Bensenville. Later data will visualize the average percentage of monthly income spent on housing and compare reported perception to reality. At the extremes, it is important to note that there is a significantly high percentage of respondents who are extremely satisfied with housing affordability in Bensenville compared to those who are extremely dissatisfied with it.
Figure 3.7 shows satisfaction levels by age group. Across the board, there is a wide range of responses- based on this information, it can be reasoned that housing affordability should be improved for those at all levels of life, as opposed to one specific group. Housing needs change with age, and Bensenville’s housing stock should adapt to fit this need.
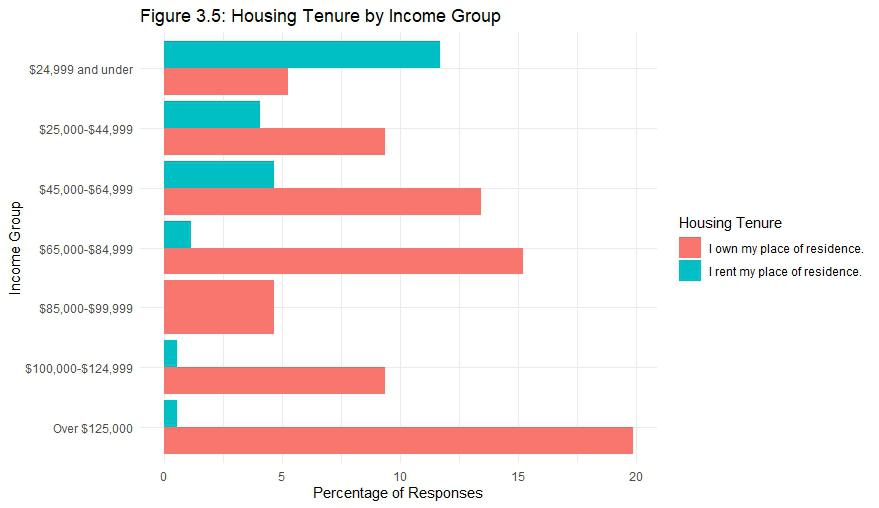
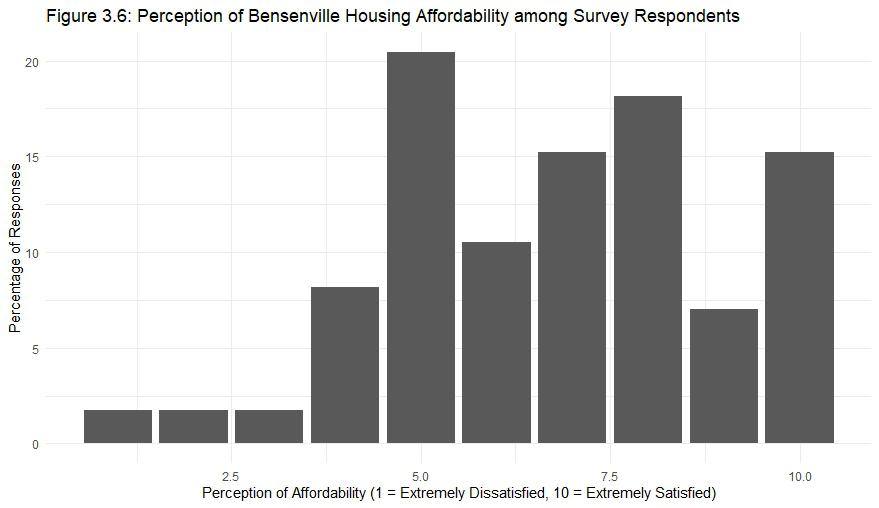
Figure 3.8 displays similar trends to Figure 3.7. 3.8 examines satisfaction with housing affordability by income group, showing once again that there is disparity in the reported perception of housing affordability. There are notable levels of satisfaction across income groups- for example, the most frequent response in the lowest income group ($24,999 and under) indicates extreme satisfaction, while the most frequent response in the highest income group (over $125,000) indicates moderate levels of satisfaction. There are fairly low response rates among the middle-income groups (between $85,000 and $124,999) showing they might be underrepresented. It is important to note this so that housing policy decisions are not solely informed by potentially imbalanced sources.
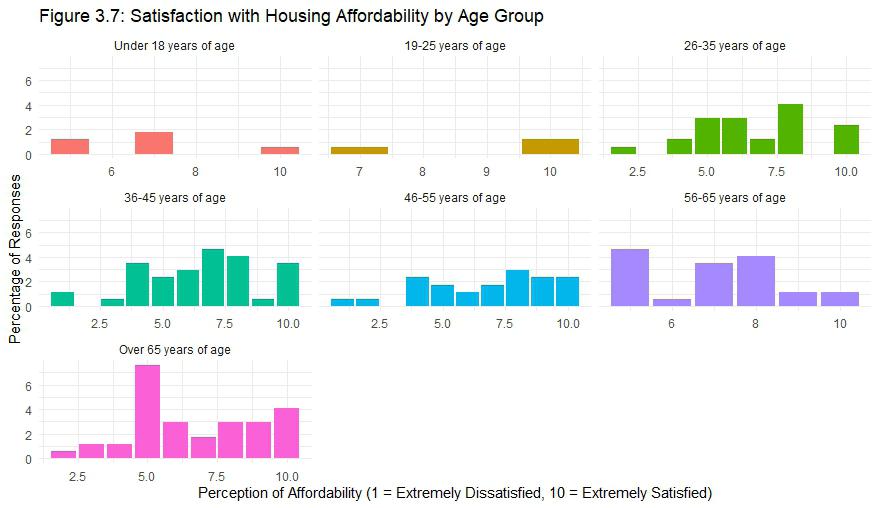
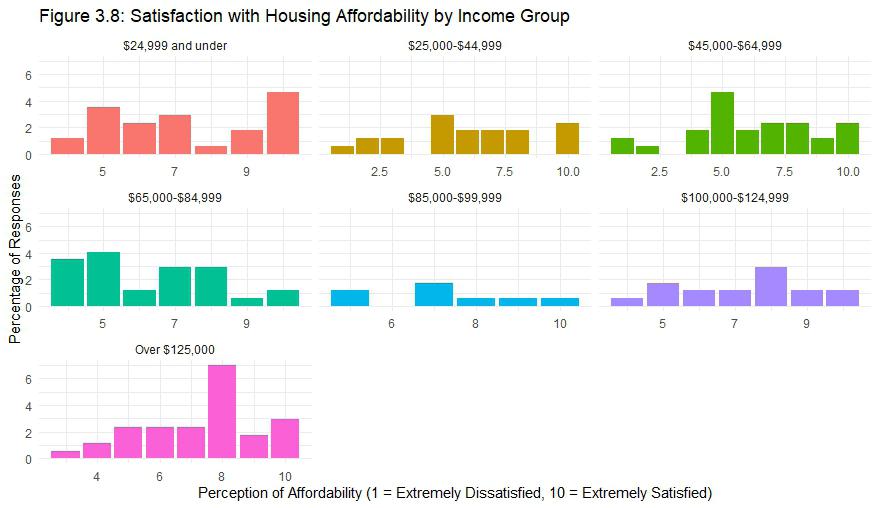
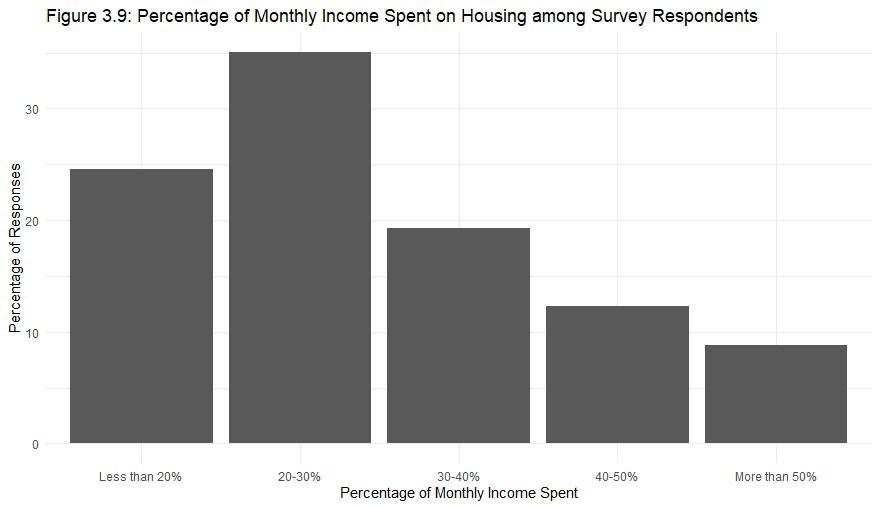
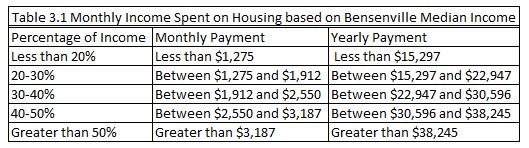
Figure 3.9 shows the percentage of monthly income spent on housing among survey respondents. Slightly over a third of all respondents said that they spend between 20 and 30 percent of their monthly income on housing. 24 percent of respondents indicated that they spend less than 20 percent of their monthly income on housing, while the remainder of respondents spend more than 30 percent of their monthly income. Applying this data to the median income as presented in the Existing Conditions Report ($76,489), potential housing payments over the course of a year are presented in Table 3.1. Within the income range that the Bensenville median income would fall in, the most frequent response was that survey takers spend between 20-30 percent of their monthly income on housing. This translates to between $1,275 and $1,912 a month, or between $15,297 and $22,947 a year. The average perception of affordability in this income group is 6.3 out of 10.
The United States Department of Housing and Urban Development (HUD) defines cost burdened as “monthly housing costs (including utilities) exceeding 30% of monthly income” and severe cost burdened as “monthly housing costs (including utilities) exceeding 50% of monthly income”. According to the survey, 31.6 percent of respondents are cost burdened, and an additional 9.0 percent are severely cost burdened.
Figures 3.10 and 3.11 show different perspectives on the percentage of monthly income spent on housing by different demographic groups. Figure 3.10 shows the percentage of monthly income spent on housing by age group. There are not many responses from those under 25, but beginning with the 26-35 age group, it is possible to observe how, based on survey responses, the proportion of one’s monthly income spent on housing decreases with age. In the 26-35 year age group, a majority of respondents are some level of cost burdened, with that proportion decreasing as age groups increase.
Figure 3.11, displaying the percentage of monthly income spent on housing by income group, displays similar trends. Looking at the lowest income group, $24,999 and under, the majority of respondents that fall into this group face some level of housing cost burden. Compare this to the two highest income groups, $100,000-$124,999 and over $125,000- the majority of respondents do not indicate that they are cost burdened. In fact, within responses from the $100,000-$124,999 group, there are no residents that indicate they are severely cost burdened, which is the lowest of any surveyed income group. Similar to how the proportion of income being spent on housing decreases as age increases, the amount of income spent on housing by survey respondents decreases as income increases.
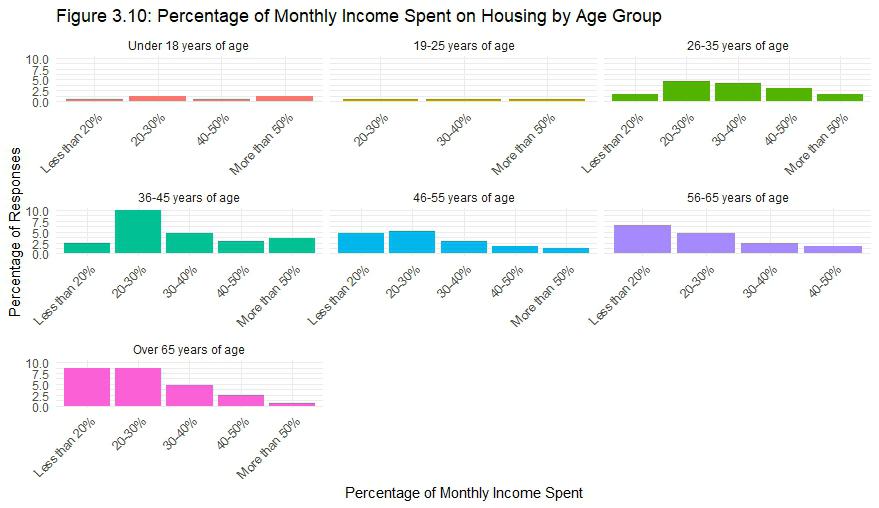
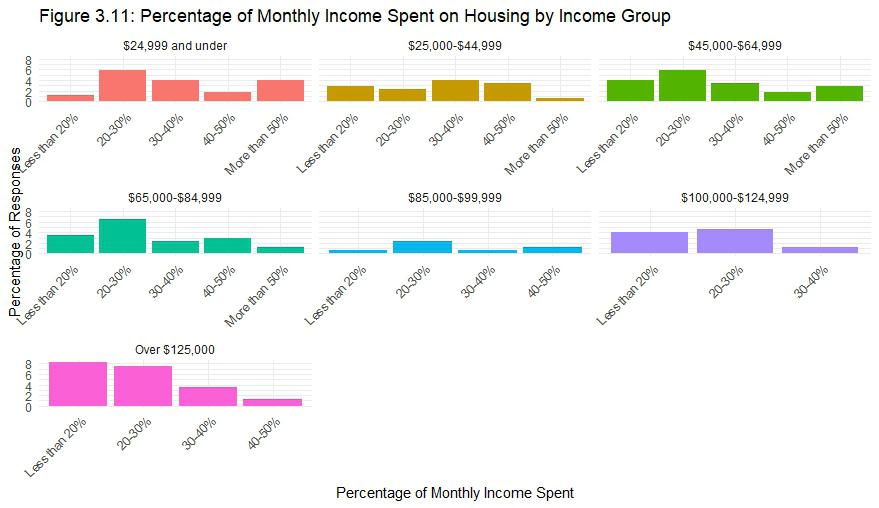
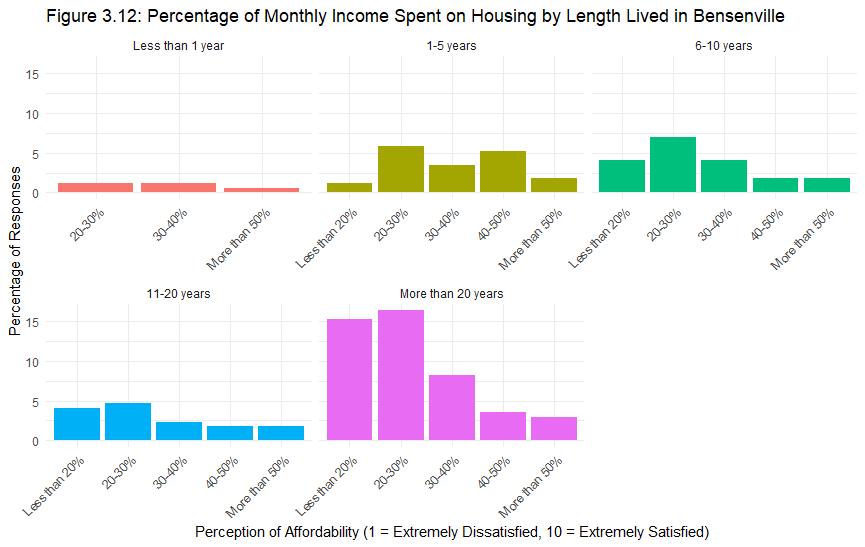
Figure 3.12 displays the percentage of monthly income spent on housing by the length of time that survey respondents have lived in Bensenville. This closey tied with the results of Figure 3.10, in which it is determined that the proportion of monthly income one spends on housing decreases with age. Substitute time lived in Bensenville for age, and you get similar results. The majority of respondents who indicated that they have lived in Bensenville for over 20 years are not housing burdened.
Additionally, comparing the most vulnerable, those who are severely housing burdened, there are higher rates of severe housing burden found among the 1-5 years of residence group (7.1 percent of responses) than among the more than 20 years of residence group (6.4 percent of responses).
Among the two middle groups, 6-10 years of residence and 11-20 years of residence, there is a moderate Bell curve distribution of responses, with the most frequent response being that 20-30 percent of monthly income is spent on housing. This reflects the transition, showing that as time spent living in Bensenville increase, the percentage of monthly income spent on housing tends to decrease.
Key Findings
• Bensenville is a place where residents feel comfortable, leading them to age in place.
• The majority of survey respondents are home owners.
• The probability of a survey respondent being a home owners increases as age and/or income increase.
• Residents are generally satisfied with the cost of housing in Bensenville.
• Almost 40 percent of all survey respondents indicate they face some level of housing cost burden.
• Among survey respondents, as age and income increase, the proportion of monthly income spent on housing decreases.
A handful of survey questions related to respondent employment. It is important for the Village to understand the employment desires of residents because commercial and industrial land uses make up a significant portion of the Village. Exploring the connection between employment and potential land use is extremely important to make informed decisions when developing policies for the comprehensive plan.
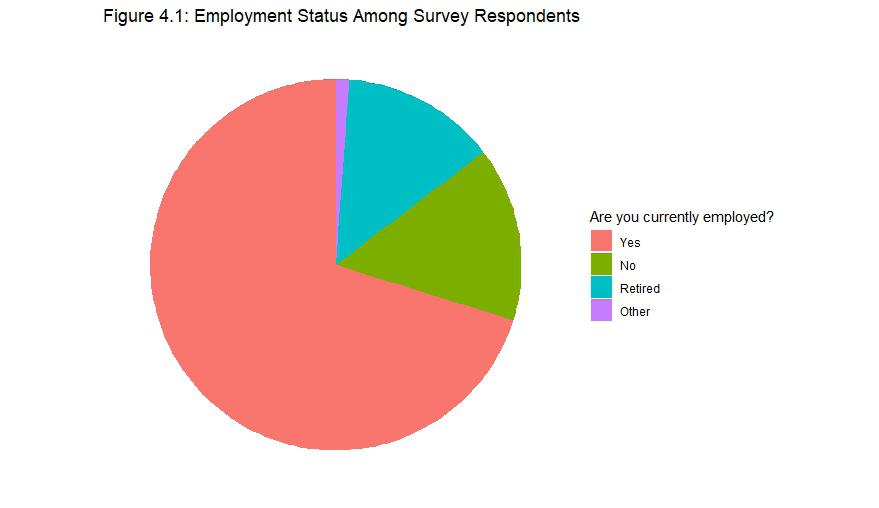
Figure 4.1 displays the employment status of survey respondents. Overwhelmingly, respondents are employed and participating in the labor force. A notable percentage of respondents are either retired or not currently employed. The survey did not differentiate between those who are actively unemployed and those who are considered out of the labor force. People who traditionally fall into this category are retired, students, familial caretakers, etc.
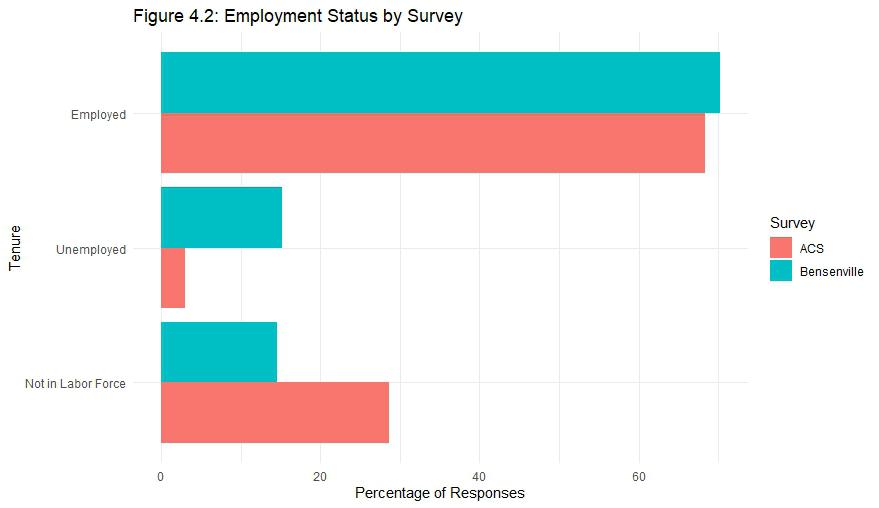
For the purpose of Figure 4.2, Bensenville survey respondents not considered in the labor force are those who answered “Other” or “Retired. Respondents who indicated “No” are considered to be unemployed. The chart displays a comparison of the American Community Survey, used for the Existing Conditions Report, and the survey led by Village staff. The previously mentioned discrepancy may explain the difference in trends between the “Unemployed” and “Not in Labor Force” categories. There are similar
Diner Coffee Shop Trader Joes Aldi Restaurants
Family-Friendly Office Starbucks Retail Hardware Store
Outdoor Patio Space Bookstore Boutique Cafe Resale Shop
Pet Supply Health-Centric Anchor Speciality Stores
Tutoring Sit Down Restaurant Bakery Nightlife
Clothing Stores What new business or opportunities would you like to see in Bensenville? Professional Headquarters
Leisure Business Soul Food Hotels Upper Scale Sports Bars
Olive Garden General Store Specialized Retail Healthcare
Wholesome Bakery Chains Walkable Community-Based
Wine Bar Antique Robust Breweries Conference Center
Music Vegetarian Entertainment Chains Department Stores
Shopping and Dining
trends regarding the employed status of residents between the two surveys.
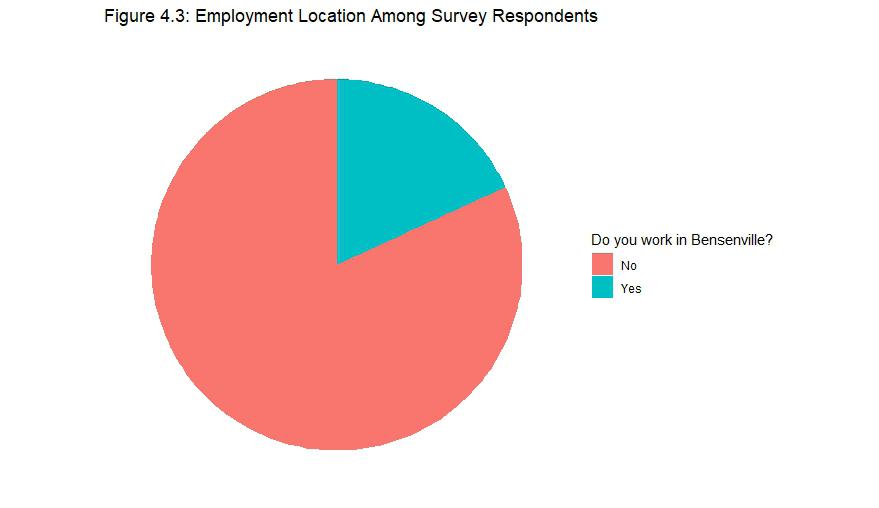
The survey also asked respondents whether they worked in the Village or not. Figure 4.3, displaying response data, indicated that the vast majority of respondents (over 75 percent) do not work in the Village. As the Existing Conditions report highlighted that the location with most residents employed is Chicago (16.4 percent) it is not surprising that there is a lack of respondents working within the Village. The responses align with expectations.
Key Findings
• The majority of survey respondents are employed.
• The majority of survey respondents do not work within the Village, aligning with both data from other sources and expectations.

It is very important to understand in what manner and how far Bensenville residents travel on a daily basis, whether that be to work or to access amenities. Keeping in line with Bensenville’s Vision Zero and Complete Streets policies, the upcoming comprehensive plan is committed to creating a safe travel environment for all users. This chapter explores travel mode share, perception of safety, and more in an effort to create an informed foundation from which strong policies can be developed.
Figure 5.1 shows the mode share when commuting to work for survey respondents. Mode share is another method to describe the transportation option one chooses. The figure demonstrates that far and away, the most common mode share among survey respondents is drive alone to work. The second most common mode share is “Other.” This is a tad deceiving, as some respondents indicated they were retired and did not work, worked from home or other options. ‘ Discounting this, the second most common response among survey respondents was taking public transportation to work. This is unsurprising- as previously established, the City of Chicago is where the most Bensenville residents work. With the strong transit linkage to downtown thanks to the MD-West Metra line running through downtown, one can reason that this plays a significant role in survey responses.
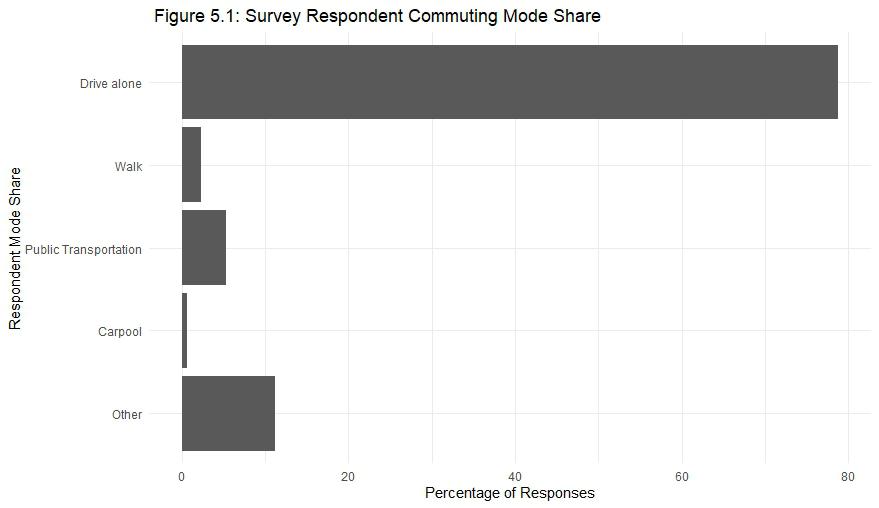
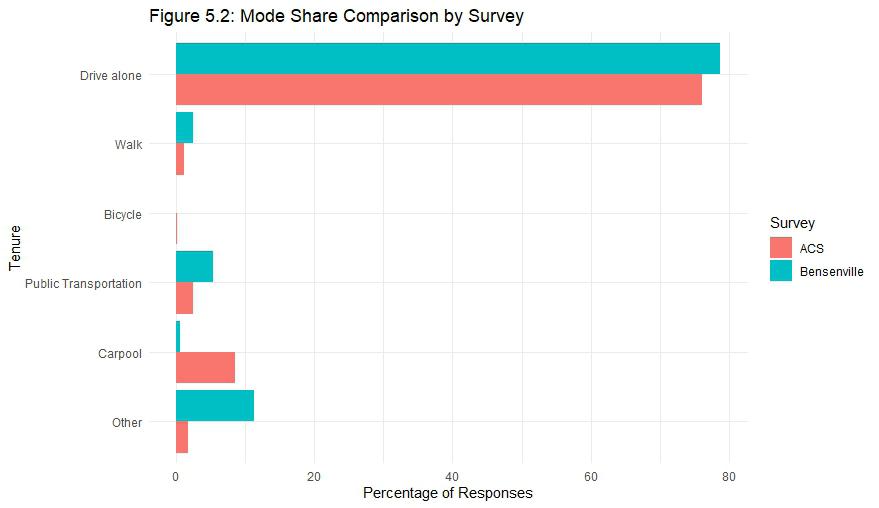
Figure 5.2 compares Bensenville survey responses to ACS data. Overall, the themes remain the same- in both surveys, the majority of respondents typically drive alone when commuting to work. Two potential discrepancies: when comparing to the ACS data; carpooling among Bensenville survey respondents is underrepresented and other means are underrepresented. Something of note: both surveys indicate low levels of active transportation mode share when commuting to work. This may be a result of low rates of infrastructure connectivity or potentially not enough jobs within a distance comfortable for active transportation.
Active transportation, namely walking and bicycling, are associated with a host of benefits- environmental, economic, health, and more. Despite these benefits, active transportation is often one of the least frequently chosen modes of transportation. In an effort to understand how to better encourage and induce more active transportation in Bensenville, the survey looked at the perception of safety while walking and bicycling among residents.
By exploring the relationship between safety and different demographic groups among Bensenville’s survey respondents, the goal is to discover new opportunities to build on the work of Bensenville’s Vision Zero and Complete Streets policies. Both policies have been implemented since the adoption of the 2015 Comprehensive Plan.
Beginning with walking, Figure 5.3 displays the overall perception of safety while walking among survey respondents. A response of 10 indicates the highest perception of safety, while a response of 1 indicates the lowest perception of safety. Interestingly, no survey respondent indicated a response of 1, meaning no respondent feels wholly and completely unsafe while walking in the Village. The majority of responses are higher than a 5, meaning that the majority of respondents feel safe while walking in Bensenville. Moreover, there is a cluster of responses at the far-right end of the scale (8,9,10) - over 60 percent of respondents feel very safe while walking within the Village.
Figure 5.4 displays the perception of safety while walking by gender. There are similar trends among the perception of safety across all surveyed gender groups- multiple instances they are equal. At the lower end of the perception scale, it does appear that female respondents were more likely to feel unsafe while walking. The higher percentage of female responses can be attributed to the fact that, referencing Figure 2.1, more female respondents completed the survey than male respondents.
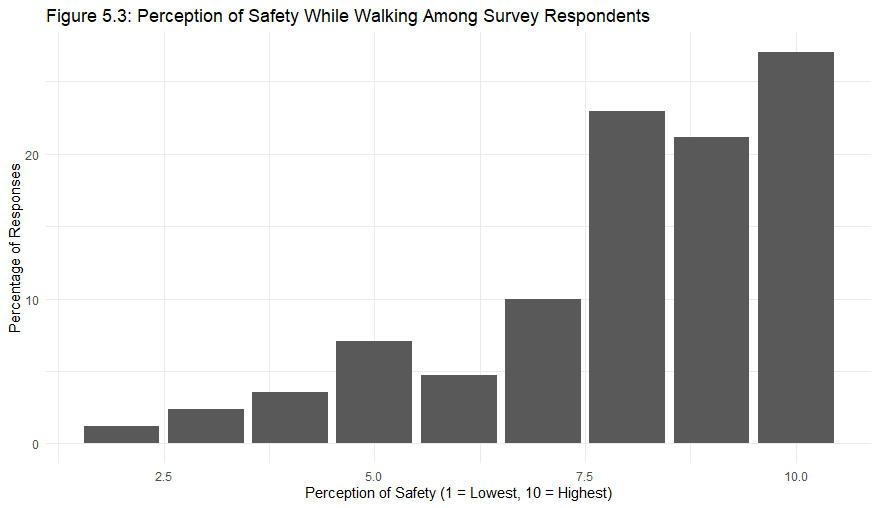
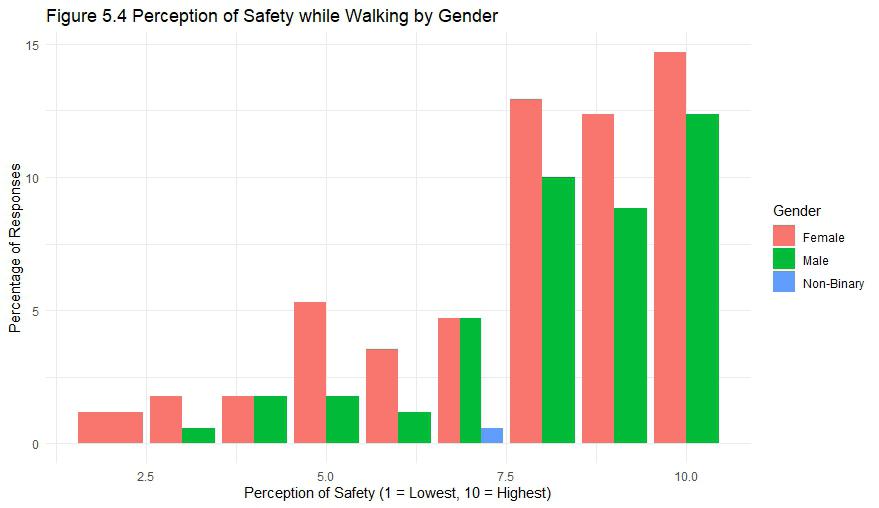
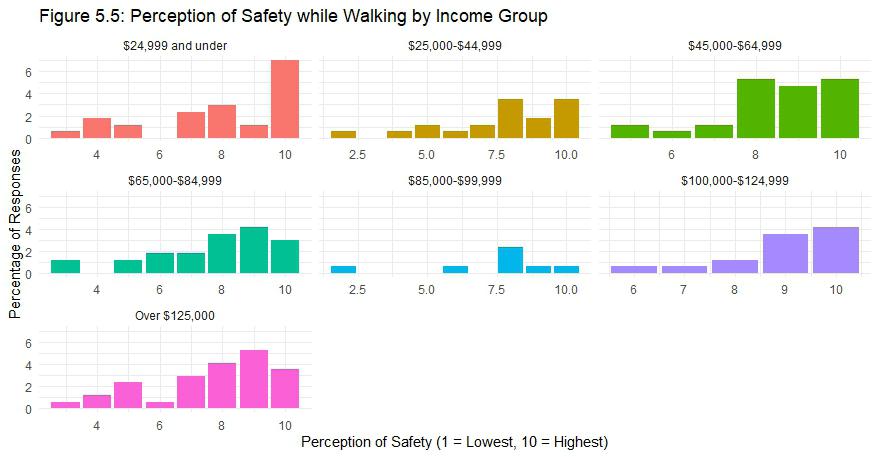
Figure 5.5 highlights the perception of safety while walking by income group. The trends by income group in this chart match what is presented in Figure 5.3. However, especially among the lower income groups, there are higher levels of response volatility. This figure tells two stories- 1) feelings of unsafety are not limited to any group in particular and 2) steps should be taken to ensure that residents at all levels of the income spectrum are comfortable walking.
In particular, residents at the lower end of the spectrum should be given special attention, as they are traditionally more likely to not own a car and have to rely on alternative forms of transportation. At the very least, there should be strong active transportation linkages to existing public transportation options.
Figure 5.6 shows the perception of safety while bicycling among survey respondents. The majority of respondents do appear to feel safe while bicycling in Bensenville. However, when compared to the perception of safety while walking among respondents, there is a higher rate of responses indicating a lower perception of safety while cycling. The average response for the perception of safety while walking is 6.9, while the average response for perception of safety while bicycling is 6.2. Over 10 percent of respondents indicate they feel unsafe while cycling as compared to the under 10 percent that indicate they feel unsafe while walking. This is a challenge to inducing higher rates
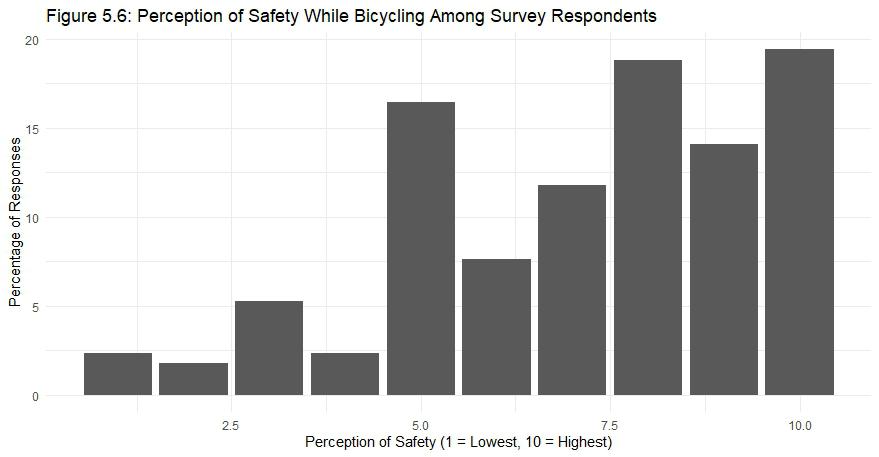
of cycling Bensenville residents. If residents are more likely to feel unsafe, they are less likely to choose bicycling as a commuting option. There are also higher rates of respondents who feel ambivalent to cycling as compared to walking (indicated by a response of 5).
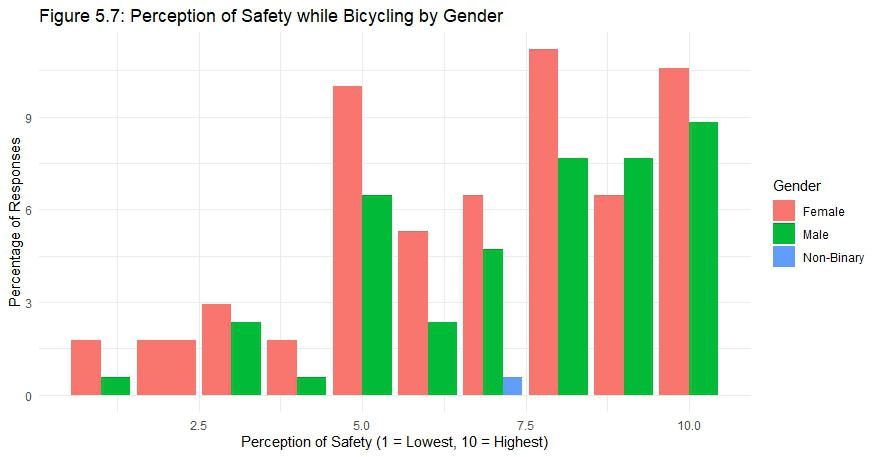
Figure 5.7 highlights the differences in the perception of safety while bicycling by gender. The trends presented in Figure 5.7 match those presented in Figure 5.6. Interesting to note, male respondents display fewer overall perceptions of safety compared to women (responses 6 or higher). At the same time, women display higher rates of lower perceptions of safety. Much like Figure 5.4, this is because there are more female respondents in the overall survey. There is a greater distribution of responses among both genders compared to walking, indicating that there is greater volatility in feelings towards safety while cycling.
Figure 5.8 shows the perception of safety while bicycling by income group. Comparing these responses to the perception of safety while walking by income group reveals a handful of interesting items. There are slightly lower overall rates in confidence among lower income groups in cycling (7.2 average response) as compared to higher income groups (7.3 average response). No group has an average response of 10, indicating no groups feel completely safe while cycling. The two lowest income groups display more comfort walking than cycling.
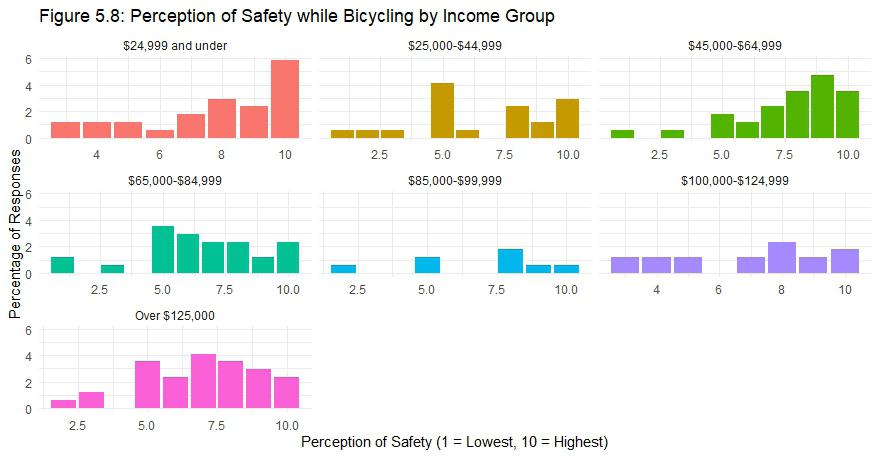
There is an average perception of 7.9 out of 10 on the safety scale for walking, compared to a perception of 7.2 on the safety scale for cycling. The two most vulnerable groups appear to feel moderate levels of safety, but there is always room for improvement.
Figure 5.9 shows the average travel time that survey respondents take to access amenities such as shopping and dining options. The most common timeframe, 11-20 minutes, was selected by 42.1 percent of all respondents. Due to Bensenville’s close proximity to major arterial roadways such as York Road and Irving Park Road, as well as the predisposition to driving as demonstrated in Figure 5.1, it is likely that residents are leaving the community to access shopping and dining options.
The second most common timeframe, 5-10 minutes, was selected by 35.4 percent of survey respondents. 5-10 minutes implies a proximity to one’s original destination. Taking these two answers together, it is possible to assume that decisions centered on where to shop and eat are based on a case-by-case decision relative to what options are available in Bensenville.
It is uncommon for residents to travel less than 5 minutes to access shopping and dining options, implying a segregation of land uses.
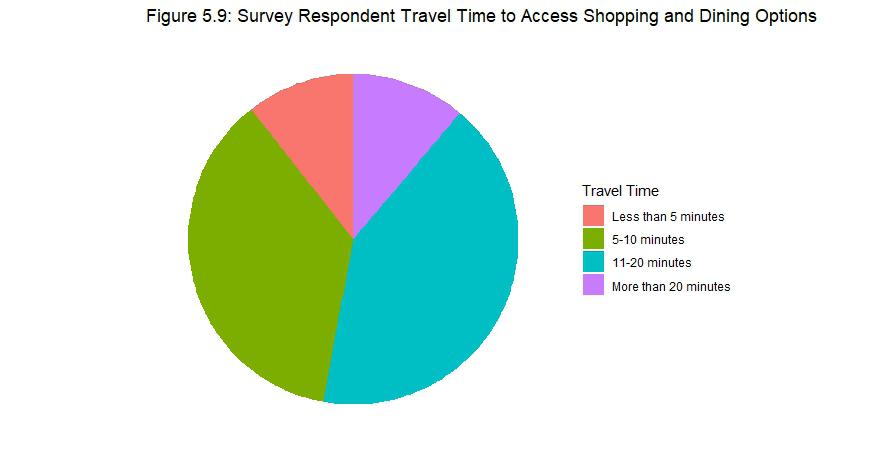
Additionally, it is uncommon for residents to travel more than 20 minutes to access amenities, implying that if their desired amenity is not found in Bensenville, it is found in a nearby community.
• Most respondents, when commuting, drive alone compared to all other mode shares. This is shown in both the survey and reference data.
• Overall, respondents have a higher average perception of safety while walking (8.0) than bicycling (7.1), although in both categories respondents feel relatively safe.
• Lower income groups feel more comfortable walking than cycling, and they feel slightly less safe while cycling compared to higher income survey respondents.

Several questions in the survey spoke to various everyday experiences and concerns of Bensenville residents. Recreation, sustainability, and hopes for the future all fall under community development and are discussed in this chapter.
Recreation
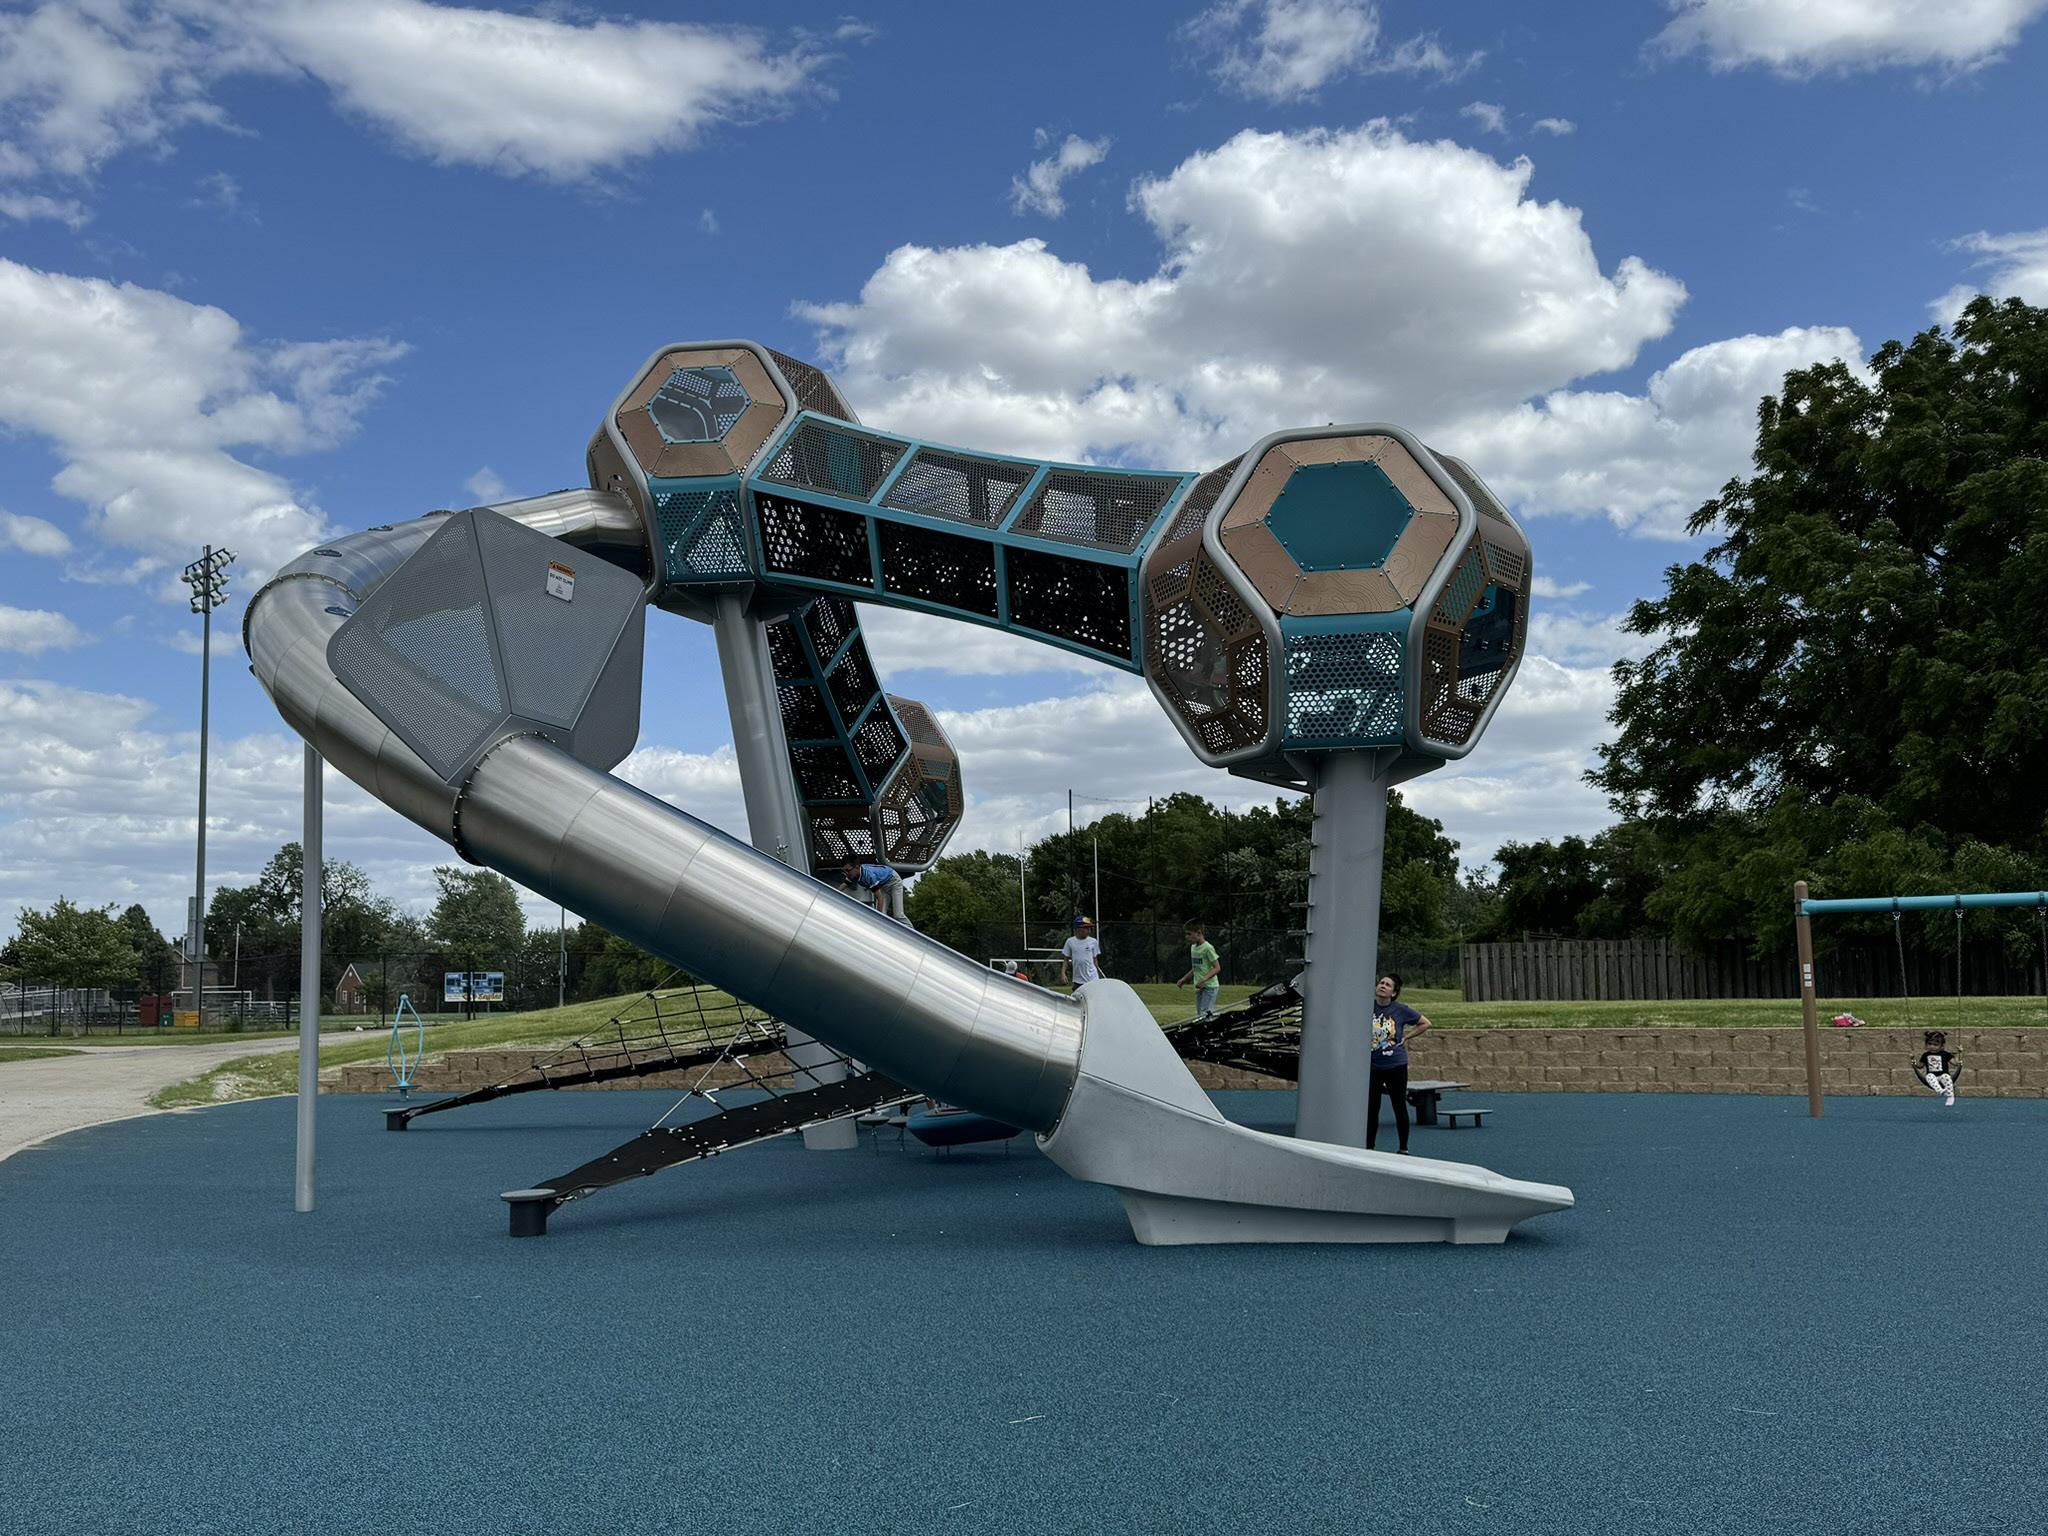
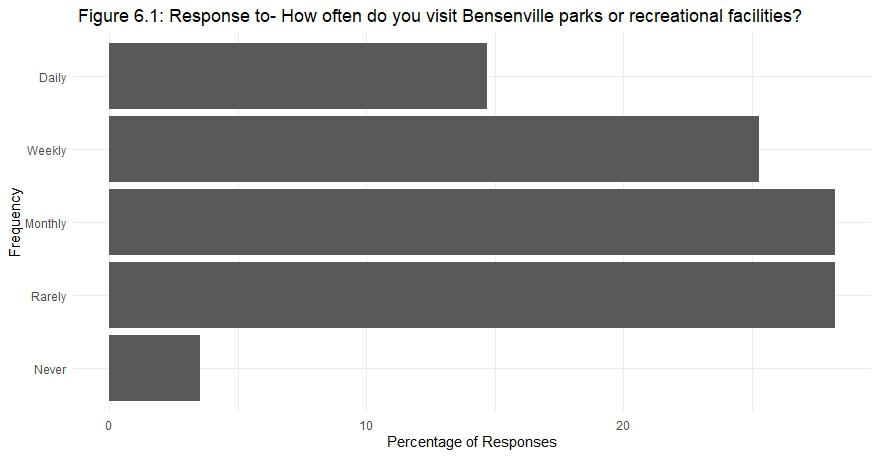
Figure 6.1 shows the frequency at which survey respondents visit Bensenville parks or recreational facilities. No distinction was made between the recreational facilities owned by the Village and the recreational facilities owned by the Bensenville Park District. Survey respondents have a relatively high rate of visitation at these facilities. 26.0 percent of respondents indicated they visit these facilities weekly, with another 28.0 percent visiting at least monthly. Only a low percentage of respondents have never visited any recreational facilities in the Village. The strength and quality of programming offered by both the Park District and the Village is what most likely results in the high visitation rate of Bensenville parks or recreational facilities by survey respondents.
Figures 6.2 through 6.5 relate to sustainability. Since the adoption of the previous comprehensive plan, the Village has been awarded various designations in its efforts to provide a conducive environment for the installation of solar panels and electric vehicle charging stations.
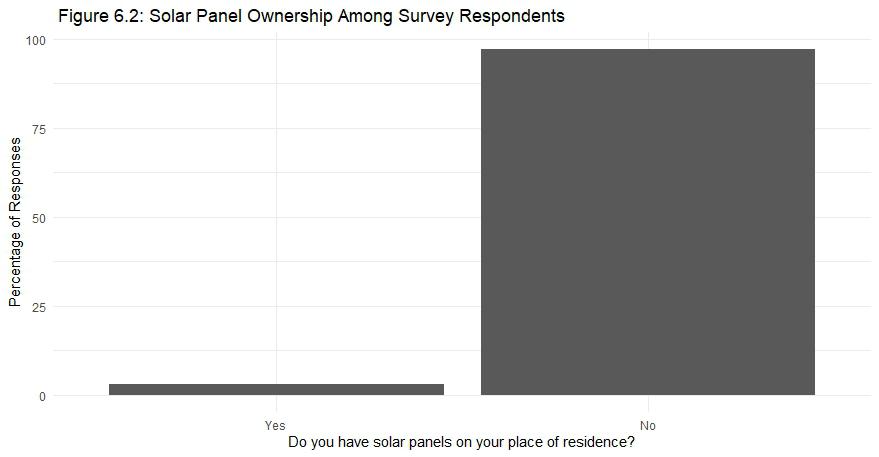
Among survey respondents, there are low rates of solar panel ownership (Figure 5.2). Figure 5.3 respondents are those who indicated that they did not own a solar panel. Of the 97 percent who indicated that they did not own a solar panel, almost a third (29.2 percent) indicated that they would be interested in owning solar panels. There is a clear cap between the number of residents with solar panels and those who wish to have them on their property. No distinction was made between residents who own or rent their residence.
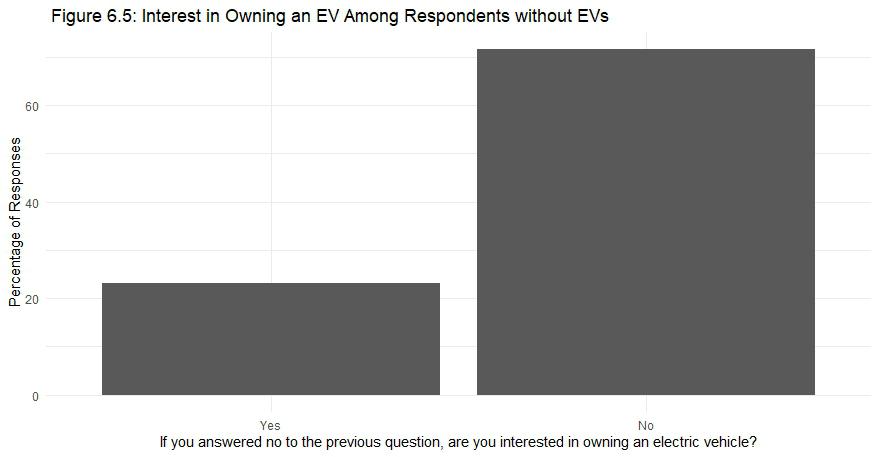
Slightly more survey respondents indicated that they own an electric vehicle (4.5 percent). However, among residents who do not own an electric vehicle, there are lower levels of interest in owning one than compared to those who do not own solar panels and want to own them. Almost a quarter of respondents (22.5 percent) indicated that they do not own an electric vehicle but are interested in owning one. It is unsure why there are lower rates of interest in this topicpotential explanations could be the higher barrier of entry in terms of the financial cost in buying an electric vehicle or uncertainty about the location of reliable charging stations. In the near future, Village-owned properties will be installing EV charging stations.
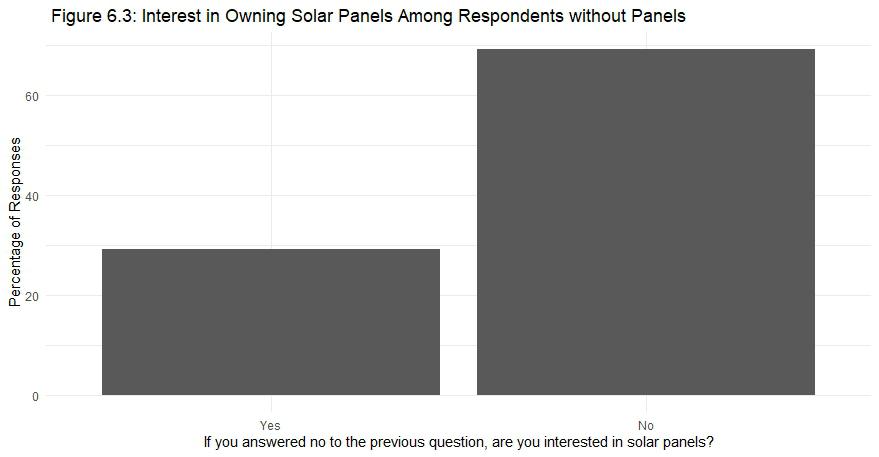
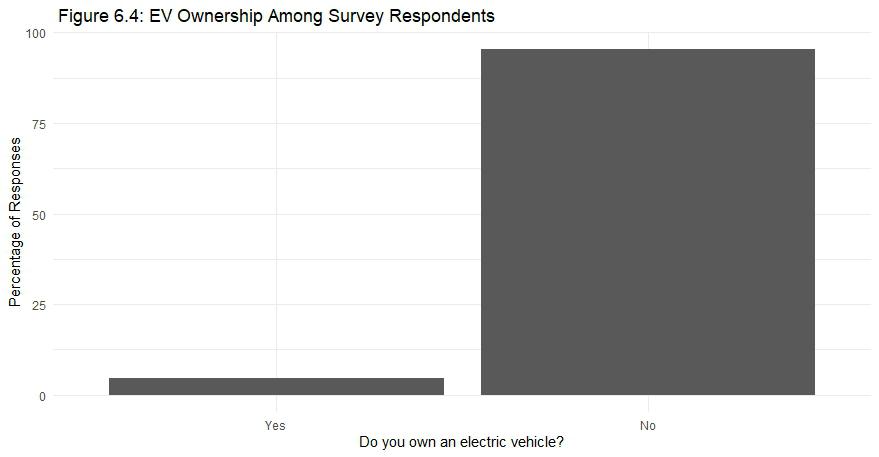
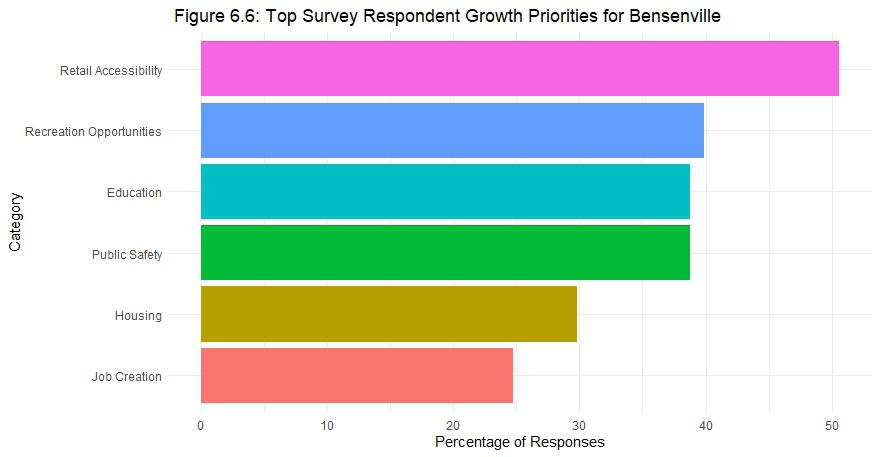
Figure 6.6 showcases priority growth areas for residents that should be focused on in the comprehensive plan. These were all responses provided by Village staffrespondents had the option to select as many as they wish, including an option to fill in their own response. All responses included in Figure 6.6 are responses that gathered over 20 percent of total responses. Many of the free response options submitted by respondents were one-off responses that while also be taken into consideration. Several free response options spoke on improving downtown and the Irving Park Road corridor.
The top priority, receiving a vote from over 50 percent of all respondents, was retail accessibility. Going back to the Transportation chapter, it appears as if depending on the amenity needed, residents often have to leave Bensenville in order to access them. A hardware store was a repeated mention in the free response question, as well as an Aldi. Both of those would fit the character of the Irving Park Road corridor.
Other growth priorities include recreation opportunitiesthat could be measured by the frequency in which residents visit recreational opportunities, or the amount of programming offered- and public safety. Housing was identified as a growth priority, with 30 percent of respondents indicating this.
Potential Home Solid Community Family-Oriented Safe
Good Amazing Awesome Developing Spectacular Family
Resilient Nice Friendly Central Neighborly Growing
Affordabe Evolving Spectacular Tight-Knit Centered
Hometown Diverse Established Quiet Convenient Solid
Pleasant Welcoming Friendly Amazing Comfortable
Family-Friendly What is Bensenville to you? Peaceful
Community Centralized Underrated Hometown Cozy
Variety Excellent Beautiful Recreational Everything
Fantastic Pretty Tranquil Homey Wonderful Hidden Gem
Community-Driven Love Accessible Centrally-Located
Comfy Accessible
Key Findings
• Survey respondents have an overall positive view of Bensenville.
• Survey respondents are interested in residential sustainability programs.
• Increasing retail accessibility is the highest growth priority for survey respondents.
• Bensenville parks and recreational facilities have a high visitation rate among survey respondents.
As part of the engagement process, Village staff wanted to know what places stand out to Bensenville residents as locations where they find a strong sense of community. The following locations, illustrated on the adjacent map, were frequently mentioned by respondents:
• Music in the Park
• The Bensenville Community Public Library
• Redmond Recreational Complex
• Deer Grove Leisure Center
• The Center Theatre
• Fenton High School
• Johnshon School
• Fischer Farms

Through the course of the survey analysis, Bensenville’s strengths and areas of improvement are illustrated as through the eyes of survey respondents. Key takeaways and data points, designed to inform the development of the 2025 Comprehensive plan, were created on a series of topics, namely:
• Housing
• Employment
• Transportation
• Community Development.
While the survey questions fall into the four listed topics above, they are not meant to operate exclusive of each other. Employment informs both transportation and housing policies, and vice versa. Using the data generated by survey respondents holistically will allow Village staff to create the best possible plan in order to guide Bensenville into the future.
Some strengths highlighted by the survey include a wide variety of socio-economic perspectives; residents have a high perception of safety while walking; and Bensenville parks and recreation facilities appear to have a high visitation rate. Some areas of improvement according to survey respondents: increasing retail accessibility is the highest growth priority, especially in downtown and
along the Irving Park Road corridor; respondent perceptionsof housing affordability could be higher; and there is an almost complete reliance on driving when commuting to work. These are just some examples of resident driven data points that will eventually shape policy.
The trends examined in the Existing Conditions Report and the data generated by the resident survey demonstrate where Bensenville has been as well as the direction residents want Bensenville to go. It is the Village’s turn to connect the dots and create a better Bensenville for all stakeholders!
1. What is your address?
a.
2. What do you identify as?
a. Male
b. Female
c. Non-Binary
d. Other
3. Please choose the age range that applies.
a. Under 18
b. 19-25
c. 26-35
d. 36-45
e. 46-55
f. 56-65
g. 65 and older
4. Please choose the income range that applies.
a. $24,999 and under
b. $25,000-$44,999
c. $45,000-$64,999
d. $65,000-$84,999
e. $85,000-$99,999
f. $100,000-$124,999
g. Over $125,000
5. What is your ethnicity?
a. White
b. African American
c. Hispanic or Latino
d. Asian
e. Other
6. What language do you primarily use to communicate?
a. English
b. Spanish
c. Polish
d. Other
7. How long have you lived in Bensenville?
a. Less than 1 year
b. 1-5 years
c. 6-10 years
d. 11-20 years
e. More than 20 years
8. Please choose the most accurate statement.
a. I own my place of residence.
b. I rent my place of residence.
9. On a scale of 1-10, how satisfied are you with the affordability of housing in our community?
a.
10. How much of your monthly income do you spend on housing?
a. Less than 20%
b. 20-30%
c. 30-40%
d. More than 50%
11. Are you currently employed?
a. Yes
b. No
12. Do you work in Bensenville?
a. Yes
b. No
13. What is your main mode of transportation when commuting to work
a. Drive alone
b. Carpool
c. Walk
d. Bicycle
e. Public Transportation
f. Other
14. On a scale of 1-10, please indicate how safe you feel walking in Bensenville.
a.
15. On a scale of 1-10, please indicate how safe you feel bicycling in Bensenville.
a.
16. How far do you travel to access shopping and dining options?
a. Less than 5 minutes
b. 5-10 minutes
c. 11-20 minutes
d. More than 20 minutes
17. How often do you visit Bensenville parks or recreational facilities?
a. Daily
b. Weekly
c. Monthly
d. Rarely
e. Never
18. Do you have solar panels on your place of residence?
a. Yes
b. No
19. If you answered no to the previous question, are you interested in solar panels?
a. Yes
b. No
20. Do you own an electric vehicle?
a. Yes
b. No
21. If you answered no to the previous question, are you interested in owning an electric vehicle?
a. Yes
b. No
22. What type of new businesses or job opportunitites would you like to see developed in Bensenville?
a.
23. What are your top priorities for growth in Bensenville?
a. Housing
b. Transportation
c. Job Creation
d. Public Safety
e. Retail Accessibility
f. Education
g. Recreation Opportunitites
h. Other
24, If you could describe Bensenville in one word, what would it be?
a.
25. Where do you most find community in Bensenville?.
a. White Pines Golf Club
b. Deer Grove Leisure Center
c. The Edge
d. Music in the Park
e. The Center Theatre
f. Redmond Recreational Complex
g. The Bensenville Community Public Library
h. Fischer Farms
i. Sunrise Park
j. Tioga School
k. Johnson School
l. Blackhawk Middle School
m. Fenton High School
n. Zion Lutheran Church
o. St. Alexis
p. Bridgeway of Bensenville
q. Bensenville Heritage Center
r. Other