
VERITAS STEM MAGAZINE OF THE WESTMINSTER SCHOOLS 2023-2024 EDITION ISSUE 07


Celeste Roselli PAGE 3
INTERVIEW WITH RYAN LIVELY
Samanyu Ganesh PAGE 14
RECORD TEMPERATURES ALONG EAST COAST BAFFLE BOTH CLIMATE ACTIVISTS AND COACHES ALIKE.
EFFECTS OF MAJOR SOLAR STORMS ON PUBLIC HEALTH
Alex Sugden PAGE 6
Jerry Guo PAGE 17
IMMINENT SUPERNOVA OF BETELGEUSE WITHIN THE COMING DECADES
EXPLORATION OF THE FERMI PARADOX
Kavya Athota PAGE 8
PREDICTION OF HEART FAILURE
USING RANDOM FOREST AND XG BOOST
Aidan Gao PAGE 19
A BLUEPRINT FOR CLIMATECONSCIOUS ECONOMICS
Tanvi Naik PAGE 11
James Rhee PAGE 23
INCIDENCE OF SPORTS INJURIES AT WESTMINSTER: A 4 YEAR STUDY OF 525 INJURIES

EDITORS-IN-CHIEF
ALEXANDRA KENT
NANDANA AVASARALA
LAYOUT TEAM
KAVYA ATHOTA
CELESTE ROSELLI
SAACHI SINGH
EDITING TEAM
KAVYA ATHOTA
CELESTE ROSELLI
TANVI NAIK
JERRY GUO
ALEX SUGDEN
FACULTY ADVISOR
DR. JULIE PACE
CONTRIBUTORS
CELESTE ROSELLI
ALEX SUGDEN
KAVYA ATHOTA
TANVI NAIK
SAMANYU GANESH
JERRY GUO
AIDAN GAO
JAMES RHEE
As climate change continues to threaten our fragile ecosystem due to exponentially rising CO2 levels, efforts to protect our atmosphere through ongoing research are taking center stage When CO2 collects in our

atmosphere, acting as a greenhouse gas. Greenhouse gasses trap heat from Earth’s surface, which then radiates in all directionsincluding back at Earth’s surface - causing global temperature to greatly increase. Some research to control this phenomenon known as Direct Air Capture (DAC), involves directly removing CO2 from the atmosphere to either sequester in the ground or reuse Unlike regular carbon capture, which takes place primarily where CO2 is emitted (such as a power plant), DAC can be done at any location (Direct) One major proponent of this field is Dr Ryan Lively, a professor at the Georgia Tech School of Chemical and Biomolecular Engineering. After I attended the Georgia Tech Climate Sustainability: Challenges and Solutions workshop, where he gave a keynote presentation on the benefits of Direct Air Capture, I reached out to him, and met with him over zoom to ask him about his research.
1. How did you get into environmental engineering or Direct Air Capture specifically?
“I was in the first year of my PhD and I saw one [program] at the time that was pretty much the only one on carbon capture I said, ‘Oh, that sounds like something that could be interesting’ and went from there I don't think there was any real grand plan, but it's been something that I had been interested in, probably since I was in high school I think I first remember learning about it in AP Environmental Science, and I thought that it was an important issue.”
2. What does your research with Direct Air Capture involve?
“We work on the direct air capture materials, like the things that actually take the CO2 out of the air. That's a lot of material science and engineering. We also work on the cartridge, like the device that does it Then finally, we do a little bit of work on what we call process engineering, which is a subfield of chemical engineering That's actually like what order of operations do you do things at? How does the steam get into the cartridge? Where do you make the steam? How much carbon does the steam release? And so on and so forth.”
3. Awesome! I understand the Direct Air Capture Center Member Meeting was last month at Georgia Tech. What is that, and what does it involve?
“Yeah, it's a great question. So we have a lot of DAC research at Georgia Tech. Georgia Tech probablymight still be, but for quite a while we were the center of the universe for Direct Air Capture because we just had so many projects and people working on it. It occurred to us that we were getting so many questions from folks in industry about Direct Air Capture that maybe the best way to answer all these is to put a big consortium together full of industry members to teach them about DAC and how to actually use it and deploy it. And so, that’s what we did! This year was the second year that we put it on. I think we had like 80 people show up, which is pretty good. Folks from Africa, Australia, Europe, Japan, and all over the US.”
4. So other than Georgia Tech, are there any big hubs for working on direct air capture and that technology?
“Yeah, there are. Arizona State is probably the original. They still have some activities there. Colombia also had a lot… that’s in the U.S. In Europe there's a lot. ETH Zurich is one. They have a lot of effort in this area. But there's actually not so many. That's the thing. Now, one thing you can look up are these so-called DST hubs. These were large, multibillion dollar instruments from the Bipartisan Infrastructure bill. There's four or five of these hubs. The idea is you have a bunch of partners working on Direct Air Capture in different regions around the country. There's a Southeast one, there's a West Coast one, and so on and so forth. The Southeast one I think, is actually in Mississippi. It's called CEDAC, so Georgia Tech is part of that team. But those hubs are not about research, and what we do at Georgia Tech is we're trying to just do research, research, research. The hubs are all about like, ‘Okay, now you actually have to go build the dang thing.’”
5. Speaking about implementation, at the Georgia Tech: Climate Sustainability Challenges and Solutions Workshop, you discussed how DAC technology exists, but the main barrier is economics. What needs to happen to overcome

that, to implement DAC like you’re talking about?
“Yeah, you're exactly right We've been able to take CO2 out of the atmosphere for a long time actually We know how to do that But doing it cheaply is the challenge There are more technology gains to be had, more efficient materials, more efficient processes, finding good sites for Direct Air Capture, where you either have some waste heat nearby or there's abundant renewable energies like geothermal Those will help with running the cost down But at the same time, you need some regulatory thing to help identify and maintain the cost of the carbon Because the thing with CO2 is you ultimately have to think of it like trash, like a waste You don't really make money off of waste But municipalities around the country, they still sign contracts with waste management to come pick up our trash every day We just have assigned a value on picking up trash As soon as we can do that with CO2, that'll help from both angles ”
6. Other than sequestering CO2 on the ground, what other opportunities do you see for using that waste efficiently or reliably?
“Most of it has to go on the ground That's the short version Because we just emit so much CO2 that we can't actually use all of it for anything we could imagine But some non-sequestration uses are to help with greenhouses; there’s vertical farms, urban greenhouses, these types of things They use small amounts of CO2, but it's an easy way to get going A lot of folks are thinking about
upgrading the CO2, primarily to jet fuel, which has been the most popular one, because we're not going to be flying airplanes on batteries The calculations don't work out for that. So, we need some sustainable source of jet fuel and people think CO2 might be able to do that. The challenge is it's just intrinsically expensive because CO2, if you think about it from a chemistry perspective, that's the thermodynamic bottom. It's not impossible. It's just really energy intensive to go all the way back uphill to fuel. But if there's an economic incentive, people will do it.”
7. Other than economic barriers in general, what do you think is the biggest challenge facing environmental engineering and carbon capture technology?
“I mean, since 2018, there’s been a real almost like renaissance in people wanting to do CO2 capture - not just the academic level, but companies around the world are trying to do this. Part of what they need is a little more certainty on just all the rules of the game. The analogy I would use is like, imagine we didn't have the garbage day and the garbage trucks and all the people that do that and all the systems. None of that existed. We were just all piling up garbage behind our house. We all want to get rid of it, but we need some rules and incentives to make it go. And technology can help with a lot of that because, if the solution is cheap enough, people would just go do it ”
8. Final question: What would you say for a high school student who wants to go into carbon capture or environmental engineering; what should they study? Any words of advice, stuff like that?
“Yeah. I mean, I'm a bit biased, but I think chemical engineering is the way to go here. Chemical engineering is one of these disciplines that's amazingly broad. You can work on whatever you want. But these types of global scale problems, they really are the domain of the Chemical Engineer. Because we work on these massive megawatt, gigawatt scale systems
There's this old story that it was a chemical engineer that essentially caused climate change
The Haber Bosch process, where we can make fertilizer from the air that was invented in the 1930s or so. A chemical engineer and a chemist came up with that. And what you can do is you can look at the world populations kind of going up and then the Haber Bosch process got invented, and we put it all over the world, and it went up, because the root cause of climate change is that we just had a ton of people using a ton of energy. So, Chemical Engineers may have caused climate change, but we can probably fix it too.”
Direct Air Capture is still a growing field, but it is a necessary one According to the International Energy Association, 27 DAC plants have been commissioned worldwide, collecting 0 01 megatons of CO2 per year. However, in order for the world to reach the association’s NZE Scenario (pledge for net-zero carbon emissions by 2050), 130 DAC plants need to be built. (Direct) Without concrete steps to fix the environmental change we’ve caused, it will only worsen as time goes on. It’s up to scientists and engineers like Dr. Lively to develop the systems needed to ensure that later generations inherit a better planet than the one we left them.
Although solar storms striking Earth are a relatively common occurrence, large solar storms can have major impacts on public health. These storms can cause damage to individuals, infrastructure and therefore society, all while remaining an obscure and usually unrecognized threat.
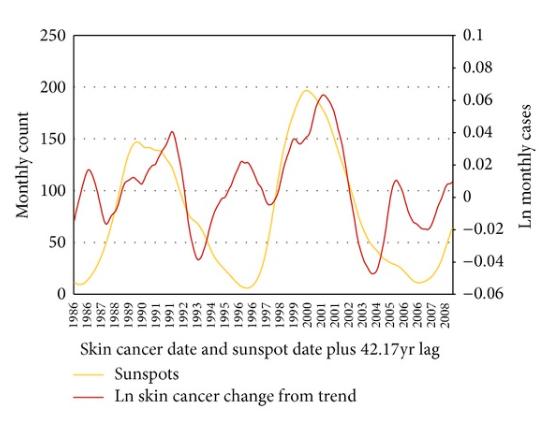
The impact of major solar storms on public health begins with direct effects on the health of individuals. Altogether, these impacts are rather minor. The most notable outcome is an increase in sunburns and other UV ray-related maladies due to an increased number of UV rays coming into contact with members of the public. Major solar storms also pose a threat to astronauts, as more harmful radiation reaches them without the protection of the ozone layer (Valachovic). The correlation between increased solar activity and development of skin cancer has been proven to exist, but the impacts of solar storms on public health is still small compared to indirect impacts due to loss of infrastructure.
(VALACHOVIC, FIG 7)
The effects on infrastructure due to solar storms are wide-reaching and damaging. Most of the effects of solar storms are centered on aerospace, higher-frequency radio and electrical grids (Severe). In 1859, the Carrington Event, a storm that would now rank as a 5 on the NOAA Space Weather G-Scale, caused telegraph systems to fail, inducing electrical shocks on the operators, causing telegraph poles to spark, and allowing operators to communicate with their batteries disconnected for a brief period of time (Kimball). Similarly, a level 5 solar storm today would leave electrical systems disrupted because the electromagnetic field caused by the storm generates an induced current that can damage components, leaving regions without power for up to months. This was proven in 1989 when a smaller solar storm knocked out power for 5 million people in Canada and damaged transformers in the US and the UK (Kirkam). The geomagnetic effects of a solar storm hitting earth go well beyond Earth itself as well, affecting satellites in both low earth and geosynchronous orbit. A large solar storm can interfere with the high-frequency radio used to communicate with these satellites and can create geomagnetically induced currents in undersea internet cables, causing GPS and internet outages worldwide, as well as damaging electrical components within the satellites and sometimes leaving them entirely ineffective, increasing the amount of space junk in Earth’s orbit and inducing costs potentially reaching millions of dollars (Severe). In the same 1989 storm that knocked out power grids in Canada, various companies and states lost track of over 1600 spacecraft.
A solar storm with the intensity of the Carrington event, about 3 times that of the 1989 storm, could leave communication systems devastated (Hapgood) The same field that interferes with satellite communications would interfere with aircraft navigation, leaving aircraft in the air with little choice but to land entirely visually without the help of air traffic control, potentially causing crashes

Although the effect on public health of a level 5 solar storm could be devastating, things are being done to help mitigate the damage. Transformers and other vulnerable components of power grids are being tested against and shielded from predicted effects similar to the solar storm of 1989, and the FAA is creating policies for scenarios akin to those that would be experienced in the event of a major solar storm. Although progress is being made, more action is needed to further mitigate the effects of a major solar storm. Developing new prediction methods for solar storms and decentralizing power generation are good first steps, and more backup systems to help immediately recover critical functions that normally use the internet would help.
Solar storms are a largely obscure threat that can have unfortunate and wide-reaching consequences on individual and public health, from disabling critical systems to disrupting infrastructure and supply chains. While steps are being taken to mitigate their effects, another solar storm akin to the Carrington event of 1859 is inevitable and more needs to be done to reduce its effects on public health and safety (Phillips).
Hapgood, Mike. "Prepare for the Coming Space Weather Storm " Nature, vol 484, no 7394, Apr 2012, pp 311–13 DOI org (Crossref), https://doi.org/10.1038/484311a.
Kimball, D S A Study of the Aurora of 1859 Scientific Report no. 6, Geophysical Institute of the U of Alaska, Apr 1960 University of Alaska, scholarworks alaska edu/bitstream/handle/11122/360 7/GI%20Reports%20109.pdf? sequence=1&isAllowed=y Accessed 21 Nov 2023
Kirkam, H , et al Geomagnetic Storms and Long-Term Impacts on Power Systems Report no PNNL-21033, Pacific Northwest National Laboratory, Dec 2011 PacificNorthwestNationalLaboratory,www pnnl gov/main/publications/external/technical report s/PNNL-21033.pdf. Accessed 26 Nov. 2023.
Phillips, Tony "Near Miss: The Solar Superstorm of July 2012." Edited by Tony Phillips. NASA, edited by SMD Content Editors, 23 July 2014, science.nasa.gov/science-news/science-atnasa/2014/23jul superstorm/ Accessed 20 Nov 2023
Severe Space Weather Events: Understanding Societal and Economic Impacts : a Workshop Report : Extended Summary Washington, National Academies Press, 2009.
Valachovic, Edward, and Igor Zurbenko "Skin cancer, irradiation, and sunspots: the solar cycle effect." BioMed research international vol 2014 (2014): 538574. doi:10.1155/2014/538574
Our universe is over 90 billion light years in diameter, with at least one hundred billion galaxies and around 40 billion habitable planets Based on numbers like that, one would assume the existence of many areas of space sustainable for life, but we have never encountered that life in any space exploration The problem is that everything outside our galactic neighborhood is out of our reach, and it would take billions of years for a spaceship to fly to a far-away galaxy, even if it was going at ideal, impossible speeds.


Although no extraterrestrial life has been found, scientists have created criteria dividing potential extraterrestrial life into three main groups, using a system called the Kardashev scale, comprising of three main groups, or “Types” A "Type 1 Civilization" is a society that can access all the energy available on its planet, and humans are currently 73% of the way to Type 1. (Creighton). "Type 2 Civilizations" include societies capable of harnessing all of the energy of their home star. Although it might seem impossible to do this, scientists have conceptualized methods of doing so, such as the Dyson sphere, a megastructure that encompasses a star with a series of panels which collect energy that can be collected and used. Finally, a "Type 3 Civilization" is a civilization that can control its entire galaxy and its energy If we were to witness an alien race this advanced, they would appear godlike to us ("The Fermi" 2:52) These three main “types”only describe the potential life outside our home planet, and there might be some form of civilization so incredibly advanced that it is better for us not to know it
However, scientists have hypothesized why we have never seen any extraterrestrial life.
During lunchtime conversations in Los Alamos National Laboratory, New Mexico, Enrico Fermi asked why human civilization had never encountered aliens. The universe's unusual silence, also known as the Fermi Paradox, is a problem that asks, where are all the aliens in the universe? If life is abundant on Earth, why haven't we heard from or seen anyone else in our galaxy? Many other intelligent civilizations should be out there based on prior numbers of potentially lifebearing planets However, despite decades of searching, scientists have found no conclusive evidence of extraterrestrial life
Over time, scientists have come up with several potential solutions to the Fermi Paradox, such as infeasibility of space travel, external fear of interstellar conflict, advances in technology allowing aliens to travel to Earth having arisen too recently, and a temporal gap between aliens visiting earth and humankind observing them.
Although the above may be solutions to the Fermi paradox, the two most recognized solutions are a lack of extraterrestrial life, or a barrier keeping all life from gaining interstellar travel Sir Arthur C Clarke said,
Two possibilities exist: Either we are alone in the universe or we are not. Both are equally terrifying. “ ”

A more somber solution compared to others is that we are alone in the universe. Since life on Earth was so complex to create, maybe ours was the only world that happened. Scientists have no evidence of any form of life besides us- so we may be the only ones out there. If we allow life on this planet to die, that means there will be no life left in this entire universe, and life will be gone forever, causing the universe to go silent Frank Tipler, a professor of physics at Tulane University, argues that we are the only life forms in the universe and that life, in general, is too fragile to survive for long in his paper titled "Extraterrestrial intelligent beings do not exist " He also argues that life may be rare because habitable environments are nearly impossible to maintain during the first billion years.
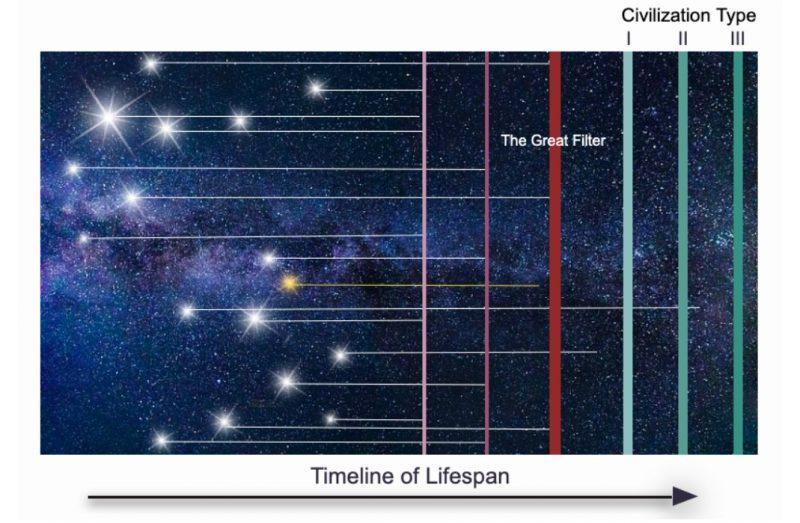
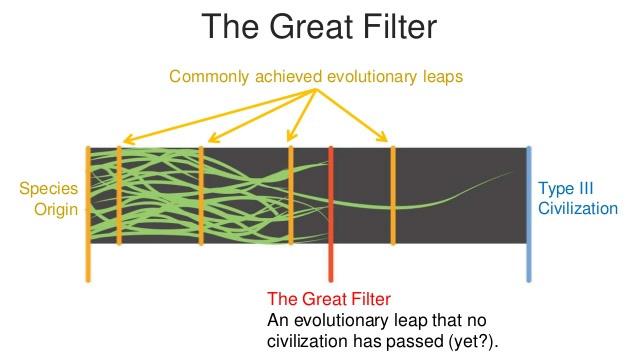
Although most scientists find this theory unlikely, there is a possibility that some event known as a Great Filter is shielding civilizations such as our own from progressing far enough as advanced societies to make contact with others The Great Filter is the idea that some form of catastrophic events (either manmade or natural) will cause/ have caused intelligent life to be eliminated in habitable planets before they could extend their reach and make contact in the universe. The events of the Great Filter resemble a staircase, with each step becoming steeper as you get closer to a wall barricading you from taking the next step. These events could be powerful solar flares, climate change, asteroid impacts, or something of the planet's own doing, such as a nuclear apocalypse As society passes one event, the next becomes even more terminal Overall, the Great Filter represents a step or barrier that reduces the probability of life evolving into a more advanced, space-faring society Scientists have created a list of steps representing the barriers of the Great Filter that our civilization has passed so far (Rogers)
I have simplified the steps leading to the emergence of an advanced civilization below:
6 This step is where humans reached; however, if there is other sustaining life in our galaxy, there is more to the list that we could not imagine yet. The idea of the Great Filter is that at least one of these steps (or any undiscovered ones) is tough to pass, acting as a cosmic filter preventing civilizations from advancing past a certain point and eliminating those who fail to pass it The Great Filter could explain why humans have never encountered any form of intelligent life because they have failed to pass this filter, or even we
Despite scientists' extensive efforts to find any sign of extraterrestrial life in our galaxy, we have not found any conclusive evidence Although some theories suggest that the reasoning behind this cosmic silence only requires a simple explanation, it is crucial to recognize that alien life is a concept with relatively little research to base it on Whatever the explanation, searching for extraterrestrial life remains a complex and captivating scientific endeavor
Adler, Doug "The Great Filter: a possible solution to the Fermi Paradox " Astronomy, Kalmbatch Media, 20 Nov 2020, www astronomy com/science/the-great-filter-apossible-solution-to-the-fermi-paradox/ Accessed 25 Nov 2023
Brennan, Pat. "The Search For Life." Edited by Kristen Walbolt and Travis Schirner. NASA EXOPLANET EXPLORATION, NASA, 9 Feb. 2023, exoplanets.nasa.gov/search-for-life/are-wealone/#:~:text=In%20a%20galaxy%20that%20likely,only %20known%20life%2Dbearing%20world. Accessed 25 Nov. 2023.
Creighton, Jolene "The Kardashev Scale - Type I, II, III, IV & V Civilization " Futurism, Recurrent Ventures, 21 Aug 2019, futurism com/the-kardashev-scale-type-i-ii-iii-iv-vcivilization Accessed 20 Dec 2023
"The Fermi Paradox " Seti Institute, www seti org/fermiparadox-0 Accessed 25 Nov 2023
"The Fermi Paradox — Where Are All the Aliens? (1/2) " YouTube, uploaded by Kurzgesagt– In a Nutshell, 6 May 2015, www.youtube.com/watch? v=sNhhvQGsMEc&t=63s. Accessed 20 Dec. 2023.
Howell, Elizabeth. "Fermi Paradox: Where are the aliens?" Space.com, Future US, 24 Aug. 2023, www.space.com/25325-fermi-paradox.html. Accessed 25 Nov. 2023.
INSIDE THE ISSUES STAFF (2023, March 4) Are we alone in the Universe? UCLA researchers want to know Spectrum News https://spectrumnews1 com/ca/lawest/inside-the-issues/2023/03/04/ucla-researcherswant-to-know--are-we-alone-in-the-universe#:~:text=%E2%80%9CThe%20universe%20is%20so%20v ast,out%20there%2C%E2%80%9D%20Margot%20said Rogers, Kara. "abiogenesis." Encyclopedia Britannica, 12 Oct. 2023,
https://www.britannica.com/science/abiogenesis. Accessed 20 December 2023.
What is the Fermi Paradox? Future US, 5 Dec. 2021, www.livescience.com/fermi-paradox. Accessed 25 Nov. 2023.
Perpetual increases in temperature, extreme weather events, and rising sea levels are all effects of the single largest threat the planet faces today: climate change It’s crucial to recognize that these environmental challenges are not isolated: they are intertwined with another pressing concern - the escalating levels of waste in landfills To address these issues, a comprehensive reevaluation of the global economic structure is imperative, necessitating a transition to an economic model oriented around the environment
The surge in waste production intensifies the environmental crisis Landfills brimming with discarded materials contribute to pollution, soil degradation, and the release of harmful greenhouse gasses The improper disposal of plastics, electronic waste, and other nonbiodegradable materials further intensifies the strain on ecosystems The root of the challenges can be traced back to the prevailing economic model, which often prioritizes short-term gains over long-term sustainability Industries reliant on fossil fuels, deforestation, and intensive resource extraction contribute significantly to greenhouse gas emissions and environmental degradation As a result, the urgent need for a fundamental shift in our economic structures is evident As aforementioned, the current linear economic model of Earth drives climate change, and it must evolve rapidly to support a more sustainable future This model follows a “take-make-dispose” approach, which is fundamentally flawed for a number of reasons First, this one-way flow of materials is unsustainable, contributing
to resource depletion, environmental degradation, and the accumulation of vast amounts of waste. The linear model not only fails to account for the finite nature of resources, but also neglects the environmental impact of extraction, production, and disposal processes Moreover, the linear model perpetuates a throwaway culture, promoting excessive consumption and discouraging responsible resource management This approach worsens issues such as pollution, deforestation, and greenhouse gas emissions, thus accelerating the pace of climate change and biodiversity loss.
For example, the linear approach to the product life cycles of styrofoam cups, commonly found in schools and fast food restaurants, harms the environment. Styrofoam, composed of hydrocarbon polymers derived from petroleum, releases greenhouse gasses during its extraction and production. Once discarded, their persistence in landfills can extend up to 500 years, leading to the accumulation of microplastic pollution. This extended presence in landfills poses a threat to soil and air quality, exemplifying the environmental challenges associated with the linear treatment of disposable items like styrofoam cups

A new, cleaner economic structure is required to properly address climate change, safeguard the environment, and create profit sustainably: a circular economy. First, the model advocates for the elimination of greenhouse gasses through using renewable energy sources Second, it promotes the circulation of products and materials by extending their lifespan, incentivizing companies to design more efficient recyclable products, thus slowing production processes
Lastly, the model emphasizes the regeneration of nature through processes such as anaerobic digestion and composting, and aims to return biodegradable materials to the Earth to reuse them so the need for further mining is reduced. Building on the styrofoam example, the material could be redesigned to utilize naturally sourced biopolymers instead of hydrocarbons. This will eliminate greenhouse gasses in the extraction and manufacturing phases, as hydrocarbons will not be released. Additionally, under the right circumstances, microorganisms can break down the biopolymer-based styrofoam into natural compounds, leaving behind nutrient-rich compost


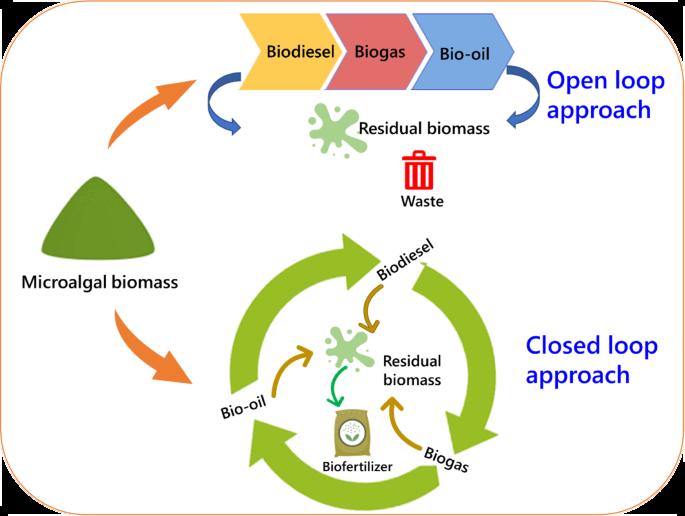
By “closing the loop”, the circular economy aims to reduce environmental impact, decrease resource depletion, and foster economic resilience It represents a transition towards a regenerative and restorative approach, recognizing the interconnectedness of environmental, economic, and social well-being
The benefits of the circular economy are profound and far-reaching. By minimizing pollution and waste, it safeguards biodiversity and human health, potentially preventing the nine million deaths attributed to soil, air, and water pollution each year. Not only does this approach offer environmental advantages, it also boosts the economy, generating an estimated 4.5 trillion dollars. Lastly, the circular economy fosters innovation and will create an estimated six million jobs by 2030 in sustainable practice fields

Despite its significant advantages, it’s important to acknowledge the potential challenges and disadvantages of the circular economy First, the model looks to transform the entire economic structure of the world, thus requiring high initial investment and implementation costs. Additionally, because sustainable end of product life solutions and intricate supply chain adjustments are needed, increased complexities in product design, manufacturing, and distribution are to be expected. Moreover, the circular economy necessitates a shift in mindset, requiring changes in consumer behavior. This includes actively supporting recycling initiatives and redefining perception of ownership. In the context
of the circular economy, redefining ownership involves moving towards models of access over possession, such as leasing, renting, or subscribing to services. Finally, the circular economy will need to overcome resistance to change and potential job displacement
In conclusion, as the global climate situation intensifies, a thorough examination of the world’s economics becomes imperative The recognition of the linear economy’s impact on climate change illuminates the necessity of the circular model
The circular economy has emerged as a promising solution, offering a framework that prioritizes sustainability, minimizes waste, and fosters innovation. The approach comes with its unique set of advantages and challenges that demand careful consideration. Finally, addressing this issue is essential for paving the way toward a more resilient and harmonious future.
WORKS CITED
MCGINTY, D B "5 OPPORTUNITIES OF A CIRCULAR ECONOMY." WORLD RESOURCES INSTITUTE, 2023, WWW.WRI.ORG/INSIGHTS/5OPPORTUNITIES-CIRCULARECONOMY#:~:TEXT=RESEARCH%20SHO WS%20THAT%20THE%20CIRCULAR,STI MULATING%20INNOVATION%20AND%2 0CREATING%20EMPLOYMENT. ACCESSED 26 NOV. 2023.
MOSS, KEVIN. "HERE'S WHAT COULD GO WRONG WITH THE CIRCULAR ECONOMY AND HOW TO KEEP IT ON TRACK " WORLD RESOURCES INSTITUTE, 2023, WWW WRI ORG/INSIGHTS/HERESONG-CIRCULAR-KEEP-IT-TRACK. NOV. 2023.

TERNATIVES AND NS." CRUZ FOAM, OM/POST/TOP-5NATIVES-ANDS-ANDZ%20FORM%20 AN%20 HE%20SAME%20 PROPERTIES. NOV 2023
AR ECONOMY?" UNDATION, 2023, UNDATION.ORG/T -ECONOMYVIEW. ACCESSED 023.
The record-setting heat wave sweeping across the United States has overwhelmed Atlantans, Westminster sports programs, and climate experts alike.
In recent weather reports, meteorologists have been throwing around terms such as “humidity blanket” and “heat dome” to describe the extreme heat faced by Atlanta residents over the last 30 days. Scientific jargon aside, these terms all hint at a rapidly-worsening greenhouse effect the tipping point for climate change could be just around the corner.
GHSA (Georgia High School Association), the governing body of high school athletics statewide, instituted a new “Practice Policy for Heat and Humidity” for the five major sports that occur during the fall season: cheerleading, cross country, football, softball, and volleyball. According to the organization’s official memo, the policy “[follows] modified guidelines of the American College of Sports Medicine in regard to: (1) The scheduling of practices at various heat/humidity levels. (2) The ratio of workout time to time allotted for rest and hydration at various heat/humidity levels. (3) The heat/humidity levels that will result in practice being terminated.”
Essentially, the GHSA’s benchmarks for determining heat and humidity levels revolve around the Wet Bulb Globe Temperature (WGBT)
index. As per the guidelines for the 2023-2024 season, “WBGT readings should be taken every hour, beginning 30 minutes before the beginning of practice.” If the WBGT index peaks above 92.0, all outdoor activities remain prohibited, and the measurement dips under 90.0, the maximum practice time on any given day cannot exceed 1 hour (with a minimum of 20 minutes rest distributed throughout the practice duration)
Coach Mitchell Griest, a member of Westminster’s computer science department, has had to adapt to these guidelines as a cross country coach while still maintaining the appropriate standard of mileage for his runners: “We’ve had to get in interval training in the early mornings,

but now [as of the week of September 11] we’re happy to be training in the afternoon as it cools off ” Coach Griest works alongside AP Biology teacher Jason Vuckovic, sports journalist and Westminster alum Ricky Dimon, and Coach Joe Tribble, the longest-tenured and most decorated head coach in the program’s history.
“Over the course of the current heat wave, the average temperature has risen about a degree Fahrenheit,” explained Mrs. Caitlin Wilson, an AP Environmental Science teacher and director of the Iceland travel program offered to Westminster’s rising sophomores. Wilson also outlined the myriad factors that exacerbate global warming, specifically citing ocean absorption among the

chief culprits of the ongoing extreme weather event: “Water has a specific heat capacity of 4.186 J/g°C, much greater than that of air (1.012 J/g°C), meaning it can absorb more heat per unit of mass than air can The colder the oceans are, the more heat they can absorb from the atmosphere simply because the temperature difference is greater The warmer they are, the less they are able to take in and retain ” In this manner, our oceans have grown less able to trap heat, allowing warmer air to circulate along coastlines.
Furthermore, Wilson had much to offer pertaining to the “heat island effect,” a paradigm that goes hand-in-hand with urbanization in metropolitan areas such as downtown Atlanta and its suburbs. “Heat islands are created when natural vegetated environments are replaced by surfaces like concrete in buildings and roadways that do not reflect or absorb heat in the same way,” said Wilson. Compared to urban areas, forests act as far superior temperature regulators by providing shade, as well as through the process of evapotranspiration
Wilson described, “In evapotranspiration, trees and other plants take in water through their roots and transpire it out into the atmosphere as water vapor through their leaves. This acts like a mister on a hot day, cooling organisms around it.” Simply, more trees and greenery in our surroundings could work to alleviate the stresses imposed by climate change on our local temperatures
Wilson also listed altered bird migration patterns as a tangible effect of global warming on ecosystems and wildlife The dates of migration, tracked by ornithologists and other scientists, have been trending earlier and earlier in the year, leaving experts to believe that summertime temperatures have eclipsed the habitable zone for these avian species’ heat tolerance.
“I would love to see the full conversion of fossil fuel energy systems to renewable sources,” expressed Wilson, when asked about Iceland’s sustainability regimes and how they could inform the implementation of preventative measures on the homefront. “There’s an abundance of resources on the geographic east coast available for renewable use in our power grids: wind, solar, hydroelectric, and even geothermal in certain hotspots, although we can’t make use of geothermal like Iceland does ”

For students passionate about the environment and taking a stand against climate change, the EcoClub provides an opportunity for service and advocacy to Upper School students. “The past few years we've been trying to get recycling back since the recycling bins placed around campus are used as regular trash cans We need the entire student body to contribute to the cause and take responsibility as the main reason why the school isn't recycling is because people aren't sorting their trash out properly,” said Claire Kim, one of the three club leads ”
“I used to live in Missouri,” explained Claire “Its geography consists mostly of flat prairie regions and it has a large grasshopper population, or it used to. In 4th grade, I started noticing how there was a significant decline in the grasshopper numbers compared to when I first moved there.” From this simple observance, Claire developed a passion for preserving our environment, and now more than ever, spreading awareness is crucial.

As this crisis deepens, the question of hour becomes more and more apparent: has our society reached a point of no return in terms of global habitability and climate change?


Mrs. Wilson offered her take on the transpiring situation in the context of the current heat wave: “It is really hard to say when the exact point of no return might be, but there is research on nine planetary boundaries which have been identified as critical to healthy living conditions for all organisms The nine boundaries are: stratospheric ozone depletion, biodiversity loss and extinctions, chemical pollution, climate change, ocean acidification, freshwater consumption, land change, nitrogen and phosphorous flows to the ocean, and atmospheric aerosol loading As you can see, climate is just one of the nine major categories that life on earth depends on. These researchers estimate that climate change has not yet passed the ‘tipping point’ to where earth systems are severely disrupted, but that it is heading in that direction and that we are currently in a zone of uncertainty.”
This article first appeared in the Westminster BiLine. See it there at www.thebiline.com.
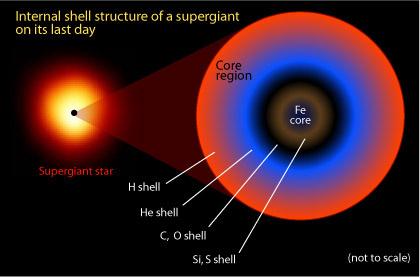
A paper published by Hideyuki Saio and collaborators claims that the star Betelgeuse could go supernova within the next few decades. They conclude, “Betelgeuse is likely in the late stage of core carbon burning and a good candidate for the next Galactic Type II supernova ” This is particularly exciting because of the short timeframe predicted In astronomy, time is usually measured from hundreds, millennia, millions, to billions of years, so to have an event that is only a couple of decades away is completely exciting However, it is vital to keep in mind that as of the writing of this article, this paper has not yet been peer-reviewed.
Betelgeuse, or Alpha Orionis, is a red supergiant in the Orion constellation. It is one of the most massive stars ever discovered, being almost 700 times larger and 15 times more massive than our sun. If it were to replace our sun, Betelgeuse would go beyond Jupiter's orbit, completely swallowing up the terrestrial planets of our solar system Stars that are placed within the classification of “red supergiant” are deemed to be nearing the end of their lifespan
Saio and collaborators’ claim stems from the “pulsation periods” or regular changes in brightness of Betelgeuse. These changes in brightness are caused by the constant battle between the pressure of the gas within the star produced through nuclear fusion pushing outward and the star's gravitational force pushing inwards. Using the pulsation period, Saio and collaborators created a model that showcases the conditions

Size comparison: Betelgeuse and the Sun European Southern Observatory, https://www eso org/public/images/potw1726b/
necessary for the pulsations. These models show that Betelgeuse no longer fuses hydrogen into helium but carbon into other heavier elements
A star is a massive ball of hydrogen and helium held densely together through self-gravity Throughout a star’s life cycle, most of it will be spent in what is called the “main sequence” stage The main sequence stage is defined by the method in which they create energy, which in the case of main sequence stars through hydrogen fusion into helium This is the current stage that our sun is in. However, once a star runs out of hydrogen to fuse, it will leave the main sequence stage and enter the post-main sequence stage. During this period, the star will undergo many
different changes externally and internally. The star will become a red giant and expand in diameter, increase in luminosity, and cool in temperature. However, if a star is large enough, as with Betelgeuse, it will become a red supergiant. Unlike red giants, red supergiants have enough mass to create a greater gravitational force, thus increasing the temperature of the core, which leads to the fusion of helium into heavier elements
Helium fuses into carbon, carbon fuses into magnesium and neon, magnesium and neon fuse into silicon, and silicon fuses into iron; fusing iron takes more energy than is produced, thus leading to the gravitational forces crushing in, leading to a supernova
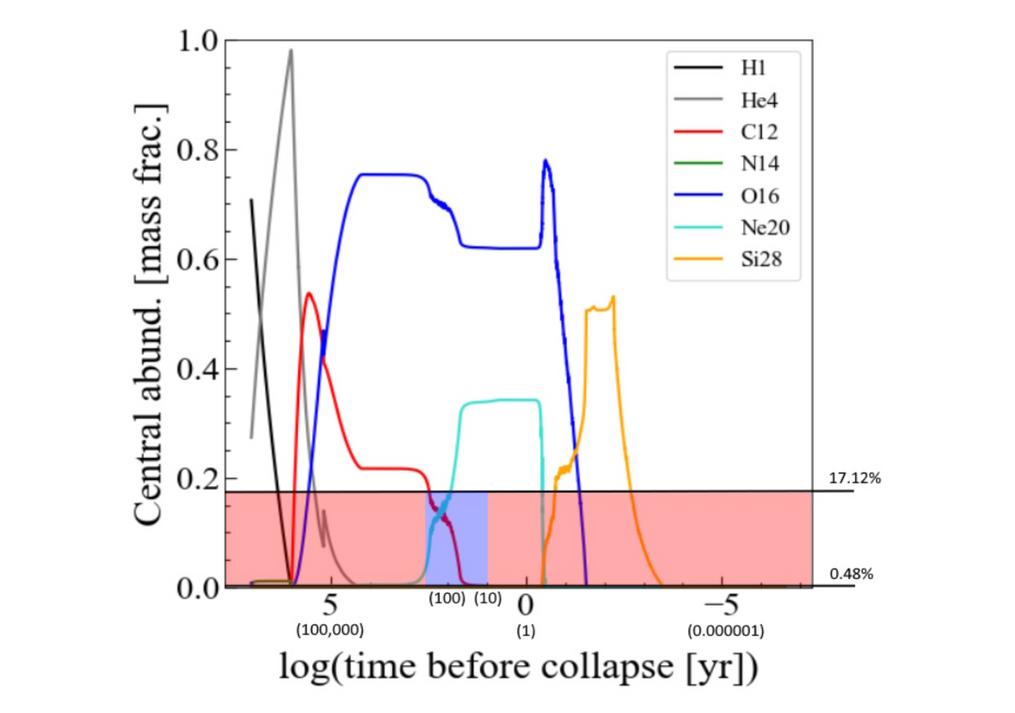
In their study, Saio and collaborators show a model which plots the abundance of an element within a star and the years before its collapse. It can be seen that as hydrogen goes down helium goes up, when helium goes down carbon goes up, and so on By using the abundance of carbon included within the study, it can be concluded that a supernova is possible between 10 and 100 years before Betelgeuse's collapse
Betelgeuse’s supernova is important to astronomers today because it will be the first supernova in the Milky Way to be visible from Earth by the naked eye since 1604. The opportunity for scientific study of a supernova as close as Betelgeuse, which is only 600 light years away compared to the 1604 supernova, which was around 20,000 light years away, is immense Additionally, the opportunity for us to even see the supernova, which may be so bright that it is visible during the daytime, is truly a once-in-a-lifetime opportunity Of course, as mentioned previously, this study has not been peerreviewed and it is only uses best-fit models Additionally, this is all speculation until Betelgeuse goes supernova However, just knowing that we may experience this event within our lifetimes is exciting.
Betelgeuse, www gb nrao edu/~rmaddale/Education/OrionTourCe nter/betelgeuse html Accessed 24 Nov 2023
“Main Sequence Stars ” Main Sequence Stars, 7 June 2023, www.atnf.csiro.au/outreach/education/senior/astroph ysics/stellarevolution mainsequence.html.
Saio, Hideyuki, et al. “The evolutionary stage of Betelgeuse inferred from its pulsation periods.” Monthly Notices of the Royal Astronomical Society, vol. 526, no. 2, 2023, pp. 2765–2775, https://doi.org/10.1093/mnras/stad2949.
“Stellar Evolution ” Aavso, www aavso org/stellarevolution Accessed 24 Nov 2023
“What Is Your Cosmic Connection to the Elements?” NASA, NASA, imagine gsfc nasa gov/educators/elements/imagine/ 05 html#:~:text=The%20star%20then%20becomes%20 a,two%20carbon%20atoms%20into%20magnesium Accessed 24 Nov. 2023.
Abstract
Heart Failure (HF), a type of Cardiovascular Disease (CVD), is a prevalent illness that can lead to hazardous situations Each year, approximately 17 9 million patients globally die of this disease It is challenging for heart specialists and surgeons to predict heart failure accurately and on time Fortunately, there are classification and prediction models available that can assist the medical field in efficiently using medical data The objective of this study is to enhance the accuracy of heart failure prediction by prediction modeling a Kaggle dataset composed of five sets of data over 11 patient attributes Multiple machine learning approaches were utilized to understand the data and forecast the likelihood of heart failure in a medical database The results and comparisons show a definite increase in the accuracy score of predicting heart failure Integrating this model into medical systems would prove beneficial for aiding doctors predictions of heart disease in patients
Introduction
The primary cause of heart stroke is the obstruction of arteries, also known as cardiovascular disease or arterial hypertension [1]. Heart disease affects approximately 26 million people worldwide, and this number is expected to rise rapidly if effective measures are not taken [2]. Unhealthy food, tobacco, excessive sugar, and obesity are common contributors to heart disease [3]. Pain in the arms and chest are common symptoms, but the disease often presents with different symptoms based on sex and age. In
addition to maintaining a healthy lifestyle and diet, timely diagnosis and comprehensive analysis are critical factors in identifying heart disease However, many patients undergo multiple tests that can be physically and financially burdensome. Proper analysis of this type of data can improve the diagnosis process and assist heart surgeons. Previous research has used various techniques such as Random Forest, Support Vector Machine, and other AI classification models [4]. This study aims to surpass previous studies’ random forest model accuracy in order to better predict heart failure before it manifests.
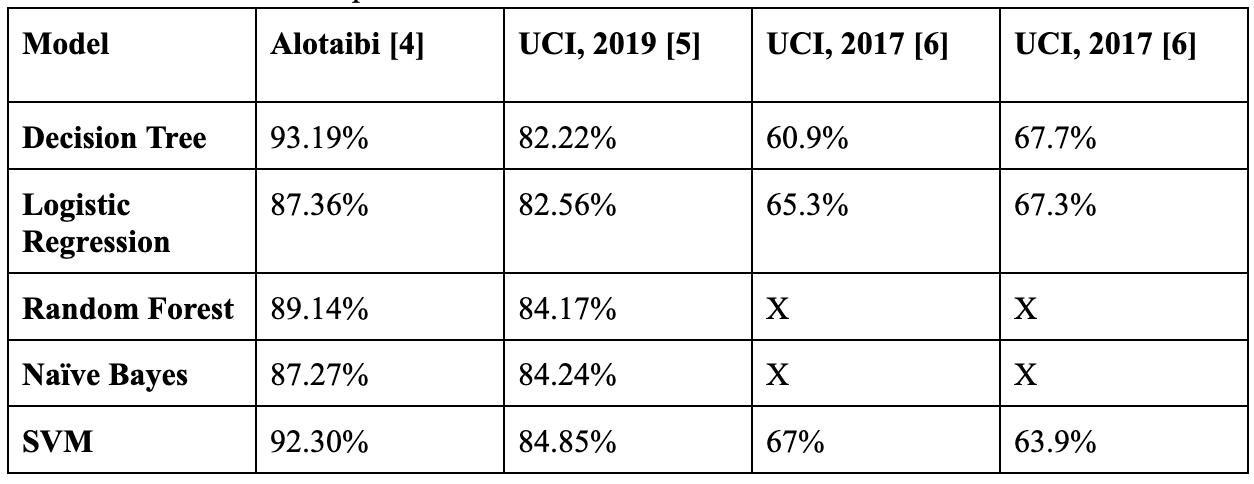
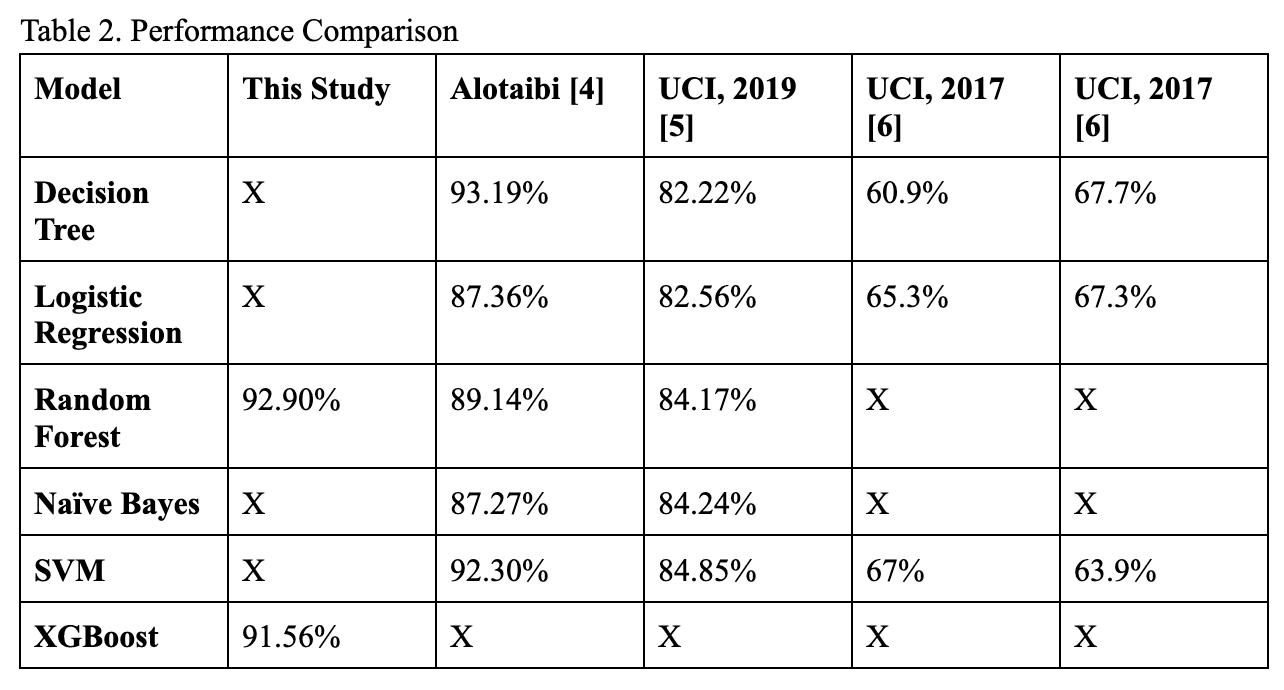
Previous work has utilized a subset of the dataset used in this paper to predict heart failure The University of California Irvine (UCI) used Decision Tree, Logistic Regression, Random Forest, Naïve Bayes, and SVM reaching results around the ~85% accuracy mark. Through the use of tenfold cross validation and an enlarged dataset, previous studies have enhanced the accuracy of the UCI models (see Table. 1) [4].
The dataset utilized in this paper is collected from Kaggle under the name “Heart Failure Prediction Dataset” [7]. The dataset combines five datasets with over 11 common attributes. These five datasets combine data from Cleveland, Hungarian, Switzerland, Long Beach VA, and Stalog datasets. In total, the dataset contains 918 rows. Row definitions are provided below:
Age: age of the patient [years]
1. Sex: sex of the patient [M: Male, F: Female]
2. ChestPainType: chest pain type [TA: Typical Angina, ATA: Atypical Angina, NAP: NonAnginal Pain, ASY: Asymptomatic]
3. RestingBP: resting blood pressure [mm Hg]
4. Cholesterol: serum cholesterol [mm/dl]
6.
5. FastingBS: fasting blood sugar [1: if FastingBS > 120 mg/dl, 0: otherwise]
7. MaxHR: maximum heart rate achieved [Numeric value between 60 and 202]
RestingECG: resting electrocardiogram results [Normal: Normal, ST: having ST-T wave abnormality (T wave inversions and/or ST elevation or depression of > 0.05 mV), LVH: showing probable or definite left ventricular hypertrophy by Estes' criteria]
8. ExerciseAngina:
Before putting the data into the model, data preprocessing methods are applied in order to make it useful for modeling [8]. Binary values, such as sex, were converted to binary numbers (1 and 0). ExerciseAngina was converted to binary as
well. One hot encoding was employed in ChestPainType. The ordinal encoder from SKLearn was employed in the ordinal variables, ST Slope and RestingECG This research focuses on two models to predict heart disease: Random Forest and XG Boost Random Forest was implemented with the goal to surpass previous research accuracy with its cross-validation score XGBoost was also implemented as a popular model among many Kaggle dataset winners Both models were cross-validated ten times across an 80-20 split of training and test data, respectively. In order to further increase accuracy, HyperOPT [9] and RandomizedSearch [10] were used to finetune the hyperparameters for XGBoost and Random Forest, respectively.
The Random Forest algorithm is utilized to address classification issues Its approach is based on ensemble learning, which combines multiple classifiers to enhance the algorithm's performance The algorithm is composed of several Decision Trees classifiers to create a forest [11], each working on a subset of data, and the average is calculated to improve prediction accuracy. Rather than relying on the prediction of a single tree, the Random Forest algorithm combines the trees using an estimated outcome and voting procedure [12]. The model then considers predictions from each tree and determines the outcome based on majority voting.

XGBoost
XGBoost, which stands for "Extreme Gradient Boosting," is a popular machine learning model that has been used for a variety of tasks such as regression, classification, and ranking. XGBoost creates a model in the form of boosting an ensemble of weak classification trees by gradient descent which provides optimization to the loss factor [13]. It is an ensemble learning algorithm that combines multiple decision tree models to improve the accuracy and robustness of predictions. XGBoost has gained popularity due to its speed, scalability, and performance. It uses a gradient-boosting framework and can handle missing values, regularization, and parallel processing. Additionally, it has various hyperparameters that can be tuned to achieve better performance. Overall, XGBoost is a powerful machine learning model that is widely used in industry and academia.
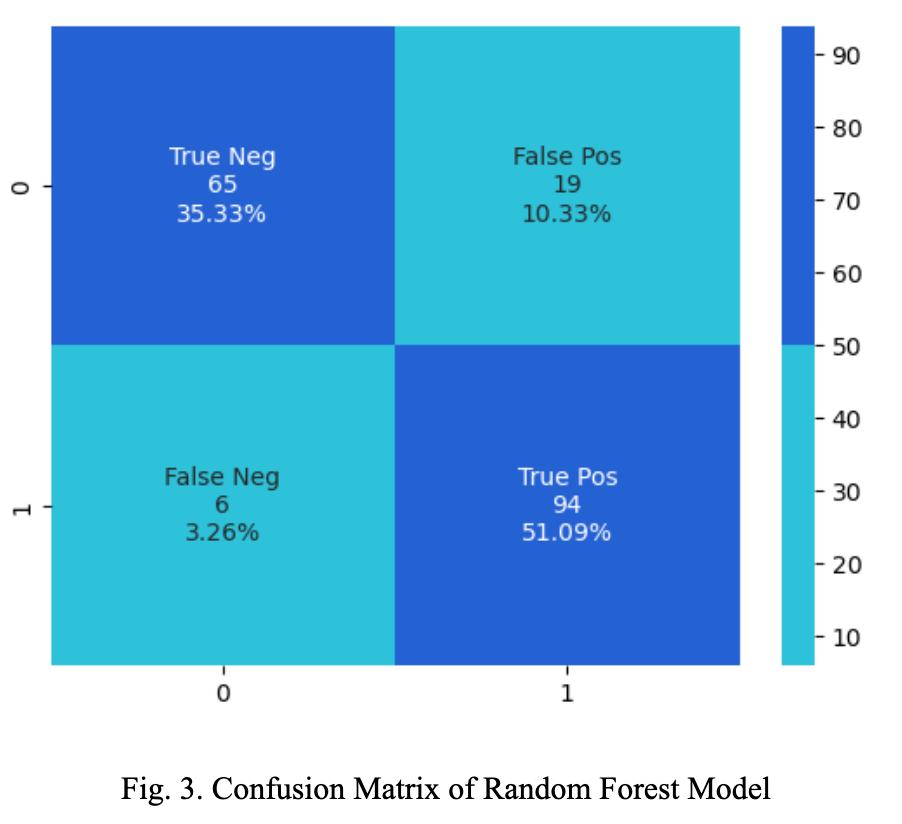
When looking at binary classification problems, there are four relevant metrics: true positives, true negatives, false positives, and false negatives. Out of these four metrics, the most harmful to prediction would be false negatives, or results that report no risk of heart failure despite the patient being at risk. The goal of this research was to reduce the number of false negatives and false positives in order to improve accuracy in
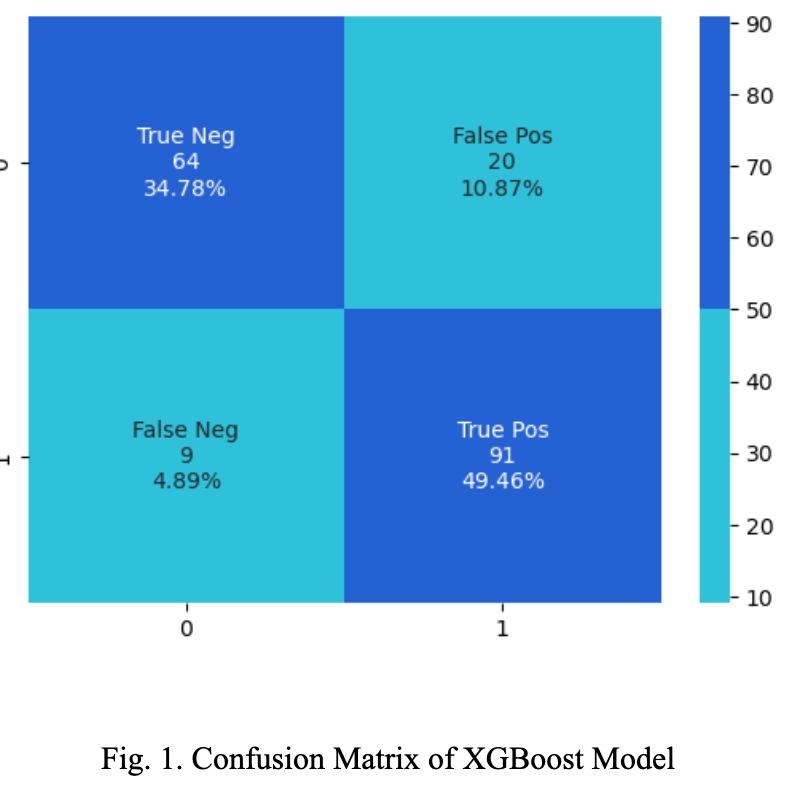
predicting heart disease. Using these models and methods, the result was 91.56% accuracy after cross validation for XGBoost, with 9 false negative cases out of 181 cases (see Fig. 1). In Random Forest, there was 92.90% accuracy after cross validation with 6 false negatives out of 181 cases (see Fig 2) In comparison to Alotaibi (2019), Random Forest performed considerably better, increasing from 89 14 to 92 90% accuracy The accuracy increase may be due to the hyperparameter tuning for Random Forest or the cross-validation method Also taken into consideration is the artificial addition of rows. In Alotaibi (2019), the size of the Cleveland data was too low to implement machine learning approaches. Alotaibi increased the size of the data artificially by randomizing values between minimums and maximums. The issue with randomizing these values is that there is no way to tell whether the target value is right for the artificial patient, thus creating noisy data that is useless for the model This causes much of the data to carry either a random target value or no target value, which would cause the accuracy of the model to go down
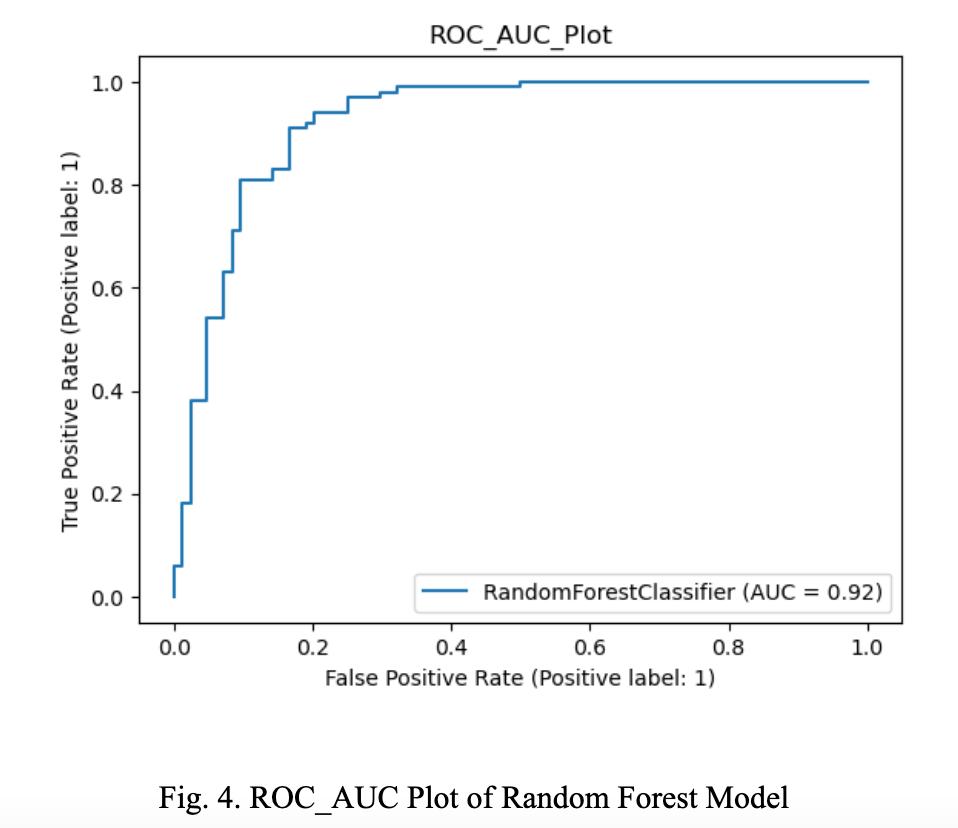
Another metric used in binary classification problems is the ROC curve, or the area under the receiver operating characteristic, a common metric for evaluating binary classification models. A model with a higher AUC is thought of as a better model [14]. This value was 0.92 for XGBoost and Random Forest. Both models performed well in
terms of accuracy and the area under the ROC curve, indicating their effectiveness in predicting heart disease
The results of this study demonstrate that machine learning models, specifically Random Forest and XGBoost, can be used to accurately predict heart disease By integrating these models with medical information systems, it is possible to obtain live data from patients and make predictions in real time This can be particularly helpful in detecting heart disease early and improving patient outcomes However, it is important to note that these models are based on historical data and may not be able to predict heart disease in all cases Furthermore, the dataset used in this study is limited in size and may not be representative of the general population Future research should focus on expanding the dataset and exploring other machine learning models to further improve the accuracy of heart disease prediction
Heart failure is a significant health issue that affects millions of people worldwide Machine learning models, specifically Random Forest and XGBoost, can be used to accurately predict heart failure based on medical data These models can be integrated with medical information systems to improve the accuracy of predictions and assist healthcare providers in detecting heart disease early
[1] CARDIOVASCULAR DISEASES WORLD HEALTH ORGANIZATION WORLD HEALTH ORGANIZATION HTTPS://WWW WHO INT/HEALTHTOPICS/CARDIOVASCULAR-DISEASES#TAB=TAB 1 ACCESSED 15 MARCH 2023
[2] G SAVARESE AND L LUND, GLOBAL PUBLIC HEALTH BURDEN OF HEART FAILURE,‖ CARD FAIL REV , VOL 3, NO 1, 2017
[3] E J BENJAMIN, P MUNTNER, AND ET AL ALONSO, ALVARO, HEART DISEASE AND STROKE STATISTICS 2019 UPDATE: A REPORT FROM THE AMERICAN HEART ASSOCIATION,‖ CIRCULATION, VOL 139, NO 10, 2019
[4] FAHD SALEH ALOTAIBI. IMPLEMENTATION OF MACHINE LEARNING MODEL TO PREDICT HEART FAILURE DISEASE 10 (2019), NO 6, 261-268, 10 14569/IJACSA 2019 0100637
[5] S BASHIR, Z S KHAN, F H KHAN, A ANJUM, AND K BASHIR, IMPROVING HEART DISEASE PREDICTION USING FEATURE SELECTION APPROACHES,‖ IN 16TH INTERNATIONAL BHURBAN CONFERENCE ON APPLIED SCIENCES AND TECHNOLOGY (IBCAST), 2019, PP 619–623
[6] S EKIZ AND P ERDOGMUS, COMPARATIVE STUDY OF HEART DISEASE CLASSIFICATION,‖ IN 2017 ELECTRIC ELECTRONICS, COMPUTER SCIENCE, BIOMEDICAL ENGINEERINGS’ MEETING, EBBT 2017, 2017, PP 1–4
[7] FEDESORIANO (SEPTEMBER 2021) HEART FAILURE PREDICTION DATASET. RETRIEVED FEBRUARY 25, 2023 FROM HTTPS://WWW.KAGGLE.COM/FEDESORIANO/HEART-FAILURE-PREDICTION.
[8] F AL-MUDIMIGH, A S , ULLAH, Z , & SALEEM, A FRAMEWORK OF AN AUTOMATED DATA MINING SYSTEMS USING ERP MODEL ,‖ INT J COMPUT ELECTR. ENG., VOL. 1, NO. 5, 2009.
[9] KOMER, B , BERGSTRA, J AND ELIASMITH, C , 2019 HYPEROPT-SKLEARN AUTOMATED MACHINE LEARNING: METHODS, SYSTEMS, CHALLENGES, PP 97111
[10] AGRAWAL, T (2021) HYPERPARAMETER OPTIMIZATION USING SCIKITLEARN IN: HYPERPARAMETER OPTIMIZATION IN MACHINE LEARNING APRESS, BERKELEY, CA HTTPS://DOI ORG/10 1007/978-1-4842-6579-6 2
[11] N. DONGES, THE RANDOM FOREST ALGORITHM,‖ TOWARDS DATA SCIENCE, 2018
[12] S S BASHAR, M S MIAH, A H M Z KARIM, A AL MAHMUD, AND Z HASAN, A MACHINE LEARNING APPROACH FOR HEART RATE ESTIMATION FROM PPG SIGNAL USING RANDOM FOREST REGRESSION ALGORITHM,‖ IN 2019 INTERNATIONAL CONFERENCE ON ELECTRICAL, COMPUTER AND COMMUNICATION ENGINEERING (ECCE), 2019, PP 1–5
[13] CUI, Y , CAI, M AND STANLEY, H E , 2017 COMPARATIVE ANALYSIS AND CLASSIFICATION OF CASSETTE EXONS AND CONSTITUTIVE EXONS. BIOMED RESEARCH INTERNATIONAL, 2017
[14] JAVEED, A , ZHOU, S , YONGJIAN, L , QASIM, I , NOOR, A AND NOUR, R , 2019 AN INTELLIGENT LEARNING SYSTEM BASED ON RANDOM SEARCH ALGORITHM AND OPTIMIZED RANDOM FOREST MODEL FOR IMPROVED HEART DISEASE DETECTION IEEE ACCESS,
Objective: This study examined two primary research questions. First, what are the most common sports related injuries at Westminster? Second, of the injuries that are most common, which of them are preventable and what does current literature show are the optimal methods of prevention?
Method: A retrospective study was conducted on sports-injury data collected by Westminster’s athletic trainers. This data contained reported sports-related injuries from Westminster highschoolers during the period 2019-2023. The data was de-identified, categorized, and standardized. All injuries occurring in both games and practices were included, if they were during the period of the study. Data collected included date of injury, gender of injured player, sport name in which the injury occurred, level of the team (varsity or junior varsity), body part where the injury occurred, and injury type.
Results: During the four-year period, 525 sports-related injuries occurred at Westminster high school sporting events. Of these, 399 of the injuries were male and 126 were female. The difference in injury rates between males and females were statistically different. Football accounted for 60% of all
Female soccer accounted for the most injuries in all female sports. For both males and females, sprains of the ankle and strains of the hamstring or hip and pelvis were the first and second most common injury types respectively. Extensive literature research shows that these common injuries, ankle sprains and hamstring strains, are preventable to an extent.
Discussion: Extensive research shows that the two most common injuries at Westminster are preventable to an extent. The implementation of hip strengthening exercises, dynamic warmups, and proprioceptive training into Westminster’s athletic curriculum can potentially be beneficial in reducing ankle sprains. In the case of hamstring sprains, the nordic hamstring exercise, low to high velocity training, and FIFA 11+ program can reduce the incidence of hamstring sprains. The adoption of the outlined preventative strategies can benefit Westminster significantly. Future studies can be done to implement and find more methods of locating athletes that are at higher risk of injury and use AI to tailor preventative strategies.
Across the country, sports-related injuries among high school athletes are very common and can have profound consequences. In fact, over five million sports-related injuries have occurred in the past four years (Searing 2023). Sports injuries in high school athletes can result in missed play time, suboptimal play, and student discouragement. More than 20% of injured athletes were unable to return to play for a season or longer due to injury (Searing 2023). In addition, these injuries have impacts beyond the playing field, potentially even leading to school absences and depression. Although certain types of injuries, such as those related to collisions or trauma, may not be preventable, other injuries may be. In fact, research shows that some of the most common non-contact sports-related injuries can be prevented (Al Attar, Soomro, Sinclair, Pappas, and Sanders 2017).
Three main points arise from the relevant research that has already been conducted on this subject. First, high school sports-related injuries are frequent in the United States. According to research conducted by Johns Hopkins Medicine, over 3.5 million youth (14 and under) sports-related injuries occur each year (Sports Injury 2019). Of the sports played, American football leads in injury incidence, by contributing up to 44% of all injuries, followed by soccer (Searing 2023).
Second, both sports–American football and soccer–are plagued by sprains and strains, which collectively account for 37% of all sports injuries in the past four years (Searing 2023). Ankle sprains and hamstring strains appear to be frequent, and hamstring injuries (HSI) are the most common non-contact injury in all of sports (Al Attar, Soomro, Sinclair, Pappas, and Sanders 2017). Of note, ankle sprains are the most frequently occuring musculoskeletal injury in all of sports (Delahunt, Bleakley, Bossard, Caulfield, and Docherty 2018).
Third, many sports teams appear to be either uneducated on injury prevention or fail to implement the proper training and procedures to protect their athletes from injury. Researchers found that the majority of amateur soccer teams do not carry out the proper neuromuscular training (NMT) to prevent ACL injuries and ankle sprains (Rommers, Rössler, Tassignon, Verschueren, and De Ridder 2022). This is further corroborated by other authors who found that soccer coaches and players need better instruction on injury prevention strategies (Junge, Rösch, Peterson, Graf-Baumann, and Dvorak 2002).
Relevance: Sports injury prevention research has significant relevance. Substantial literature shows that many sports-related injuries in high school are both common and preventable. Westminster is a national leader in high school athletics and was recently named Max Prep’s 2022-2023 number one school in athletics.
Fielding 80+ teams, Westminster’s renown and pervasive student-athlete-leadership is a core part of its culture. Understandably with 82% of the upper school student body- per Westminster’s website facts and figures section -participating in sports, Westminster experiences numerous injuries. In the past 3 years, Westminster athletes reported more than 500 sports related injuries.
Consequently, injuries can lead to missed or suboptimal play and to student absences and mental health decline. Therefore, research into preventing sports-related injuries is critical to keeping athletes on the field and for Westminster to maintain and expand its presence in national athletic leadership.
Finally, studying sports injuries is deeply personal for me. As a sports fanatic who played in more than 40 seasons since age 4, I was profoundly impacted by a series of 5 injuries and 2 fractures in 8th and 9th grade. I
missed a complete season of baseball, numerous days of school, and needed months of physical therapy. These injuries left me deeply discouraged and significantly affected both my academics and social life. To the extent possible, I hope to make an impact at Westminster by preventing experiences like mine.
Purpose: This study will examine several primary research questions. First, what sports are most prone to injury and what are the most common sports related injuries in males and females at Westminster? Second, of the injuries that are most common, which of them are preventable and what does current literature show are the optimal methods of prevention? At Westminster, athletes have access to the very best coaches and athletic trainers, both of whom are dedicated to our optimum performance and safety. However, there is always room for improvement. Westminster is the number one school in athletics. My goal is to help Westminster also be the number one school in injury prevention.
A retrospective study on the incidence of sports-injuries at the Westminster Schools was conducted. The study population included Westminster high school students (grades 912), during the 4-year period of 2019-2023, who had a reported injury at any Westminsterrelated sporting event. Injuries that occurred during both games and practices were included if they occurred within the time period of the study and were reported. The injury data was collected and entered by Westminster Training Staff into a secure database. This raw data was then emailed to US Head and Study Mentor Dr. Chanley Small who promptly de-identified the data and sorted it into a Google spreadsheet. This deidentified data was then provided to James Rhee to analyze as follows.
Injuries were categorized according to: date of injury, gender of injured player, sport name in which the injury occurred, level of the team (Varsity or Junior Varsity), body part where the injury occurred, and injury type. Injury subtypes, such as “type 1 sprain” or “type 2 sprain”, were regrouped under a broader category (such as “sprain”). Furthermore, non-uniform spelling of injuries, such as “tendonitis” and “tendinitis,” was standardized. All injuries in the database were included for analysis, and no injuries were excluded.
First, the difference in overall injury incidence between Male vs Female athletes was determined. To account for varying participation rates, the result was determined by calculating the number of injuries per gender per year (= total injuries per gender/total participants per gender/4 years). A rate-ratio test was used to determine the significance of the resulting means, and a p value of 0.05 was set as the standard for statistical significance.
Second, we calculated the incidence of Injury per Male Varsity Sport and the incidence of Injury per Female Varsity Sport. The results of these analyses were determined by the number of injuries per player per year (= total injuries per varsity sport/total participants per varsity sport/4 years) in order to account for the varying participation rates per sport.
Third, the most common types of injuries were identified (for example: Sprains and Strains) and determined by the number of injuries per year (= total number of injury type/4 years)
Fourth, the most common types of injuries in the sports with the highest injury rates were identified and calculated by the number of injuries per year (= total number of injury type per sport/4 years)
Fifth, the most common injury locations were identified and represented by total occurrences.
Statistical Analysis: For all data sets which output mean injuries per player per year or mean injuries per year, a one-way anova test was used to calculate the statistical significance of the resulting means. A p value of 0.05 was set as the standard of statistical significance for this study.
Literature Review: A literature search was conducted in Google Scholar to identify prior studies that examined the preventability of, as well as prevention strategies for, the most common injuries found in our study. Strategies with level 1 and 2 evidences in the literature were then used to make prevention recommendations for the most common injuries found in the present study.
Overall injury incidence by gender: There was a total of 525 injuries during the 4-year period. Of these injuries, 399 occurred in males and 126 occurred in females (Figure 1). Accounting for a difference in participation by gender, males still accounted for significantly more injuries with 0.018 injuries per player per year compared to 0.0062 for females. A rate ratio test calculated the p value to be <0.001, indicating that this difference was statistically significant.
Male varsity sports: Given that there was such a disparity in incidence of injury between males and females, the data was separated and analyzed according to gender. In male varsity sports, due to the disproportionate team sizes among different sports, mean injuries per player per year was used to determine the sports with the highest injury rates (Figure 2). Football had the highest injury rate, with a mean of 0.77 injuries per player per year. football was followed by soccer with 0.18, basketball with 0.17, wrestling with 0.14, and cross country with 0.08. An ANOVA test calculated a p value of <0.001, meaning these
differences are statistically significant.
The top 5 injury types in all male varsity sports were determined (Figure 3). Sprains were the most common injury, accounting for 23 mean injuries per year. Strains were the second most common injury, with 15.25 mean injuries per year, followed by contusion with 11.5 mean injuries per year, followed by fracture with 8.75 mean injuries per year, and concussion with six mean injuries per year. The resulting p Value of these means, as calculated by an ANOVA test, was <0.001, indicating that these differences were statistically significant.
The specific types of injuries were subanalyzed in football and soccer, the sports with the two highest overall injury rates. In Male Varsity Football (Figure 4), sprains were the most common injury, accounting for 16.3 mean injuries per year. Strains followed in second with 9.0, followed by contusions with 8.5 mean injuries per year, followed by fractures with 5.8 mean injuries per year, and finally concussions with 3.3 mean injuries per year. The resulting P Value of these means, as calculated by an ANOVA test, was <0.001, indicating that these differences were statistically significant.
Summary of the results: A retrospective study of four years of sports-related injury data at the Westminster Schools was conducted. Over a 4-year period (2019-2023), Westminster athletes experienced 525 sports related injuries. The incidence of injury between male and female sports was significant, with males accounting for 399 total injuries or 0.018 injuries per player per year, while females accounting for 126 total injuries or 0.0062 injuries per player per year. Varsity male football had the highest rate of injury in male sports, accounting for 60% of all male injuries. Furthermore, the ankle sprains, followed by hip and pelvis strains, were the two most common injury types in males. These results
for males were extremely statistically significant, averaging a calculated p value of <0.001. In contrast, varsity female soccer had the highest rate of injury in female sports. Additionally, sprains, specifically of the ankle, were the most common injury type, followed by strains of the hamstring. For female sports, however, the calculated means were not statistically significant, all with a calculated p value of >0.05. Our findings were as expected since they were in-line with previous literature and research.
Potentially preventable injuries and preventative strategies: My extensive literature search shows that sprains and strains, the two most common injury types at Westminster, are at least partially preventable. Current literature points to two forms of impactful prevention: awareness of predispositions and specified and targeted training. Awareness of predispositions is straightforward; According to a ten-year research review on hamstring sprains in professional football, predispositions include speed positions, such as wide receivers and defensive backs, and special teams’ players. There players are at a greater risk for hamstring strains (Elliot, Zarins, Powell, and Kenyon 2011). Furthermore, research on the risk factors for non-contact ankle sprains in high school football found that players with high BMIs and previous ankle sprains were 19 times more likely to suffer a non-contact ankle sprain (Tyler, Mchugh, Mirabella, Mullaney, and Nicholas 2006). Likewise, researchers have found that muscle strength imbalance is a factor that increases the risk of hamstring injury. Therefore, implementation of preseason isokinetic assessments, which can help detect muscle strength imbalances, may reduce muscle injury incidence (Croisier, Ganteaume, Binet, Genty, and Ferret 2008). Prevention through specific training is much more nuanced. Current literature
suggests that there are two forms of prevention training. In indirect training the muscles trained are not actually the ones in which the targeted injury occurs. For example, in the case of ankle sprains, research studies demonstrate that in other areas beyond the ankle - reduced isometric hip-abductor strength (Powers, Ghoddosi, Straub, and Khayambashi 2017) and reduced hip extension muscle strength (De Ridder, Witvrouw, Dolphins, Roosen, and Van Ginckel 2017) - are related to a higher chance of sustaining lateral ankle sprains. Thus, an implementation of hip strengthening exercises can potentially be beneficial in reducing the likelihood of sustaining a lateral ankle sprain. An example of more direct training includes a dynamic warmup program. This training covers improving strength, balance, and mobility. They have been found to reduce the frequency of any injuries sustained during games and practices in general (Péréz, Adsuar, Alcaraz, and CarlosVivas).
In the case of specific injuries, like hamstring injuries (HSI), research supports the use of direct training, specifically focusing on eccentric hamstring strengthening, as an effective way to decrease the risk of sustaining a hamstring strain (Shadel and Cacolice 2017). Numerous studies strongly support the Nordic hamstring exercise as an effective way to strengthen the hamstring in the eccentric (lengthened) portion of an exercise (Al Attar, Soomro, Sinclair, Pappas, and Sanders 2017). In addition, specified training of the hamstring, which progresses from low to high velocity exercises, combined with hamstring specific, fatigue prevention (conditioning) exercises, are also recommended and helpful (Turner, Cree, Comfort, Jones, Chavda, Bishop, and Reynolds 2014). Likewise, in a research article published in the International Journal of Environmental Research and Health, researchers found that both the FIFA 11+ program and core and balance specific training programs proved to
be successful in preventing hamstring injuries (Biz, Nicoletti, Baldin, Bragazzi, Crimí, and Ruggieri 2021).
Finally, research also supports the implementation of proprioceptive and neuromuscular training. These have substantial impacts in reducing non-contact injuries. Proprioceptive training has been found to reduce rehabilitation time for noncontact injuries (Kraemer and Knobloch 2009) and was more effective at reducing the rate of recurring ankle sprains than orthoses or standard strength training (Mohammadi 2007). As well, neuromuscular training has been found to be effective in preventing youth injuries in general (Emery and Meeuwisse 2010).
Future directions and immediate applications: Implementing these scientifically proven, injury prevention techniques for all athletes, especially those in football, soccer, and football cheerleading, would create an immediate benefit to Westminster’s athletes. Furthermore, to begin Identifying athletes at higher risk and specifically target them for preventative strategies. In fact, one future study could prospectively assess the effect of the prevention strategies to see if they have reduced injury. This study would focus on the sports with the most injuries and have the most potential for impact like football, soccer, cheerleading, track and field, and cross country. In the short term, the use of more screening tests to target athletes known to be at greater risk. For example, current literature shows that the reach test and hamstring to quadricep ratio, as well as the risk factors established in the discussion, can help illuminate some athletes at risk. Another study could be done as the new, updated database grows. In the future, with the help of AI, preventative strategies could be tailored and recommended to athletes based on very specific characteristics like height, weight, playing position, and ratios.
There are several conclusions to my study.
First, sports-injuries at Westminster are extremely common, as an estimated 9% of all athletes during the 4-year period were injured. Second, males had significantly more injuries than females. Third, the study highlighted that football and soccer had the highest incidences of injuries in males. In contrast, soccer and football cheerleading had the highest injury rates in females but were not statistically significant from other sports. Fourth, ankle sprains were the most common overall injury, followed by hip/pelvic and hamstring strains respectively. Fifth, the literature demonstrates that ankle and hamstring strains are preventable to some extent. In the future, I recommend that Westminster employs these proven prevention measures.


Al Attar, Wesam Saleh A., Najeebullah Soomro, Peter J. Sinclair, Evangelos Pappas, and Ross H. Sanders. “Effect of Injury Prevention Programs That Include the Nordic Hamstring Exercise on Hamstring Injury Rates in Soccer Players: A Systematic Review and Meta-Analysis.” Sports Medicine 47, no. 5 (May 1, 2017): 907–16. https://doi.org/10.1007/s40279-016-0638-2.
Biz, Carlo, Pietro Nicoletti, Giovanni Baldin, Nicola Luigi Bragazzi, Alberto Crimì, and Pietro Ruggieri. “Hamstring Strain Injury (HSI) Prevention in Professional and Semi-Professional Football Teams: A Systematic Review and Meta-Analysis.” International Journal of Environmental Research and Public Health 18, no. 16 (January 2021): 8272. https://doi.org/10.3390/ijerph18168272.
Burns, Patricia B., Rod J. Rohrich, and Kevin C. Chung. “The Levels of Evidence and Their Role in Evidence-Based Medicine.” Plastic and Reconstructive Surgery 128, no. 1 (July 2011): 305–10. https://doi.org/10.1097/PRS.0b013e318219c171.
Croisier, Jean-Louis, Sebastien Ganteaume, Johnny Binet, Marc Genty, and Jean-Marcel Ferret. “Strength Imbalances and Prevention of Hamstring Injury in Professional Soccer Players: A Prospective Study.” The American Journal of Sports Medicine 36, no. 8 (August 1, 2008): 1469–75. https://doi.org/10.1177/0363546508316764.
De Ridder, Roel, Erik Witvrouw, Mieke Dolphens, Philip Roosen, and Ans Van Ginckel. “Hip Strength as an Intrinsic Risk Factor for Lateral Ankle Sprains in Youth Soccer Players: A 3-Season Prospective Study.” The American Journal of Sports Medicine 45, no. 2 (February 1, 2017): 410–16. https://doi.org/10.1177/0363546516672650.
Delahunt, Eamonn, Chris M. Bleakley, Daniela S. Bossard, Brian M. Caulfield, Carrie L. Docherty, Cailbhe Doherty, François Fourchet, et al. “Clinical Assessment of Acute Lateral Ankle Sprain Injuries (ROAST): 2019 Consensus Statement and Recommendations of the International Ankle Consortium.” British Journal of Sports Medicine 52, no. 20 (October 2018): 1304–10. https://doi.org/10.1136/bjsports-2017-098885.
Dias, Luciano S. “The Lateral Ankle Sprain: An Experimental Study.” Journal of Trauma and Acute Care Surgery 19, no. 4 (April 1979): 266.
Elliott, Marcus C. C. W., Bertram Zarins, John W. Powell, and Charles D. Kenyon. “Hamstring Muscle Strains in Professional Football Players: A 10Year Review.” The American Journal of Sports Medicine 39, no. 4 (April 1, 2011): 843–50. https://doi.org/10.1177/0363546510394647.
Emery, C. A., and W. H. Meeuwisse. “The Effectiveness of a Neuromuscular Prevention Strategy to Reduce Injuries in Youth Soccer: A ClusterRandomised Controlled Trial.” British Journal of Sports Medicine 44, no. 8 (June 1, 2010): 555–62. https://doi.org/10.1136/bjsm.2010.074377.
Ergen, Emin, and Bülent Ulkar. “Proprioception and Ankle Injuries in Soccer.” Clinics in Sports Medicine, International Perspectives, 27, no. 1 (January 1, 2008): 195–217. https://doi.org/10.1016/j.csm.2007.10.002.
Fong, Daniel Tik-Pui, Youlian Hong, Lap-Ki Chan, Patrick Shu-Hang Yung, and Kai-Ming Chan. “A Systematic Review on Ankle Injury and Ankle Sprain in Sports.” Sports Medicine (Auckland, N.Z.) 37, no. 1 (2007): 73–94. https://doi.org/10.2165/00007256-200737010-00006.
Huygaerts, Shaun, Francesc Cos, Daniel D. Cohen, Julio Calleja-González, Marc Guitart, Anthony J. Blazevich, and Pedro E. Alcaraz. “Mechanisms of Hamstring Strain Injury: Interactions between Fatigue, Muscle Activation and Function.” Sports (Basel, Switzerland) 8, no. 5 (May 18, 2020): 65. https://doi.org/10.3390/sports8050065.
Junge, Astrid, Dieter Rösch, Lars Peterson, Toni Graf-Baumann, and Jiri Dvorak. “Prevention of Soccer Injuries: A Prospective Intervention Study in Youth Amateur Players.” The American Journal of Sports Medicine 30, no. 5 (September 1, 2002): 652–59.
https://doi.org/10.1177/03635465020300050401.
Kraemer, Robert, and Karsten Knobloch. “A Soccer-Specific Balance Training Program for Hamstring Muscle and Patellar and Achilles Tendon Injuries: An Intervention Study in Premier League Female Soccer.” The American Journal of Sports Medicine 37, no. 7 (July 1, 2009): 1384–93.
https://doi.org/10.1177/0363546509333012.
Mohammadi, Farshid. “Comparison of 3 Preventive Methods to Reduce the Recurrence of Ankle Inversion Sprains in Male Soccer Players.” The American Journal of Sports Medicine 35, no. 6 (June 1, 2007): 922–26.
https://doi.org/10.1177/0363546507299259.
Owen, Adam L., Del P. Wong, Alexandre Dellal, Darren J. Paul, Emmanuel Orhant, and Stuart Collie. “Effect of an Injury Prevention Program on Muscle Injuries in Elite Professional Soccer.” The Journal of Strength & Conditioning Research 27, no. 12 (December 2013): 3275.
https://doi.org/10.1519/JSC.0b013e318290cb3a.
Pérez-Gómez, Jorge, José Carmelo Adsuar, Pedro E. Alcaraz, and Jorge Carlos-Vivas. “Physical Exercises for Preventing Injuries among Adult Male Football Players: A Systematic Review.” Journal of Sport and Health Science 11, no. 1 (January 1, 2022): 115–22.
https://doi.org/10.1016/j.jshs.2020.11.003.
Powers, Christopher M., Navid Ghoddosi, Rachel K. Straub, and Khalil Khayambashi. “Hip Strength as a Predictor of Ankle Sprains in Male Soccer Players: A Prospective Study.” Journal of Athletic Training 52, no. 11 (November 2017): 1048–55. https://doi.org/10.4085/1062-6050-52.11.18.
Rommers, Nikki, Roland Rössler, Bruno Tassignon, Jo Verschueren, Roel De Ridder, Nicky van Melick, Lieselot Longé, et al. “Most Amateur Football Teams Do Not Implement Essential Components of Neuromuscular Training to Prevent Anterior Cruciate Ligament Injuries and Lateral Ankle Sprains.” Knee Surgery, Sports Traumatology, Arthroscopy: Official Journal of the ESSKA 30, no. 4 (April 2022): 1169–79. https://doi.org/10.1007/s00167-022-06878-8.
Rudisill, Samuel S., Nathan H. Varady, Michael P. Kucharik, Christopher T. Eberlin, and Scott D. Martin. “Evidence-Based Hamstring Injury Prevention and Risk Factor Management: A Systematic Review and Meta-Analysis of Randomized Controlled Trials.” The American Journal of Sports Medicine 51, no. 7 (June 2023): 1927–42. https://doi.org/10.1177/03635465221083998.
Searing, Linda. “Over 5 Million High School Sports Injuries Recorded in 4-Year Period.” Washington Post, March 24, 2023. https://www.washingtonpost.com/wellness/2023/03/27/high-school-sports-injury-research/.
Shadle, Ian B., and Paul A. Cacolice. “Eccentric Exercises Reduce Hamstring Strains in Elite Adult Male Soccer Players: A Critically Appraised Topic.” Journal of Sport Rehabilitation 26, no. 6 (November 1, 2017): 573–77. https://doi.org/10.1123/jsr.2015-0196. “Sports Injury Statistics,” November 19, 2019. https://www.hopkinsmedicine.org/health/conditions-and-diseases/sports-injuries/sports-injurystatistics.
Turner, Anthony N., Jon Cree, Paul Comfort, Leigh Jones, Shyam Chavda, Chris Bishop, and Andy Reynolds. “Hamstring Strain Prevention in Elite Soccer Players.” Strength & Conditioning Journal 36, no. 5 (October 2014): 10. https://doi.org/10.1519/SSC.0000000000000076.
Tyler, Timothy F., Malachy P. Mchugh, Michael R. Mirabella, Michael J. Mullaney, and Stephen J. Nicholas. “Risk Factors for Noncontact Ankle Sprains in High School Football Players: The Role of Previous Ankle Sprains and Body Mass Index.” The American Journal of Sports Medicine 34, no. 3 (March 1, 2006): 471–75. https://doi.org/10.1177/0363546505280429.
Willeford, Kristin, Justin M. Stanek, and Todd A. McLoda. “Collegiate Football Players’ Ankle Range of Motion and Dynamic Balance in Braced and Self-Adherent-Taped Conditions.” Journal of Athletic Training 53, no. 1 (January 2018): 66–71. https://doi.org/10.4085/1062-6050-486-16.

“Technologyaloneisnotenough—it's technologymarriedwithliberalarts, marriedwiththehumanities,thatyieldsus theresultsthatmakeourheartsing.”
-STEVEJOBS