Utah’s Land, Water, and Air
1
2022 REPORT TO THE GOVERNOR
2
3
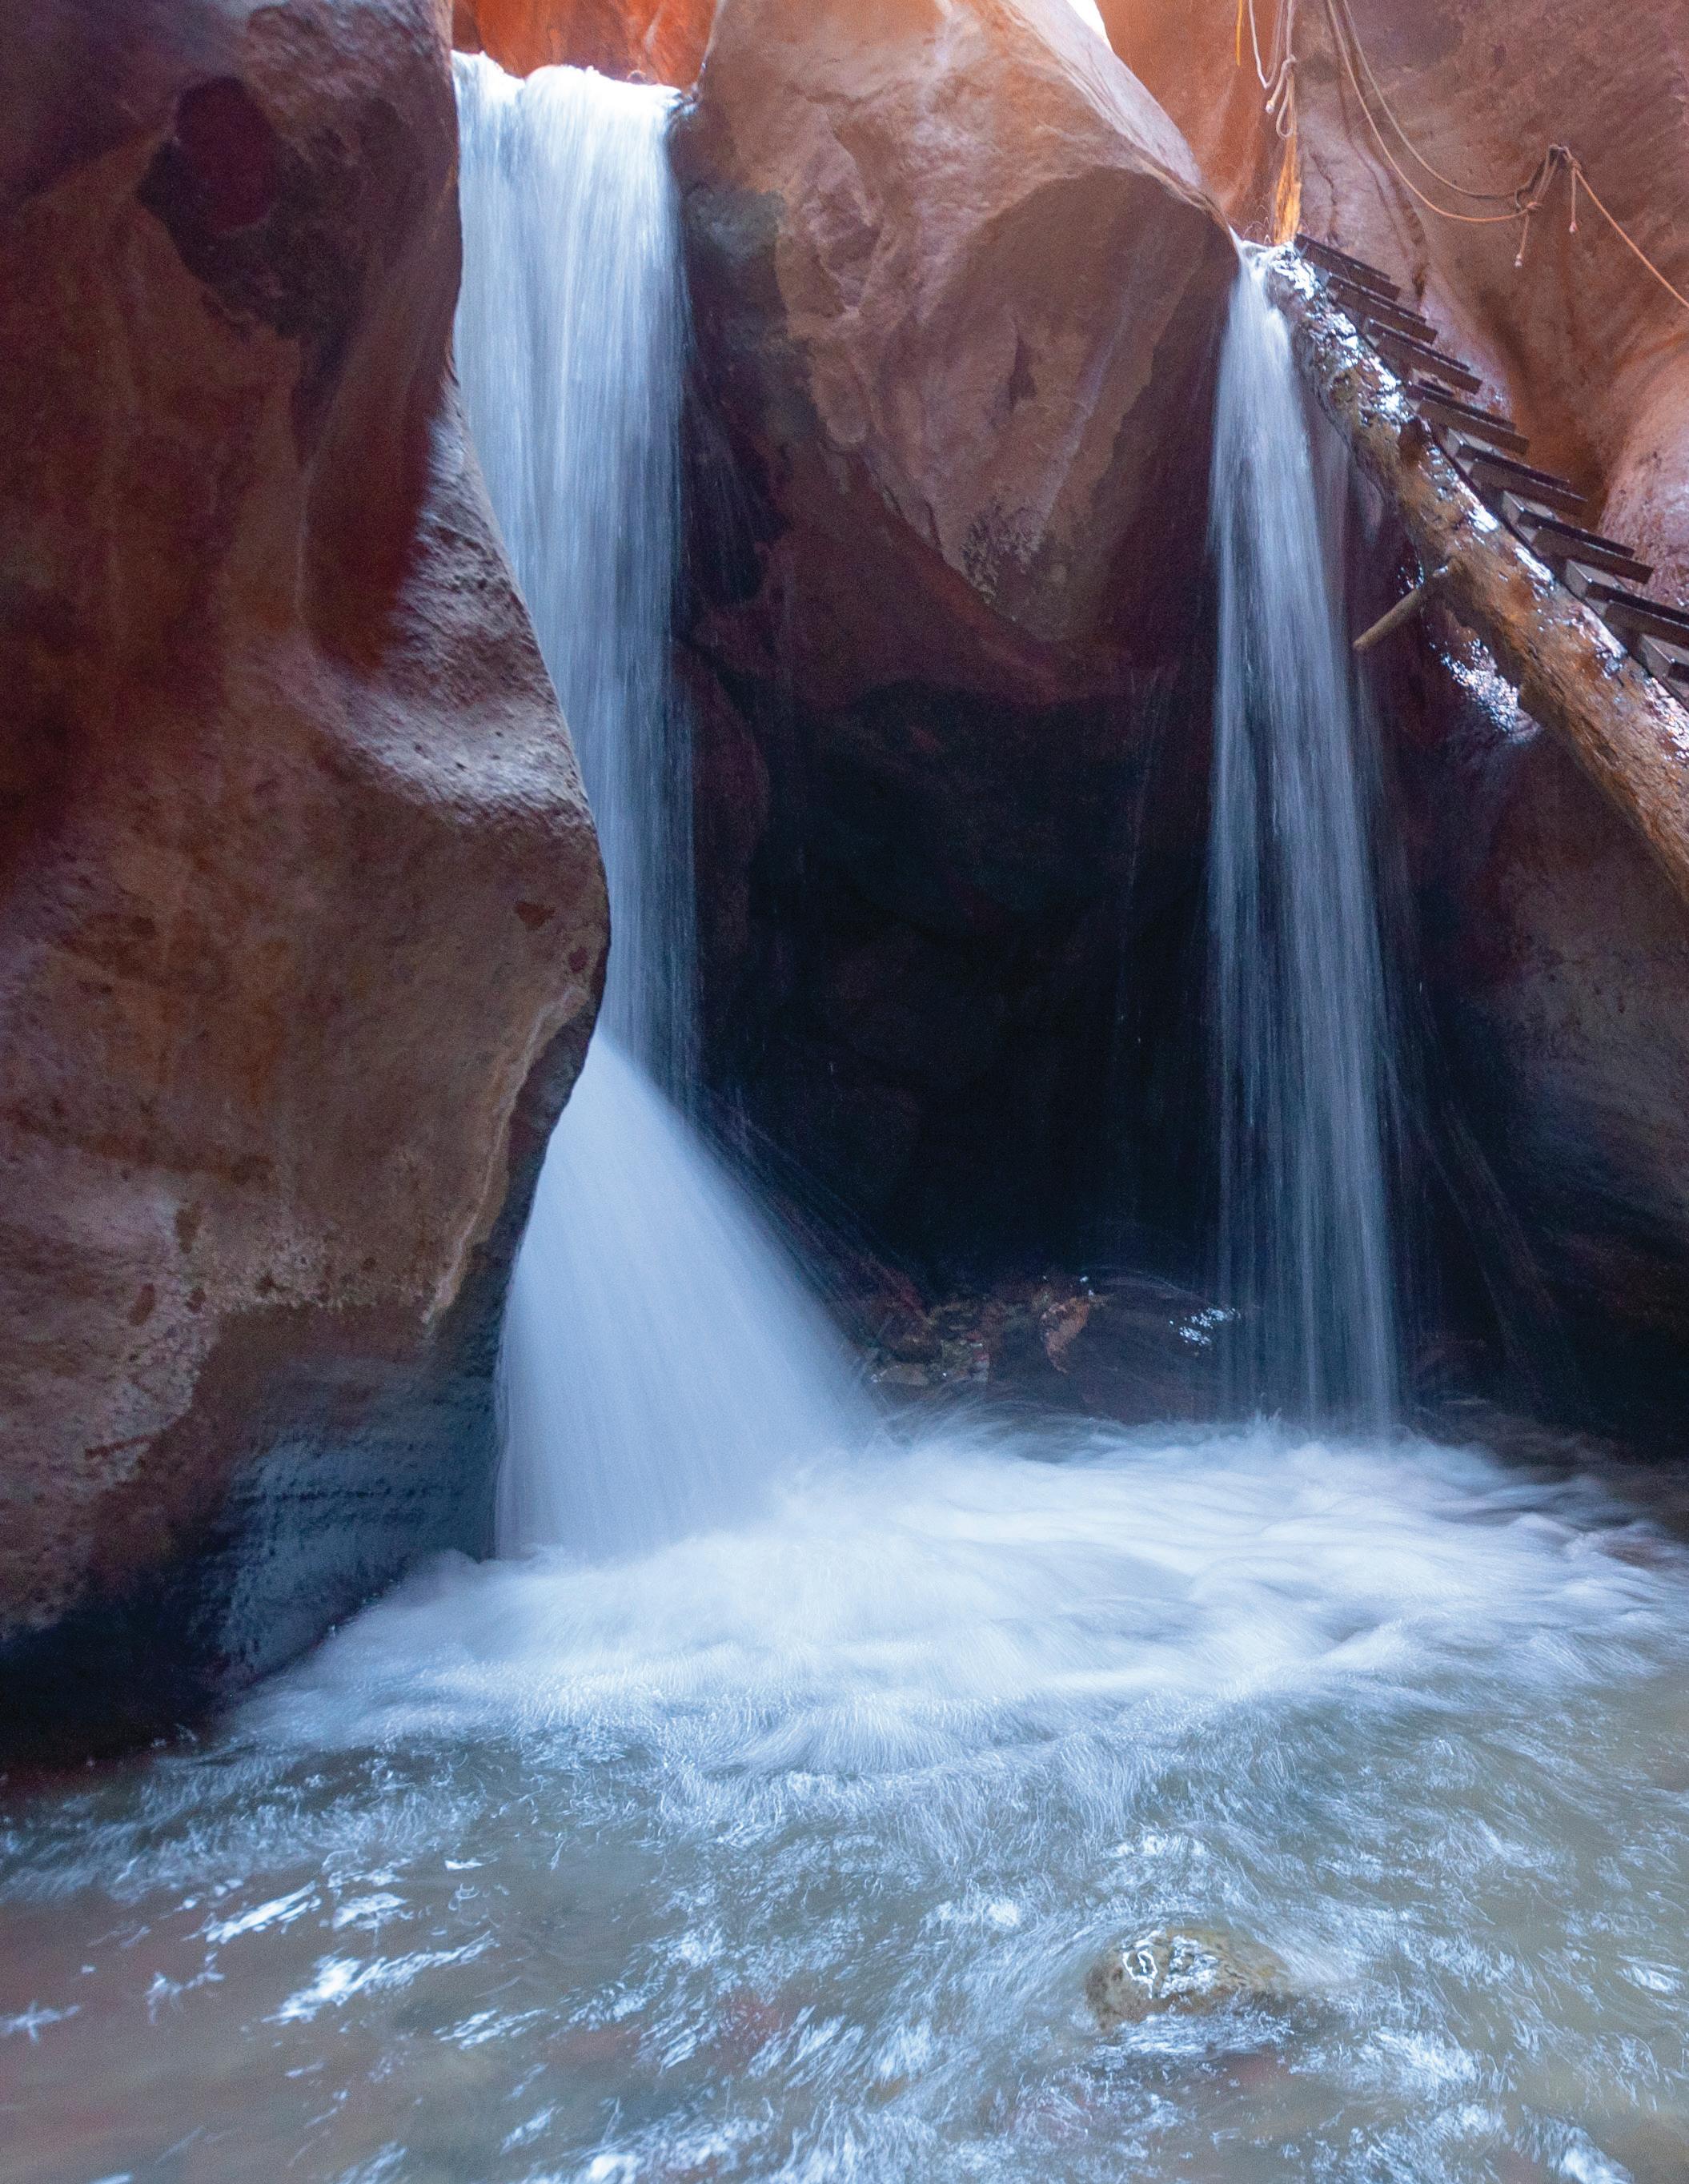
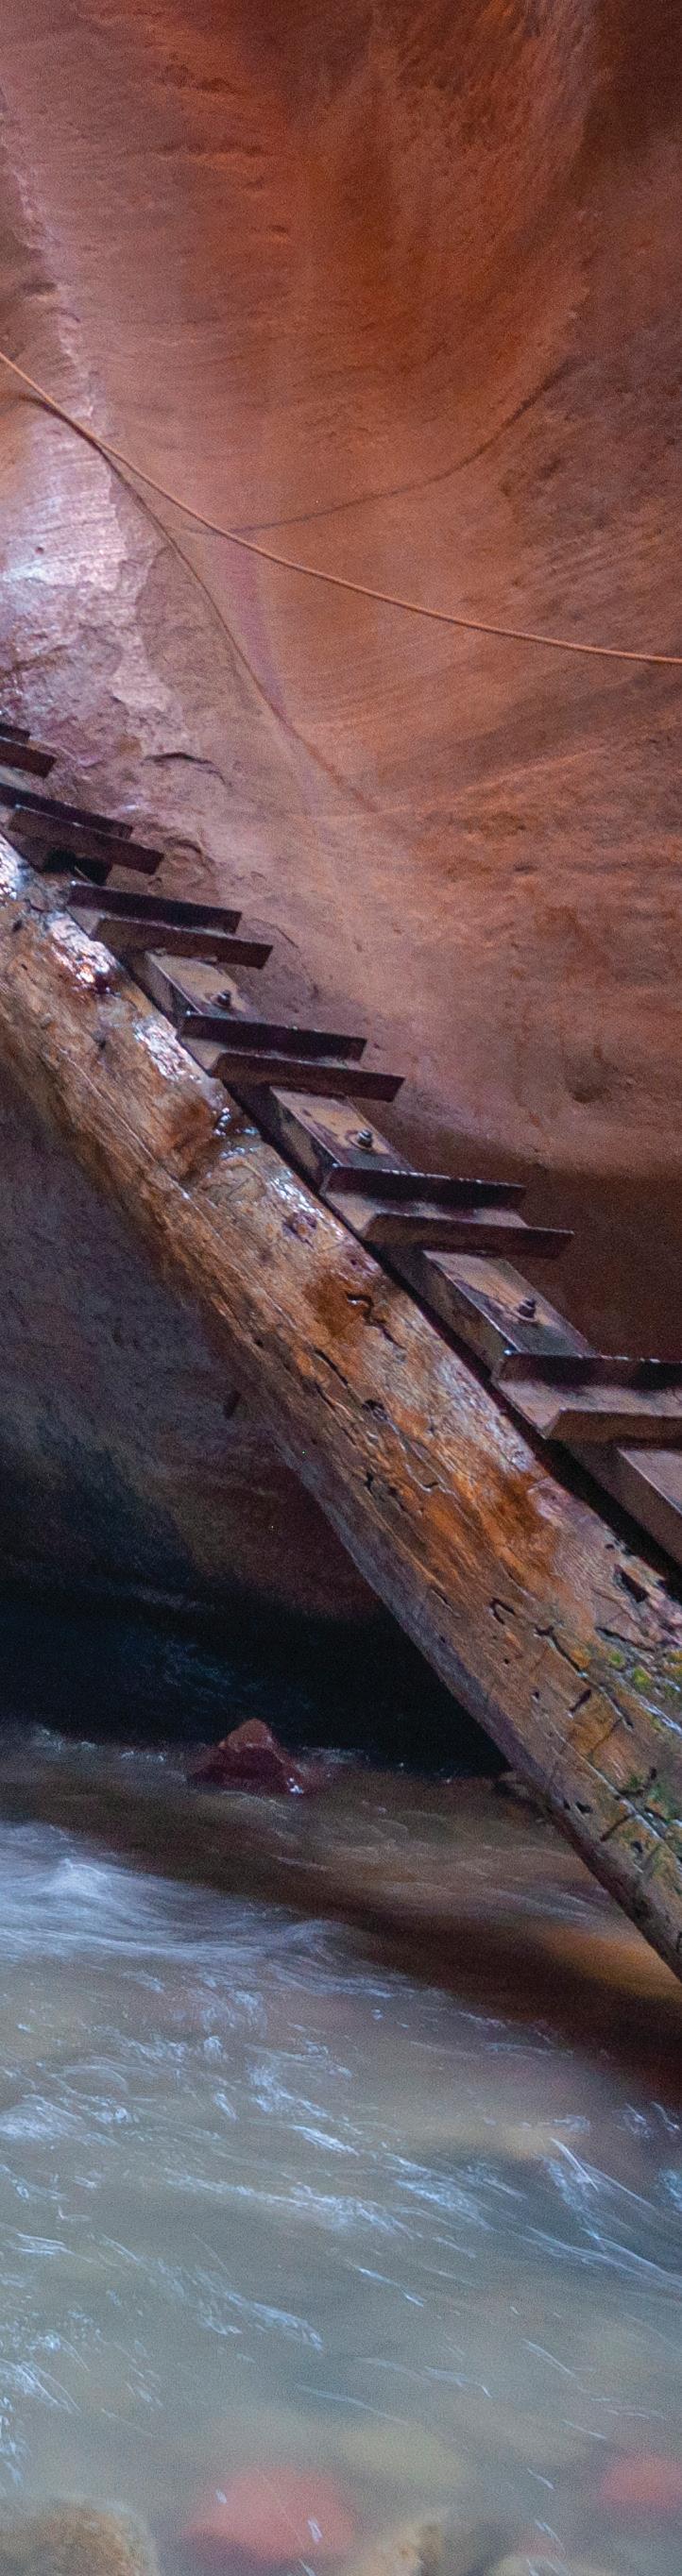
of Contents 4 Message from the president 5 Message from the executive director 6 Report summary 8 Authors 11 Contributors & support 12 Institute advisory board 14 USU steering committee Report Chapters 16 Introduction 18 Chapter one: Land 33 Chapter two: Water 45 Chapter three: Air 59 Chapter four: Agriculture 71 Chapter five: Great Salt Lake 82 2022 Institute report 83 Institute support Left: Ladder up the falls- Kannaraville Falls, Kannaraville
Table
NOELLE E. COCKETT
President Utah State University
Aggies are contributing to positive outcomes within their communities, their nations, and the world. We are dedicated to improving the quality of life for everyone in Utah. Nowhere is this more apparent than in the areas of land, water, and air.
We gathered about a year ago to celebrate the founding of the Janet Quinney Lawson Institute for Land, Water, and Air. Since then, we’ve taken leaps and bounds forward in developing the institute and furthering its impact. We announced Brian Steed as the institute’s inaugural executive director and Anna McEntire as associate director in May. Brian has extensive experience in working in government at federal, state, and local levels. He understands the critical role that researchers play in generating scientific data and evaluating solutions. Anna has nearly two decades of experience working in USU’s Office of Research, communicating USU’s research and researchers. I cannot imagine a better team to lead this institute.
And the institute is already making a substantial impact, building bridges between USU’s researchers, community partners, and statewide leaders. The institute team has traveled the
state, meeting with policymakers. They are advising on major projects on the Great Salt Lake, the Colorado River, and on land and air issues statewide. Just this month, we chose to highlight the work of the institute as one of four focus areas at USU as part of our new capital campaign kickoff. And, more projects, partnerships, and announcements are on the way in 2023.
We are also excited to welcome Dean Linda Nagel as the new dean of the S.J. and Jessie E. Quinney College of Natural Resources. Throughout her career, Linda has worked diligently to find real-world solutions to pressing natural resource problems. She is a renowned expert on forest management and brings decades of experience on how to build a community of researchers and students dedicated to solving the pressing problems we face.
Developing and communicating USU’s strength in land, water, and air remains one of my highest presidential priorities. This report is just one way in which Aggies show how we are striving to understand the world in which we live and make it better. Thanks to all those who participated in its creation!

I have taught, researched, and led at Utah State University for more than 30 years.
4
After all this time, I’m still amazed by our stellar researchers, our amazing alumni, and our dedicated student body.
Prolonged drought has drawn down every major water source in the state, with many rivers and lakes at their lowest level in history. Air quality remains a major concern for residents— from ozone, other pollutants, and from dust produced from the dry lakebed of the Great Salt Lake. Land issues remain a perennial concern with traditional agricultural lands increasingly converted for development, and leaders continuing to work toward fair-handed management of the vast swaths of federal lands in the state.
The good news is that none of these issues are intractable—sound policy decisions can produce positive outcomes for the management of the state’s natural resources. In order to develop solid long-term decisions, policymakers need reliable, research-based information. The Institute for Land, Water & Air is ready to meet that moment, thanks to the leadership at Utah State University and the generosity of the Janet Quinney Lawson Foundation and other donors.
This report details some of the most pressing issues facing the state. It is not intended to be comprehensive, but rather to highlight issues that require nuanced understanding at this time. It pulls from the rich expertise of researchers and scientists at Utah State University, people who have worked, sometimes for years, to
understand complex issues in depth.
In addition to chapters covering land, water, and air, this year’s report includes two full chapters focused on agriculture and the Great Salt Lake. These specific issues are at critical points, in which management decisions can have important impacts. Likewise, a lack of action will have consequences now and for the future. Agriculture has been woven into the history of our state, and will almost certainly play a major role in its future—yet, it faces tremendous strain as increased demands on water resources and a diminished supply create changing incentives on how, when, and what to grow. The shrinking Great Salt Lake has become a driving issue as leaders seek answers on how much more water is needed, and where it will come from, for the lake and surrounding land and wetlands to continue to function.
BRIAN STEED Executive Director
We do not offer easy or clear-cut answers in this report, but we offer perspective, information, and sometimes urgency in the places that we know require swift action. We are committed to the notion that by working together, by sharing what we know, we can move forward as a community and as stewards of the resources that will become our legacy.

5
Janet Quinney Lawson Institute for Land, Water, and Air
From agricultural lands to wetlands, from mountains to mines, the issues facing Utah’s land, water, and air present some of the most critical challenges for leadership today.
Report Summary
This report serves as a 2022 snapshot of key issues and concerns with Utah’s shared resources. It highlights gathered data that is available to provide context to these issues, as well as identifies areas where more study is needed. Addressing these challenges will enable Utah policymakers and other statewide leaders to make informed decisions for the future. Under the authorship of 37 researchers and experts and the general guidance of 38 advisory committee members, the report outlines 26 issues and trends to pay attention to in the coming months and years. They include:
Introduction
What do Utahns care about?
Many of Utah’s top community concerns are dependent on land, water, and air.
Chapter 1: Land
A. Using tree rings to understand
Utah’s long-term trends for drought and forest health Tree rings show that in the past Utah experienced drought even more severe than what we are experiencing today, indicating that we may not have yet reached a worst-case scenario.
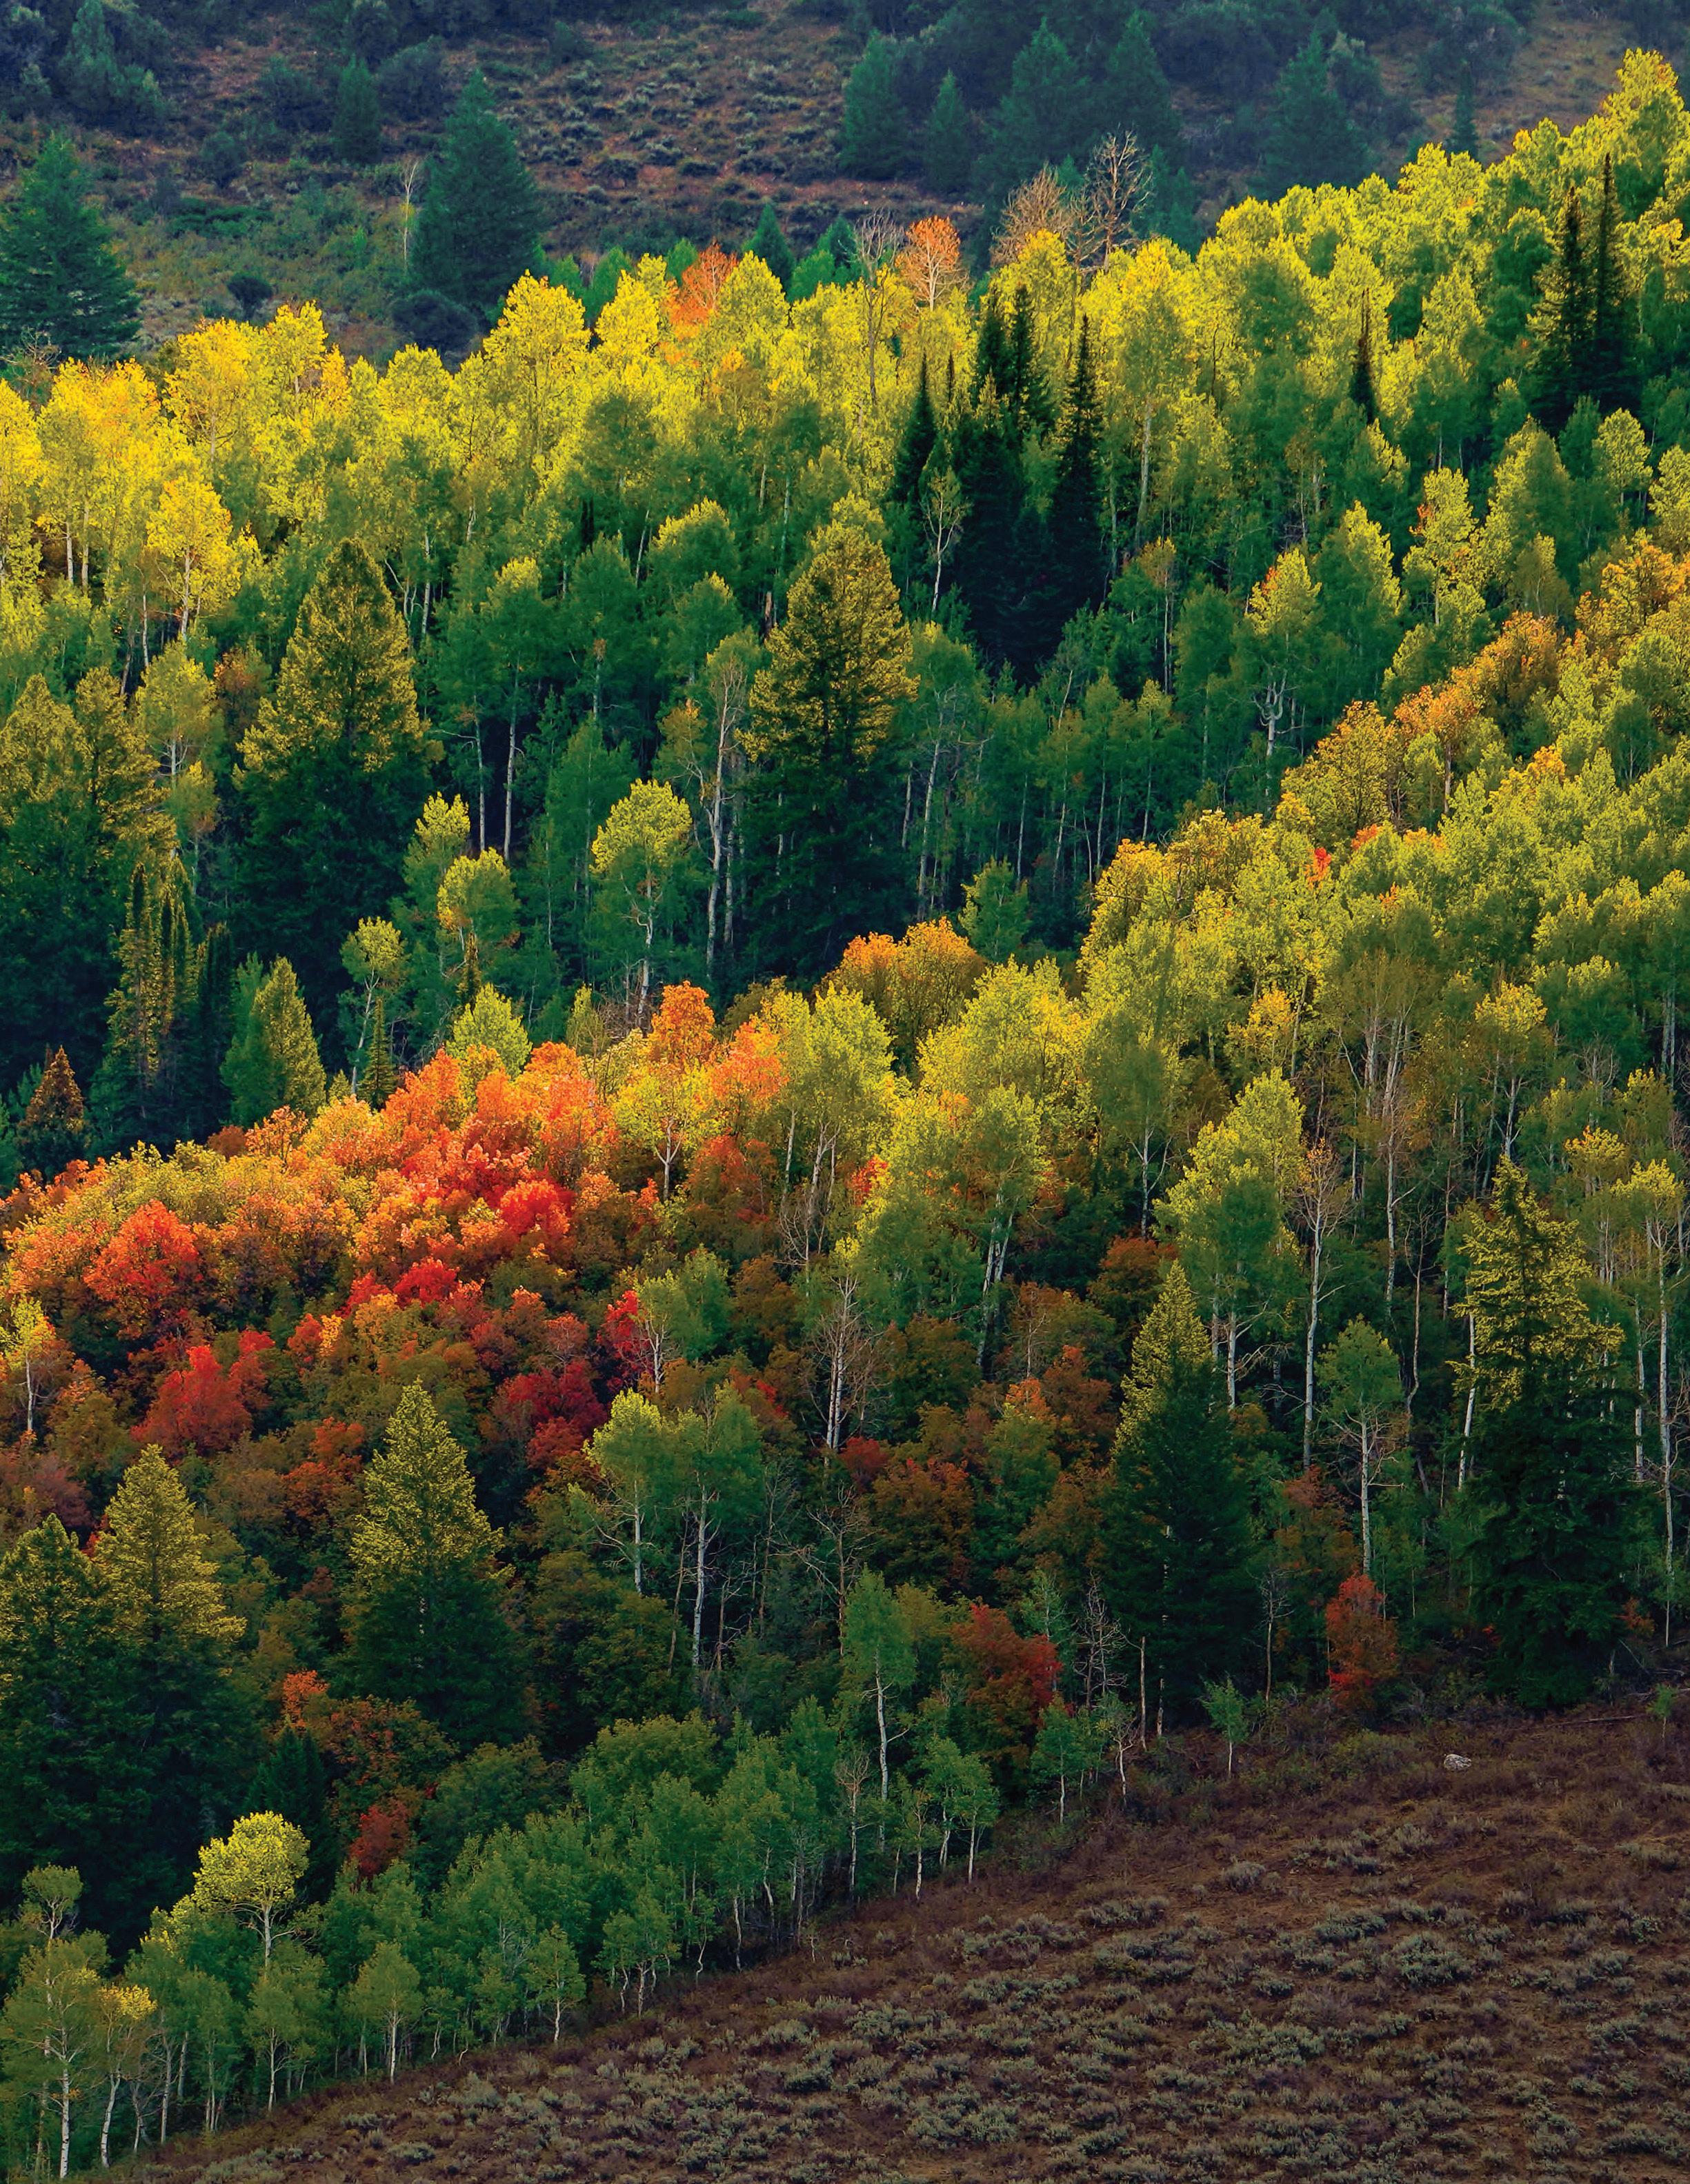
B. Low wildfire activity puts Utah lands further into fire deficit
To reduce the risk of catastrophic wildfire, we need more beneficial fire on the ground.
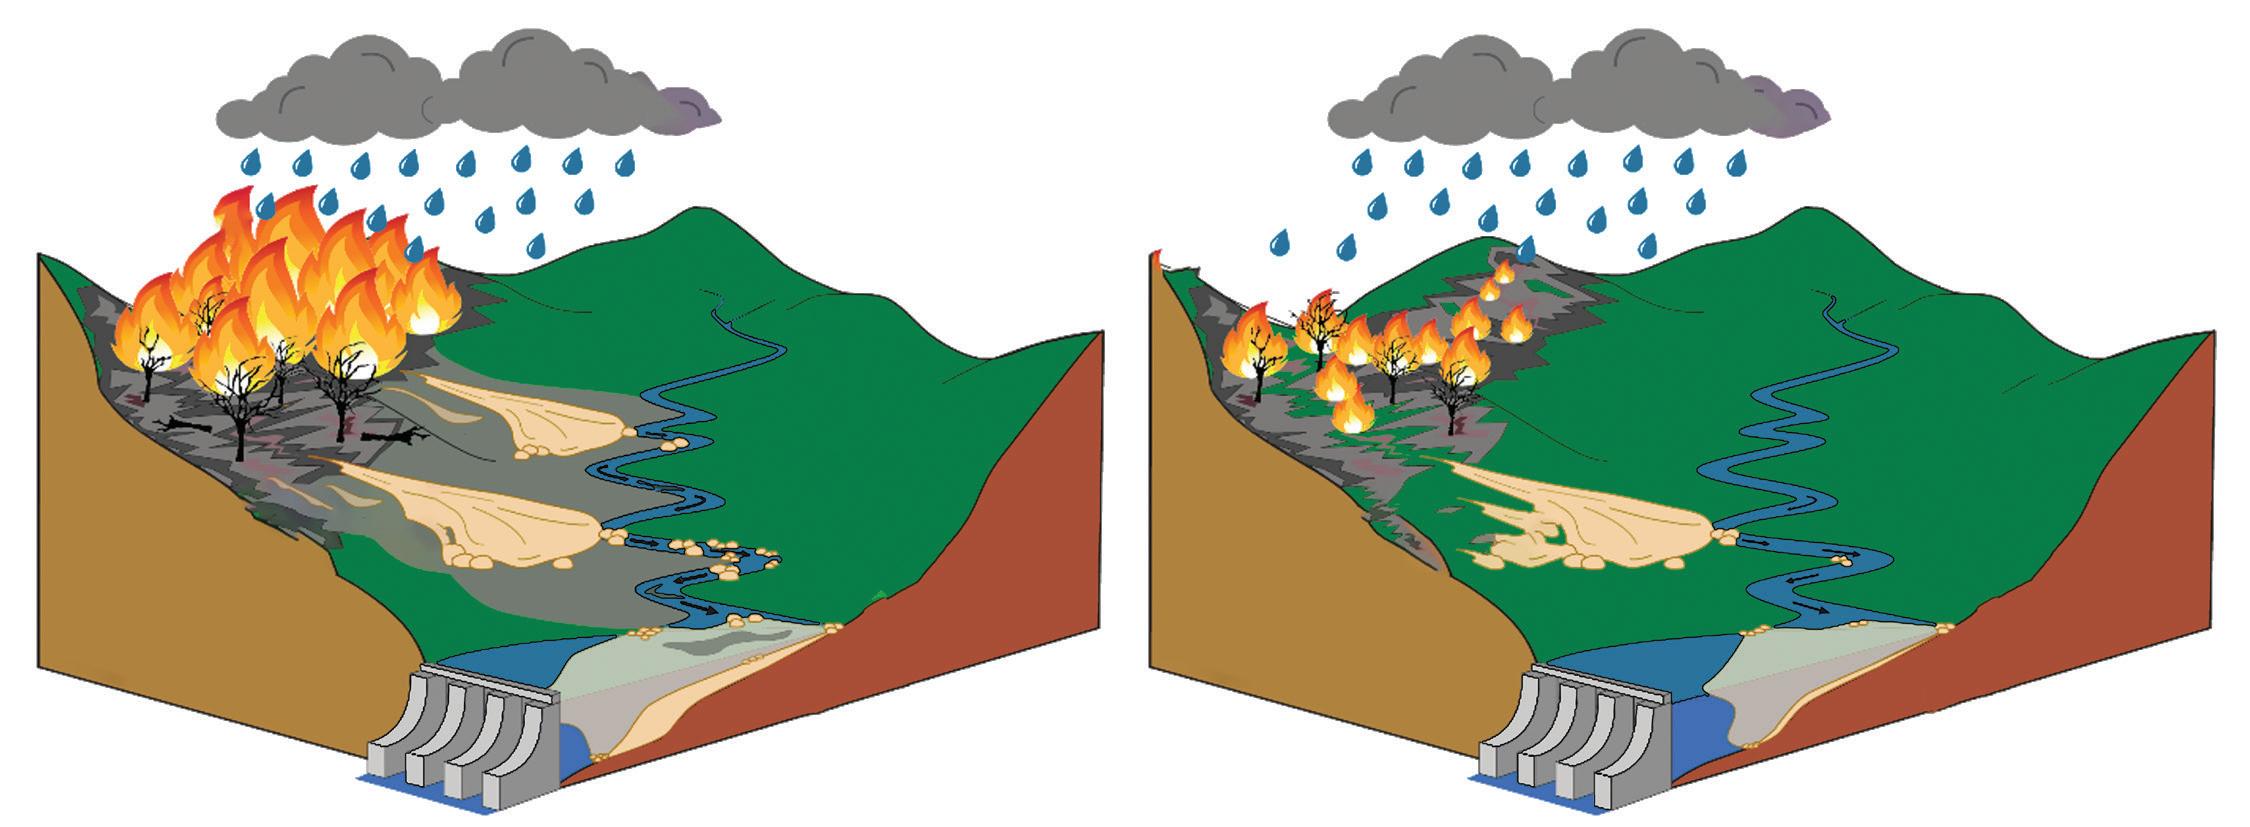
C. The perilous link between drought, wildfire, and reservoirs
A model developed at USU helps managers to predict which reservoirs are most vulnerable to flooding and erosion from wildfires.
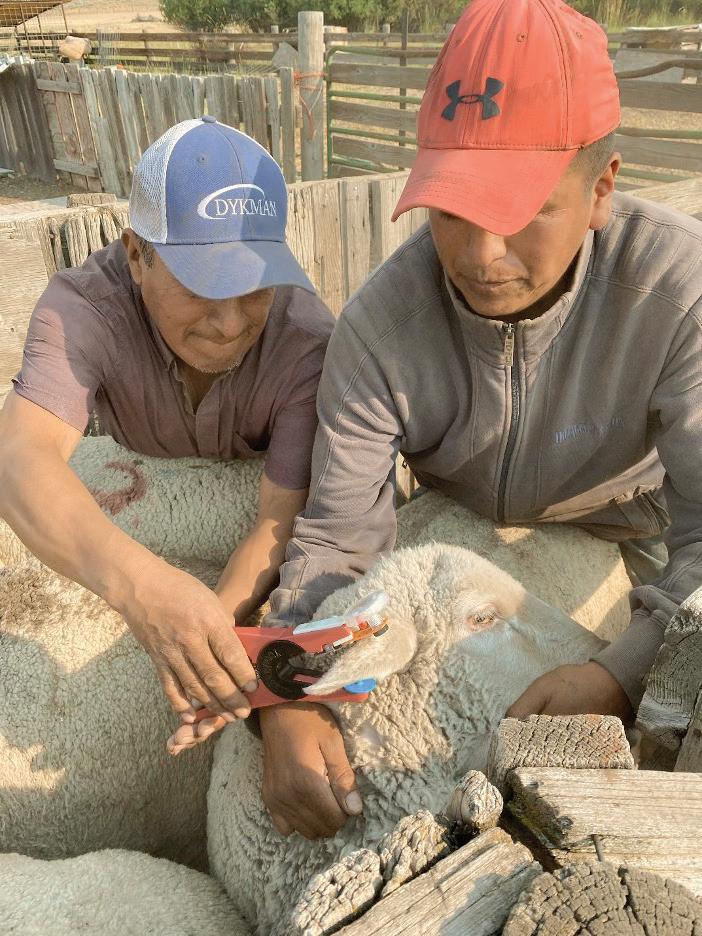
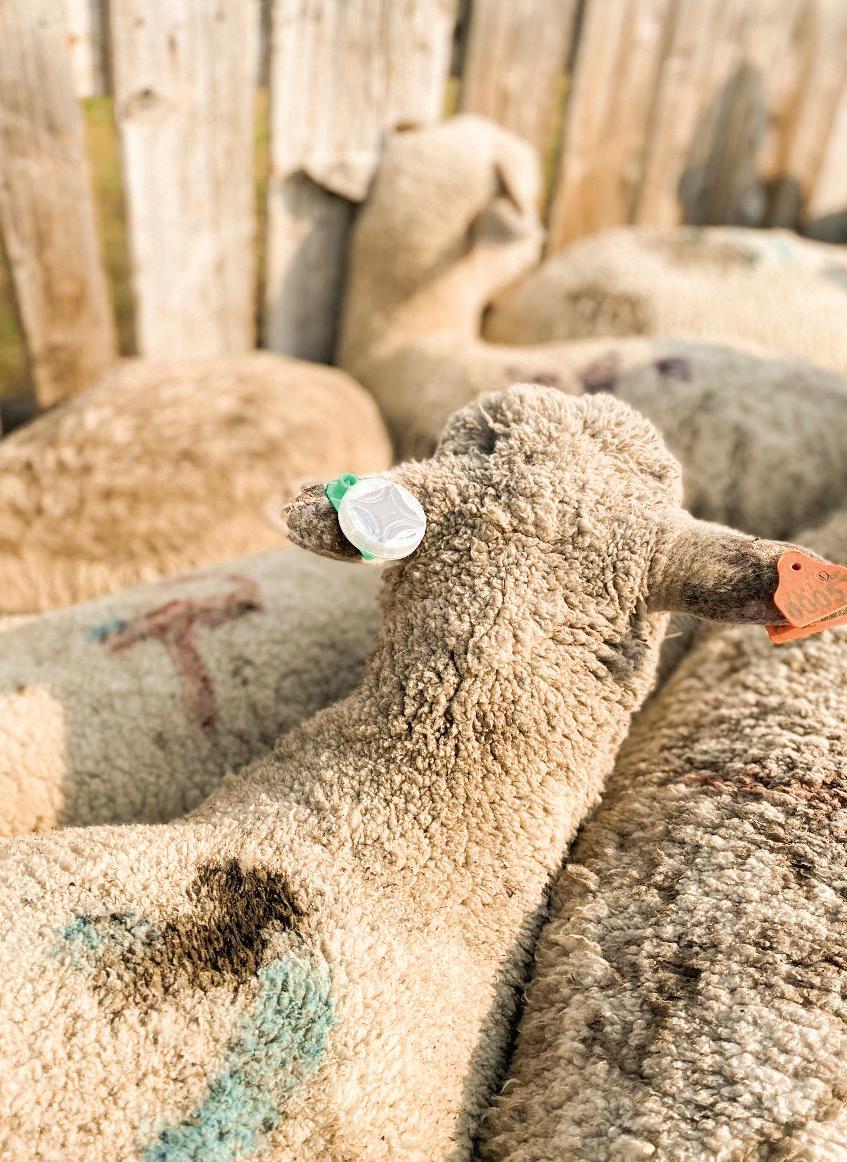
D. Reducing livestock depredation Ranchers can benefit from a few simple, flexible tools to reduce livestock depredation.
E. Balancing Utah’s extractive industries
Extractive industries remain an important part of Utah’s economy and produced approximately $7.8 billion in mineral products in 2021.
F. Planning for two million more people on Utah’s trails
With local input, a comprehensive database of Utah’s outdoor recreation assets is now being compiled to help develop a statewide recreation strategic plan.
Chapter 2: Water
A. Long-term trends of Utah’s climate
Since 1950, Utah has experienced declining trends in precipitation, temperature, and a shift in precipitation from snow to rain.
B. Recent trends in use of the Colorado River in Utah
Low water levels in reservoirs are due to declining natural runoff, slowly increasing consumptive uses in the Upper Basin, and releases to Lower Basin. We are using more water than we have.
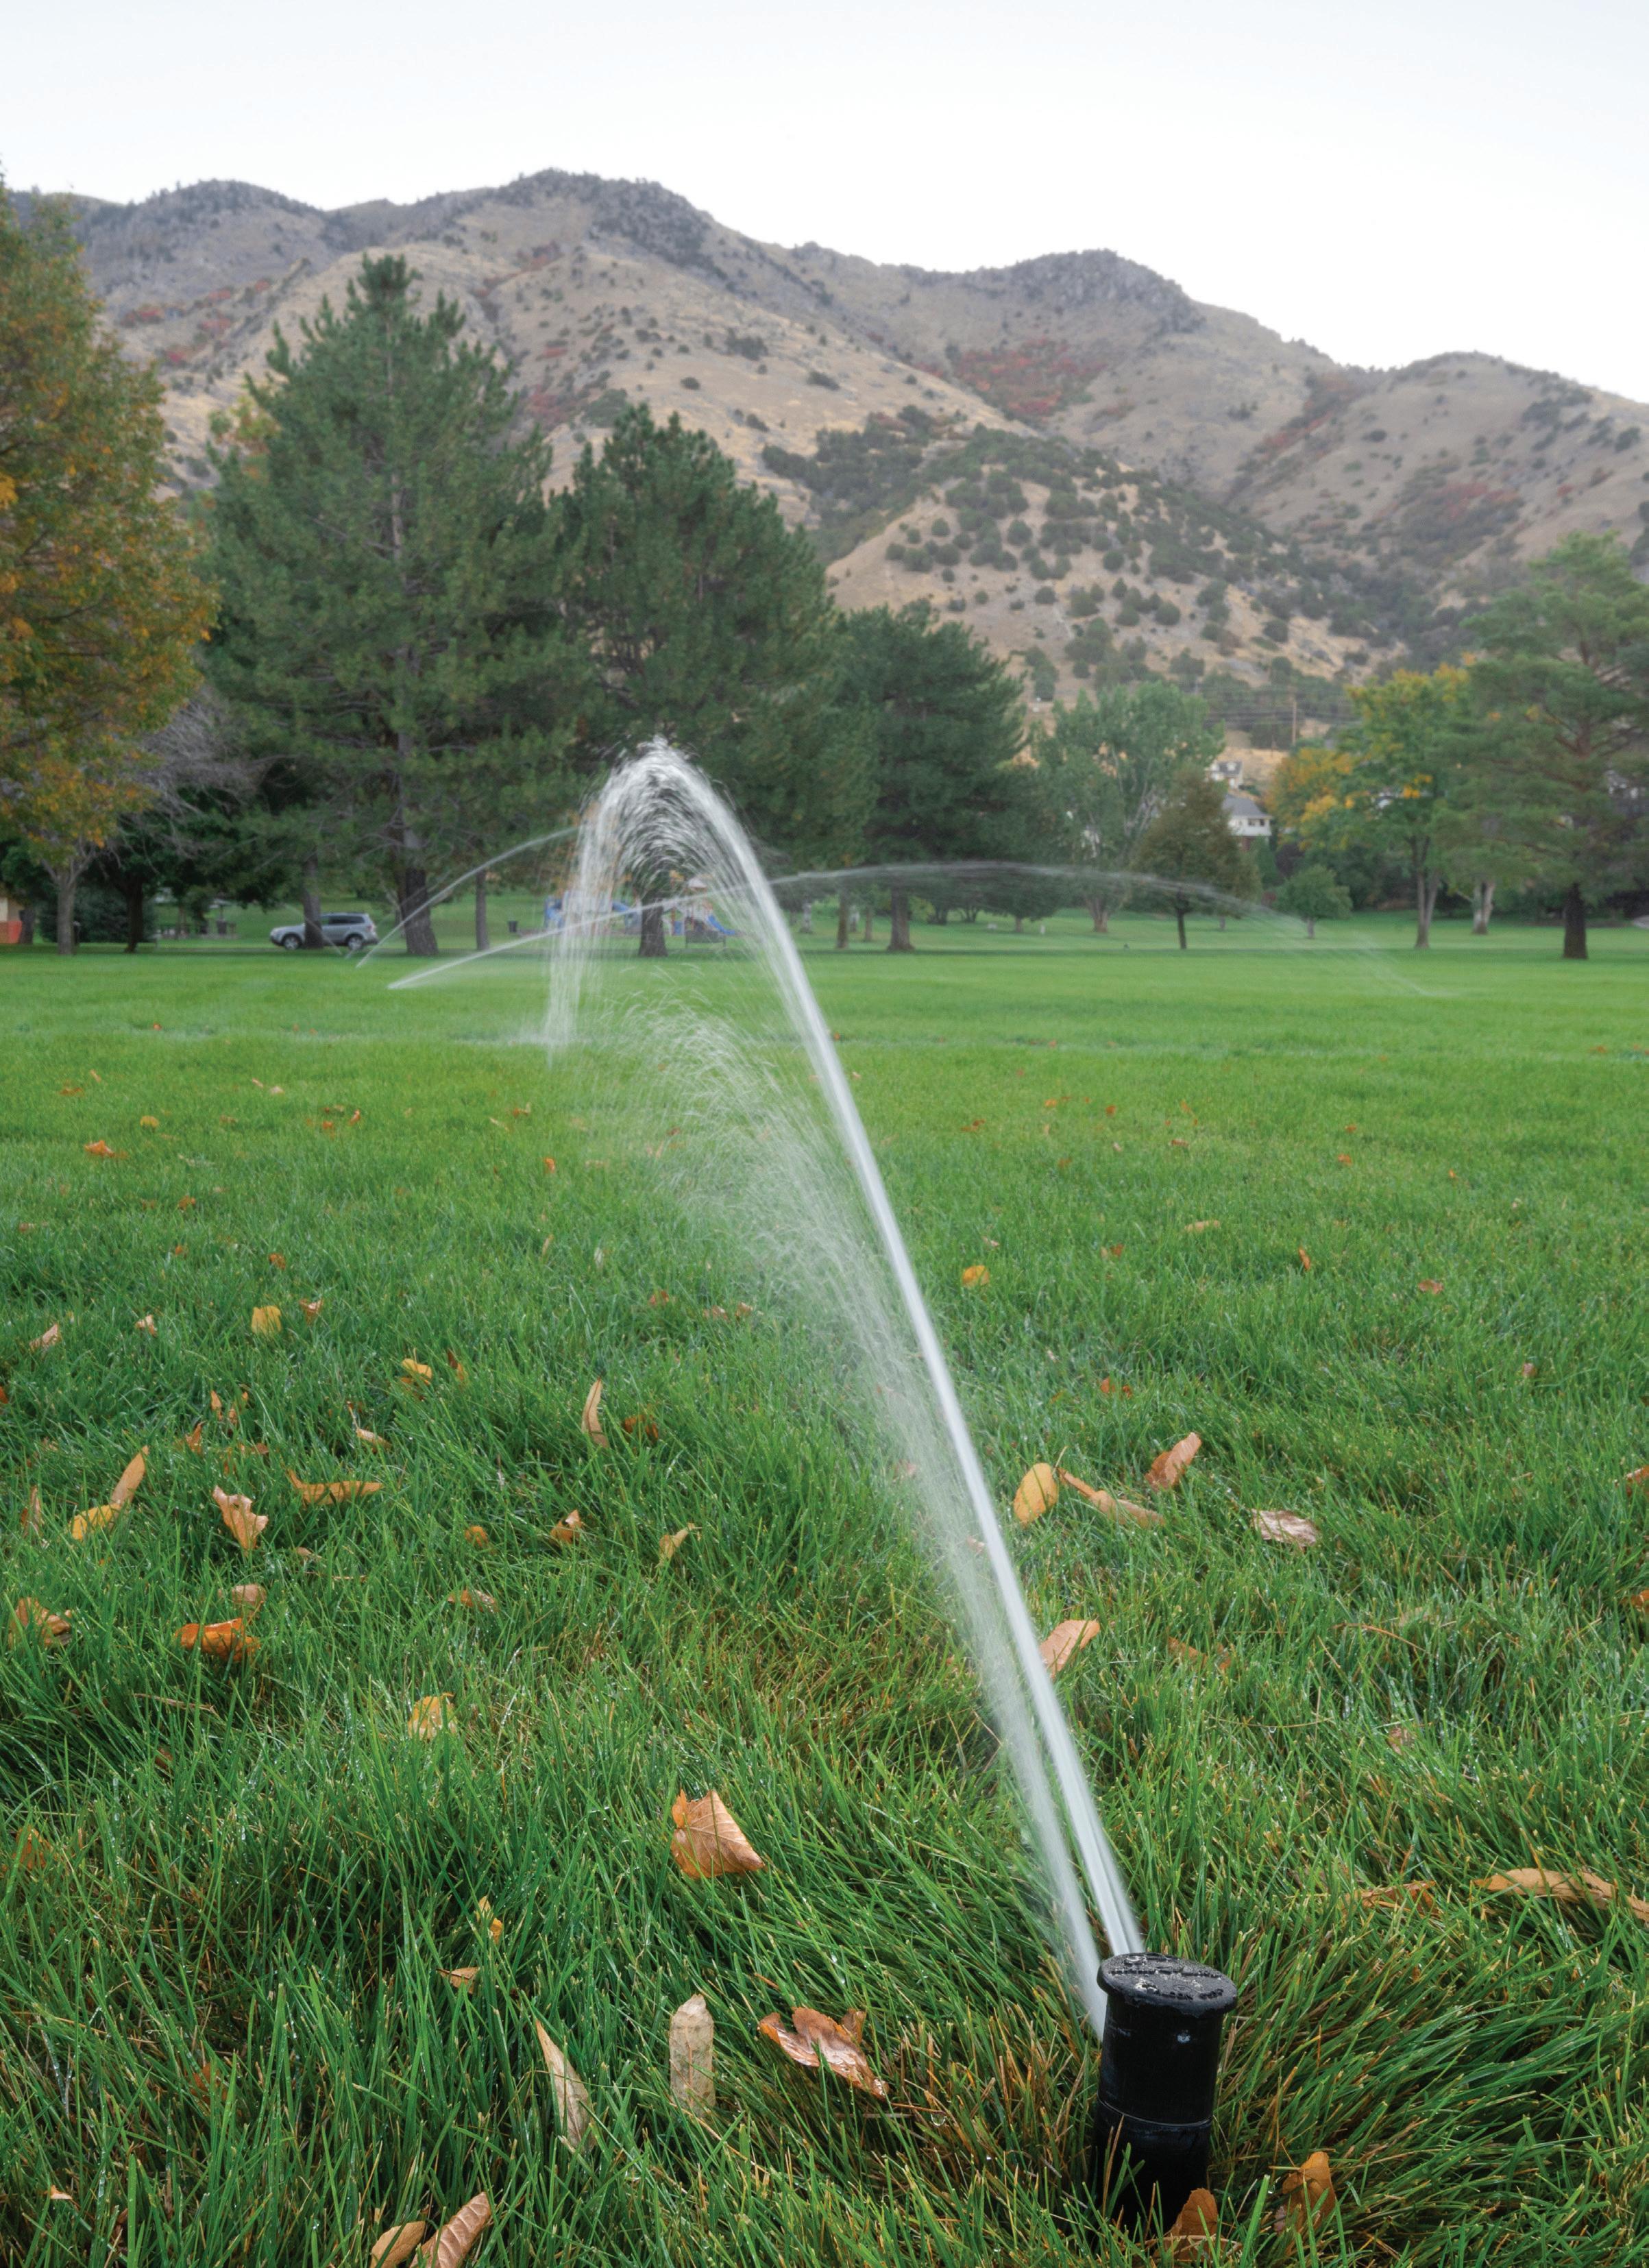
C. Urban water conservation: Helping Utah communities integrate land and water use
The way that new growth and development occurs in the state has a major impact on urban water demand. How we grow matters!
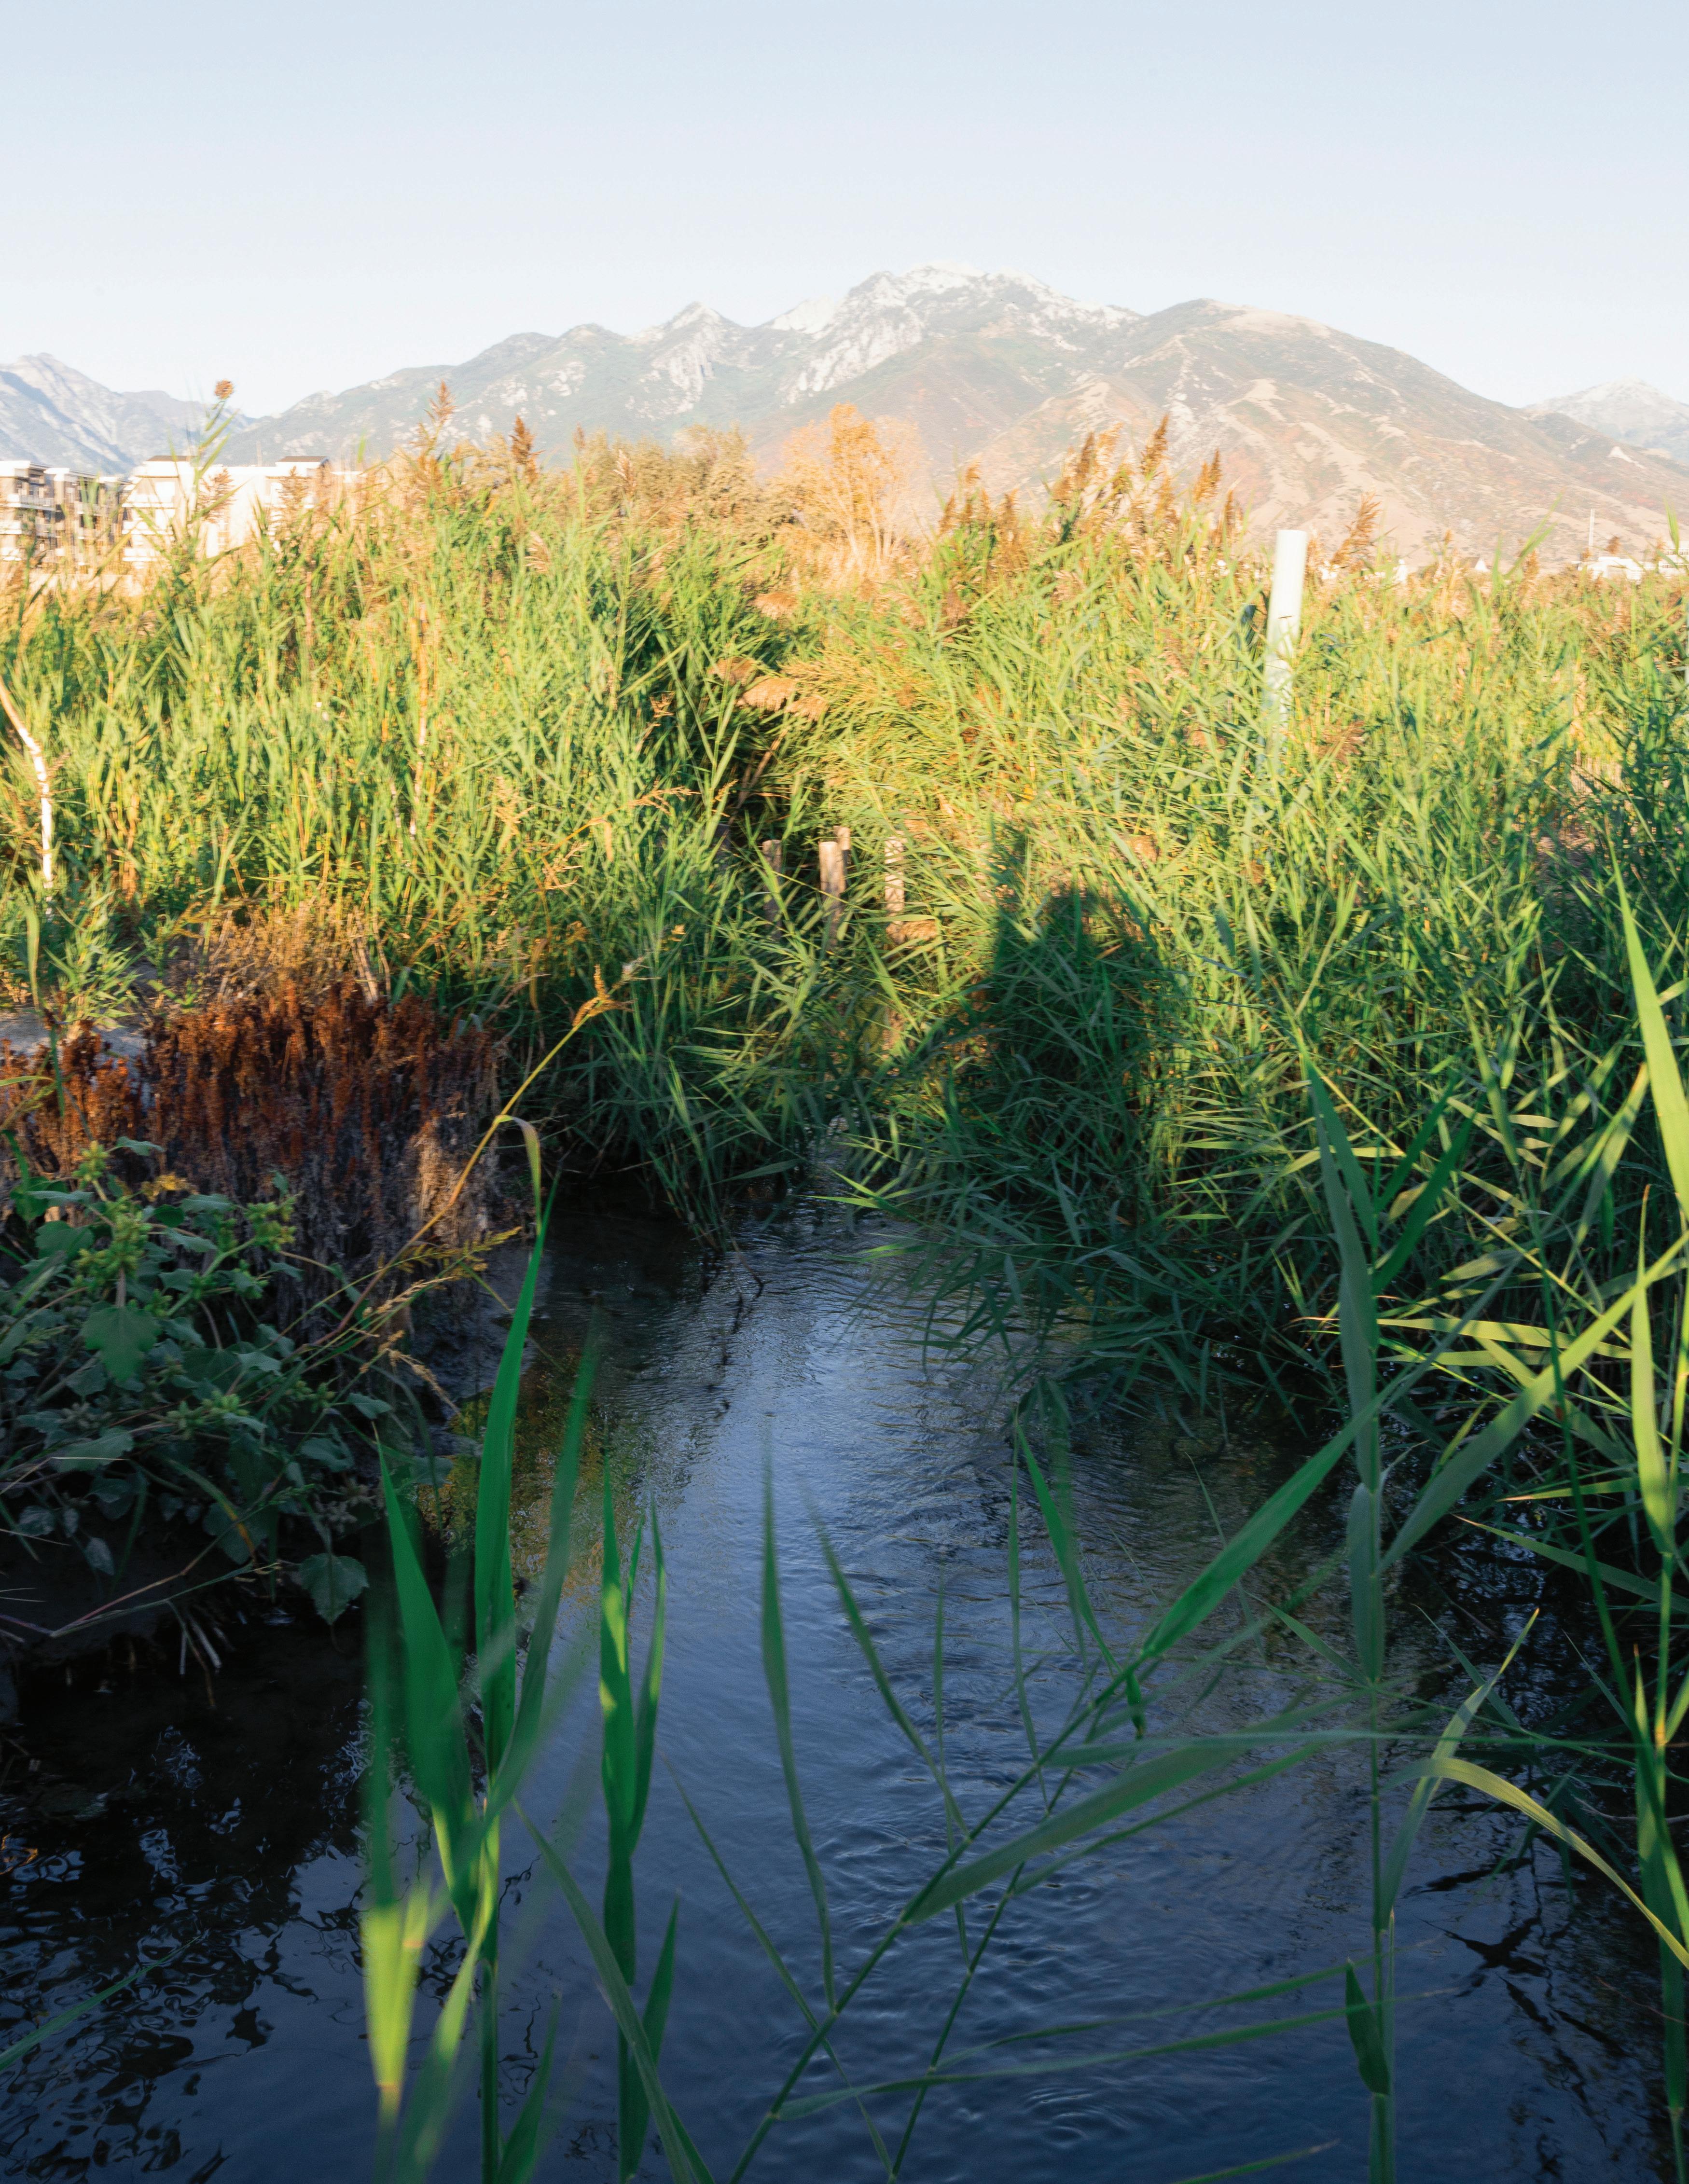
D. Nudging wetlands toward recovery after invasion and impacts Utah’s scarce wetlands suffer from lack of water, pollution, and invasive species like phragmites, but cooperative teams are working to take them back.
E.
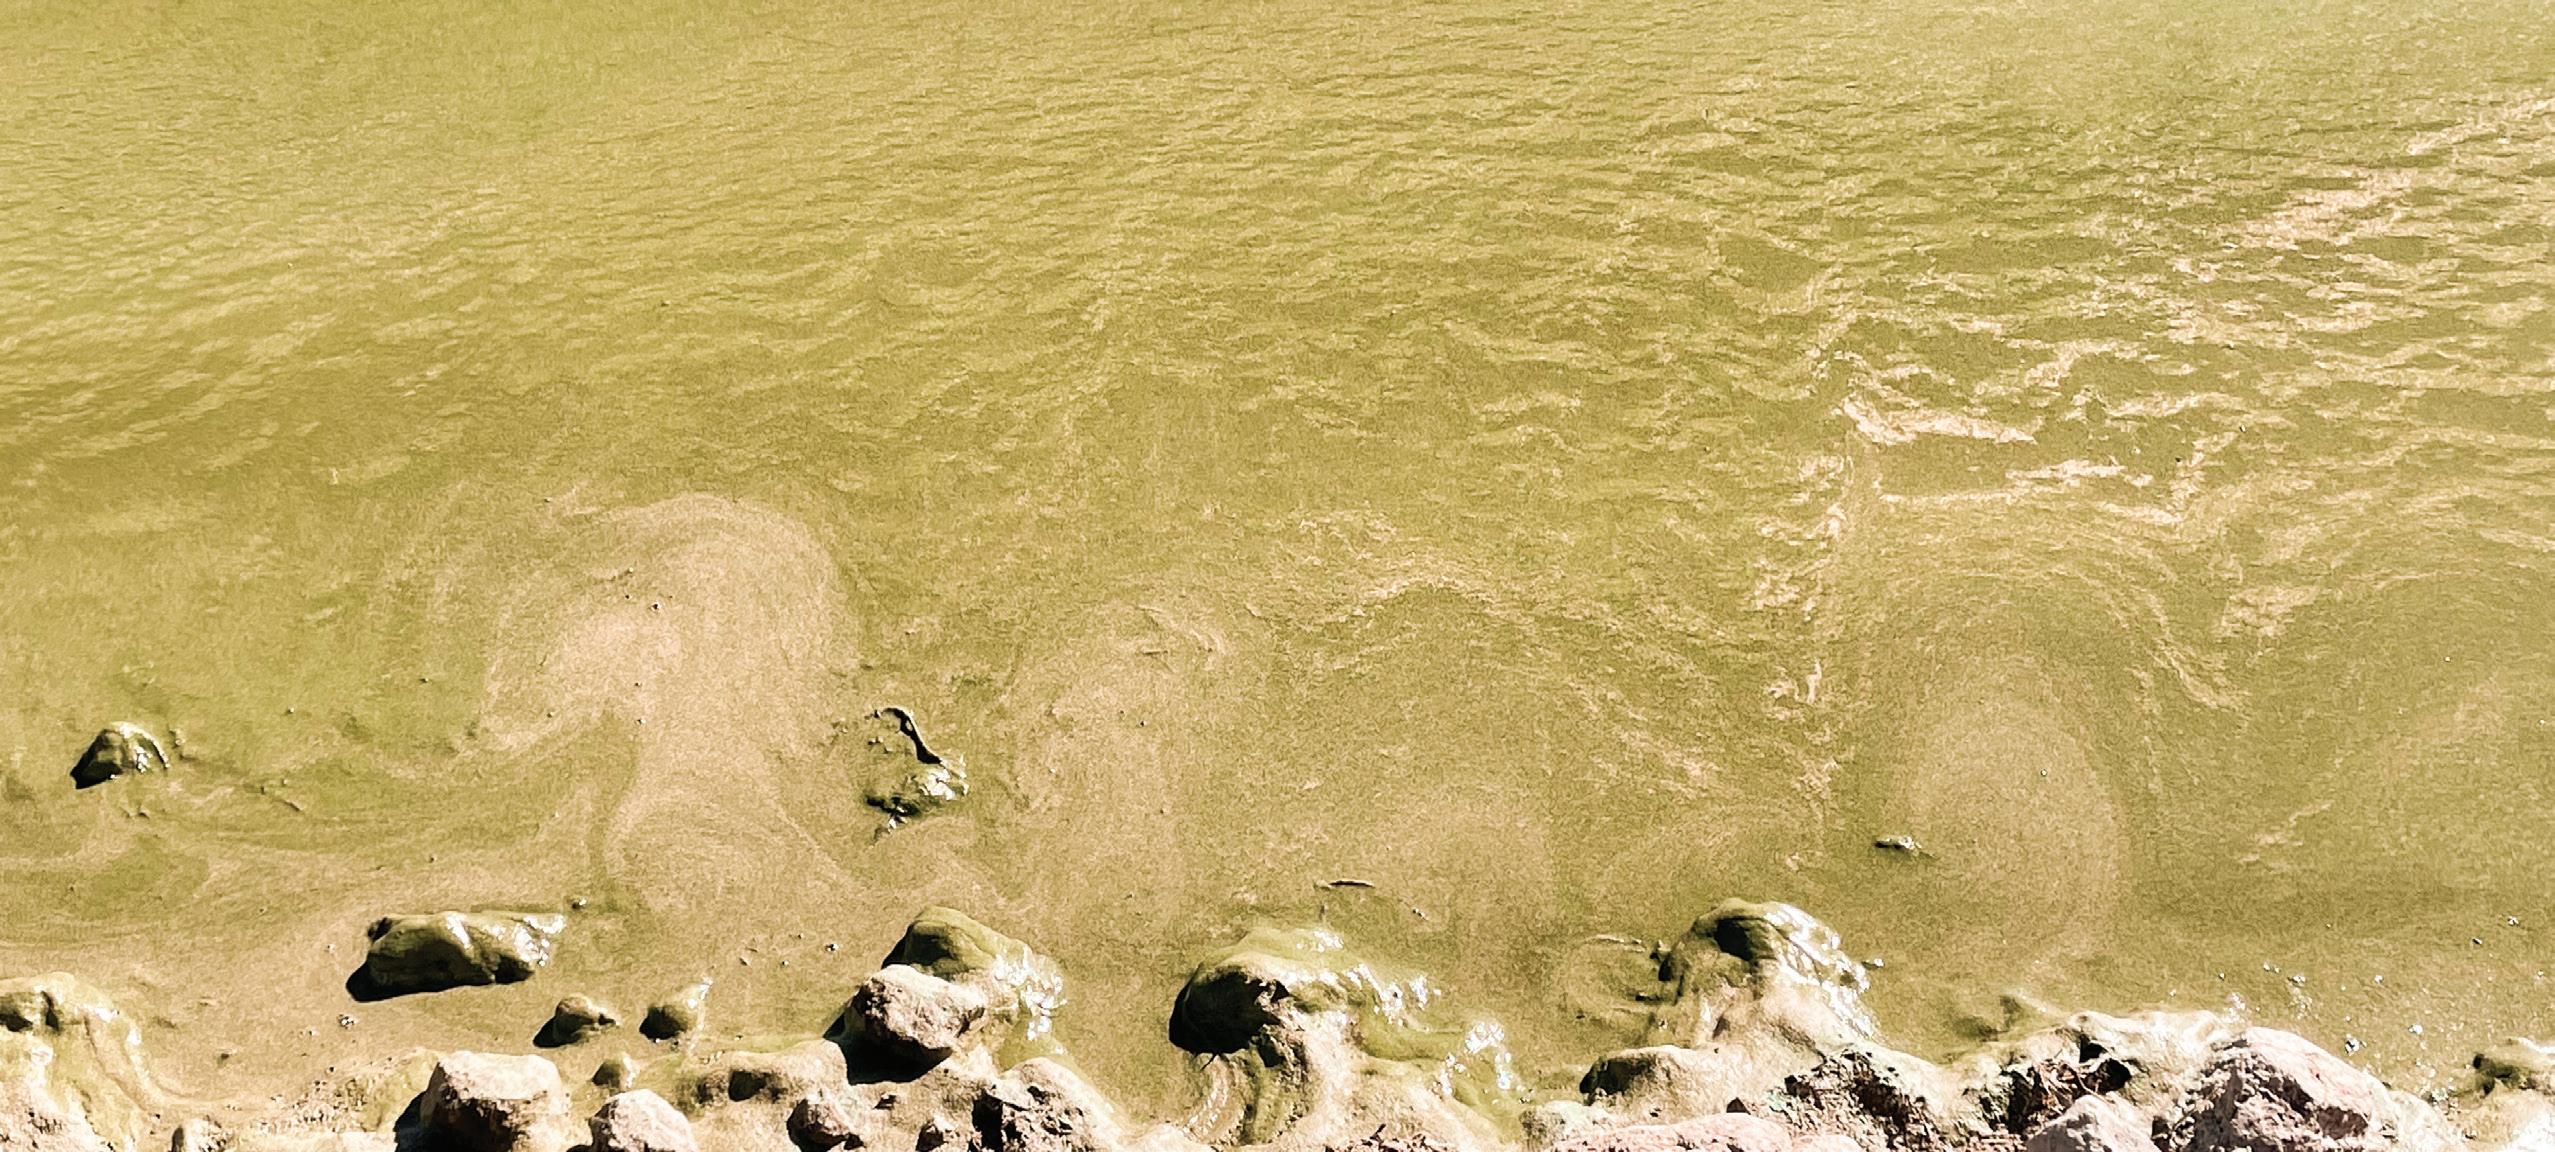
Utah’s water quality epidemic: Harmful algal blooms
Harmful algal blooms are increasing across Utah, leading to a water quality crisis that endangers human health, the environment, and economies throughout the state.
UTAH STATE UNIVERSITY 2022 REPORT TO THE GOVERNOR ON UTAH’S LAND, WATER, AND AIR 6
Chapter 3: Air
A. Northern Utah’s fine particulate matter (PM2.5)
PM2.5 remains an ongoing and complex problem in northern Utah, but we can effectively reduce wintertime PM2.5 in Cache Valley and address attainment challenges along the Wasatch Front.
B. Changing winter ozone in the Uinta Basin
Winter ozone and other pollutants have been decreasing in the Uinta Basin, but the future is uncertain.
C. Wasatch front ozone
Summertime ozone will continue to pose health and regulatory challenges for Utah’s urban areas.
D. Atmospheric ammonia along the Wasatch Front and throughout Cache Valley Gas-phase ammonia is an important precursor to northern Utah’s PM2.5 As such, it’s critical to understand the strengths and distribution of its wintertime sources.
E. Heat a growing risk for all Utahns The hottest summer on record across the state occurred in 2021, and 2022 brought more extreme temperatures, including a record-breaking 34 days over 100 ºF in Salt Lake City.
F. Transportation solutions to reduce pollution
Future electrification of vehicles in the northern Wasatch Front will be critical for addressing the area’s longstanding air pollution problems.
Chapter 4: Agriculture
A. Prioritizing water optimization in agriculture
Agriculture producers continue to optimize their water use, but much more technical support, financial support, and research is needed to guide these efforts.
B. Land-use change: Houses are the last crop
As growth continues in the state, pressure will be put on prime agricultural lands.
C. Crop production issues
Crop production in Utah supports local food security, and work is ongoing to improve plant varieties and growing practices while remaining profitable.
D. Utah’s animal agriculture, a multi-billion-dollar industry
Drought and labor costs are key challenges to Utah’s beef, sheep, goat, dairy, and poultry producers.
E. Impacts of drought on rangeland forage production across Utah Forage production on rangelands impacted by drought can take years to recover, and managers need to consider grazing timing and intensity to ensure that rebound.
Chapter 5: Great Salt Lake
A. Great Salt Lake Strike Team expert collaboration
A new collaborative team is providing urgent research support and synthesis to inform Utah’s strategies to improve watershed management and increase water levels of the Great Salt Lake.
B. Stewardship for the future of Great Salt Lake Survey research shows that Utahns care about the Great Salt Lake and support many strategies to deliver additional water to the lake.
C. All hands on deck to save Great Salt Lake Water flows through our lives, our economy, communities, and the natural environment, and all individuals and institutions are responsible for its use.
D. An increasing threat of toxic dust from a drying Great Salt Lake Dust emissions from the dry lakebed are increasing and may transport contaminants to communities and ecosystems downwind.
7
REPORT SUMMARY
Report Authors
Patrick Belmont
Department Head/Professor, Watershed Sciences & Utah Agricultural Experiment Station patrick.belmont@usu.edu
1C: The perilous link between drought, wildfire, and reservoirs
Joseph D. Birch
Post-doctoral Scholar Wildland Resources joseph.cooper@usu.edu
1A: Using tree rings to understand Utah’s long-term trends for drought and forest health
Brent Black
Professor and Extension Fruit Specialist brent.black@usu.edu
4C: Crop production issues
Janice Brahney
Associate Professor, Watershed Sciences janice.brahney@usu.edu
5D: An increasing threat of toxic dust from a drying Great Salt Lake
Brent Chamberlain
Associate Professor, Landscape Architecture and Environmental Planning brent.chamberlain@usu.edu
5C: All hands on deck to save Great Salt Lake
Yoshimitsu Chikamoto
Assistant Professor, Earth System Modeling yoshi.chikamoto@usu.edu
2A: Long-term trends of Utah’s climate
Earl Creech
Professor and USU Extension Agronomist earl.creech@usu.edu
4B: Land-use change: Houses are the last crop
4C: Crop production issues
Joanna Endter-Wada
Professor, Natural Resource Policy joanna.endter-wada@usu.edu
2C: Urban water conservation: Helping Utah communities integrate land and water use
5B: Stewardship for the future of Great Salt Lake
Courtney Flint
Professor of Natural Resource Social Science courtney.flint@usu.edu
Intro: What do Utahns care about?
Kim Frost
Executive Director at Utah Clean Air Partnership – UCAIR kim@ucair.org
3C: Wasatch Front ozone
Matthew Garcia
USU Extension Beef Specialist matthew.garcia@usu.edu
4D: Utah’s Animal agriculture, a multi-billion-dollar industry
Robert Gillies
Professor of Climate Science, State Climatologist, and Director of the Utah Climate Center robert.gillies@usu.edu
2A: Long-term trends of Utah’s climate
Lynnette
Harris
Writer/Editor for Agriculture, Applied Sciences, and Utah Agriculture Experiment Station lynnette.harris@usu.edu
4B: Land-use change: Houses are the last crop
Daniella Hirschfeld
Assistant Professor, Landscape Architecture and Environmental Planning daniella.hirschfeld@usu.edu
5C: All hands on deck to save Great Salt Lake
Peter Howe
Associate Professor of Geography peter.howe@usu.edu
3E: Heat a growing risk for all Utahns
Todd Johnson
Professional Practice Associate Professor, Landscape Architecture and Environmental Planning todd.johnson@usu.edu
5C: All hands on deck to save Great Salt Lake
Left: American avocet in shallow water- Antelope Island, Great Salt Lake

UTAH STATE UNIVERSITY 2022 REPORT TO THE GOVERNOR ON UTAH’S LAND, WATER, AND AIR 8
Karin Kettenring
Professor of Wetland Ecology karin.kettenring@usu.edu
2D: Nudging wetlands toward recovery after invasion and impacts
Kelly Kopp
Professor, USU Extension Water Conservation and Turfgrass Specialist kelly.kopp@usu.edu
2C: Helping Utah communities integrate land and water use
Carlos Licon
Associate Professor, Landscape Architecture and Environmental Planning carlos.licon@usu.edu
5C: All hands on deck to save Great Salt Lake
James A. Lutz
T. W. Daniel Professor of Forestry, Wildland Resources james.lutz@usu.edu
1A: Using tree rings to understand Utah’s long-term trends for drought and forest health
Seth Lyman
Director, Bingham Research Center and Research Associate Professor, Department of Chemistry and Biochemistry seth.lyman@usu.edu
3B: Changing winter ozone in the Uinta Basin
Randy
Martin
Head, Environmental Engineering Program, Dept. of Civil & Environmental Engineering, Utah Water Research Laboratory randy.martin@usu.edu
3A: Northern Utah’s fine particulate matter (PM2.5)
3D: Atmospheric ammonia along the Wasatch Front and throughout Cache Valley
Anna McEntire
Associate Director, Janet Quinney Lawson Institute for Land, Water, and Air anna.mcentire@usu.edu
5A: Great Salt Lake Strike Team expert collaboration
Jon Meyer
Assistant State Climatologist jon.meyer@aggiemail.usu.edu
2A: Long-term trends of Utah’s climate
Jana Milford
Emeritus Professor of Mechanical Engineering and Environmental Engineering University of Colorado Boulder jana.milford@colorado.edu
3F: Transportation solutions to reduce pollution
Chad Page
USU Extension Sheep and Goat Specialist chad.page@usu.edu
4D: Utah animal agriculture, a multi-billion-dollar industry
Bruce Richards
Extension Dairy Specialist bruce.richards@usu.edu
4D: Animal agriculture in Utah, a multi-billion-dollar industry
Erin Rivers
Assistant Professor and Water Quality Extension Specialist, Watershed Sciences erin.rivers@usu.edu
2E: Utah’s water quality epidemic: Harmful algal blooms
John C. Schmidt
Janet Quinney Lawson Chair and Director, Center for Colorado River Studies jack.schmidt@usu.edu
2B: Recent trends in use of the Colorado River in Utah
Jordan Smith
Associate Professor, Environment and Society; Director, Institute of Outdoor Recreation and Tourism jordan.smith@usu.edu
1F: Planning for two million more people on Utah’s trails
Brian Steed
Executive Director, Janet Quinney Lawson Institute for Land, Water, and Air brian.steed@usu.edu
1E: Balancing Utah's extractive industries
Eric Thacker
Associate Professor and USU Extension Range Management Specialist eric.thacker@usu.edu
4E: Impacts of drought on rangeland forage production across Utah
Jennifer Turk
Graduate Research Assistant University of Colorado Boulder jennifer.turk@colorado.edu
3F: Transportation solutions to reduce pollution
Timothy Wright
Graduate Research Assistant Utah State University Department of Plants, Soils, and Climate
2A: Long-term trends of Utah’s climate
Larissa Yocom
Assistant Professor, Wildland Resources larissa.yocom@usu.edu
1B: Low wildfire activity puts Utah lands further into fire deficit
Matt Yost
Agroclimate USU Extension Specialist, Associate Department Head, Director of USU Crops matt.yost@usu.edu
4A: Prioritizing water optimization in agriculture
Julie K. Young
Associate Professor, Department of Wildland Resources julie.young@usu.edu
1D: Reducing livestock depredation
9
REPORT AUTHORS

10
Contributors & support
The 2022 Report to to the Governor on Utah’s Land, Water, and Air is published by the Janet Quinney Lawson Institute for Land, Water, and Air at Utah State University, with contributions from numerous individuals at USU and from other statewide partners.
Editors
Brian Steed
Executive Director, Janet Quinney Lawson Institute for Land, Water, and Air
Anna McEntire
Associate Director, Janet Quinney Lawson Institute for Land, Water, and Air
Editorial Support
Lael Gilbert
Public Relations Specialist for the S.J. and Jessie E. Quinney College of Natural Resources
Lynnette Harris
Writer/Editor for Agriculture, Applied Sciences, and Utah Agriculture Experiment Station
Thomas Sorenson
Team Lead, Janet Quinney Lawson Institute for Land, Water, and Air
Design
Jake Patterson
Graphic Designer for Research Communications at USU
Anna McEntire
Associate Director, Janet Quinney Lawson Institute for Land, Water, and Air
Thomas Sorenson
Team Lead, Janet Quinney Lawson Institute for Land, Water, and Air
Nathan Stucki
Marketer, Research Communications at USU
Photography
Aaron Fortin
Multimedia Coordinator, Janet Quinney Lawson Institute for Land, Water, and Air
Additional Support
Daniel Lenhart
Program Assistant for Research Communications at USU
Shari Linares
Communications Assistant for Research Communications at USU
Tabitha Smiel
Communications Assistant, Janet Quinney Lawson Institute for Land, Water, and Air
Michelle Smith
Administrative Assistant, Janet Quinney Lawson Institute for Land, Water, and Air
Left: Sunset in the canyon- Bryce Canyon National Park

11
Advisory Board
Dr. Brian Steed, Chair
Executive Director of the Janet Quinney Lawson Institute for Land, Water, and Air
Anna McEntire, Co-chair
Associate Director of the Janet Quinney Lawson Institute for Land, Water, and Air
Neil Abercrombie
Senior Advisor for Legislative Affairs and Policy in the Office of the Governor
Matt Anderson
Community Relationships Manager for Intermountain Healthcare
Dr. Paul Barr USU Vice Provost
John Baza
Director of the Utah Division of Oil, Gas, and Mining
Sue Bellagamba
Canyonlands Regional Director at Utah Nature Conservancy
Kelsey Berg
Deputy Chief of Staff to Senator Mitt Romney
Rep. Joel Briscoe
Utah House of Representatives
Josh Brown
Director of Government Affairs at Rio Tinto Kennecott
Craig Buttars
Commissioner of the Utah Department of Agriculture and Food
Jon Cox
Vice President of Government Relations at Rocky Mountain Power
Josh Craft
Government and Corporate Relations Manager at Utah Clean Energy
Cameron Diehl
Executive Director of Utah League of Cities and Towns
Senator Luz Escamilla Utah State Senate
Joel Ferry
Executive Director of the Utah Department of Natural Resources
Spencer Gibbons
CEO of the Utah Farm Bureau Federation
Brandy Grace
CEO of the Utah Association of Counties
Pitt Grewe
Director of the Utah Office of Outdoor Recreation
Andrew Gruber
Executive Director of Wasatch Front Regional Council
UTAH STATE UNIVERSITY 2022 REPORT TO THE GOVERNOR ON UTAH’S LAND, WATER, AND AIR 12
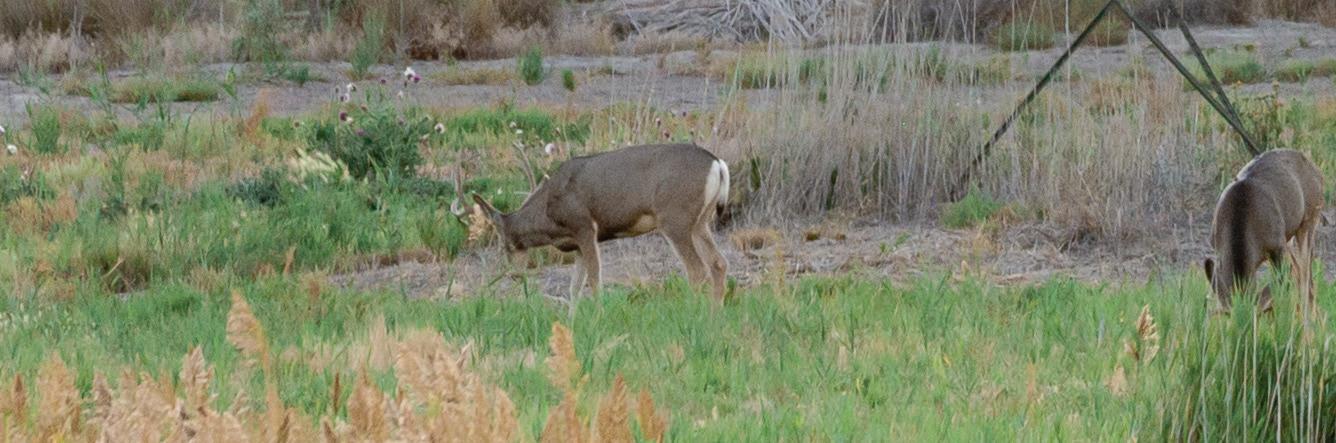
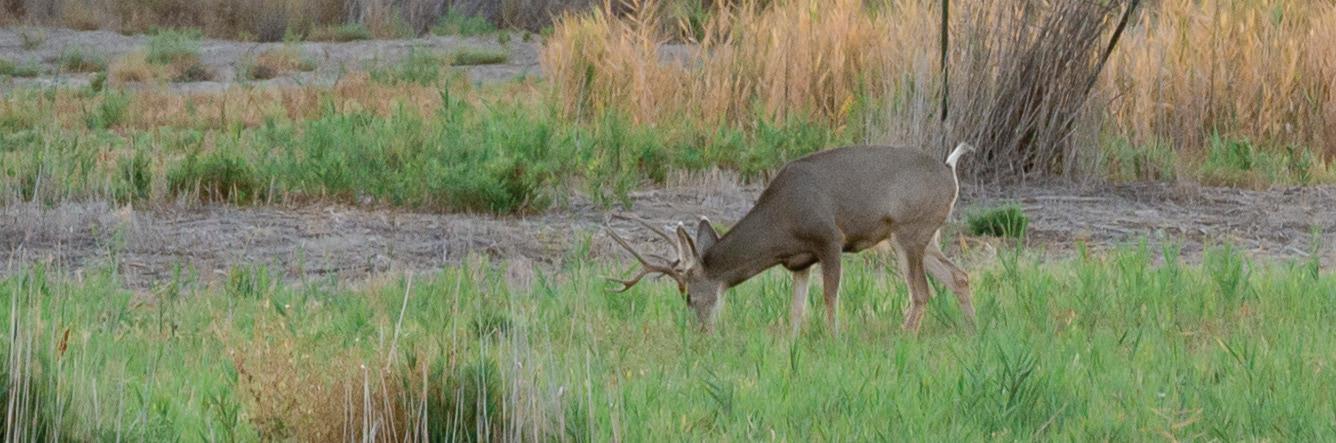
Below: Deer graze - Galena Soo’nkahni Preserve, Bluffdale
Rep. Tim Hawkes
Utah House of Representatives
Senator David Hinkins
Utah State Senate
Beth Holbrook
Utah Transit Authority Board of Trustees
Abbi Hunt
Council Member for the City of Kaysville
Dustin Jansen
Director of the Utah Division of Indian Affairs
Redge Johnson
Executive Director of the Public Lands Policy Coordinating Office
Robert Keiter
Director of the Wallace Stegner Center of Land, Resources, and the Environment at the University of Utah
Celeste Maloy
Counsel for Congressman Chris Stewart
Corey Norman
Chief of Staff to Congressman John Curtis
Tammy Pearson
Beaver County Commissioner
Dr. Ivonne Santiago
ASPIRE (Advancing Sustainability through Powered Infrastructure for Roadway Electrification)
Dr. Jennifer Seelig
Director of Community Partnerships at USU
Kim Shelley
Executive Director of the Utah Department of Environmental Quality
Jacey Skinner
Utah State University Board of Trustees
Rep. Casey Snider
Utah House of Representatives
Shawn Teigen
Vice President and Research Director at Utah Foundation
Greg Todd
Director of the Utah Office of Energy Development
Senator Evan Vickers
Utah State Senate
13
ADVISORY BOARD
USU Steering Committee
Brian Steed, Chair
Executive Director of the Janet Quinney
Lawson Institute for Land, Water, and Air
Anna McEntire, Co-chair
Associate Director of the Janet Quinney Lawson Institute for Land, Water, and Air
Lisa Berreau
Vice President for Research
Keith Christensen
Department Head, Landscape Architecture and Environmental Planning
Joanna Endter-Wada
Professor, Natural Resource Policy and Social Science
Linda Nagel
Dean, S.J. & Jessie E. Quinney College of Natural Resources
Jennifer Seelig
Director of Community Partnerships
David Tarboton
Director, Utah Water Research Laboratory
Ken White Dean, College of Agriculture and Applied Sciences
Matt White
Vice President for Advancement
Devin Wiser
Vice President for Government Relations
Matt Yost
Agroclimate USU Extension Specialist, Associate Department Head, Director of USU Crops
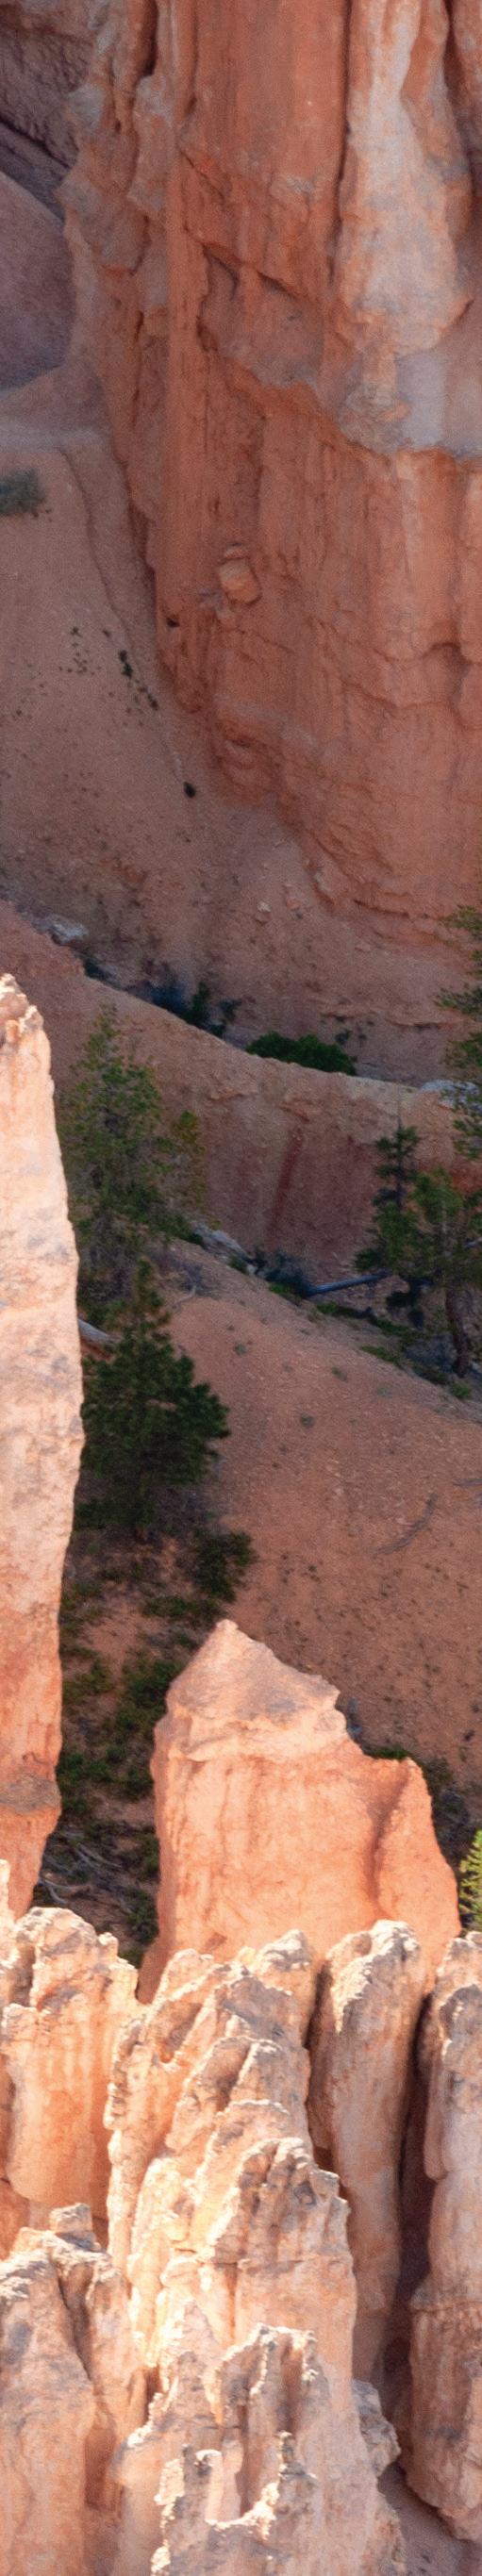
Right: Looking up the hoodoosBryce Canyon National Park
14
INTRO:
What do Utahns care about?
Flint
TAKEAWAY
Most of Utah’s top community concerns relate to land, water, and air, with water supply at the top of the list.

The Utah Wellbeing Survey project is designed to assess the wellbeing and local perspectives of city residents, and to provide information to city leaders to inform their general planning processes. In early 2022, 33 cities participated in the survey with a total of 9,947 completed surveys. Questions on the survey include rating and importance of ten different domains or categories of wellbeing, participation in recreation and nature-related activities, perspectives on local population growth and economic development, the influence of landscape features on wellbeing, concerns for the future, and an array of demographic characteristic questions.
For 21 of 33 cities surveyed in 2022, water supply was the top issue with at least 83 percent (and often much higher) of respondents indicating it was a moderate or major concern. For all other cities in the project, water supply was in the top three, with at least 63 percent indicating major or moderate concern.
In relation to landscape features of a community, residents said that mountains, rivers and streams, city parks, trails, lakes, farmland, and red rock most positively influenced their wellbeing. Additionally, outdoor recreation and nature-based activity participation was strongly correlated with higher wellbeing scores and/or community connection scores.
Perhaps most importantly, eight of the top ten concerns listed by residents of those cities were related to Utah’s land, water, or air, with water supply at the top of the list. These results underline the need for researchers, policymakers, and other leaders to develop strategic studies, investments, and actions regarding Utah’s shared resources.
Courtney
UTAH STATE UNIVERSITY 2022 REPORT TO THE GOVERNOR ON UTAH’S LAND, WATER, AND AIR 16
Right: Golden hour of birdsAntelope Island, Great Salt Lake
Eight of the top ten concerns listed by residents were related to Utah’s land, water, or air.
Public safety Roads and transportation Air quality Affordable housing Water supply
Access to quality food Recreation opportunities Opportunities for youth Access to public land
Water supply Affordable housing Air quality Roads and transportation Public safety Access to public land Opportunities for youth Recreation opportunities Access to quality food Climate change Suicide
Access to mental health care Suicide Climate change
Access to health care Employment opportunities
Social and emotional support
Substance abuse
Access to mental health care Employment opportunities Access to health care Social and emotional support Substance abuse Shopping opportunities
Shopping opportunities
Residents from 33 Utah cities listed key concerns within their communities. Land, water, and air issues appeared highly and frequently in responses. Source: https://www.usu.edu/utah-wellbeing-project/reports/2022/statewide_report_2022
-100% -80% -60% -40% -20% 0% 20% 40% 60% 80% 100%
Figure I.A How much of a concern are the following issues? (2022)
Not a concern at all Slight concern Moderate concern Major concern
79% 78% 75% 66% 64% 62% 61% 59% 59% 57% 49% 49% 47% 47% 46% 44%
87%
INTRODUCTION
18
Above: Near Tony Grove, Cache County (photo by Dennis Hinkamp)
1A
— 20 1B Low
— 22 1C The
— 24 1D Reducing livestock depredation — 26 1E Balancing Utah’s extractive industries — 28 1F Planning for two million more people on Utah’s trails — 30
one LAND
Using tree rings to understand Utah’s long-term trends for drought and forest health
wildfire activity puts Utah lands further into fire deficit
perilous link between drought, wildfire, and reservoirs
Chapter
Tree rings show that, in the past, Utah experienced drought even more severe than what we are experiencing today, indicating that we may not have yet reached a worst-case scenario.
Using tree rings to understand Utah’s long-term trends for drought and forest health
James A. Lutz and Joseph D. Birch
The drought that’s currently impacting the entire southwestern U.S. has recently been rated as the worst in the last 1,200 years1. But what about Utah? Are local conditions different from these dire regional averages? To determine this, we examined tree-ring data from bristlecone pine trees, snags, and logs in Cedar Breaks National Monument and tracked conditions in southern Utah over more than a millennium. We specifically wanted to know if this historical record shows that there have been more extreme droughts compared to what we are now experiencing.
In the analysis we could see evidence of the current drought. We found that even resilient bristlecone pines showed a decrease in growth in 2020-2021, consistent with the regional trends. But we also found that trees in southern Utah experienced prolonged periods of low growth even more severe than what we are experiencing today. During the Dust Bowl (mid-1930s), the early 1400s, and several periods before 1000 A.D., tree growth occurred much more slowly than it does now— most likely because of intense drought. Some years even showed missing rings, indicating conditions so detrimental to tree growth that no growth was even added. Other factors may have also played a part in trends, including long, cold winters, tree crowding, outbreaks of disease/insects and fire, but the most likely long-term cause for these trends over time is drought.
These remarkably dry periods sometimes lasted many decades—much longer than 20 years. What this implies is that if such scenarios happened in the past, they could happen again. As bad as the current drought is, we may not have yet reached a worst-case scenario, based on the natural record over the past millennium. Tree-ring patterns show that such droughts can occur and can last longer than two decades.
20 UTAH STATE UNIVERSITY 2022 REPORT TO THE GOVERNOR ON UTAH’S LAND, WATER, AND AIR
TAKEAWAY 1A:
Remarkably dry periods sometimes lasted many decades, much longer than 20 years.

Figure 1A.1 Tree growth in Cedar Breaks National Monument (0-2000 A.D.)
Preliminary data for tree growth as analyzed from bristlecone pine trees, snags, and logs in Cedar Breaks National Monument, southwest Utah. The average widths of tree rings showing growth years 0 – 2020 A. D. is divided into years of higher growth (green) and lower growth (red). Lower growth rates among many trees in decadal periods are most likely due to periods of drought. Ring width index is an indicator of annual radial growth at the scale of individual trees.

21 CHAPTER ONE: LAND
0.6
0 100 200 300 400 500 600 700 800 900 1000 1100 1200 1300 1400 1500 1600 1700 1800 1900 2000
0.8 1.0 1.2 1.4
Ring width index Year
Low wildfire activity puts Utah lands further into fire deficit
Larissa Yocom
TAKEAWAY
To reduce the risk of catastrophic wildfire, we need more active management, including more beneficial fire on the ground.
Utah, like much of the West, is a flammable landscape. Fires have always burned in this region, and fire historically played an important role in maintaining healthy ecosystems. However, today, wildfire is often not a welcome occurrence in watersheds, on grazing allotments, or near communities. The central challenge fire managers face is in balancing the use and promotion of beneficial fire while avoiding the devastating impacts of unplanned fires in places they do not want and in ways they cannot control.
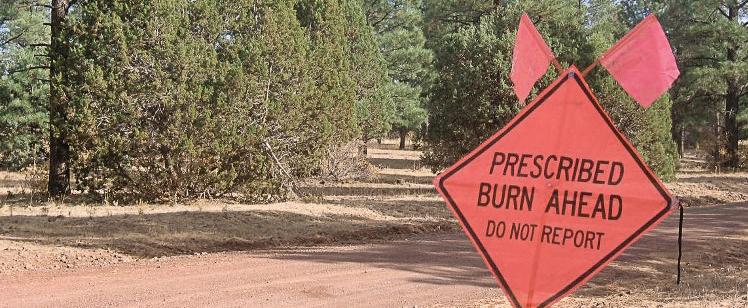
Despite the high summer temperatures, Utah saw very little fire activity in 2022, with 25,549 acres burned. Prescribed fire acreage was also low, partially because prescribed fires were not permitted on land managed by the U.S. Forest Service in the summer of 2022. The inability of Forest Service managers to use prescribed fire as a tool hampered fuel reduction efforts across the country, even in regions where local conditions were ideal for safe and effective burning.
Utahns can increase wildfire readiness by fire-hardening their homes, following firewise principles on their properties and in their communities, and supporting state and federal efforts to actively manage forests to reduce fire risk on public lands. Active management may include mechanical treatments, pile burns, or prescribed burns. Compared to wildfire, these treatments pose less risk to firefighters, produce less smoke, and are less likely to affect private property. While we cannot eliminate fire, opting for active management, including fire during moderate conditions, is a much better choice than the alternative, which is unstoppable fire during dangerous conditions.
1B:
22 UTAH STATE UNIVERSITY 2022 REPORT TO THE GOVERNOR ON UTAH’S LAND, WATER, AND AIR
Opting for fire during moderate conditions is a much better choice than unstoppable fire during dangerous conditions.
23 CHAPTER ONE: LAND
Above: Prescribed burn area (Larissa Yocom)
The perilous link between drought, wildfire, and reservoirs
 Patrick Belmont
There’s just no getting away from the fact that we live in a highly flammable landscape; fire is inevitable in the West. The challenge before us is how to best manage the risks. Decades of fire suppression have caused forests to become overgrown, and a warmer and a drier climate has profoundly changed wildfire timing and severity. Since the mid-20th century (when land managers still assumed they could suppress fire indefinitely), we’ve built hundreds of large reservoirs and millions of homes in places that are highly prone to wildfire. Many will be very difficult and expensive to defend when a wildfire occurs. The task now is to better plan future development and prioritize available funds to reduce existing risks. A research group at USU has developed a model to predict where highseverity wildfires are most likely to occur, how floods and erosion will
A model developed at USU helps managers to predict which reservoirs are most vulnerable to flooding and erosion from wildfires.
1C: Figure 1C.1 Fuel treatments to reduce debris flow, erosion, and deposition to Utah’s reservoirs 1. High severity burn 2. Post-fire rainfall 3. Debris flow generation 4. Sediment routing Erosion and deposition in fish habitat. Large loss of reservoir capacity. Minimal impact to fish habitat. Minimal loss of reservoir capacity. 2. Post-fire rainfall 3. Debris flow generation 4. Sediment routing 1. Moderate/ low severity burn NO FUEL TREATMENT MODELED FUEL TREATMENT B.P.Murphy
24 UTAH STATE UNIVERSITY 2022 REPORT TO THE GOVERNOR ON UTAH’S LAND, WATER, AND AIR
TAKEAWAY
Utah reservoirs are at risk for filling with ash, mud, and sediment following a wildfire.
increase because of fire, and how far downstream those impacts are likely to spread. The goal of this model is to identify which of Utah’s reservoirs are most at risk for filling with ash, mud, and sediment from the severe erosion and flash flooding that can occur in the years following an upstream wildfire.
Of Utah’s 137 large water supply reservoirs, modeled results show a
wide range of vulnerability, depending on differences in potential burn severity and how a fire scar is connected to the reservoir downstream. Leaders can use this information to allocate resources toward actively managing landscapes where it can do the most good toward minimizing negative repercussions of unplanned fire and protecting Utah’s most vulnerable reservoirs.
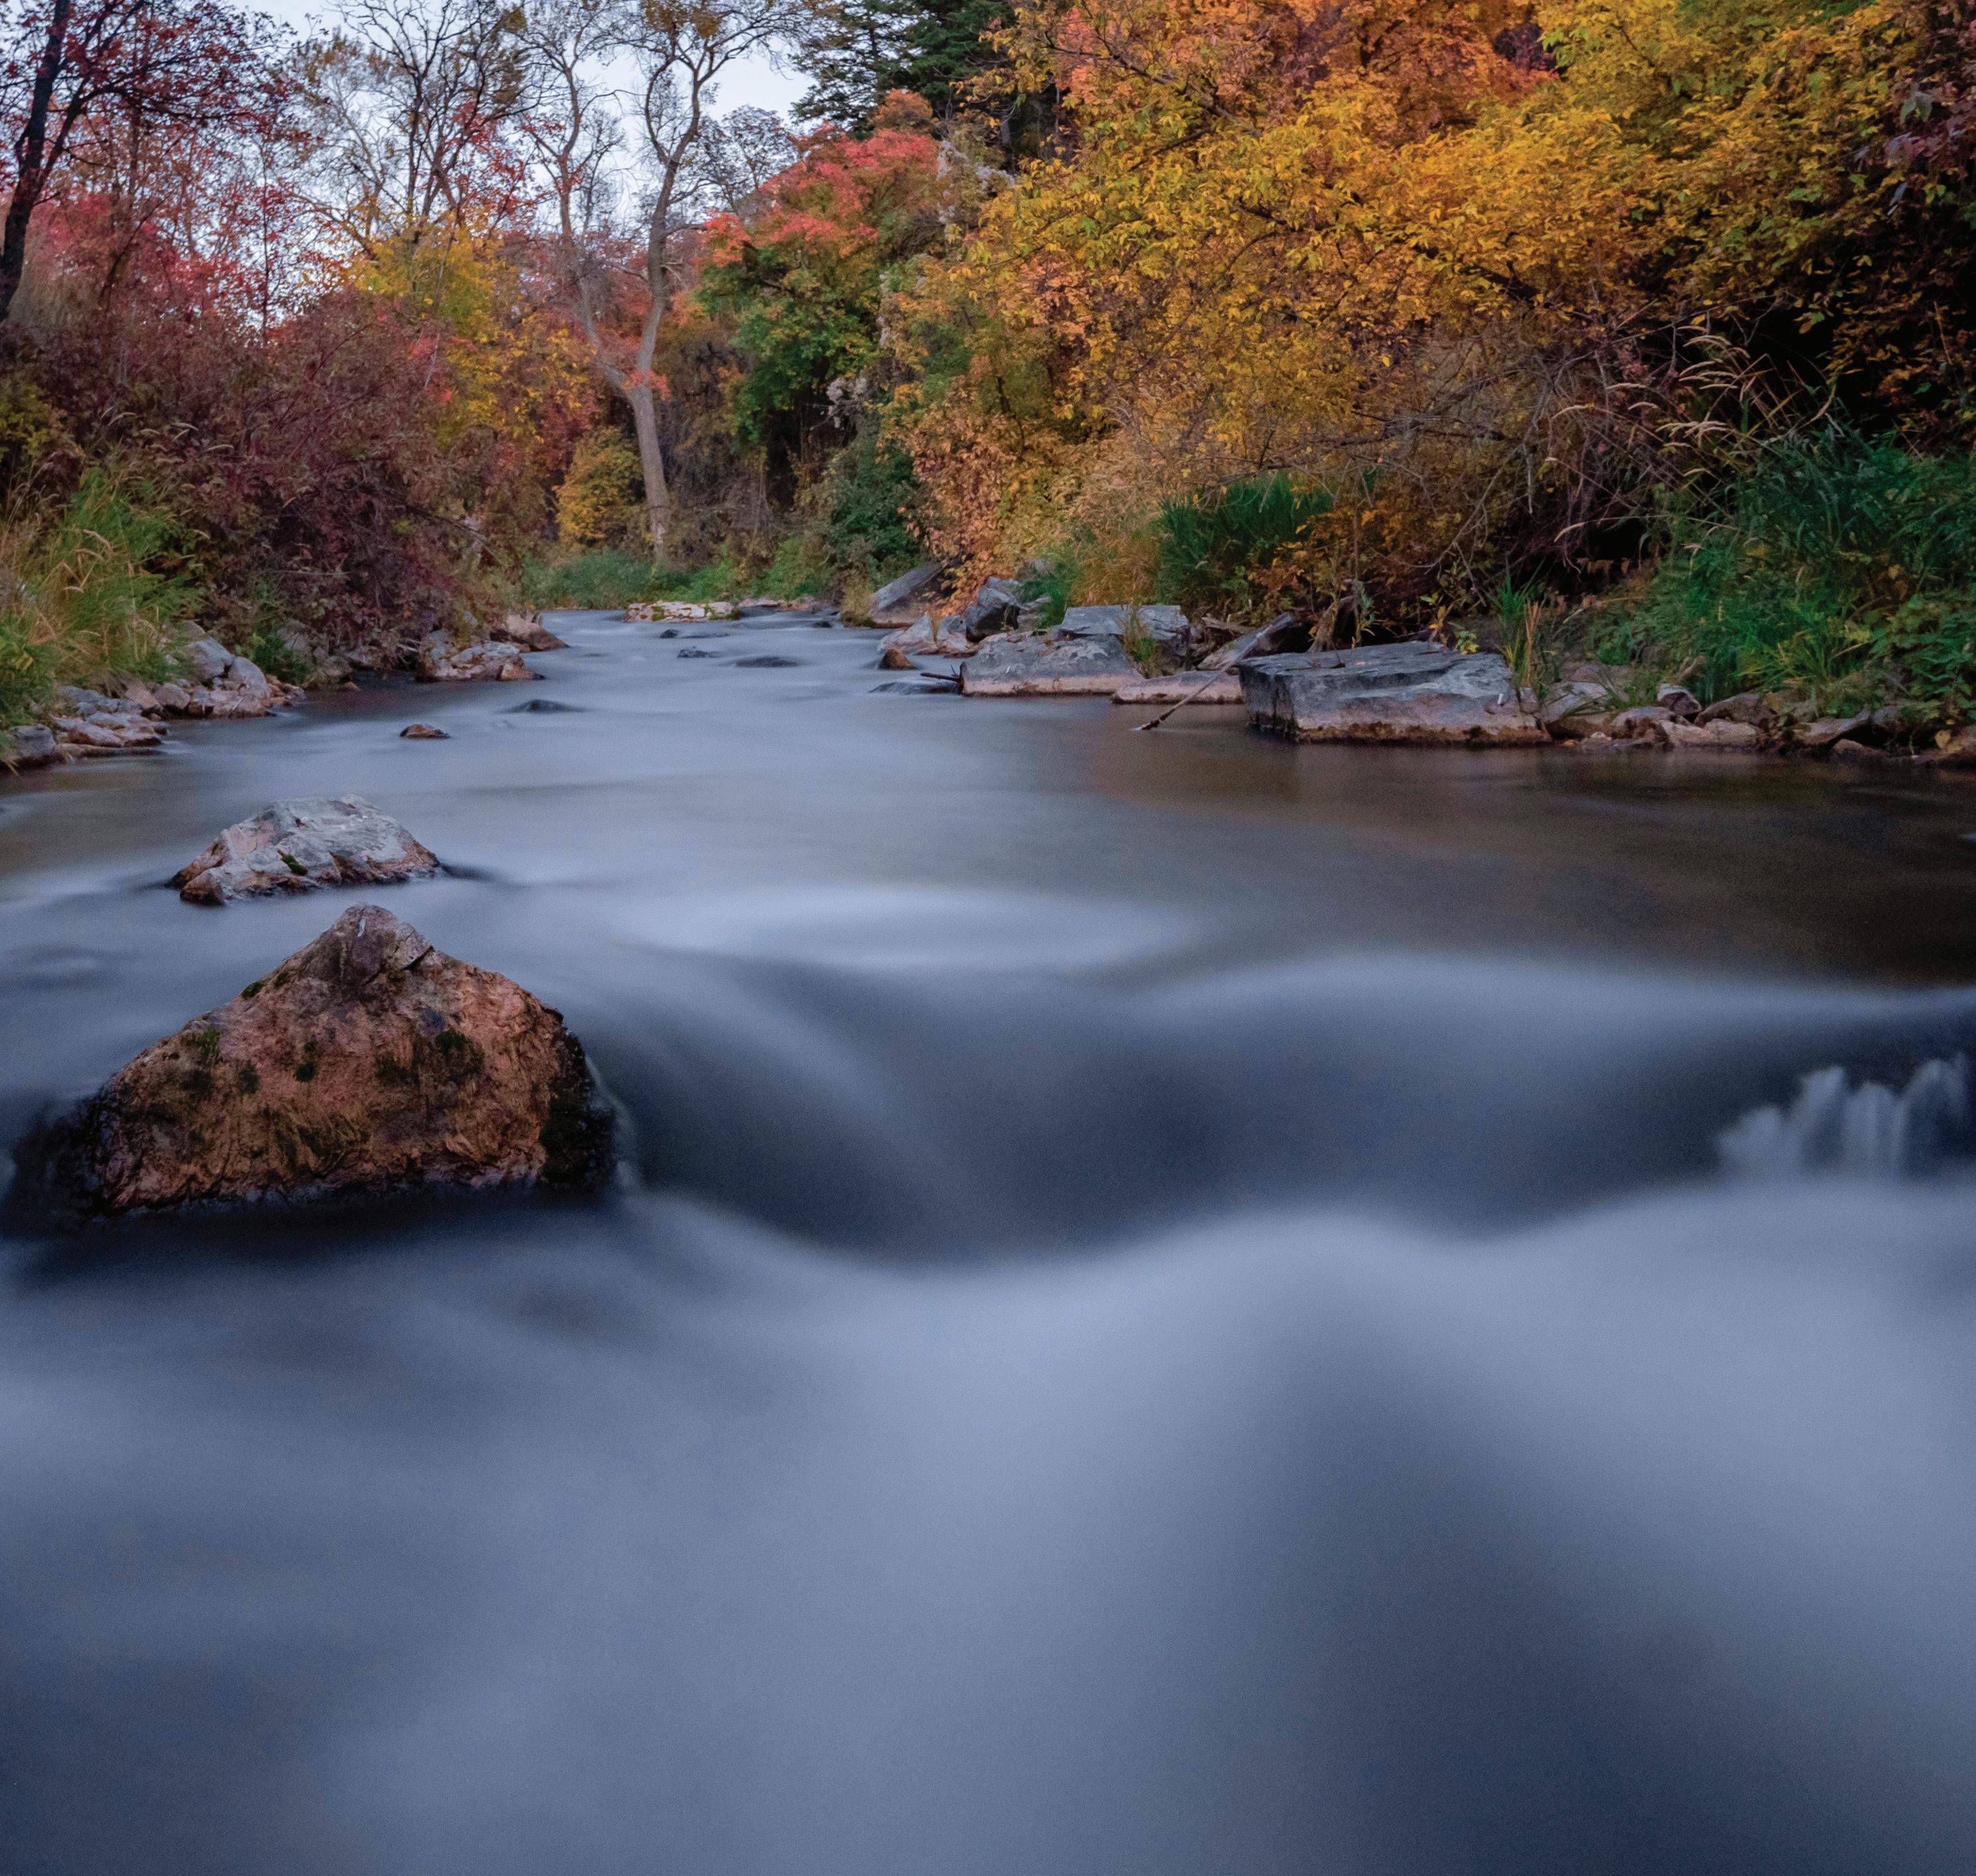
Above: Evening creek flowBlacksmith Fork Canyon, Hyrum
1D:
Reducing livestock depredation
 Julie K. Young
Ranchers can benefit from a few simple, flexible tools to reduce livestock depredation.
Livestock production is important to western communities and economies. In Utah, many livestock producers use a mixture of private and public lands for livestock grazing. That land also provides habitat and homes for wild animal carnivores, including mountain lions, black bears, bobcats, and coyotes. While these predators primarily eat native prey species (elk, deer, rabbits, and rodents), they also kill livestock. Loss of livestock to predators can determine if a livestock producer is profitable or not each year. Of the many challenges to raising livestock, some, like natural forage conditions, can’t be controlled by producers, making it even more important to take actions that increase the survival and productivity of livestock. While lethal removal of predators may stop carnivores from killing livestock, this is reactive, and often draws negative attention from the public and the media. As a result, public funding is becoming more uncertain for these purposes. The use of nonlethal tools to prevent livestock depredation by carnivores is an increasingly attractive alternative approach for individuals, nonprofit organizations, and state and federal agencies.
Research at Utah State University aims to improve livestock production even while carnivores are present on public and private lands. We have worked to identify causes of mortality in livestock, improve the efficacy of nonlethal tools, and develop new tools to prevent conflicts. We’ve shown that reducing the spacing between flags on fladry-marked fences (with a line of brightly-colored flags hung along a pasture perimeter) creates a stronger barrier that can prevent coyotes from entering pastures; flashing ear tags can limit depredation by coyotes and wolves on livestock on open range and in pastures; and certain breeds of trained livestock guard dogs can increase livestock survival and protect grain silos from bear raids. Implementing these cost-effective tools can decrease depredation and help producers sleep better at night.
Photos above and right: Herders attaching flashing ear tags to sheep before placing sheep on open-range allotment. (Julie Young)
26 UTAH STATE UNIVERSITY 2022 REPORT TO THE GOVERNOR ON UTAH’S LAND, WATER, AND AIR
TAKEAWAY
Utah’s extractive industries still have a sizable impact on the economy of the state.
Balancing Utah’s extractive industries
Brian Steed
Oil, gas, and mining in Utah produced approximately $7.8 billion in mineral products during 2021 (Figure 1E.1). The industry in the state is receiving renewed attention due to the large amount of strategically important minerals found here necessary for the production of modern digital technologies and green energy.
Utah is actively producing seven critical minerals from the U.S. Geological Survey’s list of 50, including beryllium, lithium, magnesium, platinum, palladium, fluorspar, and tellurium. With global demand for rechargeable batteries increasing, several companies in the state are seeking to expand production of some of these products, especially lithium from brines of the Great Salt Lake. Deposits of another six critical minerals are found in the state: aluminum, indium, gallium, germanium, vanadium, and zinc. Indium, used for touch screens and windshields, is found only in Utah. Other strategically important minerals in Utah include helium, potassium, rhenium, and uranium.
Due to the interest in these and other minerals, Utah experienced a significant expansion of applications for new mines in 2021. The State Institutional Trust Lands Administration, which manages more than 3.4 million acres of state-owned land, issued 68 new mineral leases in 2021, compared to 38 in 2020. Mining claims also increased significantly on federal lands with 5,100 new mining claims filed in 2021, a 41-percent increase over the previous year.
MINERAL 2021 AMOUNT 2020 AMOUNT 20-21 CHANGE RECENT HIGHS Crude Oil 35.3 M barrels 31 M barrels ↑ 2014: 41 M barrels Natural Gas 239.9 M cubic feet 242.5 M cubic feet ↓ 2012: 490.5 M cubic feet Coal 12.5 M short tons 13.3 M short tons ↓ 2011: 20 M short tons Copper 180 K short tons 150 K short tons ↑ 2001: 350 K short tons Molybdenum 8.4 K short tons 22 K short tons ↓ 2020: 22 K short tons Gold 190 K ounces 180 K ounces ↑ 2011: 720 K ounces Silver 2.2 M ounces 2.2 M ounces - 2009: 4.9 M ounces 1E: Table 1E.1 Examples of mineral production in Utah in 2021 TAKEAWAY 28 UTAH STATE UNIVERSITY 2022 REPORT TO THE GOVERNOR ON UTAH’S LAND, WATER, AND AIR
1E.1
(2021)
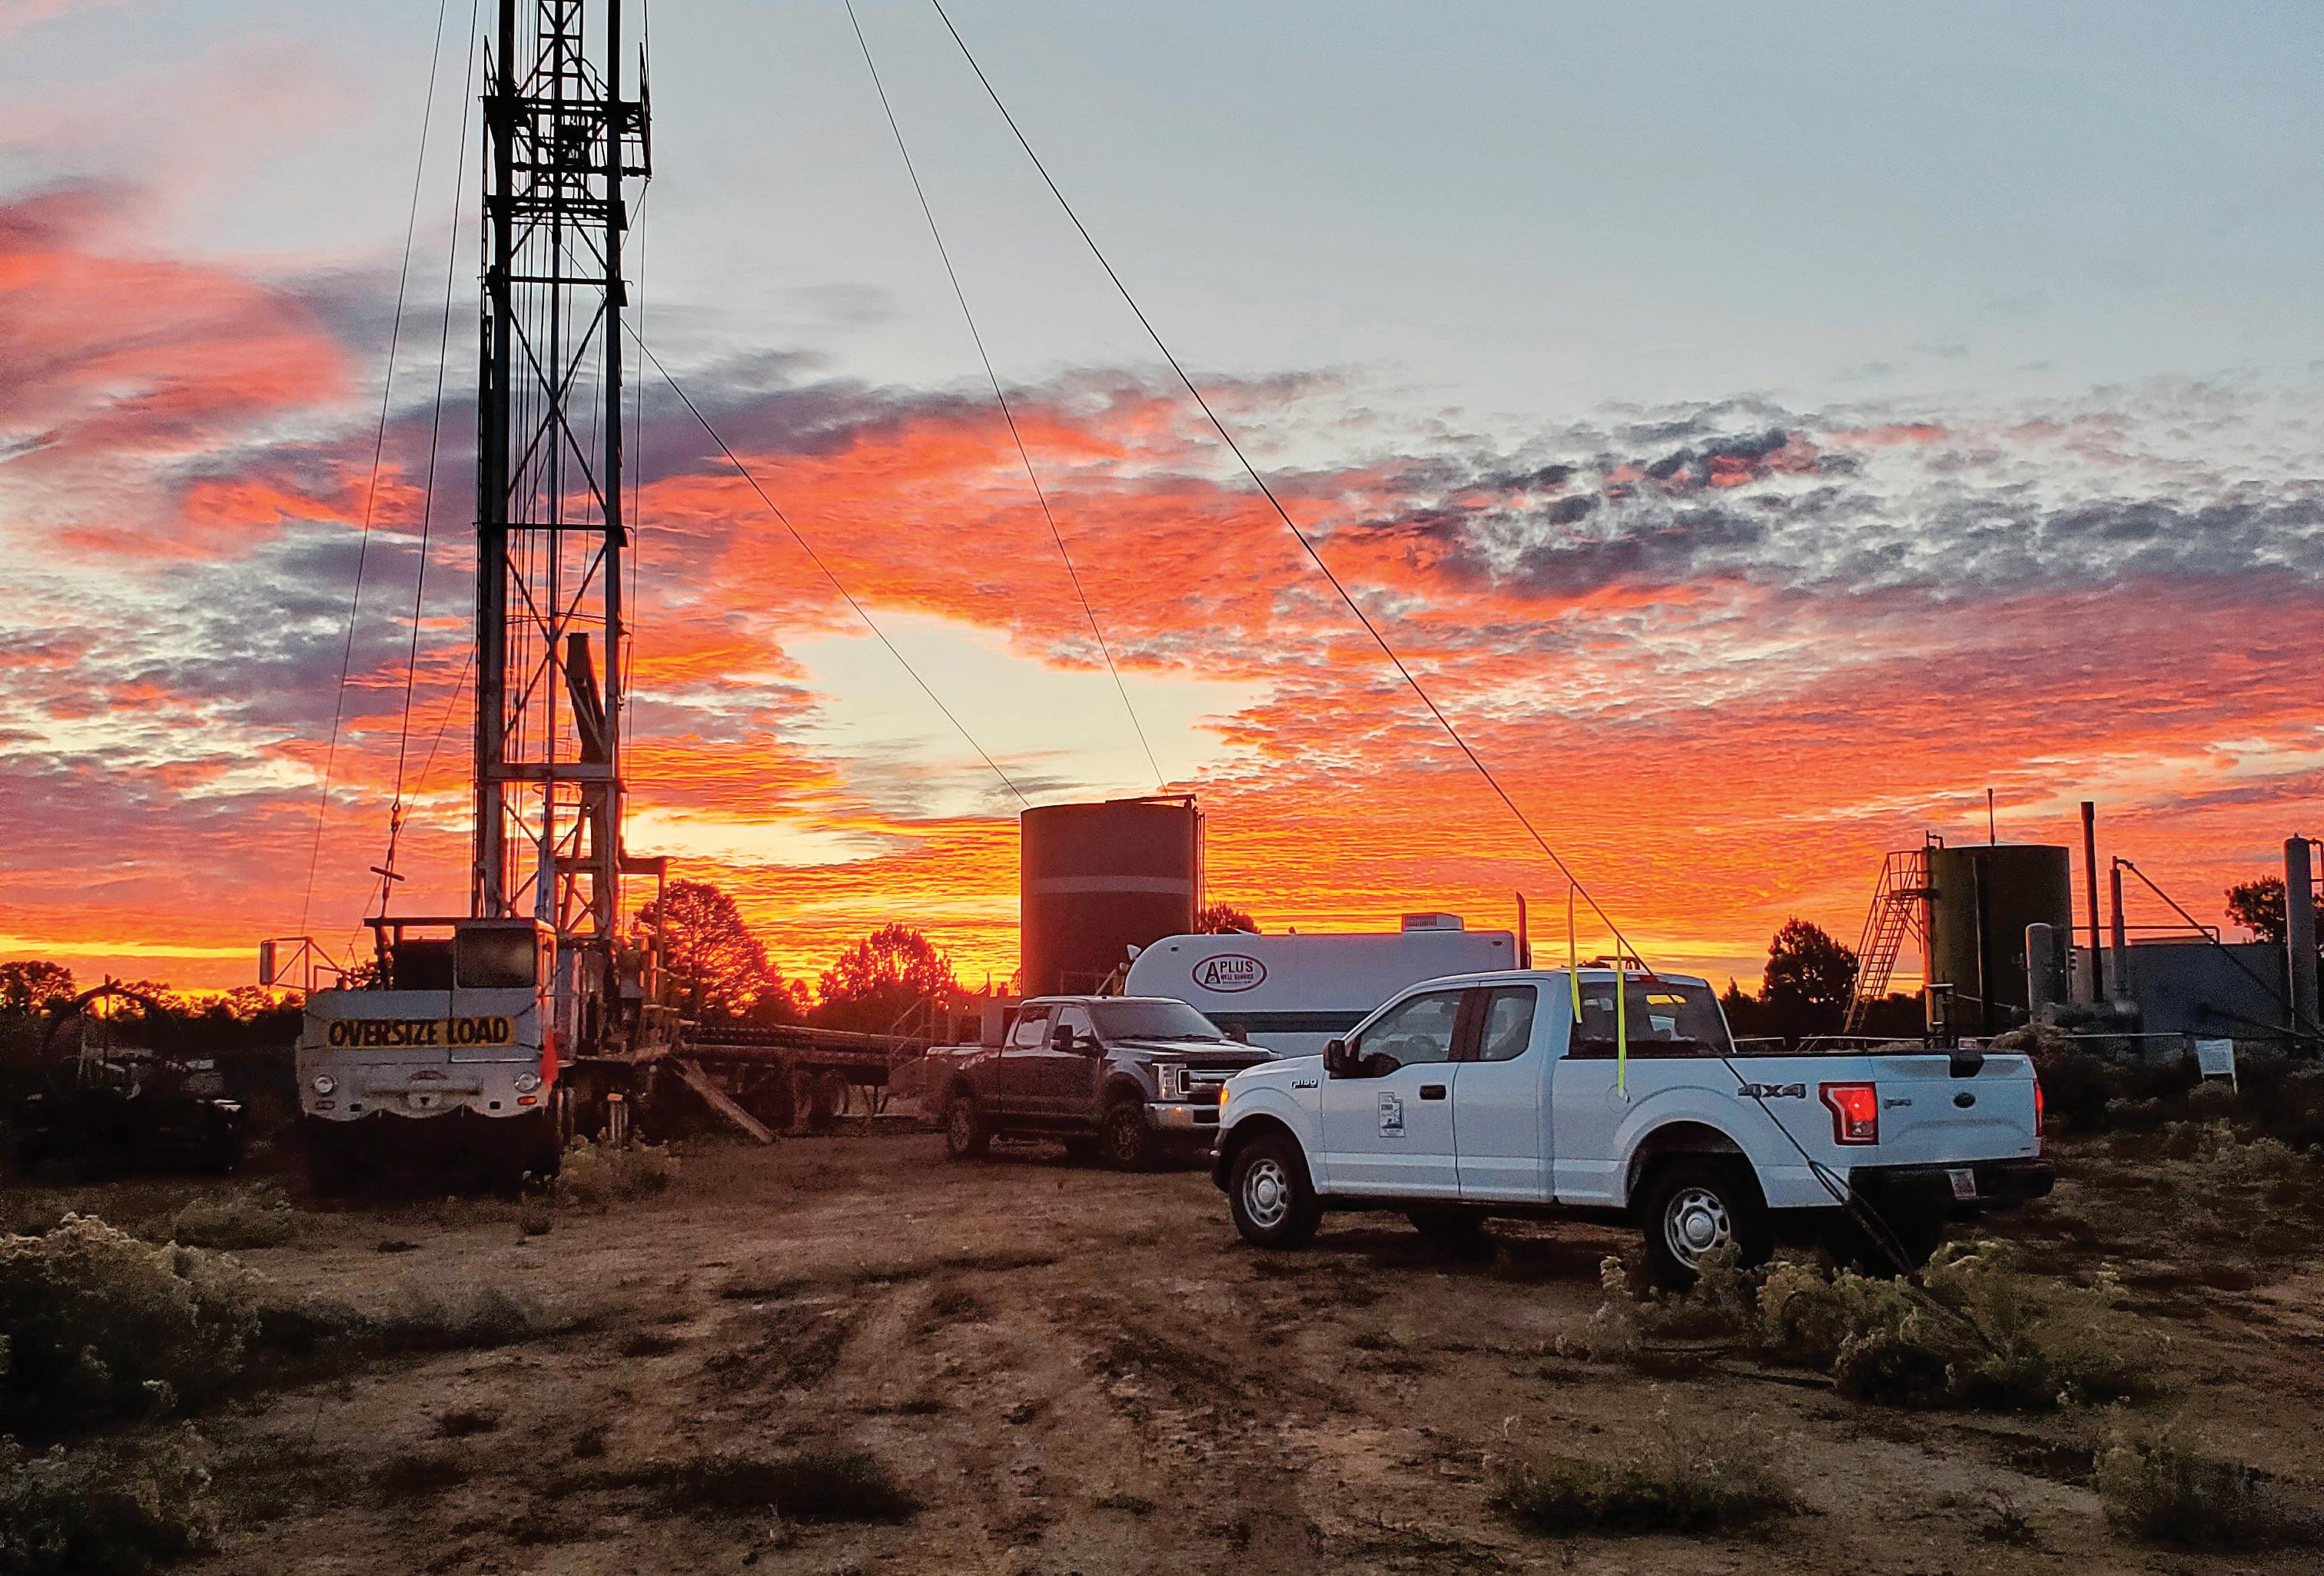 Above: Uinta Basin drilling station (Utah Division of Oil, Gas, and Mining)
$4.1 B $2.2 B $1.1 B $.4 B Metals/industrial minerals Crude oil Natural gas Coal
Figure
Economic value of minerals production
With local input, a comprehensive database of Utah’s outdoor recreation assets is now being compiled to help develop a statewide recreation strategic plan.
Planning for two million more people on Utah’s trails
Jordan Smith
Utah is home to some of the most spectacular outdoor recreation destinations in the world. While outdoor recreation assets improve residents’ quality of life and bolster the state’s tourism economy, they are also at risk of being degraded as the number of people hiking, biking, and camping continues to boom. In 2021, the state’s park system reported over 11.6 million visits, and national parks in Utah reported another 11.3 million (Figure 1F.1). The number of people setting out on adventures into Utah’s backcountry will almost certainly rise in the years to come, as the state’s population swells from 3.5 million in 2022 to a projected 5.5 million in 2060.

Realizing a need to chart a strategic and unified path forward, the state legislature created the Utah Outdoor Adventure Commission in 2020 and tasked it with developing an authoritative, comprehensive, and upto-date database of outdoor recreation assets within Utah. The commission was asked to use the database for development of a statewide outdoor recreation strategic plan. The Institute of Outdoor Recreation and Tourism at Utah State University has partnered on the project, leading both the development of the outdoor recreation asset database and the strategic planning effort.
The institute has held regional workshops, inviting a wide range of recreation leaders—state and federal land managers, elected officials, private industry representatives, and the public—with a goal to better understand the shared challenges, opportunities, and needs being experienced around the state. This input will ensure the statewide strategic plan is responsive to the needs of local stakeholders. A diverse portfolio of outdoor experiences, fueled by state investments in outdoor recreation, will help ensure Utahns continue to live active and adventurous lifestyles for decades to come.
30 UTAH STATE UNIVERSITY 2022 REPORT TO THE GOVERNOR ON UTAH’S LAND, WATER, AND AIR
1F: TAKEAWAY
In 2021, the state’s park system reported over 11.6 million visits, and national parks in Utah had another 11.3 million.
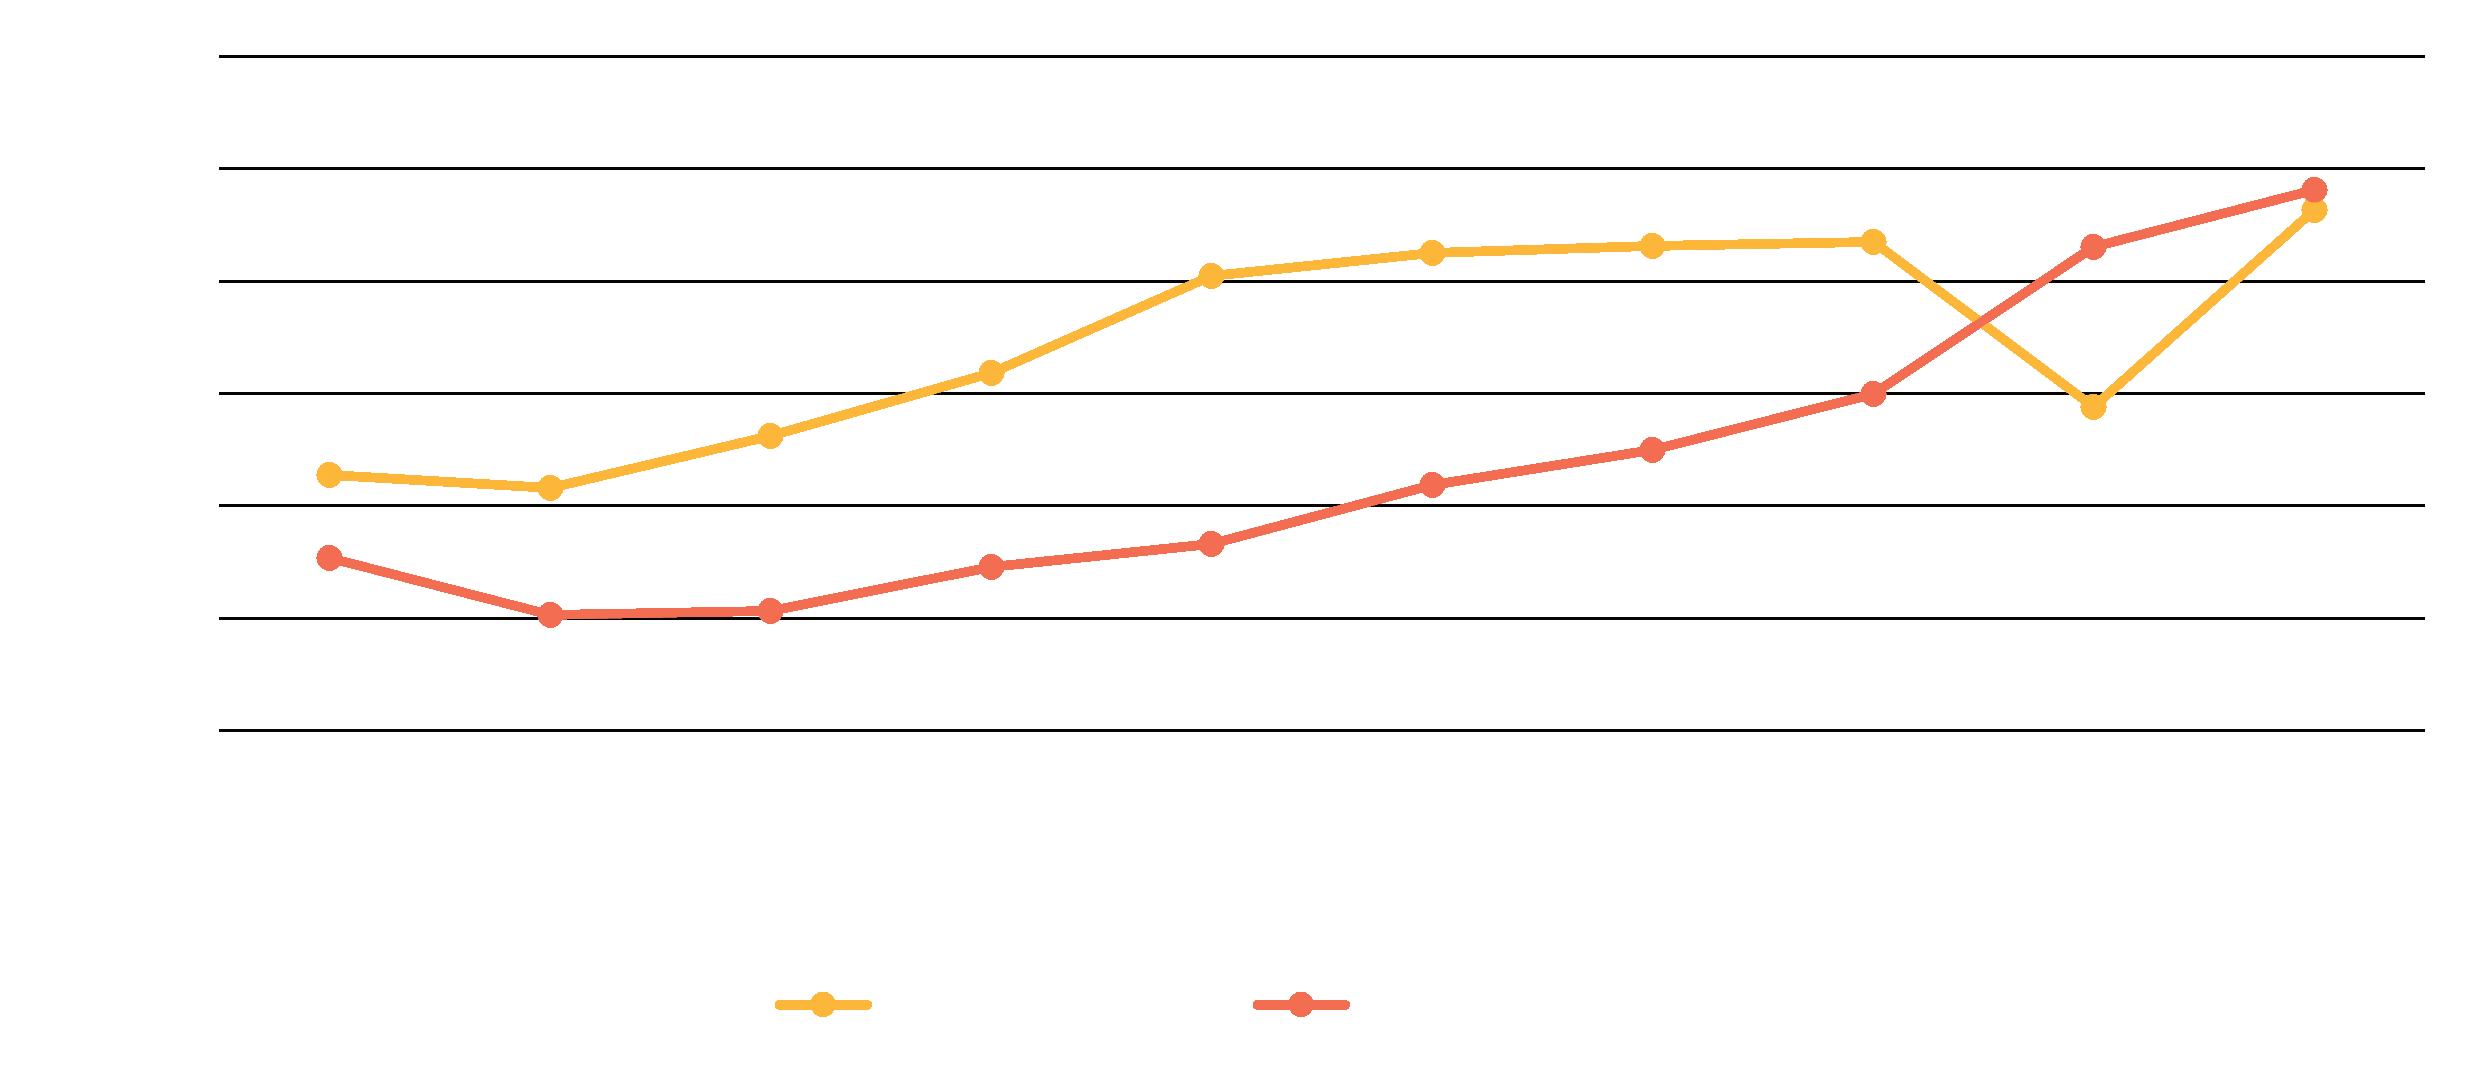
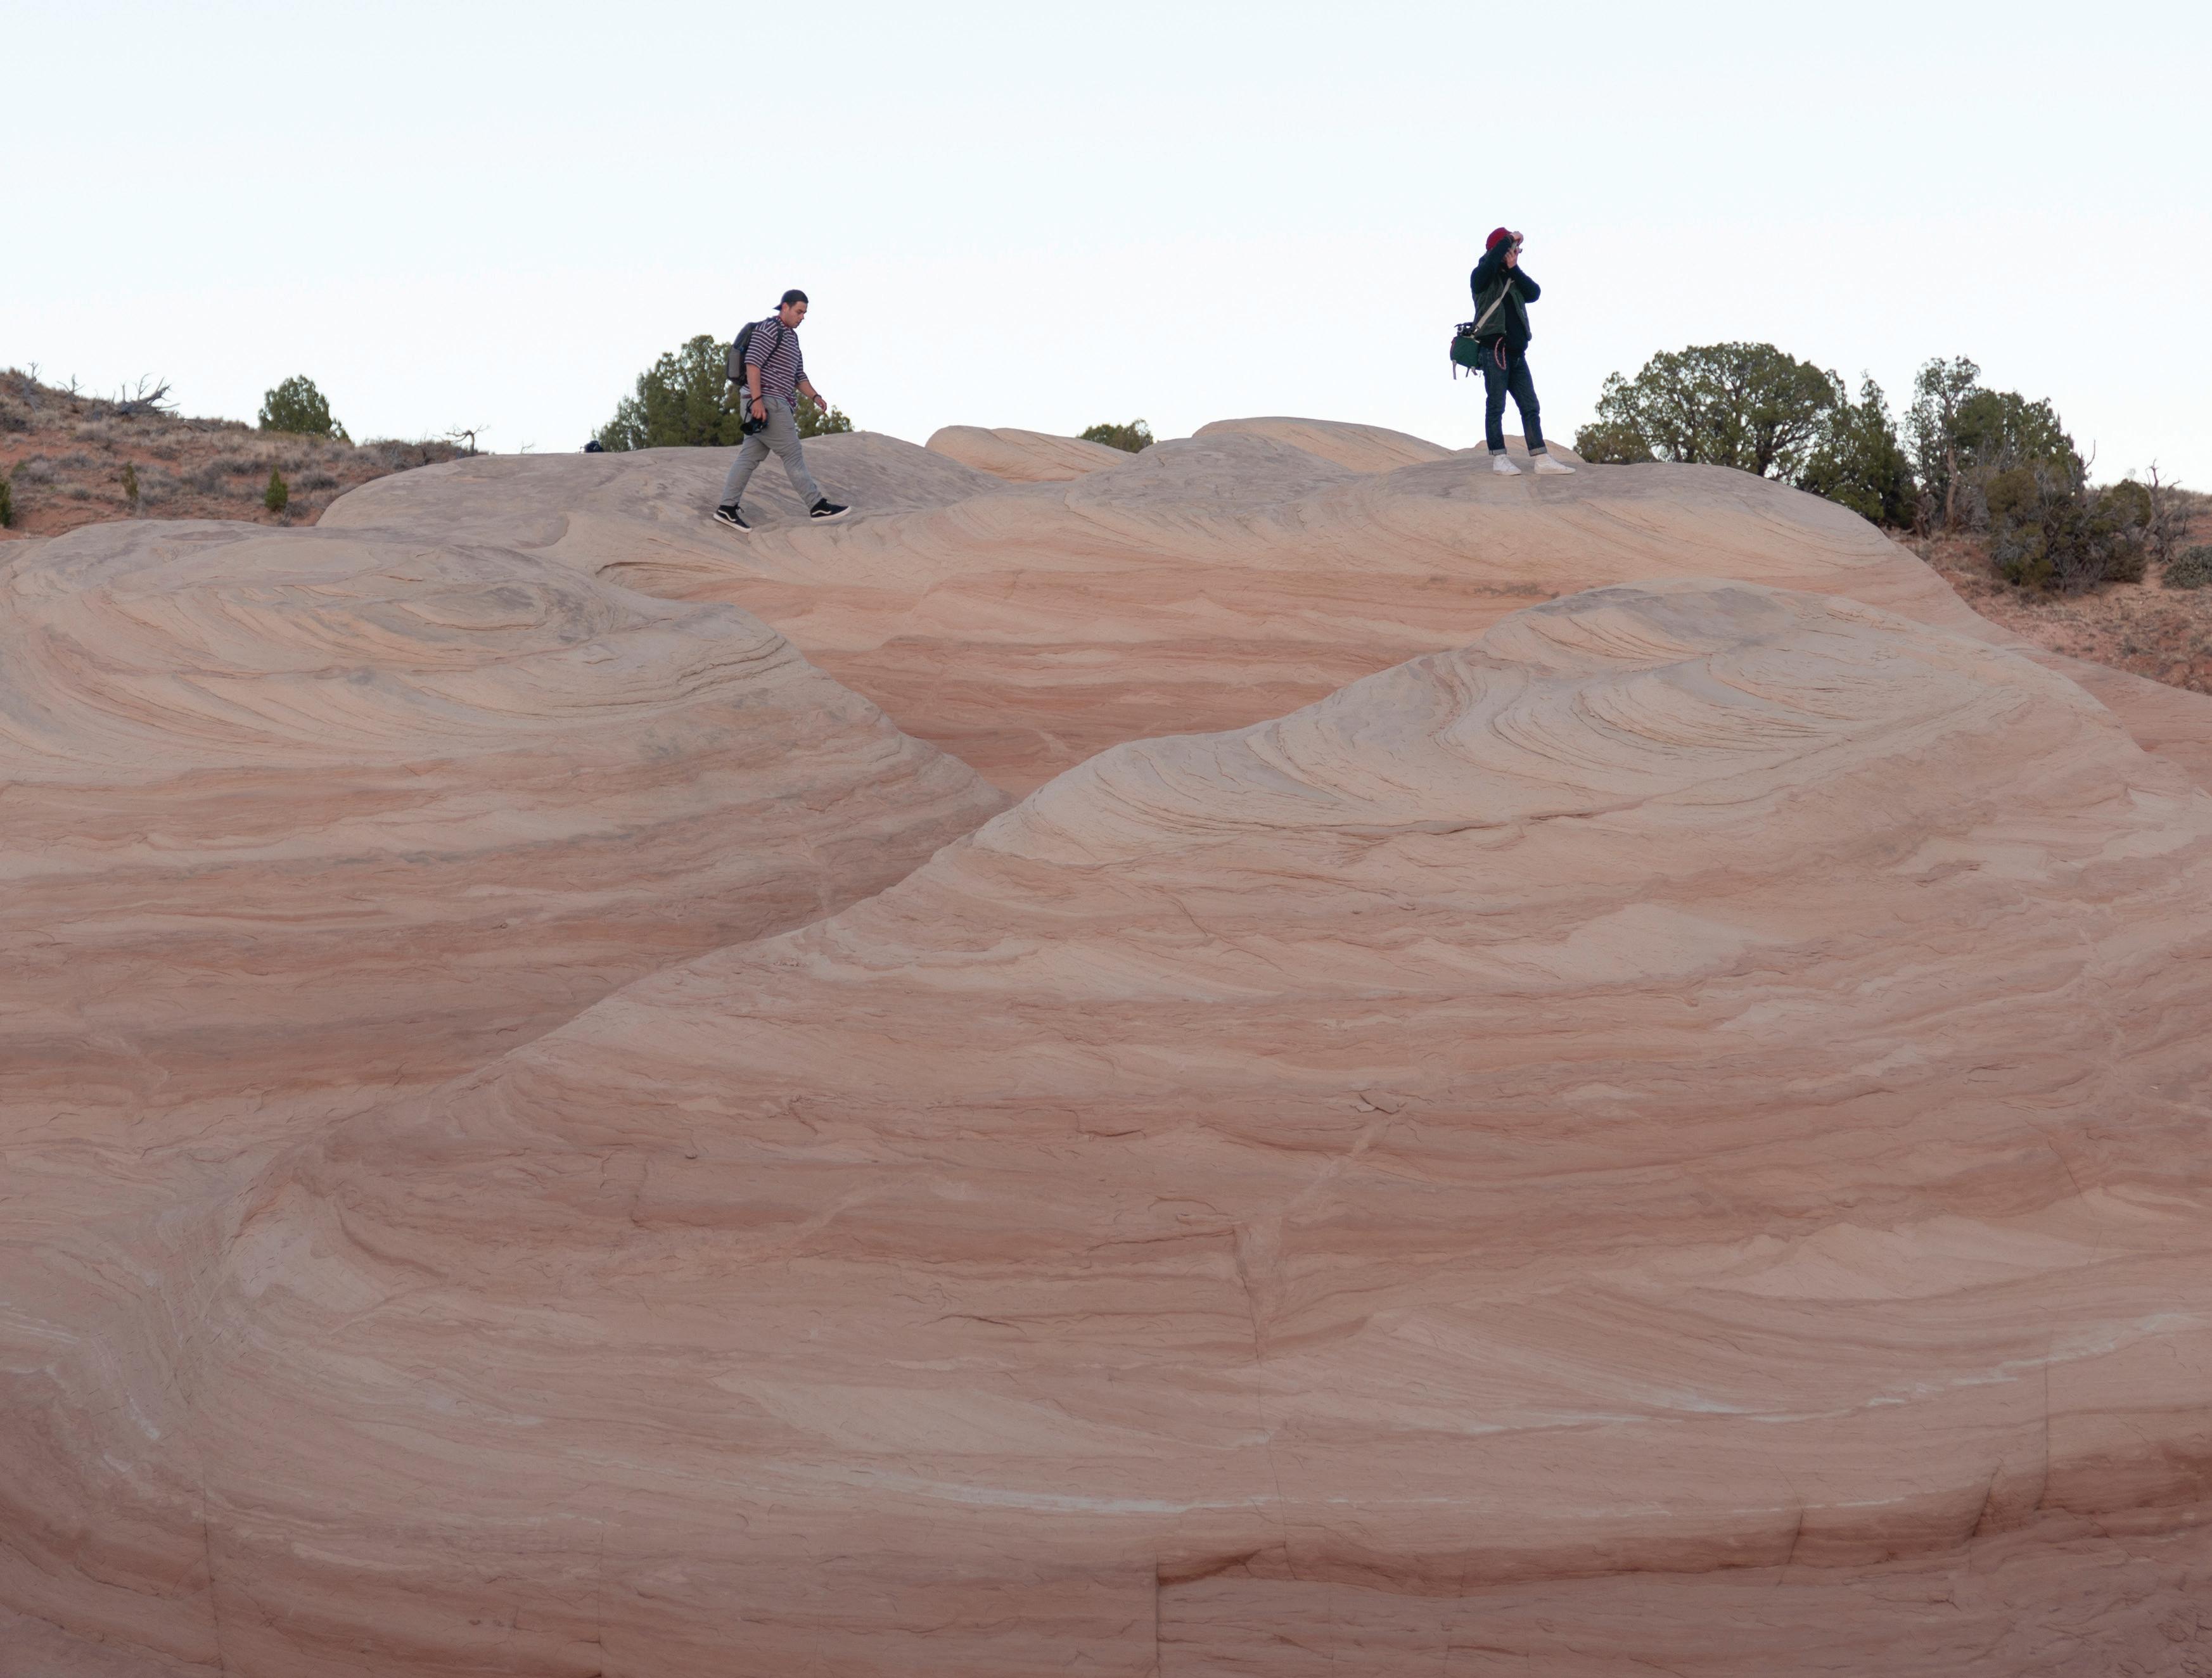 Figure 1F.1 Visitation to national and state parks in Utah (2012-2021)
Above: Exploring Devil’s Garden - Escalante
Figure 1F.1 Visitation to national and state parks in Utah (2012-2021)
Above: Exploring Devil’s Garden - Escalante
Chapter 1 References
1 Williams, A. P., Cook, B. I., and Smerdon, J. E. (2022). Rapid intensification of the emerging southwestern North American megadrought in 2020-2021. Nature Climate Change, 12, 232-234.
2. Utah Division of Oil, Gas, and Mining. (2022). Oil Production Per Year https://oilgas.utah. gov/oilProdVolPerYear.php
3. Utah Division of Oil, Gas, and Mining. (2022). Oil Production Per Year https://oilgas.utah. gov/oilProdVolPerYear.php
4. Mills, S. E., Rupke, A., Vanden Berg, M., and Boden, T. (2022). Utah Mining 2021. Circular 134, Utah Geologic Survey, Utah Department of Natural Resources. https://ugspub. nr.utah.gov/publications/ circular/c-134.pdf
32
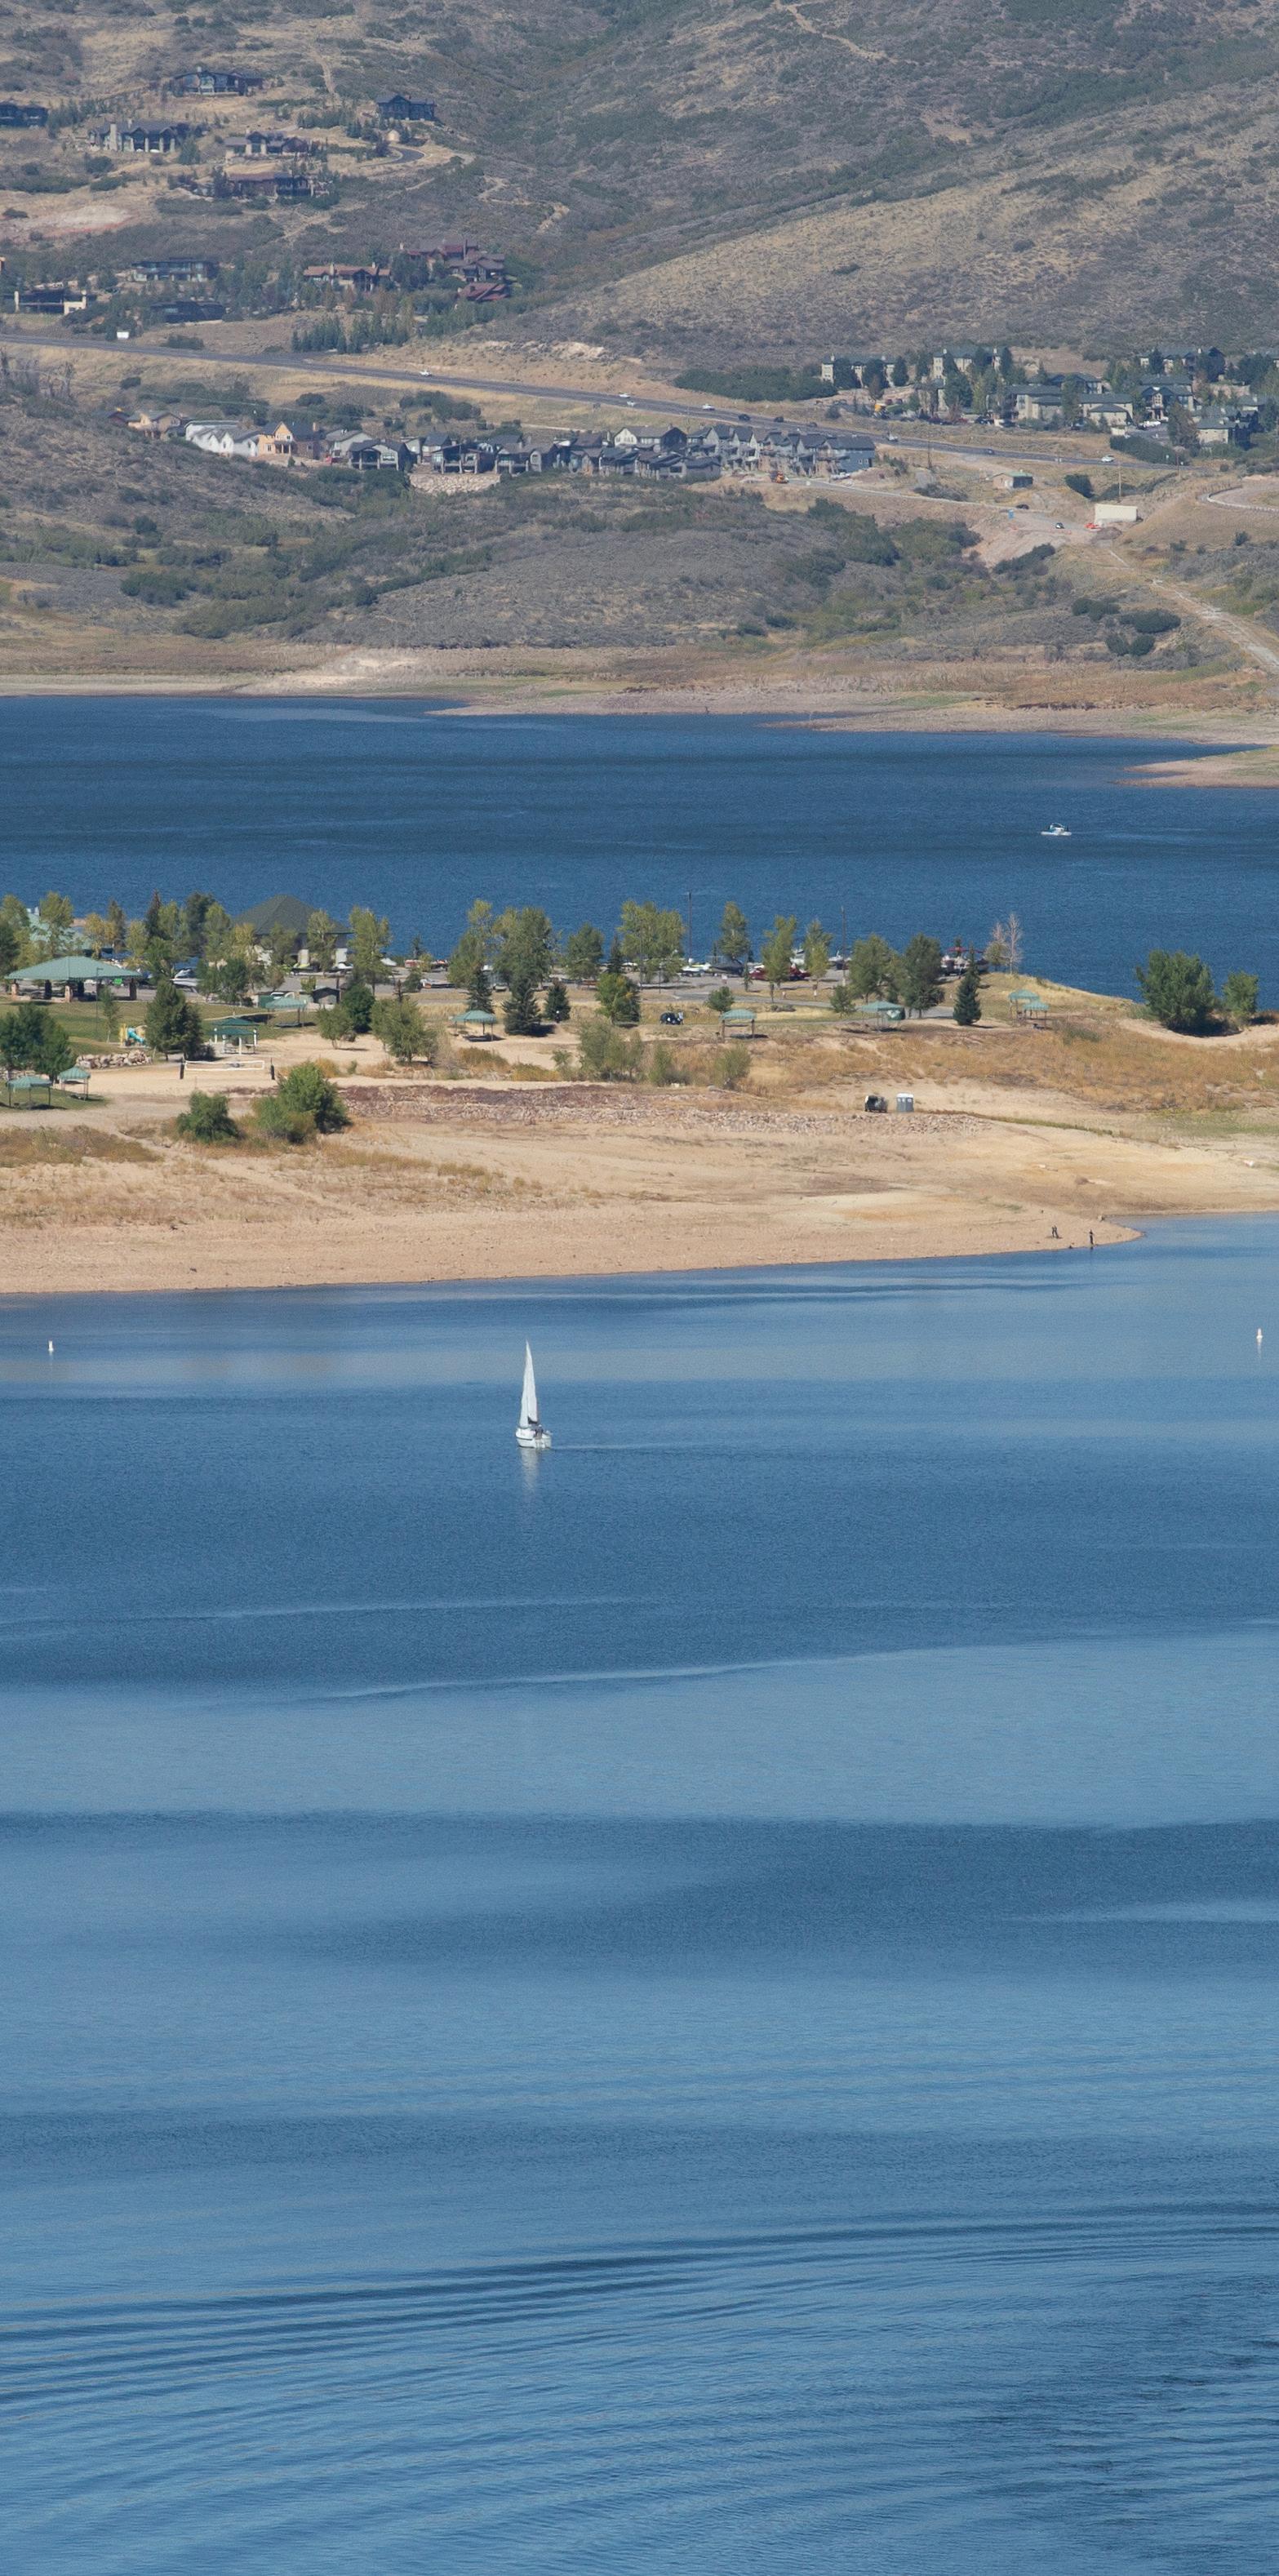
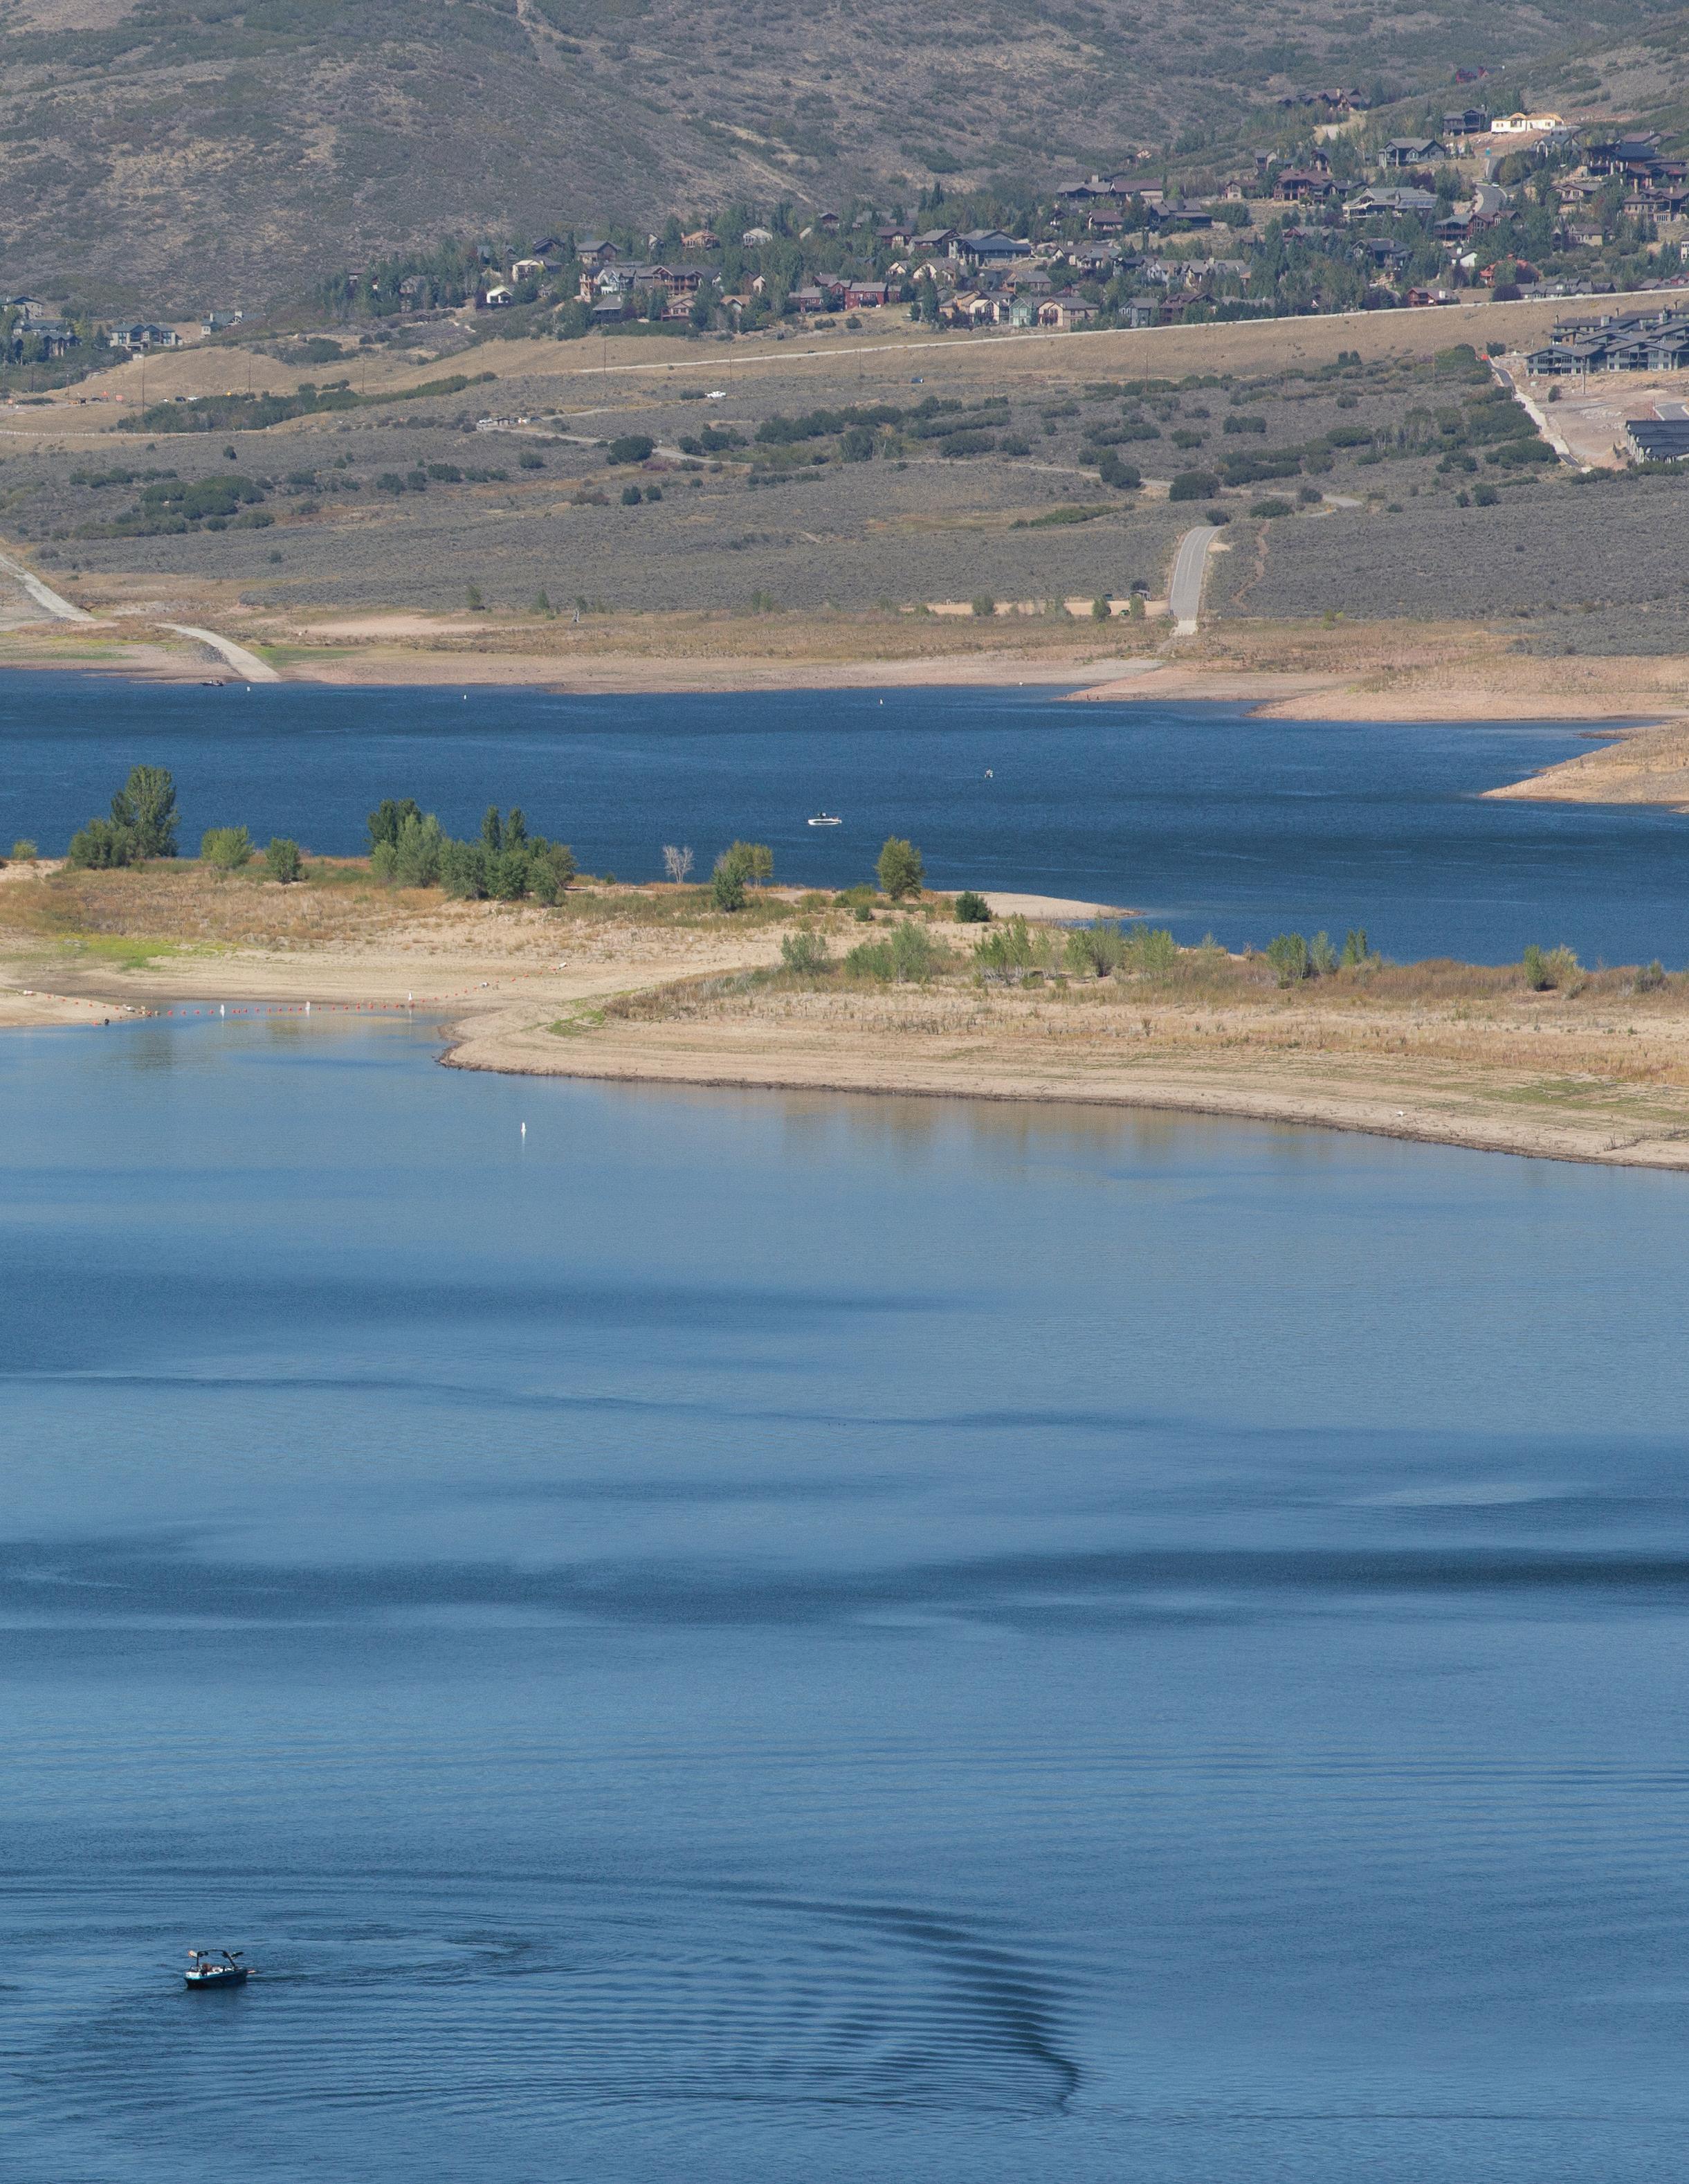
Above: Jordanelle State Park
Chapter Two WATER
2A Long-term trends of Utah’s climate — 34
2B Recent trends in use of the Colorado River in Utah — 36
2C Urban water conservation: Helping Utah communities integrate land and water use — 38
2D Nudging wetlands toward recovery after invasion and impacts — 40
2E Utah’s water quality epidemic: Harmful algal blooms — 42
Long-term trends of Utah’s climate 2A:
Robert Gillies, Jon Meyer, Yoshimitsu Chikamoto, and Timothy Wright
Since 1950, Utah has experienced declining trends in precipitation, increased temperature, and a shift in precipitation from snow to rain.
Analysis of historical Utah climate data shows that since 1950, nine months of the year have had declines in total precipitation, with the greatest drying in the crucial months from March through August1. Over that same period, temperatures have warmed in all months but October.
Most of Utah’s water supply is delivered as snow that accumulates during the winter and early spring. January through March historically are the most productive snow accumulation months, and since 1950, this period has seen a slight dip in total precipitation (Figure 2A.1). There is also a trending decline in low-pressure troughs passing over the state and bringing precipitation, increasing deficits of soil moisture. In addition, as temperatures have warmed (Figure 2A.2), the typical snow accumulation months from November to May are receiving more frequent rainfall (Figure 2A.3).
Implications of increasingly rain-driven winters are primarily negative because snowpack that holds water is diminished. More rain stresses Utah’s warm-season water supplies used for agriculture, recreation, municipal water, and industry. These wintertime trends have accelerated in recent decades in Utah’s low and mid-elevations, further stressing the state’s water supply.
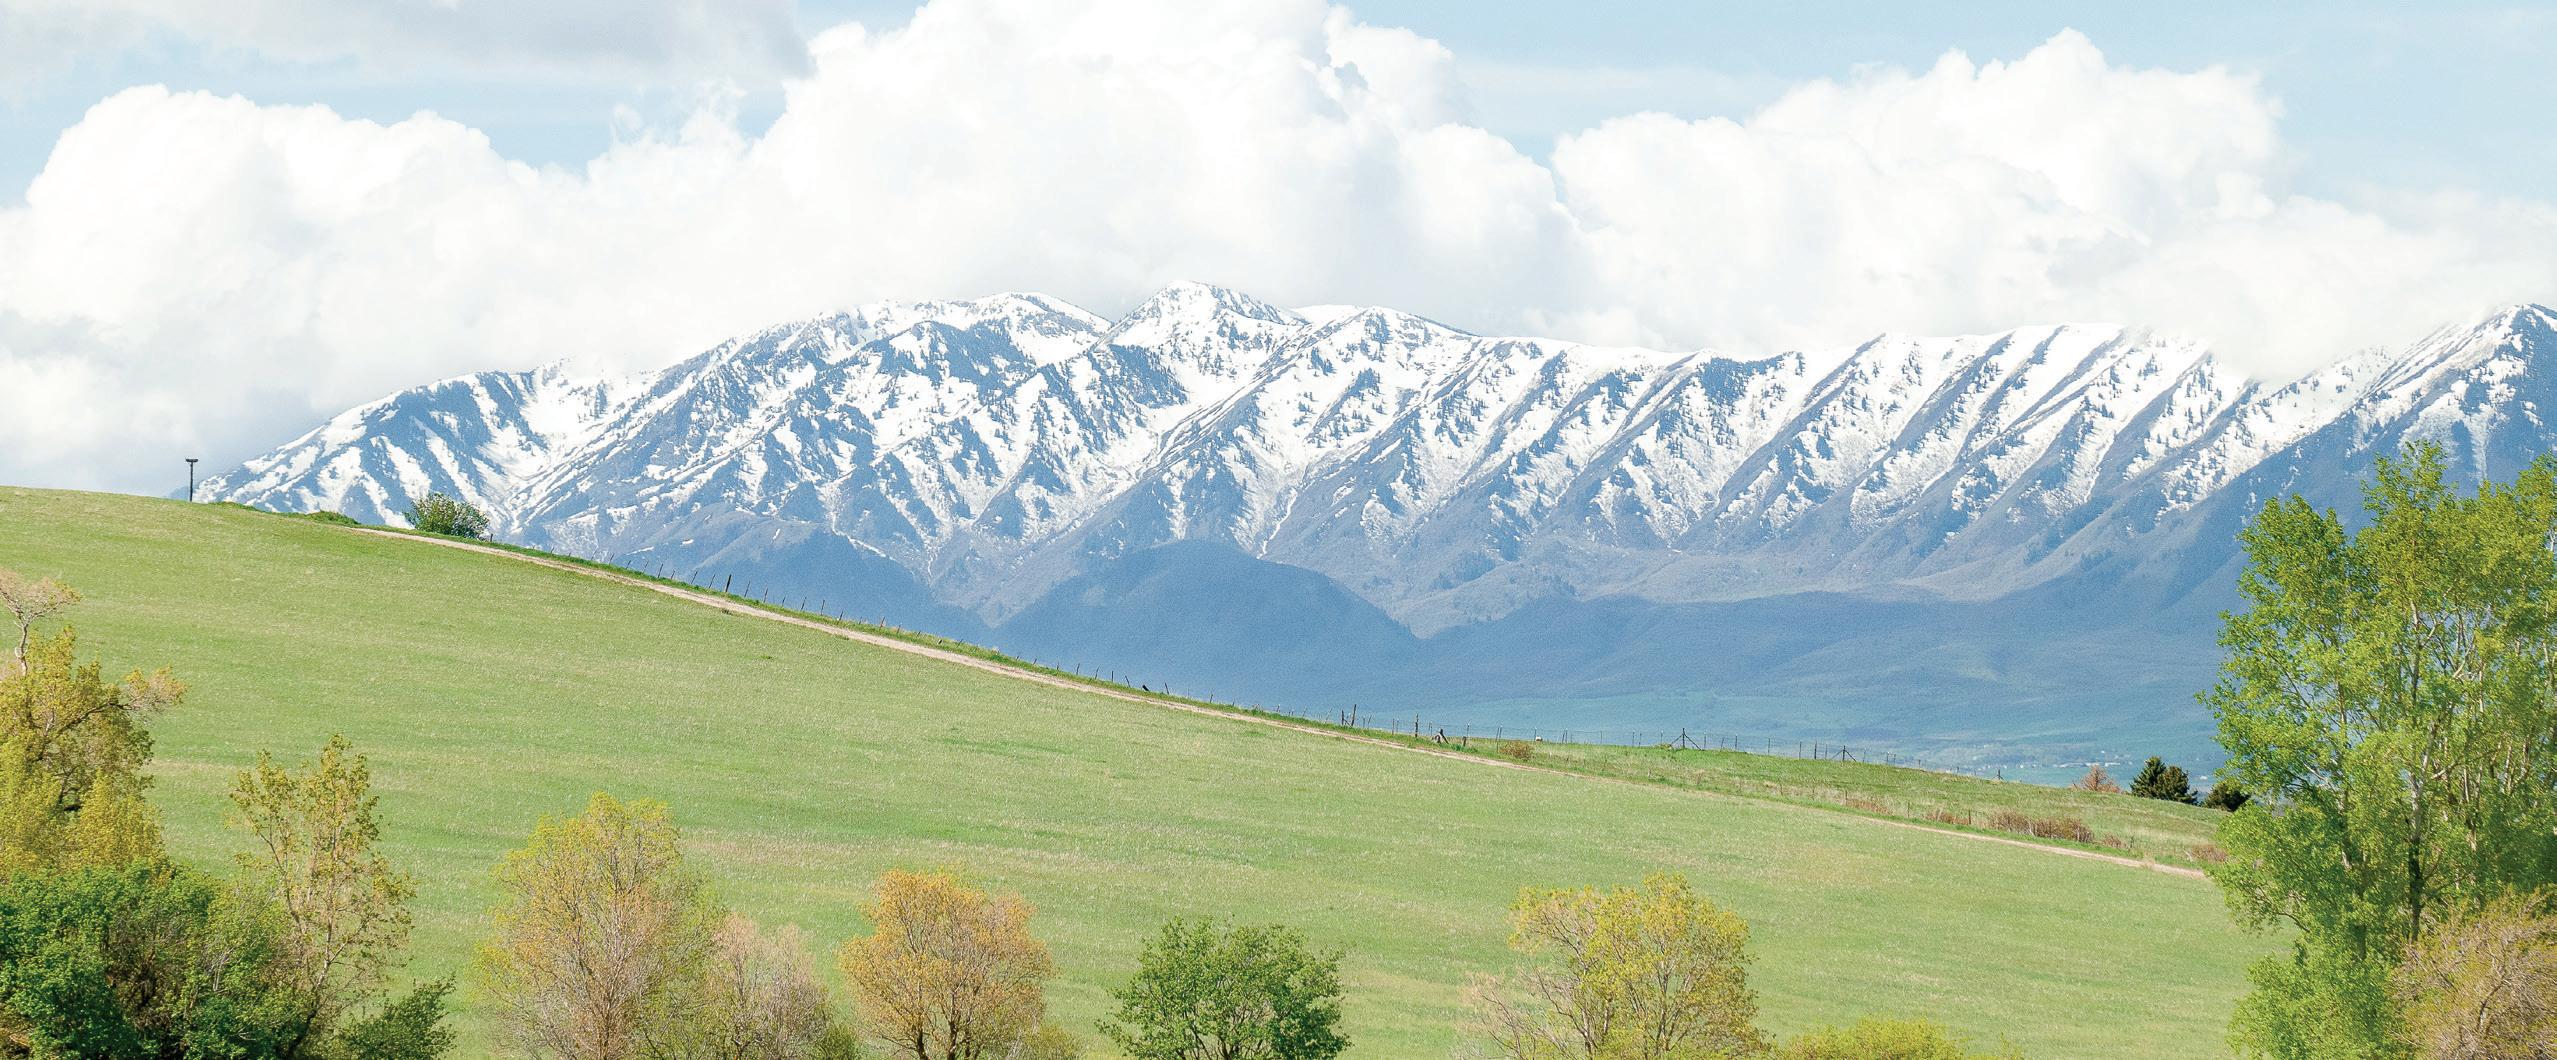 Below: View of Wellsville Mountain Range in Cache Valley.
UTAH STATE UNIVERSITY 2022 REPORT TO THE GOVERNOR ON UTAH’S LAND, WATER, AND AIR 34
TAKEAWAY
Increasingly
Figure 2A.1 January-March precipitation (1950-2021)
Trend: -0.17 in (50 yr)-1
Figure 2A.2 January-March average temperature (1950-2021)
Trend: +2.04 ºC (50 yr)-1 Trend: -6.9% (50 yr)-1
Figure 2A.3 January-March snow/rain ratio (1950-2021)
35 CHAPTER TWO: WATER
rain-driven winters will diminish Utah’s water-holding snowpack. 0.0 1.0 2.0 3.0 1950 1960 1970 1980 1990 2000 2010 2020 mm per day -8 -4 0 4 1950 1960 1970 1980 1990 2000 2010 2020 Mean ( º C) 0 40 80 1950 1960 1970 1980 1990 2000 2010 2020 Ratio %
2B:
Recent trends in use of the Colorado River in Utah
John C. Schmidt
TAKEAWAY
Low water levels in reservoirs are due to declining natural runoff, slowly increasing consumptive uses in the Upper Basin, and releases to the Lower Basin.
The Colorado River, a vital water supply for 40 million people, is in peril. In fall 2022, Lake Powell and Lake Mead each dropped to less than 30 percent full and came dangerously close to reaching levels at which electricity could no longer be generated through the dams. If continuing at current rates, warming and low water levels from Lake Powell may shift the entire ecosystem in the Grand Canyon.
Low water levels are due to three factors: declining natural runoff, slowly increasing consumptive uses in the Upper Basin, and releases to the Lower Basin. Collectively, human use, evaporative loss, and downstream releases exceed reservoir inflows. We are using more water than is naturally available.
Right: Peering down the ColoradoBig Bend Campground, Moab
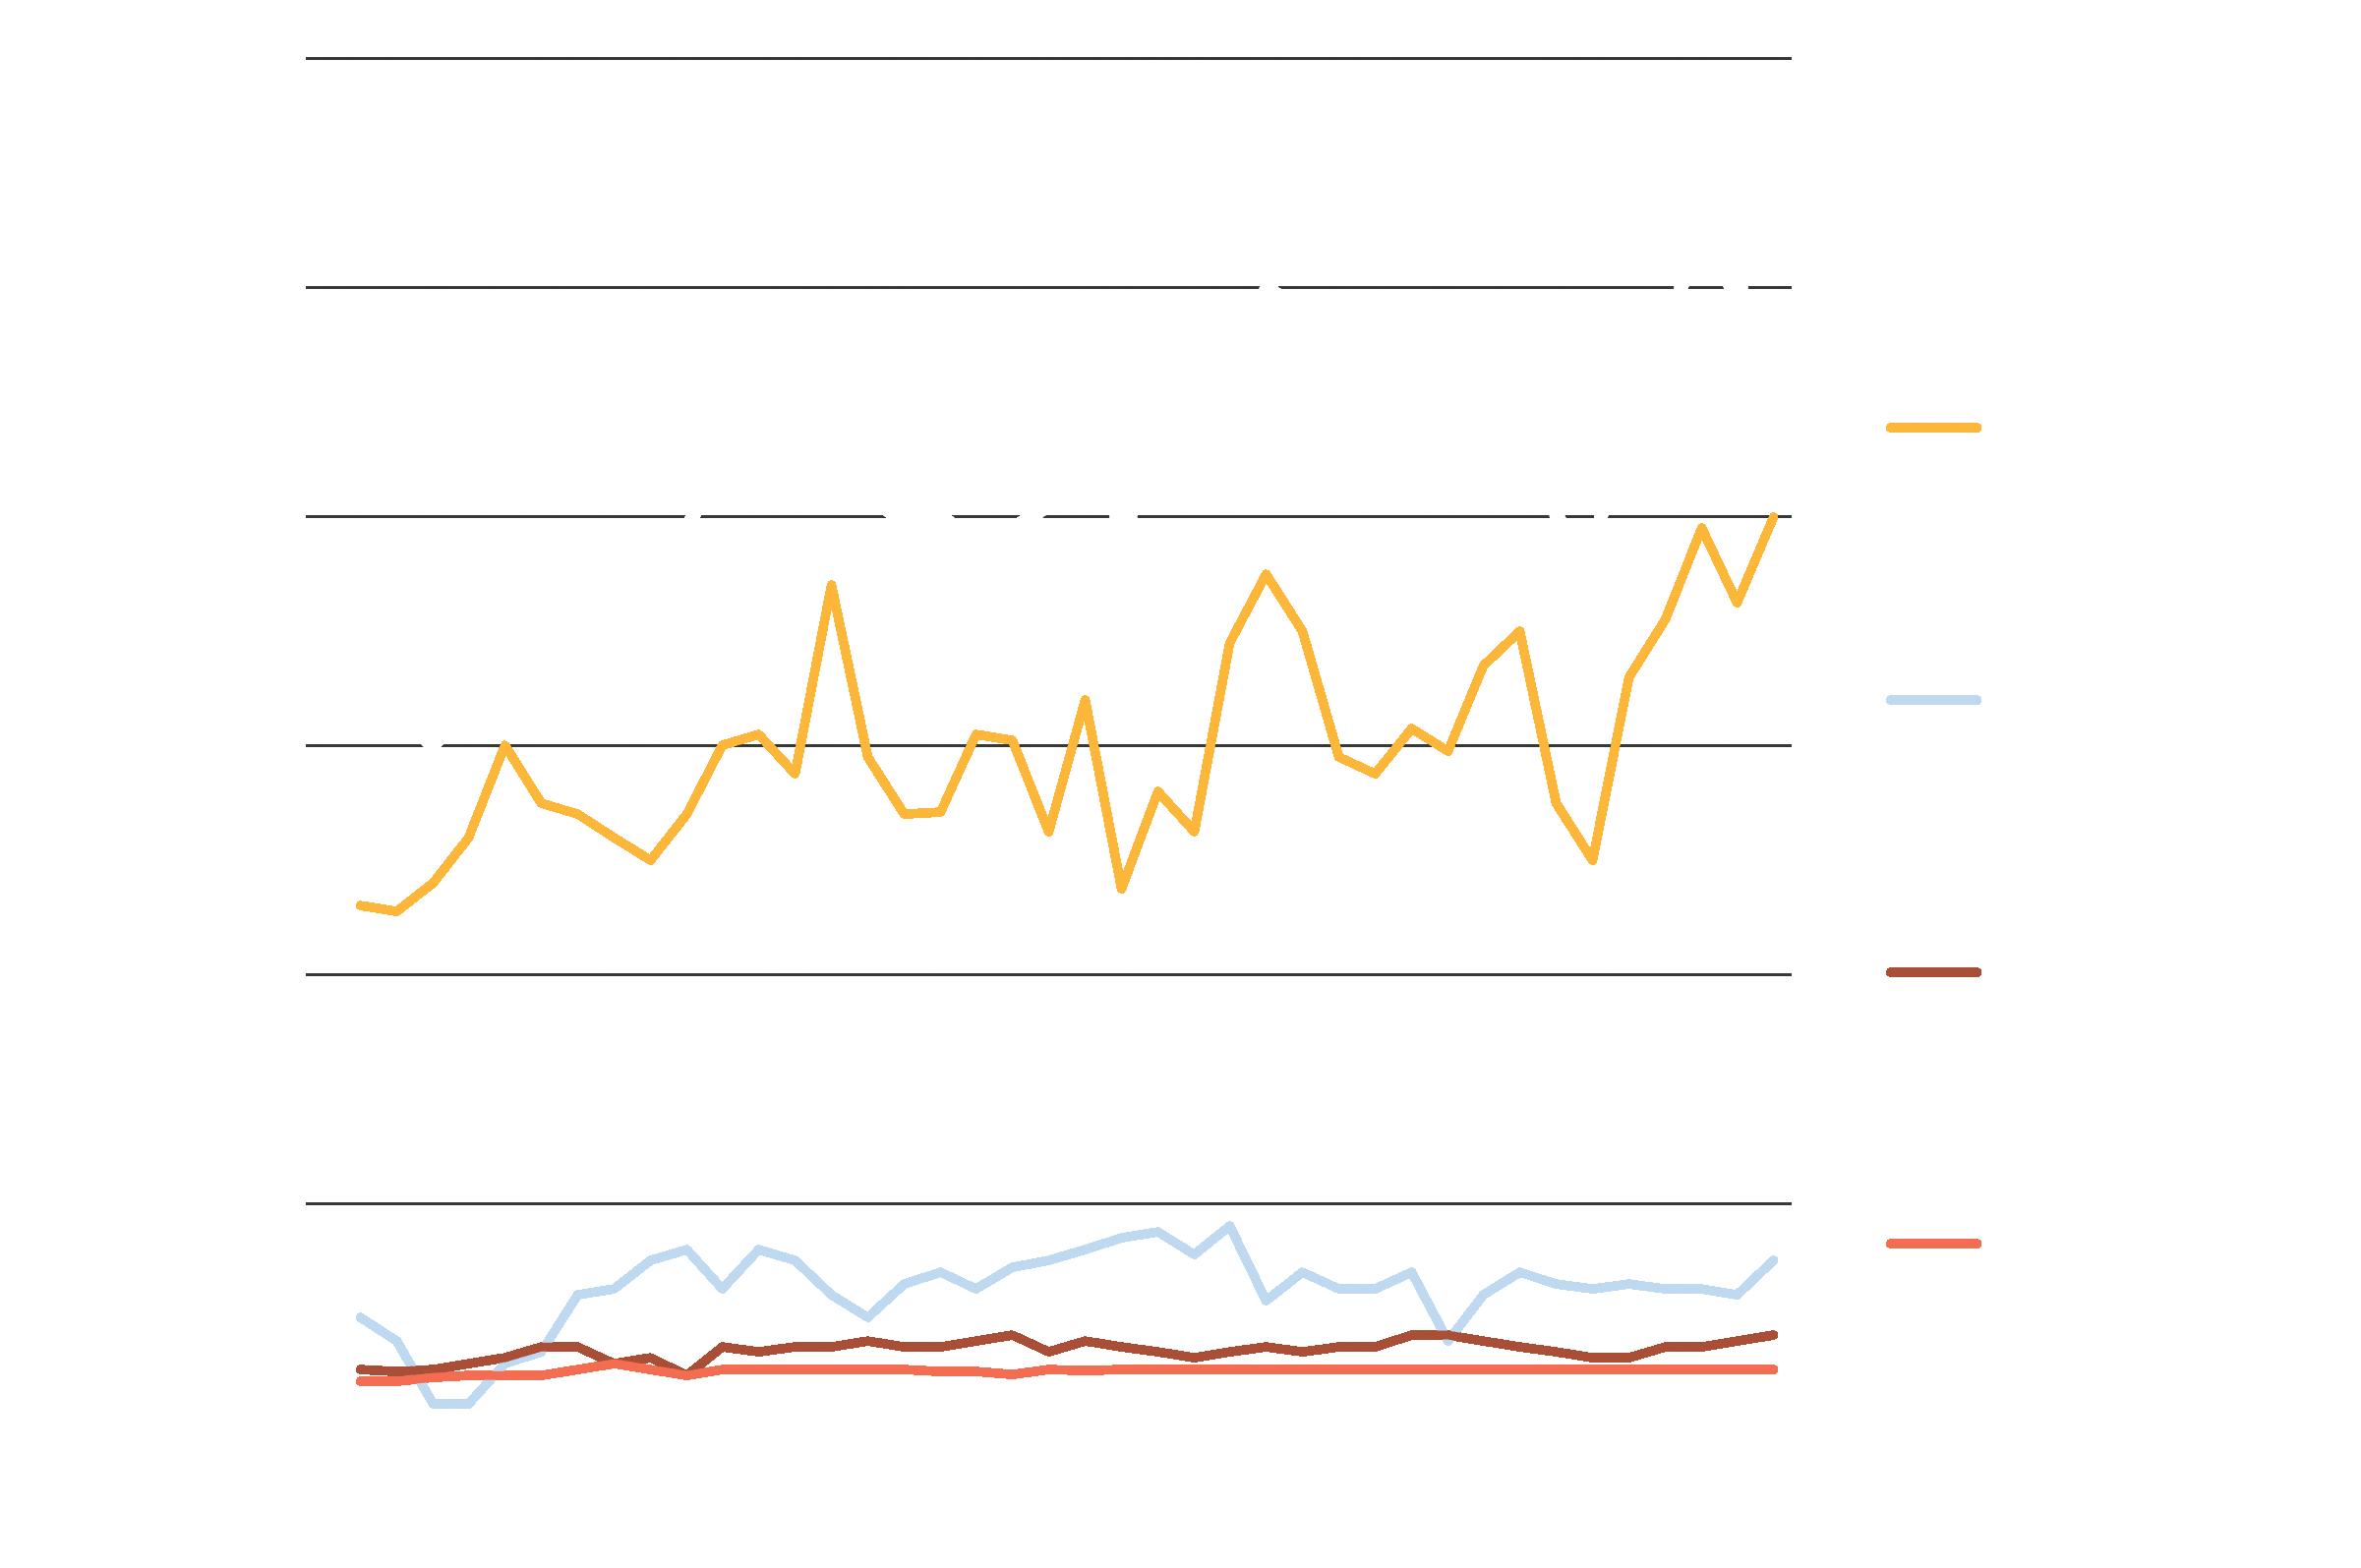
Since 2000, the natural flow of the Colorado River near Lake Powell has been 15 percent less than average flows between 1930 and 1999. Natural flow is the amount of water that would flow in the river in the absence of human activity, estimated by the Bureau of Reclamation. Between 2001 and 2022, natural flow averaged 12.3 million acre feet per year (af/yr). During the same period, consumptive uses and evaporative losses upstream from and within Lake Powell averaged 4.57 million af/yr, and releases to downstream users were 8.81 million af/yr. Upstream uses, losses, and releases downstream exceeded natural flows by approximately 1 million af/yr during the
UTAH STATE UNIVERSITY 2022 REPORT TO THE GOVERNOR ON UTAH’S LAND, WATER, AND AIR 36
Figure 2B.1 Consumptive uses and losses in Utah (1980-2020)
last two decades. That deficit was covered by partially draining Lake Powell and Flaming Gorge reservoirs.
Accounting for evaporation from local reservoirs but excluding evaporation from Flaming Gorge and Lake Powell, approximately 904,000 af/yr of water was consumed in Utah between 2001-20, 23 percent of the total consumptive water use in the Upper Basin. According to consumptive water use data published by the Bureau of Reclamation, Utah’s total use of Colorado River water steadily increased during the last 40 years, from 659,000 af/yr (1981-85) to 1 million af/ yr (2016-20). Between 2001 and 2020, 70 percent of water use was by agriculture—primarily irrigation. The second largest use of water was export, primarily to the Wasatch Front. Water use by agriculture increased by
33 percent during the 21st century—from 555,000 af/yr (2001-05) to 738,000 af/yr (2016-20).
A warming world results in less winter snowpack reaching stream channels. Continued decreases in natural runoff are to be expected in the future. Consumptive uses throughout the entire Colorado River watershed, including in Utah, should be managed so that our use matches our supply. There is tremendous disagreement as to how reductions in use should be defined and implemented, but we can expect that the states and economic sectors that presently use the most water will be asked to significantly reduce their use. There are countless devils in the details of these ongoing negotiations about who will reduce their use and by how much.
37 CHAPTER TWO: WATER
2C:
Urban water conservation: Helping Utah communities integrate land and water use
 Kelly Kopp and Joanna Endter-Wada
The way that new growth and development occurs in the state has a major impact on urban water demand. How we grow matters!
Utah is experiencing drought conditions, warmer temperatures, and population and economic growth. These changes, exacerbated by a changing climate, mean that we must build resiliency into the state’s land and water use planning by adjusting the habits that contribute to growing water scarcity and implementing measures to support responsible and sustainable growth.
During 2022, Utah saw unprecedented water conservation efforts at the state and local levels that succeeded in conserving billions of gallons of water. However, longer term solutions are also necessary. Optimizing use and reducing demand for municipal, commercial, institutional, and industrial water is also critical to ensuring that Utah’s limited water supply can equitably meet the needs of people, the economy, and the environment. Still, the pathway to achieving substantial water conservation presents both challenges and opportunities.
The way that new development in the state occurs has a major impact on water demand, as well as the health of the communities and watersheds in which it happens. Traditionally, responsibilities for water resource management and land use planning have been siloed in different levels of government, departments, and management entities. Land use planning that incorporates water use considerations can lead to more sustainable urban designs in terms of the built environment, urban ecology, and lifestyle patterns of Utah cities and towns. Utah took positives steps during the 2022 legislative session to ensure that land use and water planning are more fully integrated through the passage of SB 110. This legislation requires that water planning be part of the general plan of all cities and counties.
Utah State University faculty members are working in cooperation with the state’s Division of Water Resources and other groups to develop and implement Utah Growing Water Smart, a guidebook and curriculum to facilitate Utah communities’ integration of land and water use planning. Participating communities complete facilitated workshops that culminate in actionable plans and are also eligible for technical assistance grants.
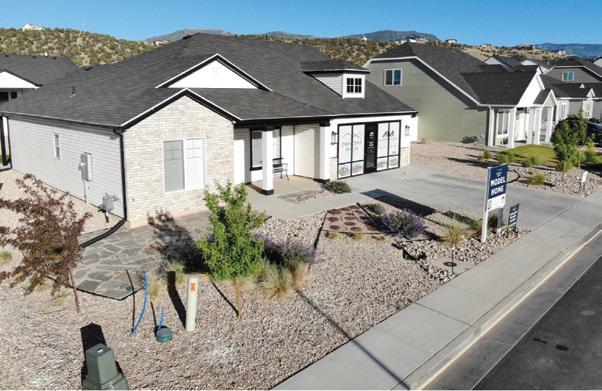
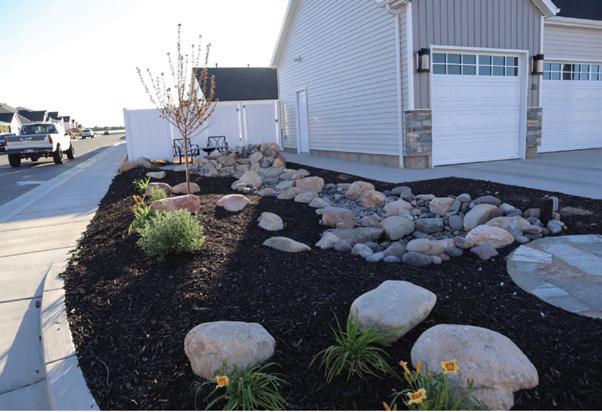
Above: Examples of waterwise landscaping. Right: Lundstrom Park in Logan.
UTAH STATE UNIVERSITY 2022 REPORT TO THE GOVERNOR ON UTAH’S LAND, WATER, AND AIR 38
TAKEAWAY
Development impacts urban water demand, as well as the health of watersheds and communities.
2D:
Nudging wetlands toward recovery after invasion and impacts
Karin Kettenring
TAKEAWAY
Utah’s scarce wetlands suffer from lack of water, pollution, and invasive species like phragmites, but cooperative teams are working to take them back.
Wetlands are a critical part of ecosystems in the West. Wetlands border Great Salt Lake, Utah Lake, and Bear Lake and line rivers and streams throughout the state. They also form in some places where agricultural irrigation creates seasonal flooding. Wetlands play a critical role in supporting Utah’s wildlife, especially waterfowl, and help to protect communities from flooding, drought, dust, polluted water, and climate change.
Utah’s scarce wetlands have been greatly impacted by humans. Upstream diversions, pollution, and invasive species are all problematic. Another major threat to Utah wetlands is the nonnative phragmites. This extremely tall, dense invasive grass crowds out native plants, degrades important habitat and reduces other benefits wetlands would otherwise provide. Phragmites is an extremely thirsty plant and depletes water from wetland areas— especially problematic during the current drought. Phragmites occupies many tens of thousands of acres along Great Salt Lake, Utah Lake, and Bear Lake, as well as lining ditches along roadways, railways, and canals.
It isn’t an easy task to rid a wetland of phragmites, especially once they’ve been established in a spot long enough that native plants and their seeds are long gone. Eradicating them requires a multipronged strategy—herbicides, mowing, grazing, depriving them of water and chopping them down. Clawing back an invaded wetland is a long-haul battle, and one that requires intense cooperation and communication among land managers. Extensive efforts are underway to control this plant across the state and to prevent new infestations. Researchers from USU have partnered with numerous land managers to develop effective techniques for managing phragmites and for reestablishing native plant communities, including novel strategies for dispersing seeds, planting seedlings, and knowledge-sharing events.
Right: Invasive grass- Galena Soo’nkahni Preserve, Draper
UTAH STATE UNIVERSITY 2022 REPORT TO THE GOVERNOR ON UTAH’S LAND, WATER, AND AIR 40
Phragmites
is an extremely thirsty plant and depletes water from wetland areas.
2E:
Utah’s water quality epidemic: Harmful algal blooms
Erin Rivers
TAKEAWAY
Harmful algal blooms are increasing across Utah, leading to a water quality crisis that endangers human health, the environment, and economies throughout the state.
Utah is facing a serious, and even deadly, water quality concern: widespread and proliferating harmful algal blooms (HABs). A growing number of ponds, lakes, reservoirs, streams, and rivers in Utah are developing HABs, and blooms are beginning earlier in the year, lasting longer, and appearing at higher elevations.
Harmful algal blooms are caused not by algae but by a phylum of bacteria called cyanobacteria that produces harmful toxins (cyanotoxins) that can cause skin, brain, and organ damage or failure and can even result in immediate death for wildlife and pets. Cyanotoxins are not only present in the water, but they also accumulate in fish tissue and can become airborne. Contact with cyanotoxins is extremely dangerous for humans and animals, and routes of exposure to cyanotoxins include ingesting contaminated water or food, inhalation of airborne toxins, and direct skin and eye contact.
The total number of HABs in Utah is increasing at a rate of 4.5 new HABs per year. In 2022, HABs were observed in 36 waterbodies, marking a 50-percent increase in the last 5 years, and a 35-fold increase since the start of monitoring in 2014 (Figure 2E.1)2. Notably, HAB occurrences in Utah are increasing rapidly in reservoirs, lakes, and rivers and are developing at higher elevations, signaling that drinking water, irrigation source water, and recreational waters are at risk.
The problem? Excess nitrogen and phosphorus entering waterbodies alongside drought, warming temperatures, and elevated CO2 in the atmosphere. The solution? Reducing nitrogen and phosphorus pollution from urban and agricultural runoff, wastewater, and fossil fuel combustion, in addition to establishing nitrogen and phosphorus standards for lakes, reservoirs, and rivers.
UTAH STATE UNIVERSITY 2022 REPORT TO THE GOVERNOR ON UTAH’S LAND, WATER, AND AIR 42
0 500 1,000 1,500 2,000 2,500 3,000 3,500 0 5 10 15 20 25 30 35 40 2014 2016 2017 2018 2019 2020 2021 2022 Maximum elevation of observed HABs (m) Number of waterbodies with HABs Maximum elevation of observed
Lakes with
Reservoirs with
Rivers with
4.5NEWHABS/YEAR
Figure 2E.1 Harmful algal blooms (HABs) in Utah (2014-2022) Harmful algal bloom in Panguitch Lake in August 2022 detected by Utah Water Watch volunteers. (Hope and Arlene Braithwaite).
HABs
HABs
HABs
HABs
Chapter 2 References
1 Gilles, R. R., Wang, S.-Y., and Booth, M. R. (2012). Observational and synoptic analyses of the winter precipitation regime change over Utah. Journal of Climate, 25, 4670-4698.
2. Utah Department of Environmental Quality. (2022). https://deq.utah.gov/ water-quality/harmful-algalblooms-home
44
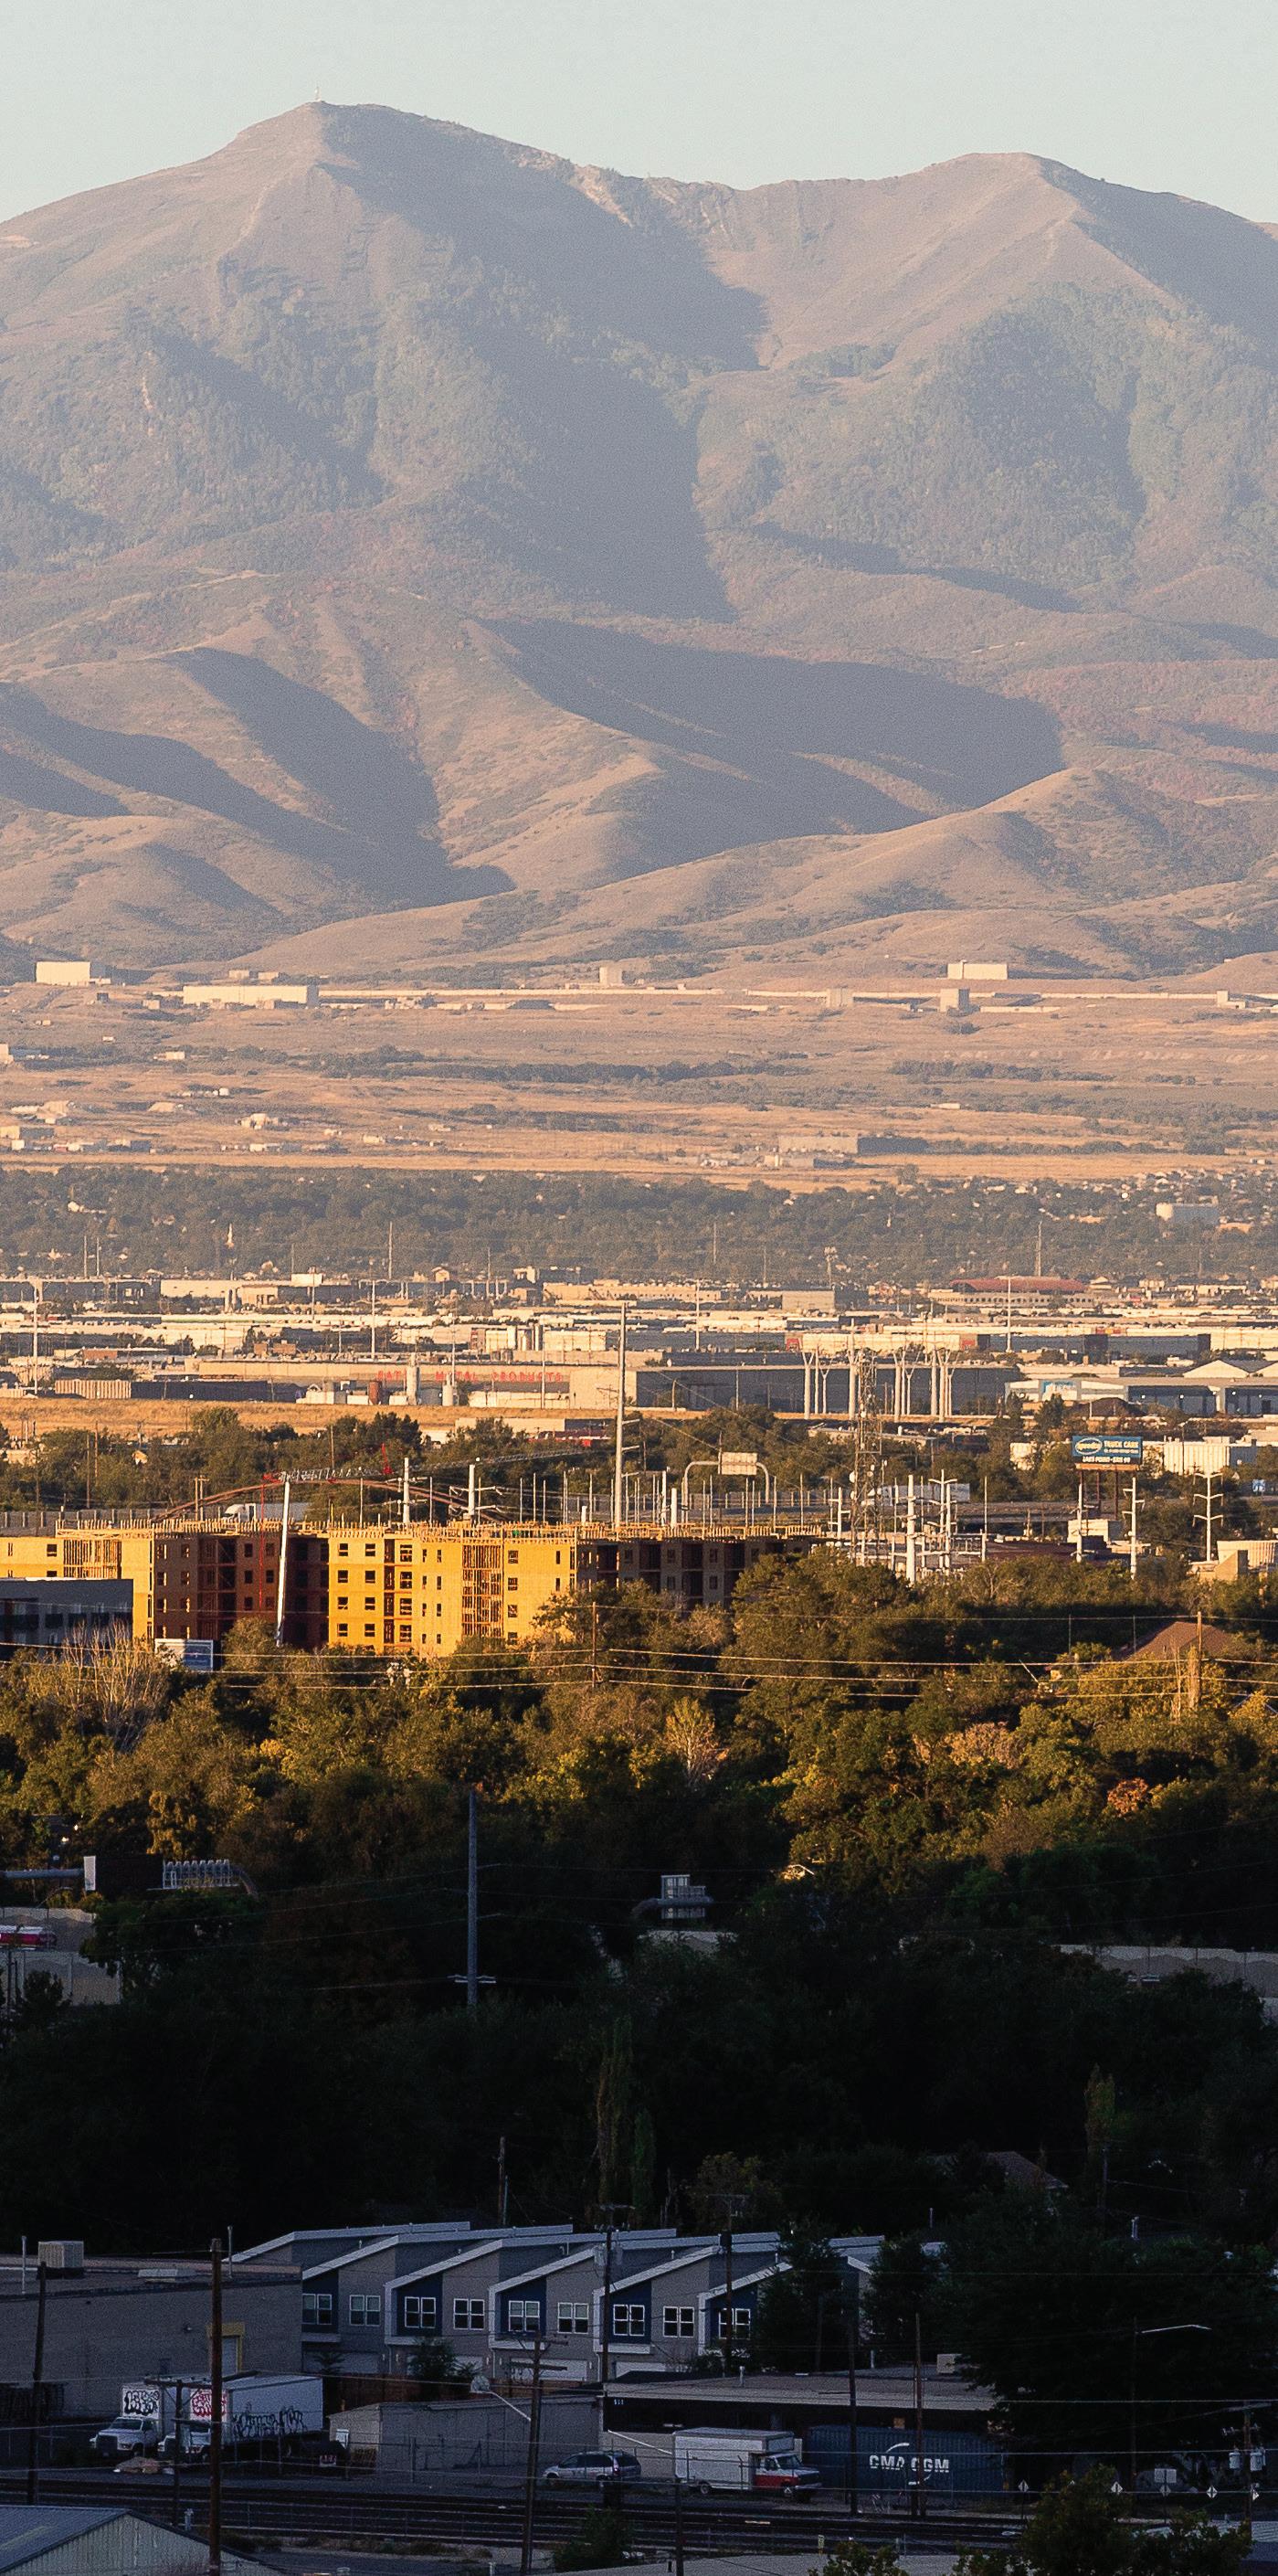
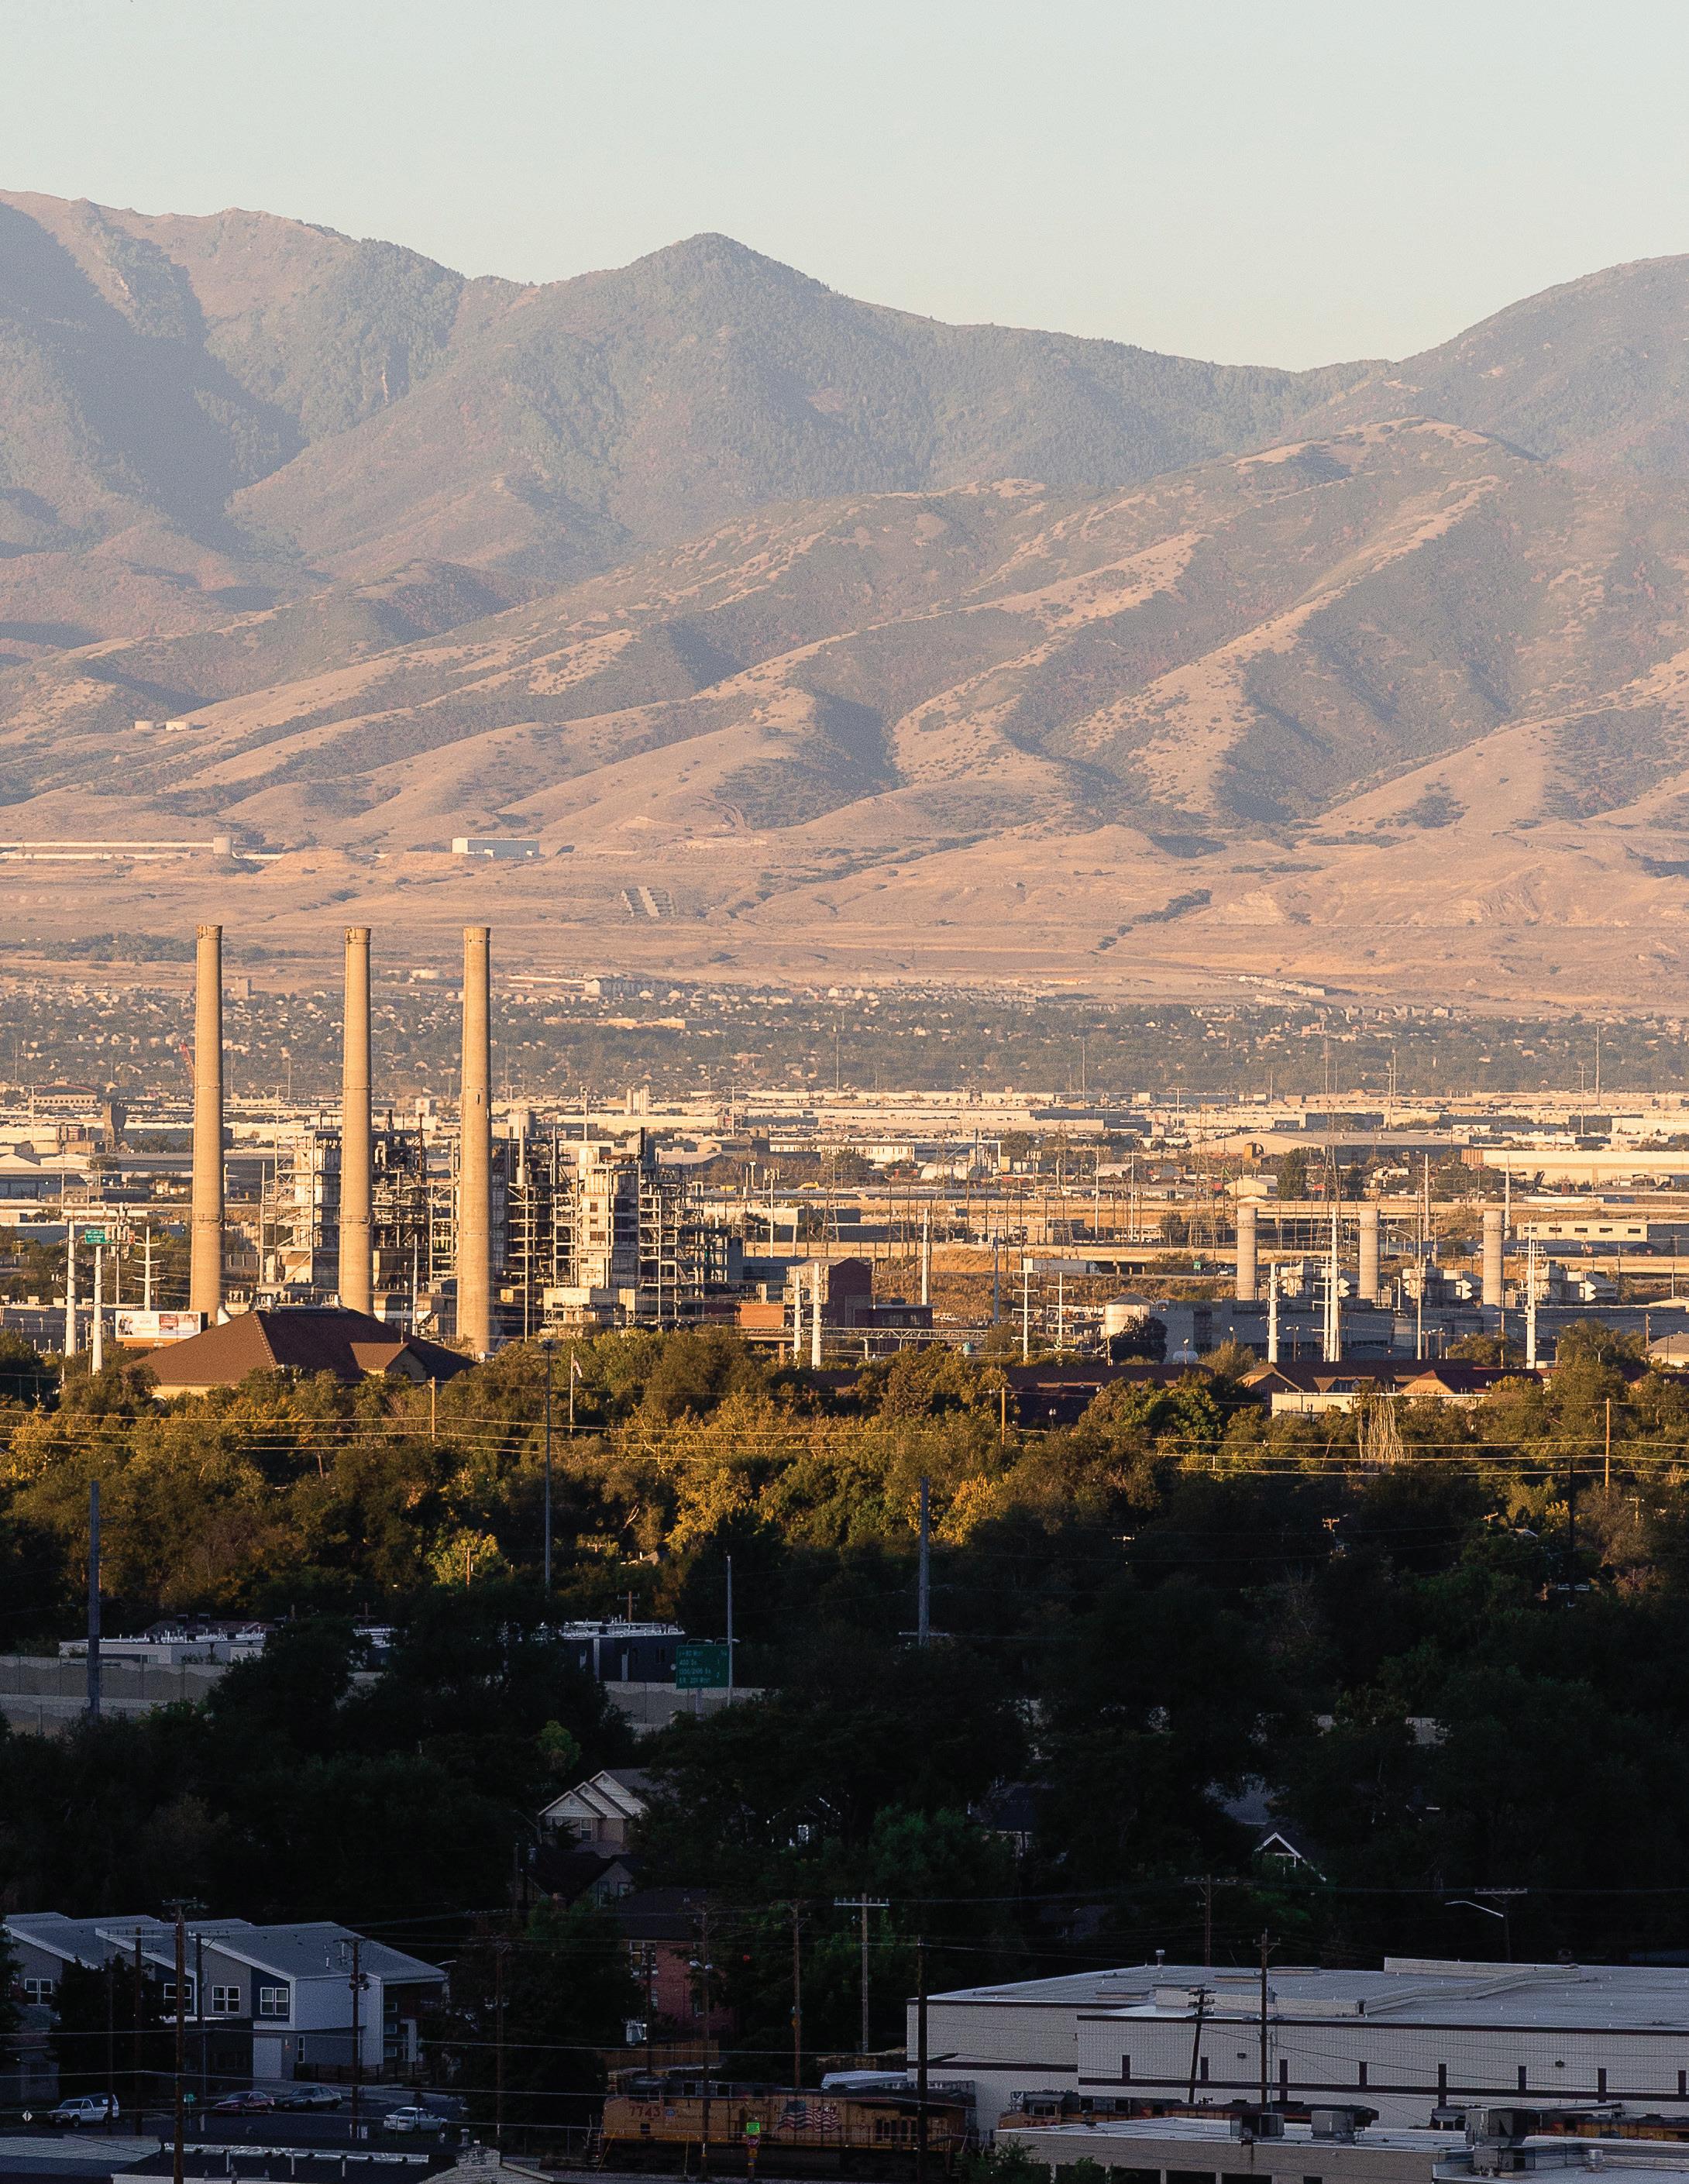
Right: Sunrise over the cityfrom Capitol Hill, Salt Lake City
Chapter three AIR
3A
— 46 3B Changing
— 48 3C Wasatch front ozone — 50 3D Atmospheric ammonia along the
Front and throughout
— 52 3E Heat a growing risk for all
— 54 3F Transportation solutions to reduce pollution — 56
Northern Utah’s fine particulate matter (PM2.5)
winter ozone in the Uinta Basin
Wasatch
Cache Valley
Utahns
3A:
Northern Utah’s fine particulate matter (PM2.5)
Randal Martin
PM2.5 remains an ongoing and complex problem in northern Utah, but we have shown we can effectively reduce wintertime PM2.5 in Cache Valley and address attainment challenges along the Wasatch Front.
PM2.5 has been the most problematic wintertime haze-causing pollutant along the Wasatch Front and Cache Valley over the past 20 years. Through several years of cooperative research, public awareness, and regulatory programs, PM2.5 reduction programs are somewhat a success story. Figure 3A.1 shows that there has been a general decrease in northern Utah’s PM2.5, particularly since 2013, when implementation plans were put into place. As can also be seen, the PM2.5 decreases occurred even though the region’s population increased linearly (approximately two percent each year).
The formerly “moderate” nonattainment Cache Valley airshed reached attainment goals and was officially redesignated to “maintenance” in June 2021. Although recent data suggests that the Provo and Salt Lake City airsheds may have obtained their three-year averaged attainment goals, uncertainties and complexities in the understanding of emissions and photochemical mechanisms have caused the entire Wasatch Front airshed to be designated by the U.S. EPA as “serious” nonattainment.
Outlook
The future of Utah’s PM2.5 management, at least for the next 10-20 years, will require the state to maintain attainment status where it has been achieved and demonstrate that sufficient plans will be implemented in the near term to effectively reduce PM2.5 as soon as possible where exceedances are still
 TAKEAWAY
UTAH STATE UNIVERSITY 2022 REPORT TO THE GOVERNOR ON UTAH’S LAND, WATER, AND AIR 46
Below: State Street offramp, Murray
Figure 3A.1 PM₂.₅ 98th percentile trends for the Wasatch Front and Cache Valley (2002-2021)
1,800
Cache Valley Ogden Harrisville Bountiful Rose Park Hawthorne Lindon 24-hr NAAQS Wasatch & CV Population
observed. With Utah’s continued growth, mostly in metropolitan areas, this could be a challenge, and it will require further understanding of other potential proactive
minimization strategies. A multiagency and multi-university study is tentatively planned for the winter of 2023-24. Figure 3A.1 also shows the potential, unfortunately, that
the PM2.5 concentrations in several airsheds may be trending upwards in the last few years. Exceedances, and redesignation as nonattainment, could be only a bad winter away.
47 CHAPTER THREE: AIR
( µ
3 )
1,900 2,000 2,100 2,200 2,300 2,400 2,500 2,600 2,700 2,800 0 10 20 30 40 50 60 70 80 90 100 110 2002 2004 2006 2008 2010 2012 2014 2016 2018 2020 Wasatch Front and Cache Counties' Population Thousands 98th Percentile 24 hr PM 2.5
g/m
3B:
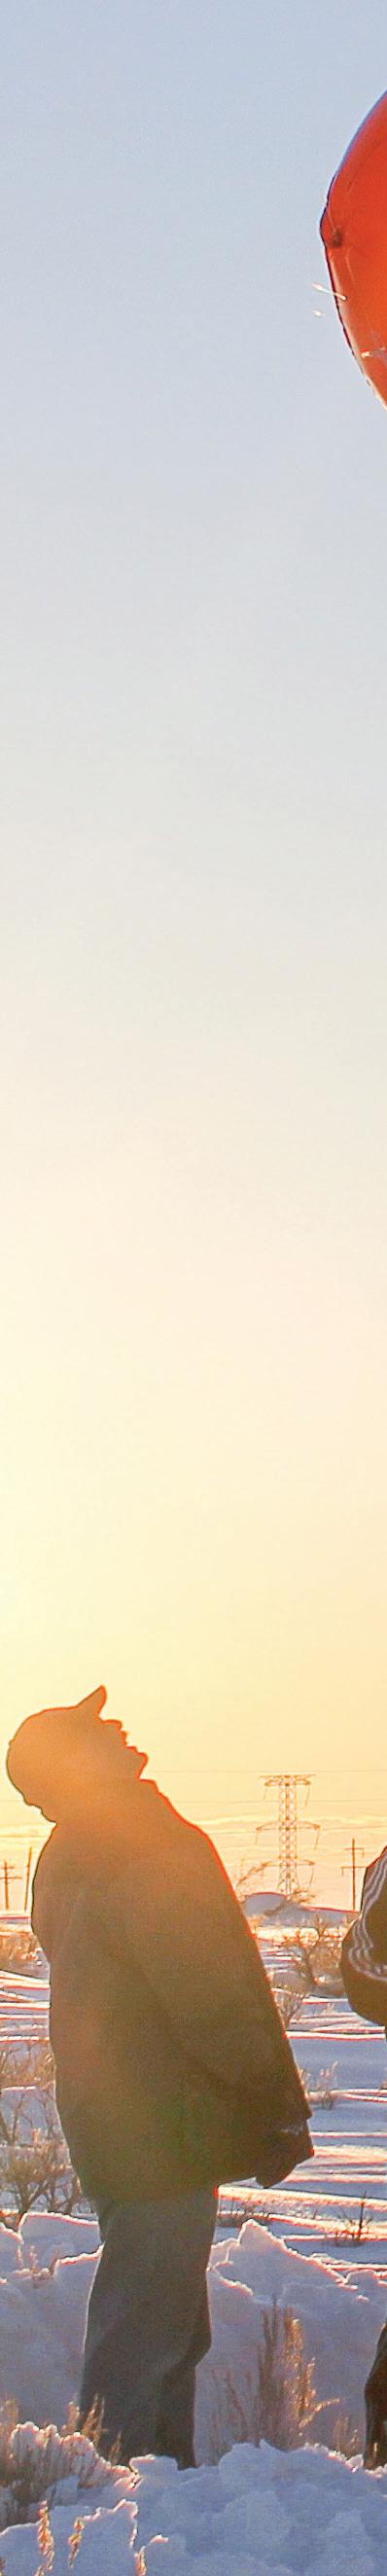
Changing winter ozone in the Uinta Basin
Seth Lyman
TAKEAWAY
Winter ozone and other pollutants have been decreasing in the Uinta Basin, but the future is uncertain.
The Uinta Basin occasionally experiences high ozone during winter months. Ozone is a respiratory irritant that impacts human health, and it is regulated by the U.S. Environmental Protection Agency. Most of the pollution that leads to winter ozone in the basin is emitted from the local oil and gas industry, and regulation that targets the industry may have a detrimental impact on the Uinta Basin economy. Winter ozone only occurs when snow cover blankets the basin and multi-day temperature inversions occur.
Winter ozone levels, and the number of high-ozone days per winter, have both decreased dramatically in the 12 years since the phenomenon was first discovered in the Uinta Basin. The pollutants that react in the air to make ozone have also decreased. Some of the decrease is due to changes enacted by oil and gas companies that have led to reduced emissions, including both voluntary and regulatorily required changes. Another driver of the decrease in winter ozone is the steep decline in natural gas production that occurred in the Uinta Basin from 2015 through 2020 because of a market downturn. Mild winter weather may also have kept high-ozone days low. That trend could be halted if the Uinta Basin experiences more colder, snowy winters.
Right: Research testing in the Uinta Basin
Oil and gas drilling and production in the Uinta Basin have increased since 2021 in response to market increases, and this could mean a reversal of the declining ozone trend. All oil and gas activity results in some emissions to the atmosphere, but, if new activity incorporates pollution controls, the impact on winter ozone could be small. The Uinta Basin has met the EPA ozone standard during the past three winters. Continued effort by industry and regulatory agencies can help ensure this trend continues.
UTAH STATE UNIVERSITY 2022 REPORT TO THE GOVERNOR ON UTAH’S LAND, WATER, AND AIR 48
Winter ozone

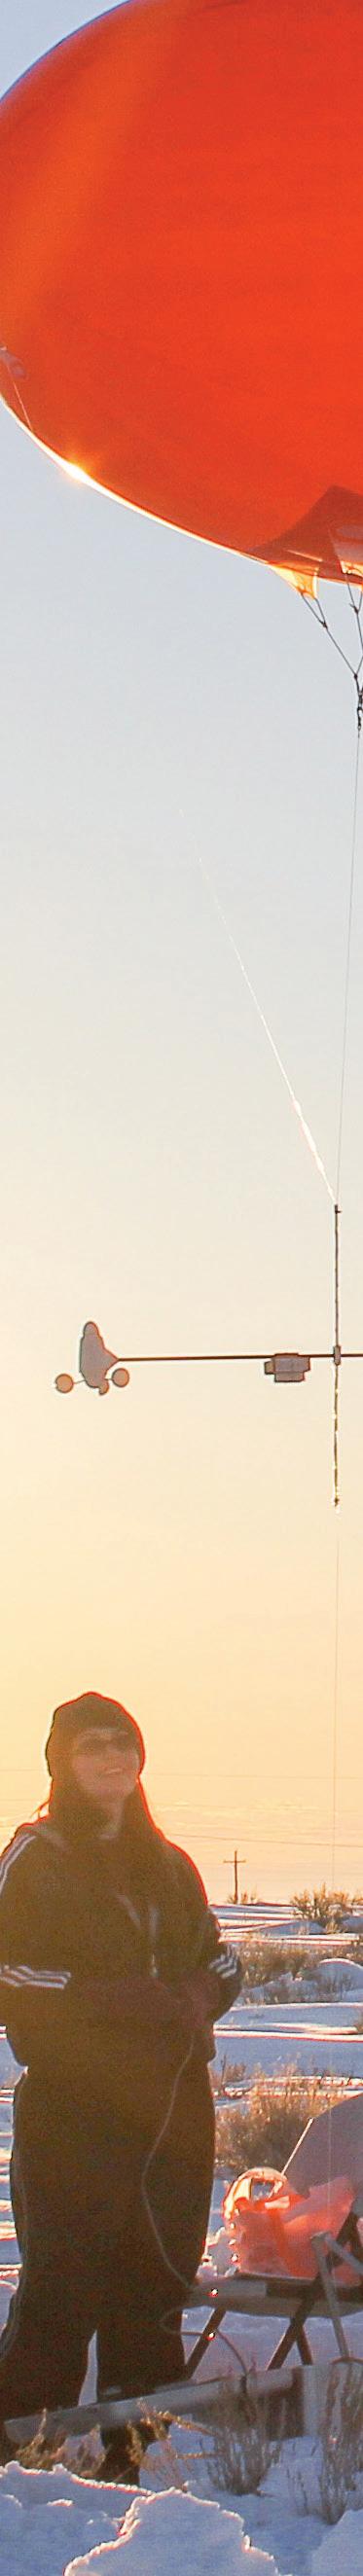
Figure 3B.1 Number of days with ozone above the EPA standard in the Uinta Basin (2010-2022)
2012, 2015, and 2018 were low/no snow years in the Uinta Basin, during which winter ozone does not form, and are shown in yellow.
49 CHAPTER THREE: AIR
has decreased, and continued effort is needed to maintain the trend.
Summertime ozone will continue to pose health and regulatory challenges for Utah’s urban areas.
Wasatch Front ozone
Kim Frost
Utah’s urban center experiences harmful air pollution—ozone—during the summertime. Ozone is a highly reactive gas that causes damage to human lung tissue. Ground-level ozone is generated when precursor pollutants—volatile organic compounds (VOCs) and oxides of nitrogen (NOx)—interact with sunlight. The northern Wasatch Front region experiences ozone concentrations that exceed U.S. Environmental Protection Agency’s air quality thresholds.
Earlier this year, the EPA reclassified the northern Wasatch Front as “moderate” nonattainment. This is a bump up from the previous “marginal” designation. This designation requires the state to submit a state implementation plan showing how the state will reduce precursor emissions in the nonattainment area and an attainment demonstration. The plan is due January 2023, and the attainment date is August 2024.
Many sources of pollution are already regulated through past state implementation plans and other rulemaking efforts; however, one source that has been largely unregulated is lawn and garden equipment. Two-stroke gas powered lawn and garden equipment contributes a significant amount of pollution in the summer. As a result, the Utah Division of Air Quality hopes to create a large multi-year incentive program to help replace gas-powered equipment with cleaner electric equipment.
There are serious potential consequences if the area fails to attain the health-based standard. The federal government can potentially freeze federal highway funds and put in place a far stricter federal implementation plan. However, of far greater importance is the need to reduce ozone to protect Utahns’ health and improve quality of life along the Wasatch Front.
3C:
3C.1 Three-year average of 4th highest ozone concentration (1995-2021) TAKEAWAY 0.60 0.70 0.80 0.90 1994 1996 1998 2000 2002 2004 2006 2008 2010 2012 2014 2016 2018 2020
Hawthorne Bountiful Harrisville UTAH STATE UNIVERSITY 2022 REPORT TO THE GOVERNOR ON UTAH’S LAND, WATER, AND AIR 50
Figure
Ozone (ppm)
Number of days 8-hr ozone daily max >0.70 ppm in Salt
EPA reclassified the northern Wasatch Front from “marginal” to “moderate” nonattainment. Above: View from the Island- Frary Peak Trail, Antelope Island, Great Salt Lake 30 26 32 30 15 27 40 40 18 14 7 14 16 12 7 21 14 36 38 11 15 39 17 0 20 40 60 2000 2002 2004 2006 2008 2010 2012 2014 2016 2018 2020 2022 Number of days Unhealthy for sensitive groups (.071-.085 ppm) Unhealthy (.086-.0105 ppm) Very unhealthy (> = .106 ppm)
Figure 3C.2
Lake City (2000-2022)
Atmospheric ammonia along the Wasatch Front and throughout Cache Valley
Randal Martin
TAKEAWAY
Gas-phase ammonia is an important precursor to northern Utah’s PM2.5. As such, it is critical to understand the strengths and distribution of its wintertime sources.
During winter inversion episodes, ammonium nitrate makes up about half of the Wasatch Front’s PM2.5 mass and up to 90 percent of Cache Valley’s PM2.5 mass. Ammonium nitrate is formed by reactions involving nitric acid, which is created from volatile organic compounds, oxides of nitrogen, and gasphase ammonia. The effectiveness of potential solutions is dependent on understanding which of those compounds (nitric acid or ammonia) are less available.
gas-phase
UTAH STATE UNIVERSITY 2022 REPORT TO THE GOVERNOR ON UTAH’S LAND, WATER, AND AIR 52
Northern Utah’s
ammonia concentrations are consistently among the highest in the nation.
3D:
Figure 3D.1 Average ammonia concentrations in the U.S. (2019-2021)
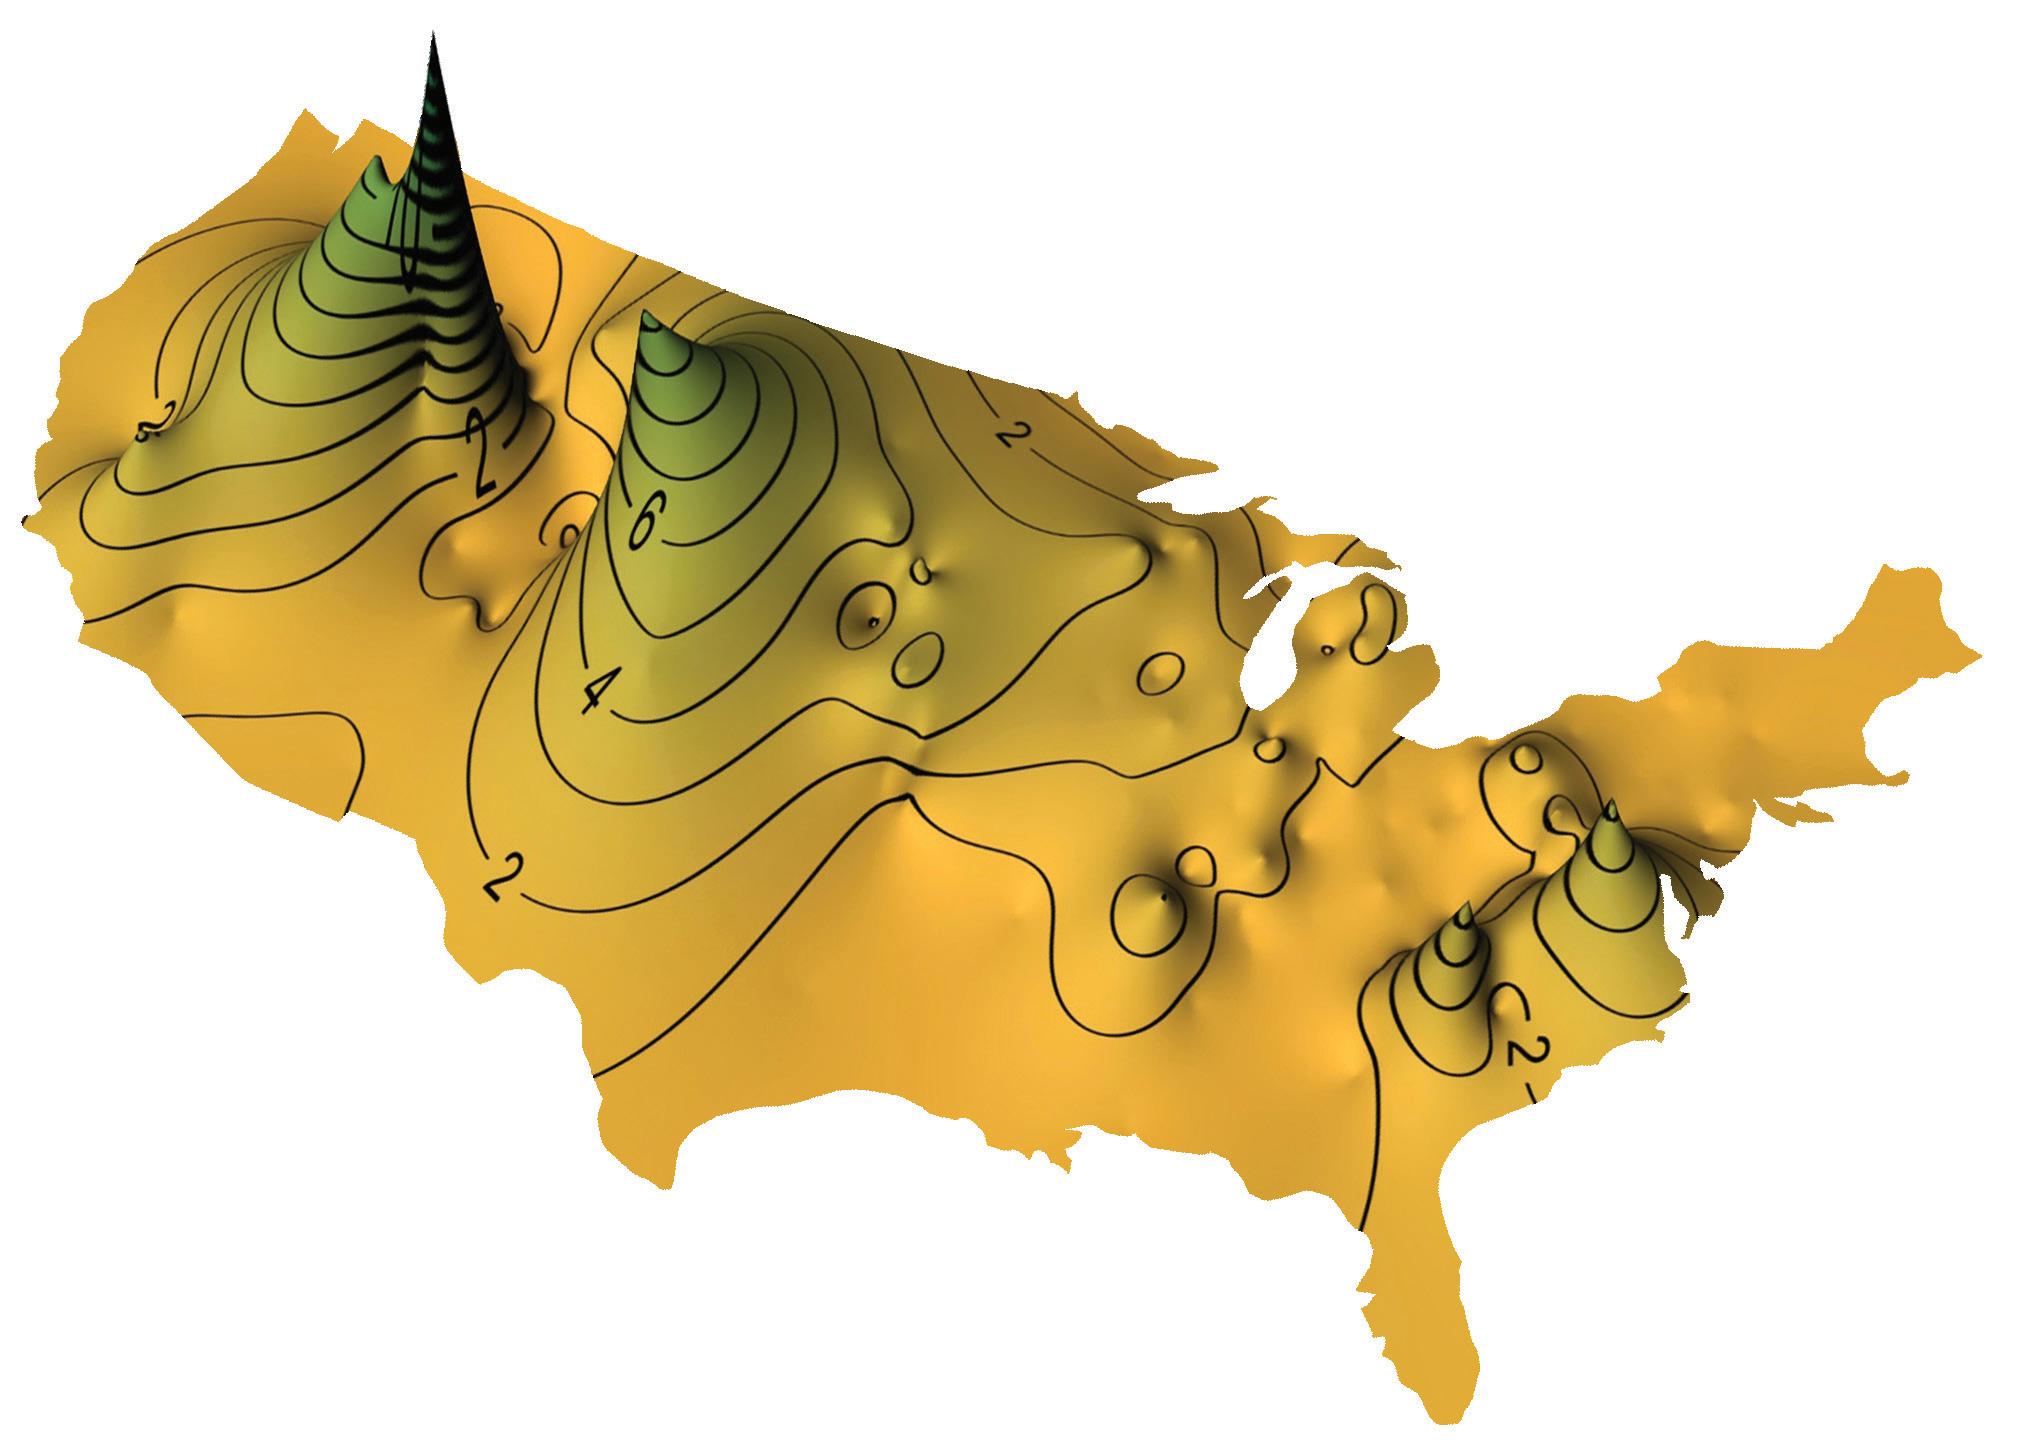
CACHE VALLEY, UT (17.4 mg/m3)
KIMBERLY, ID (10.5 mg/m3)
WELD COUNTY, CO (10.7 mg/m3)
Cache Valley’s ammonia levels have been called “volcanic” in their levels that far exceed other levels in the nation.
Research has found that ammonium nitrate PM2.5 formation along the Wasatch Front is limited by oxides of nitrogen early in inversion episodes, but transforms to ammonia-limited formation later in an inversion, when PM2.5 concentrations increase.
This pattern, however, doesn’t hold in Cache Valley; the airshed there has two to six times more ammonia than nitric acid. In that case, the abundance
of ammonia suggests that trying to reduce it would not result in a decrease in PM2.5 mass until at least half of the ammonia is removed.
Northern Utah’s gas-phase ammonia concentrations are consistently among the highest in the nation. Cache Valley recorded a 2019-2021 average of 17.4 micrograms per cubic meter, highest in the nation, and the Salt Lake City area recorded an average of 4.3 micrograms
per cubic meter, the 13th highest in the nation.
Studies have been completed and are ongoing to identify ammonia concentrations across time, locating potential “hot spots” of unanticipated elevated emissions, and finding under-counted sources, such as direct emissions from diesel and gasolinefueled vehicles, landfills, and from agriculture.
53 CHAPTER THREE: AIR
National Atmospheric Deposition Program’s (NADP) Ammonia Monitoring Network (AMoN)
Heat a growing risk for all Utahns
Peter Howe
TAKEAWAY
The hottest summer on record across the state occurred in 2021, and 2022 brought more extreme temperatures, including a record-breaking 34 days over 100 ºF in Salt Lake City.
Heat now causes more deaths than any other weather-related hazard in the U.S.1 Health impacts are greater for people without access to air conditioning and those who work or exercise outdoors—including visitors to Utah’s parks and protected areas2,3. Those with health conditions4, older people, and children are also at higher risk. High temperatures in school buildings directly inhibit student learning5, yet many schools in Utah lack air conditioning and cope with extremes by adjusting schedules or shortening school days6. Utahns have historically relied on our cool nights to protect us from some of the serious health risks caused by extreme heat, but nighttime low temperatures are rising in urban heat islands7 such as along the Wasatch Front. The health impacts of heat are also made worse for Utahns by summer air pollution: Ozone is typically most dangerous in urban areas on the hottest days, and hot, dry weather can exacerbate regional wildfires that create hazardous air quality.
Decision-makers in Utah have not yet had extensive experience responding to extreme heat9, but many Utahns are now worried about the risks to their health, especially those in low-income neighborhoods most exposed to urban heat8
Solutions exist to help Utahns adapt to our hotter climate: Improvements in weather forecasting now allow for earlier heat warnings so that people can prepare themselves and care for at-risk family members and neighbors. Urban heat exposure can be reduced with growing adoption of green infrastructure and reflective roofing and paving materials. Transitioning to clean electricity sources can promote access to cooling while also reducing air pollution and helping avoid an even more dangerously hot climate.
Heat causes more deaths than any other weatherrelated hazard in the U.S.
3E:
UTAH STATE UNIVERSITY 2022 REPORT TO THE GOVERNOR ON UTAH’S LAND, WATER, AND AIR 54
Figure 3E.1 Summer high temperatures (1990-2022) and ER heat-related visit rates (2000-2020)
Utah statewide average summer high temperature (1990-2022)10 and statewide age-adjusted rate of emergency department visits for heat-related illness per 100,000 people (2000-2020)11
Figure 3E.2 Number of heat advisories in Utah (1990-2022)
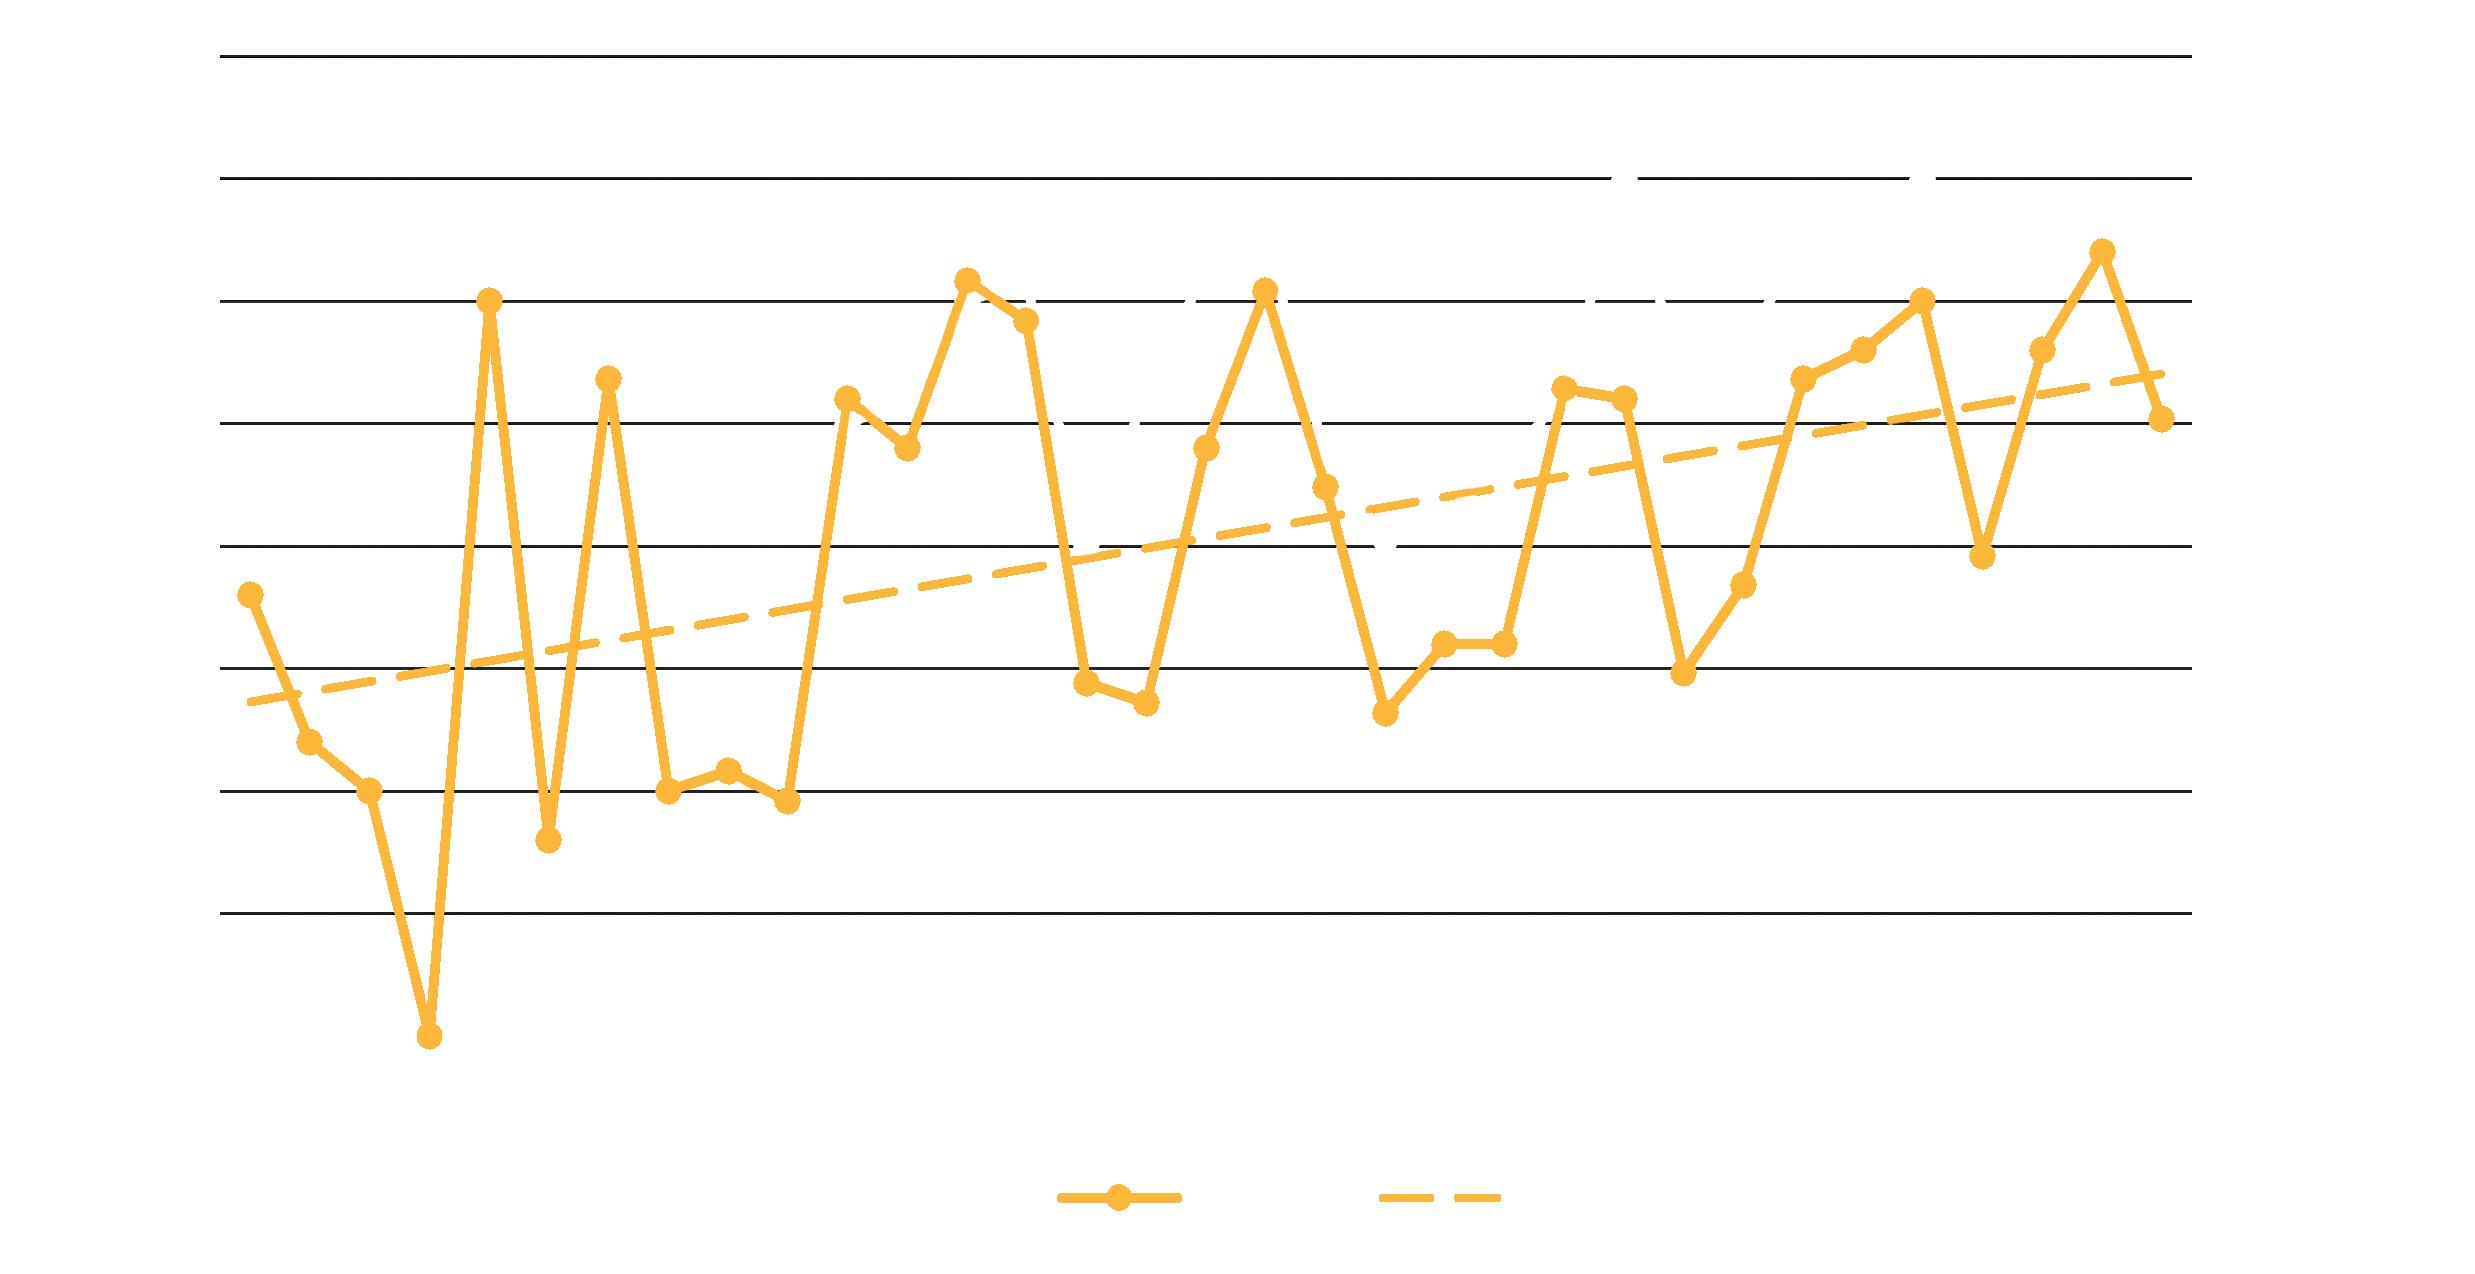
Number of heat advisories per year issued by the National Weather Service in Salt Lake City, UT, or Grand Junction, CO, Weather Forecast Offices for any area in Utah12. A Heat Advisory is issued within 12 hours of the onset of extremely dangerous heat conditions.

55 CHAPTER THREE: AIR
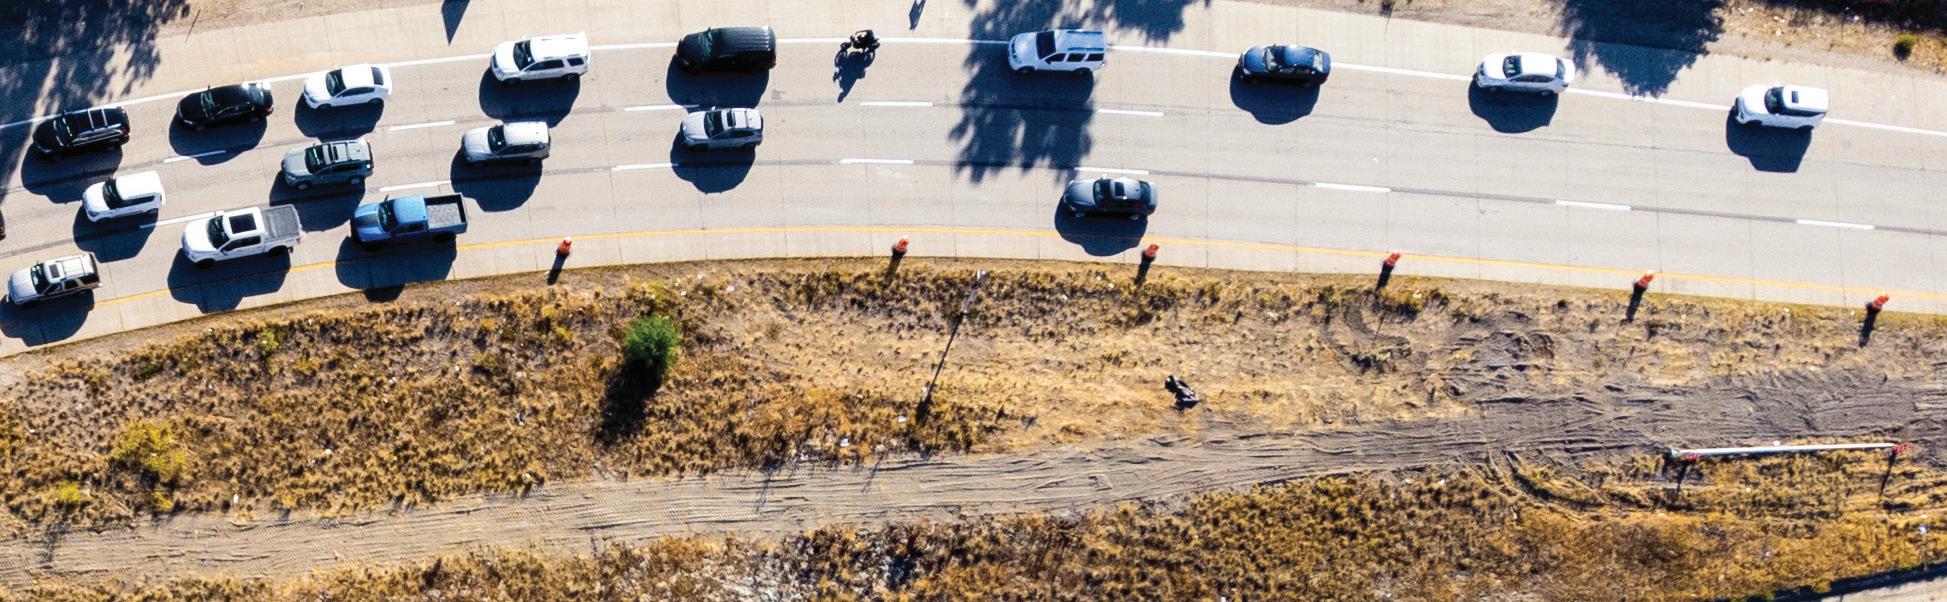
Future electrification of vehicles in the northern Wasatch Front will be critical for addressing the area’s long-standing air pollution problems.
Transportation solutions to reduce pollution
Jana Milford and Jennifer Turk
Along the Wasatch Front, on- and off-road vehicles account for 40 percent of emissions of human-caused volatile organic compounds and 70 percent of nitrogen oxides, the two precursors of summertime ozone pollution13. In the future, those emissions could be dramatically reduced with vehicle electrification. The Wasatch Front is also impacted by particulate air pollution, a complex mixture of very fine airborne particles linked to a wide range of serious health effects including cardiovascular and respiratory disease. Direct emissions of particulate matter from on- and off-road vehicles, along with atmospheric chemical formation from vehicle-linked nitrogen oxides emissions, are significant contributors to particulate air pollution along the Wasatch Front. Analysis suggests that across the state of Utah, reducing exposure to particulate air pollution by
Estimated potential health benefits from reduced particulate matter air pollution in Utah counties due to full electrification of long-haul trucks with clean electricity (2021).

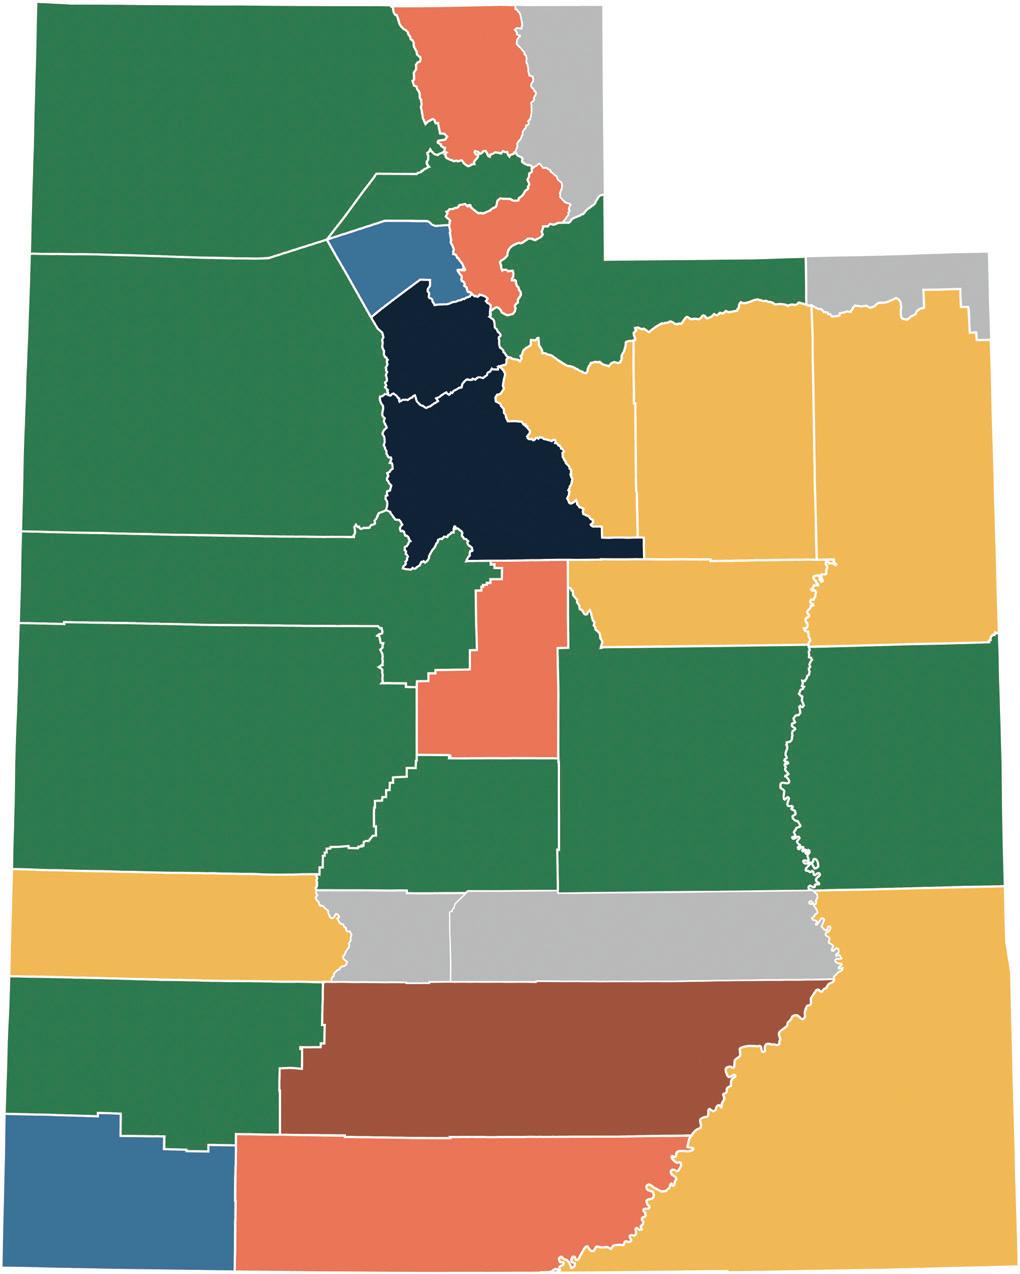
Potential value of health benefits from long-haul truck electrification $200K $500K $1M $2M $5M $10M $20M
3F: Figure 3F.1
UTAH STATE UNIVERSITY 2022 REPORT TO THE GOVERNOR ON UTAH’S LAND, WATER, AND AIR 56
TAKEAWAY
electrifying long-haul trucks with a clean electric grid could produce health benefits on the order of $120 million per year.14
The National Science Foundation ASPIRE Engineering Research Center based at Utah State University has the goal of catalyzing sustainable and equitable transportation through widespread electrification of all classes of on- and offroad vehicles. The ASPIRE center is advancing both plug-in and wireless charging technologies, including integration of the transportation system, charging demand, and the electric grid. Through widespread vehicle electrification combined with clean electricity generation, ASPIRE aims to advance deep reductions in air pollution from the transportation sector.
57 CHAPTER THREE: AIR
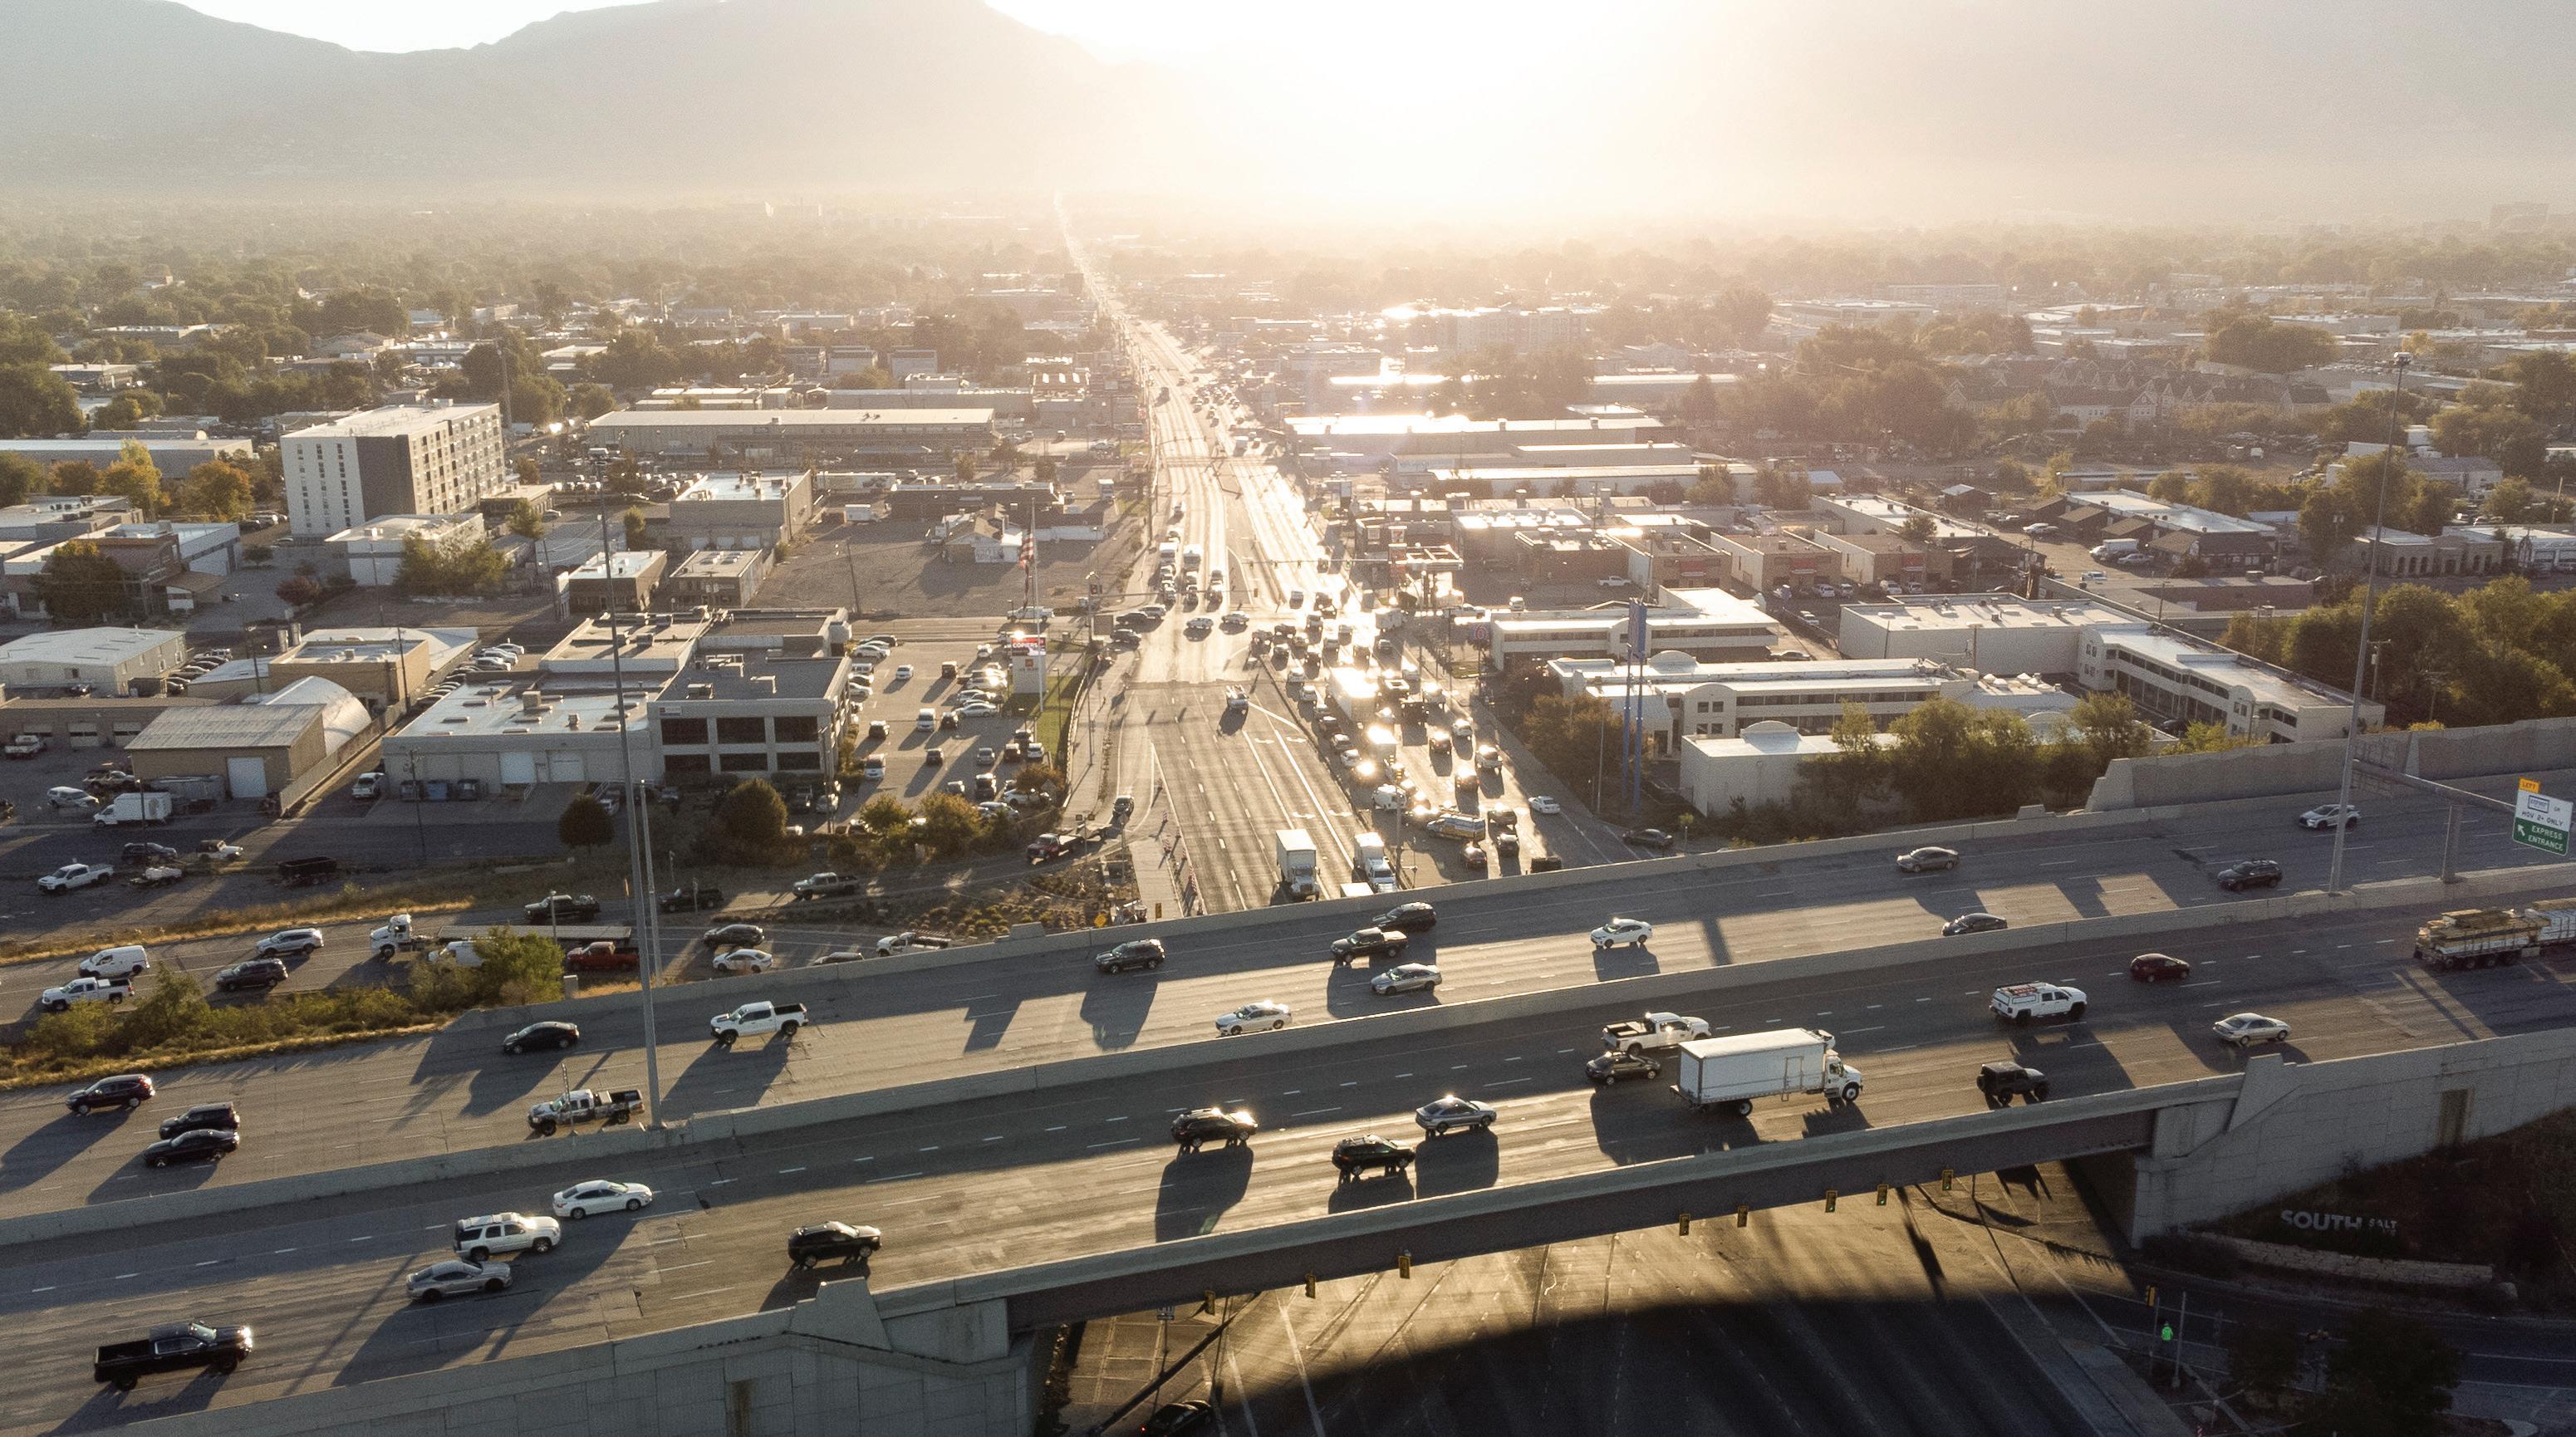
Below: Highway overpass- West Valley City, Salt Lake City
References
1 National Weather Service. (2022). Weather Related Fatality and Injury Statistics. https://www.weather.gov/ hazstat/
2. Jag, J. (2022, September 12). As another heat wave hits Utah, how hot is too hot in our national parks? The Salt Lake Tribune. https://www.sltrib.com/ sports/2022/09/01/how-hot-is-toohot-utahs/
3. Goldstein, K., Howe, P. D. (2019). Dry Heat Among the Red Rocks: Risk Perceptions and Behavioral Responses to Extreme Heat Among Outdoor Recreationists in Southeastern Utah. Journal of Extreme Events, 6(3), 2050004. https://www. worldscientific.com/doi/abs/10.1142/ S2345737620500049
4. Wilhelmi, O. V., Howe, P. D., Hayden, M. H., O’Lenick, C. R. (2021). Compounding Hazards and Intersecting Vulnerabilities: Experiences and Responses to Extreme Heat During Covid-19. Environmental Research, 16, 084060. https://iopscience.iop.org/ article/10.1088/1748-9326/ac1760/ meta
5. Park, R. J., Goodman, J., Hurwitz, M., and Smith, J. (2020). Heat and Learning. American Economic Journal: Economic Policy, 12, 306-339.
6. Cortez, Marjorie. (2022, September 2). Sweltering classrooms, shortened days: The cost of climate change on schools. Deseret News https://www.deseret. com/utah/2022/9/2/23331848/ climate-change-heat-dome-impactschool-schools-heat-days
7. Debbage, N. and Shepherd, J. M. (2015). The urban heat island effect and city contiguity. Computers, Environment and Urban Systems, 54, 181-194.
8. Howe, P. D., Marion, J. R., Wang, X., and Leiserowitz, A. Public perceptions of the health and risks of extreme heat across the U.S. states, counties, and neighborhoods. PNAS, 116(14), 6743-6748. https://www.pnas.org/ doi/10.1073/pnas.1813145116
9. Esplin, E. D. and Howe, P. D. (2021). It’s a dry heat: Professional perspectives on extreme heat risk in Utah. Journal of Risk Research, 24, 1558-1575.
10. NOAA. (September 2022). Climate at a Glance Statewide Time Series: Utah Average Temperature. https://www. ncei.noaa.gov/access/monitoring/ climate-at-a-glance/statewide/timeseries/42/tavg/1/10/1895-2022?basep rd=true&begbaseyear=1901&endbasey ear=2000
11. CDC National Environmental Public Health Tracking Network. (2022). Age-adjusted Rate of Emergency Department Visits for HRI per 100,000 Population https://ephtracking.cdc. gov/DataExplorer
12. Iowa Environmental Mesonet. (2022). Archived NWS Watch, Warnings, Advisories. https://mesonet.agron. iastate.edu/request/gis/watchwarn. phtml
13. Northern Wasatch Front 2017 Summertime Emissions Inventory. Accessed October 18, 2022, from https://home.chpc.utah. edu/~u0864163/OZONE_public/NWFSMOKE-Summary-Report.html
14. Jennifer Turk. (October 2022). Health Impacts of Vehicle Electrification in the US with a Special Emphasis on Heavy Duty Vehicles [Unpublished master’s thesis]. Utah State University.
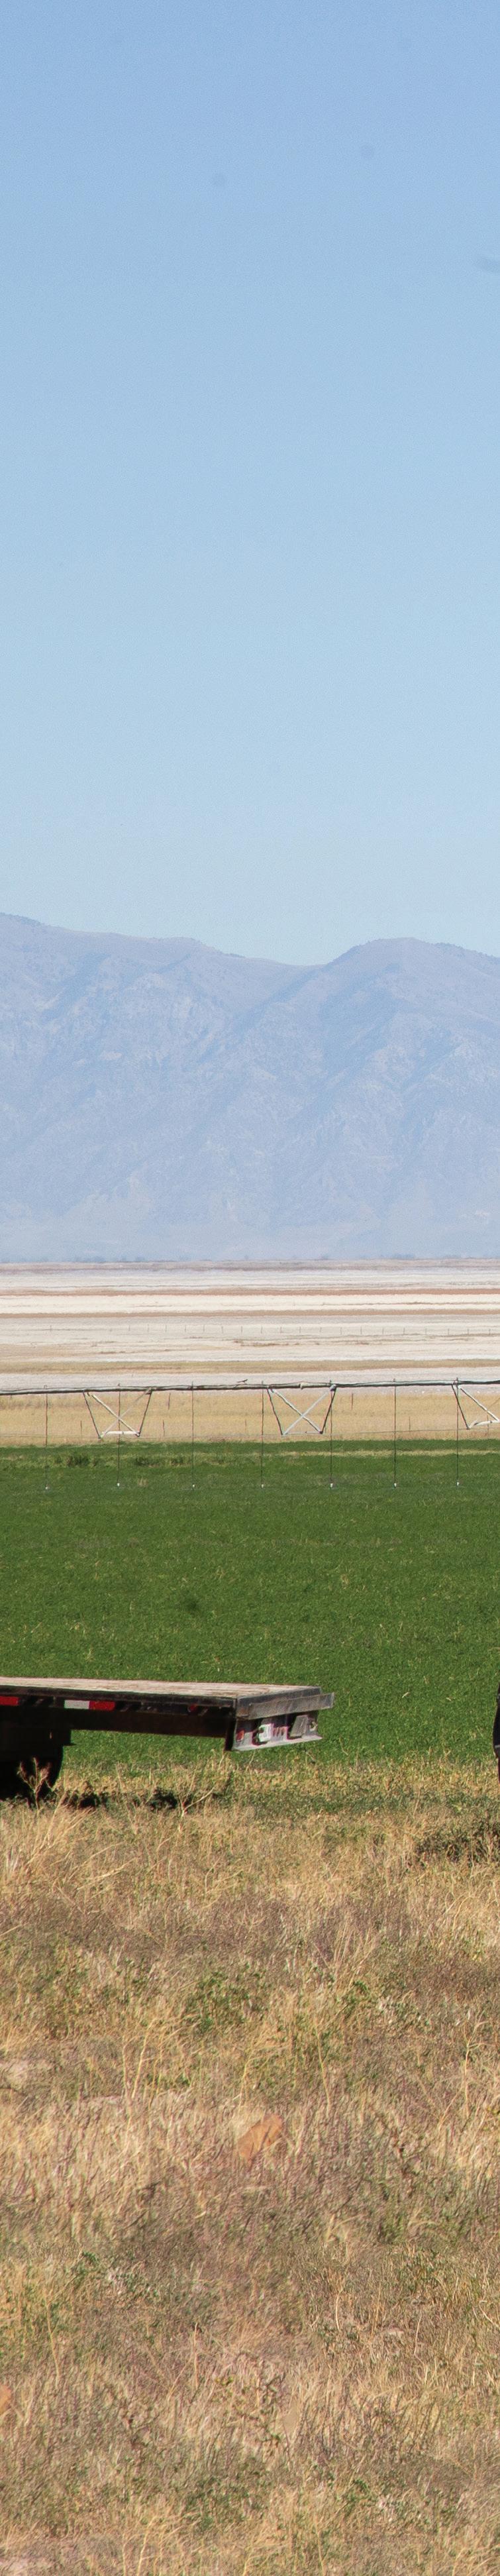
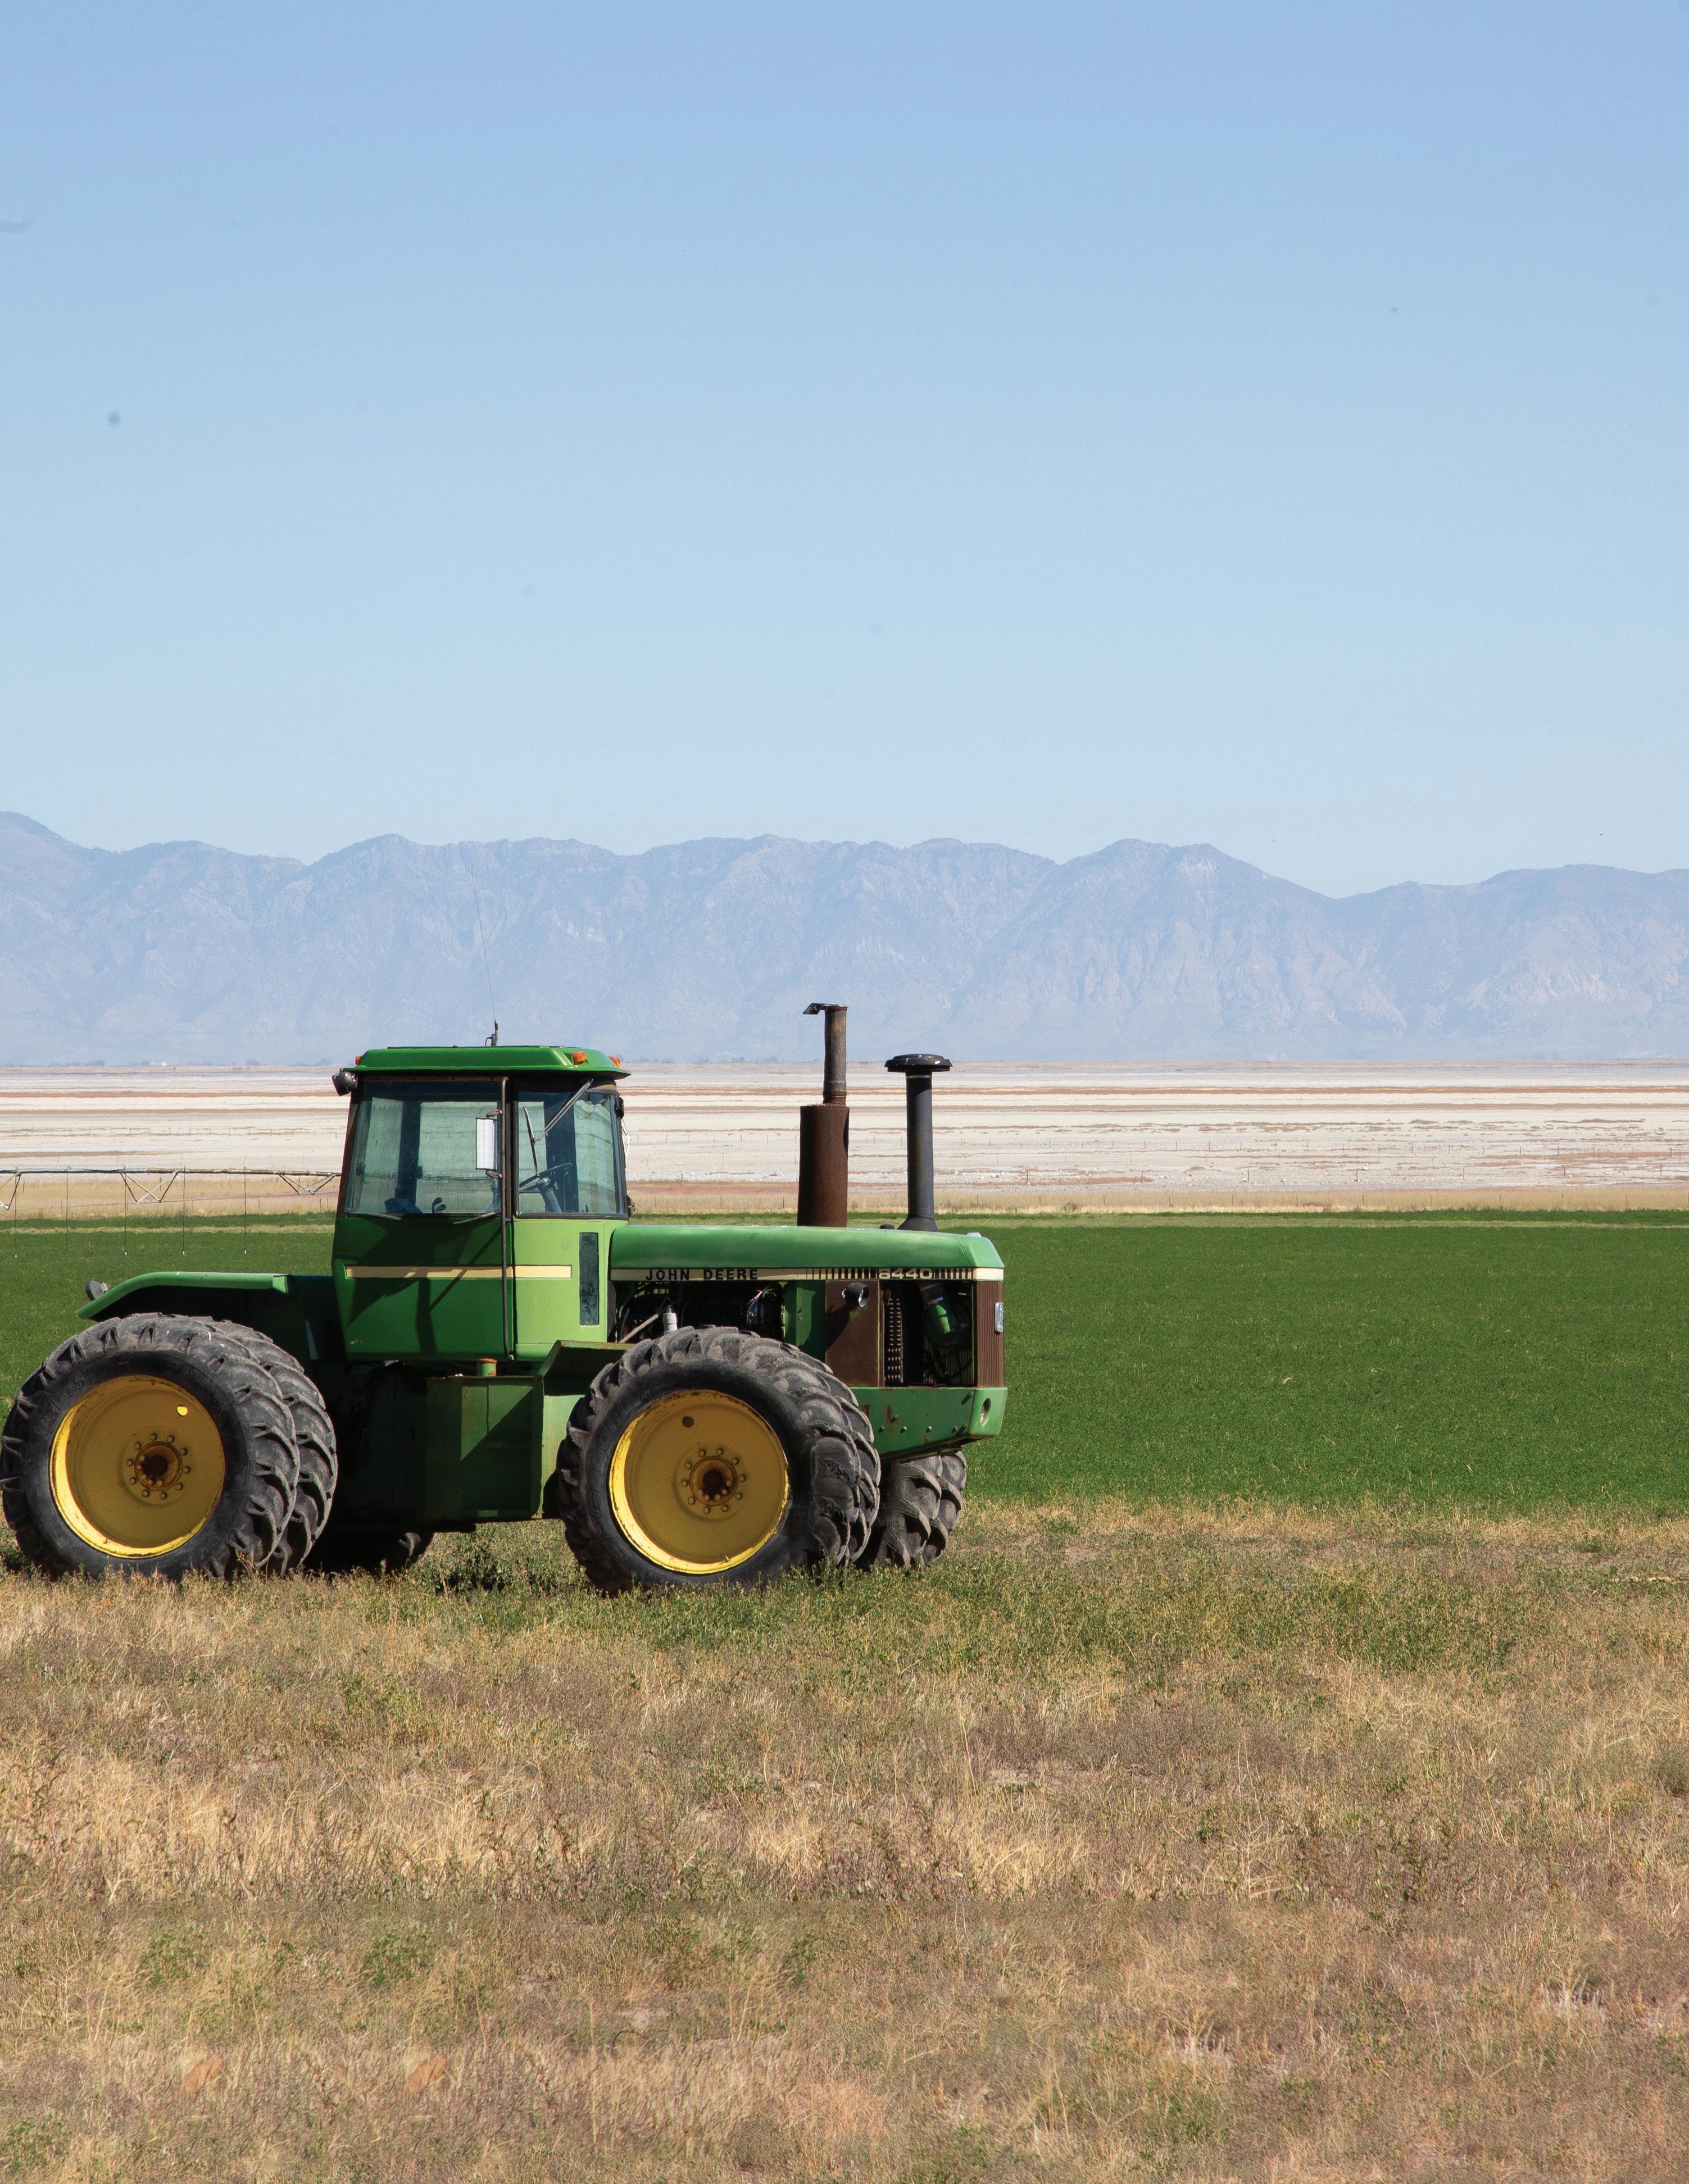
Above: Salt washed farm- Promontory Road, Bear River Bay
Chapter
3
58
Chapter four AGRICULTURE
4A Prioritizing water optimization in agriculture— 60
4B Land-use change: Houses are the last crop — 62 4C Crop production issues — 64
4D Utah’s Animal agriculture, a multibillion-dollar industry — 66 4E Impacts of drought on rangeland forage production across Utah — 68
4A:
Prioritizing water optimization in agriculture
Matt Yost
TAKEAWAY
Agricultural water optimization can save significant amounts of water, but much more technical support, financial support, and research are needed to guide these efforts.
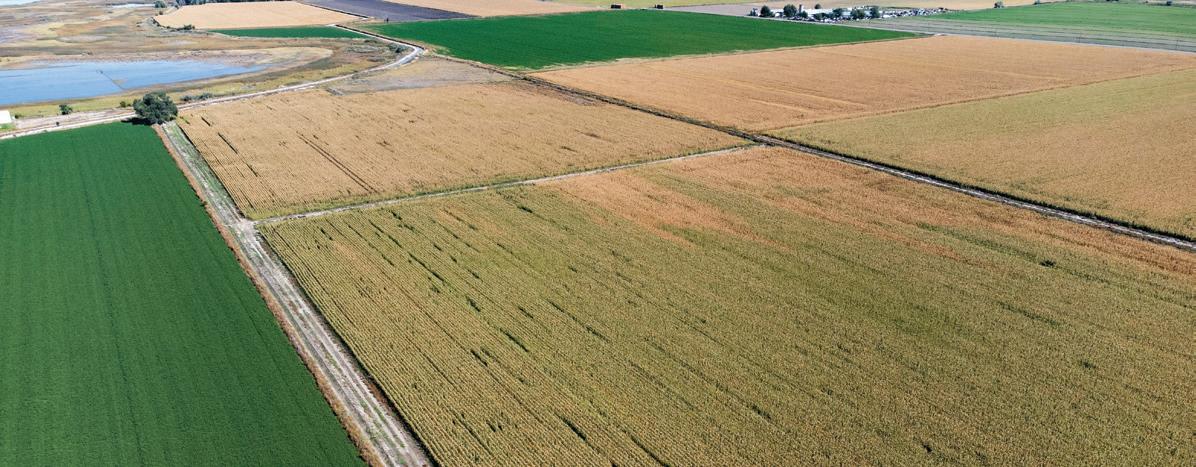
There has never been a greater need for water in Utah. Record droughts and water bodies’ elevations are just a few artifacts of this need. The industry that feels the pain of drought more than almost any other is agriculture. Much has, can, and is being done to optimize water use in agriculture in the state. Optimization in this context is defined as maximizing value for each unit of water consumed. Measuring water consumption—which includes all loss and beneficial use for crop production—is extremely laborious, expensive, and difficult to scale. This needs to continue to be a major focus of future optimization efforts. Optimization options include improving conveyance systems that deliver water to the farm, and a variety of on-farm improvements in water, crop, and soil management.
USU research has shown that on-farm improvements can reduce water diversions by about 15-20 percent before crop production and profits decline. These improvements come at various costs ranging from about $5 to $25 per acre-foot of water per year. Prioritizing the options that are most cost effective will help protect and provide resiliency for Utah agriculture, and will help provide excess water for possible water banks to help fill the Great Salt Lake and other water needs. Further research and education on how optimization practices affect total water consumption, and how farmers can effectively participate in water banks that protect their water rights, will help build a more secure water future for Utah.
UTAH STATE UNIVERSITY 2022 REPORT TO THE GOVERNOR ON UTAH’S LAND, WATER, AND AIR 60
On-farm improvements can reduce water diversions by about
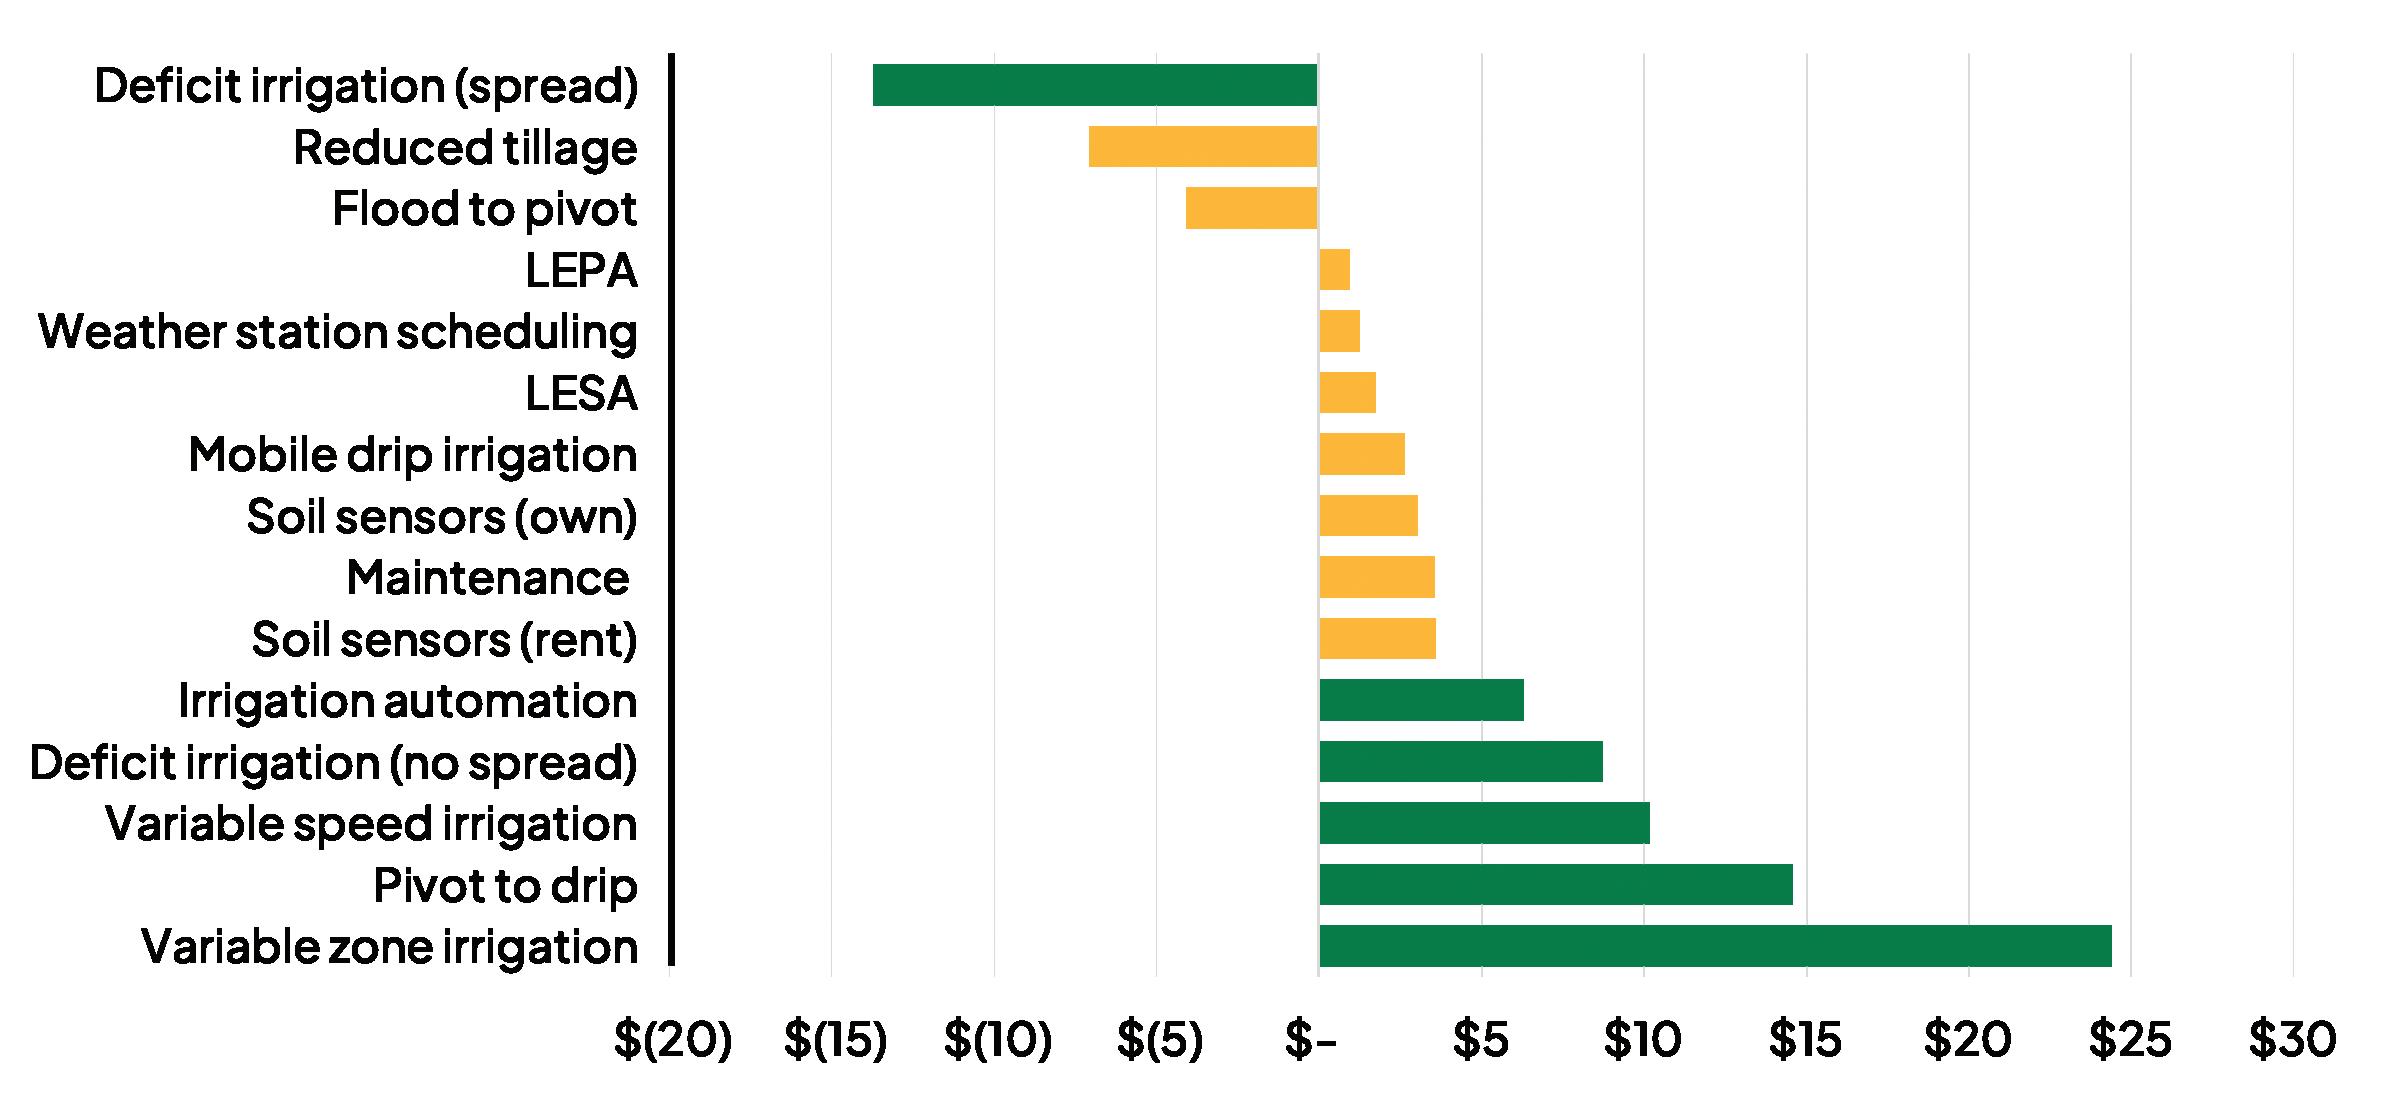
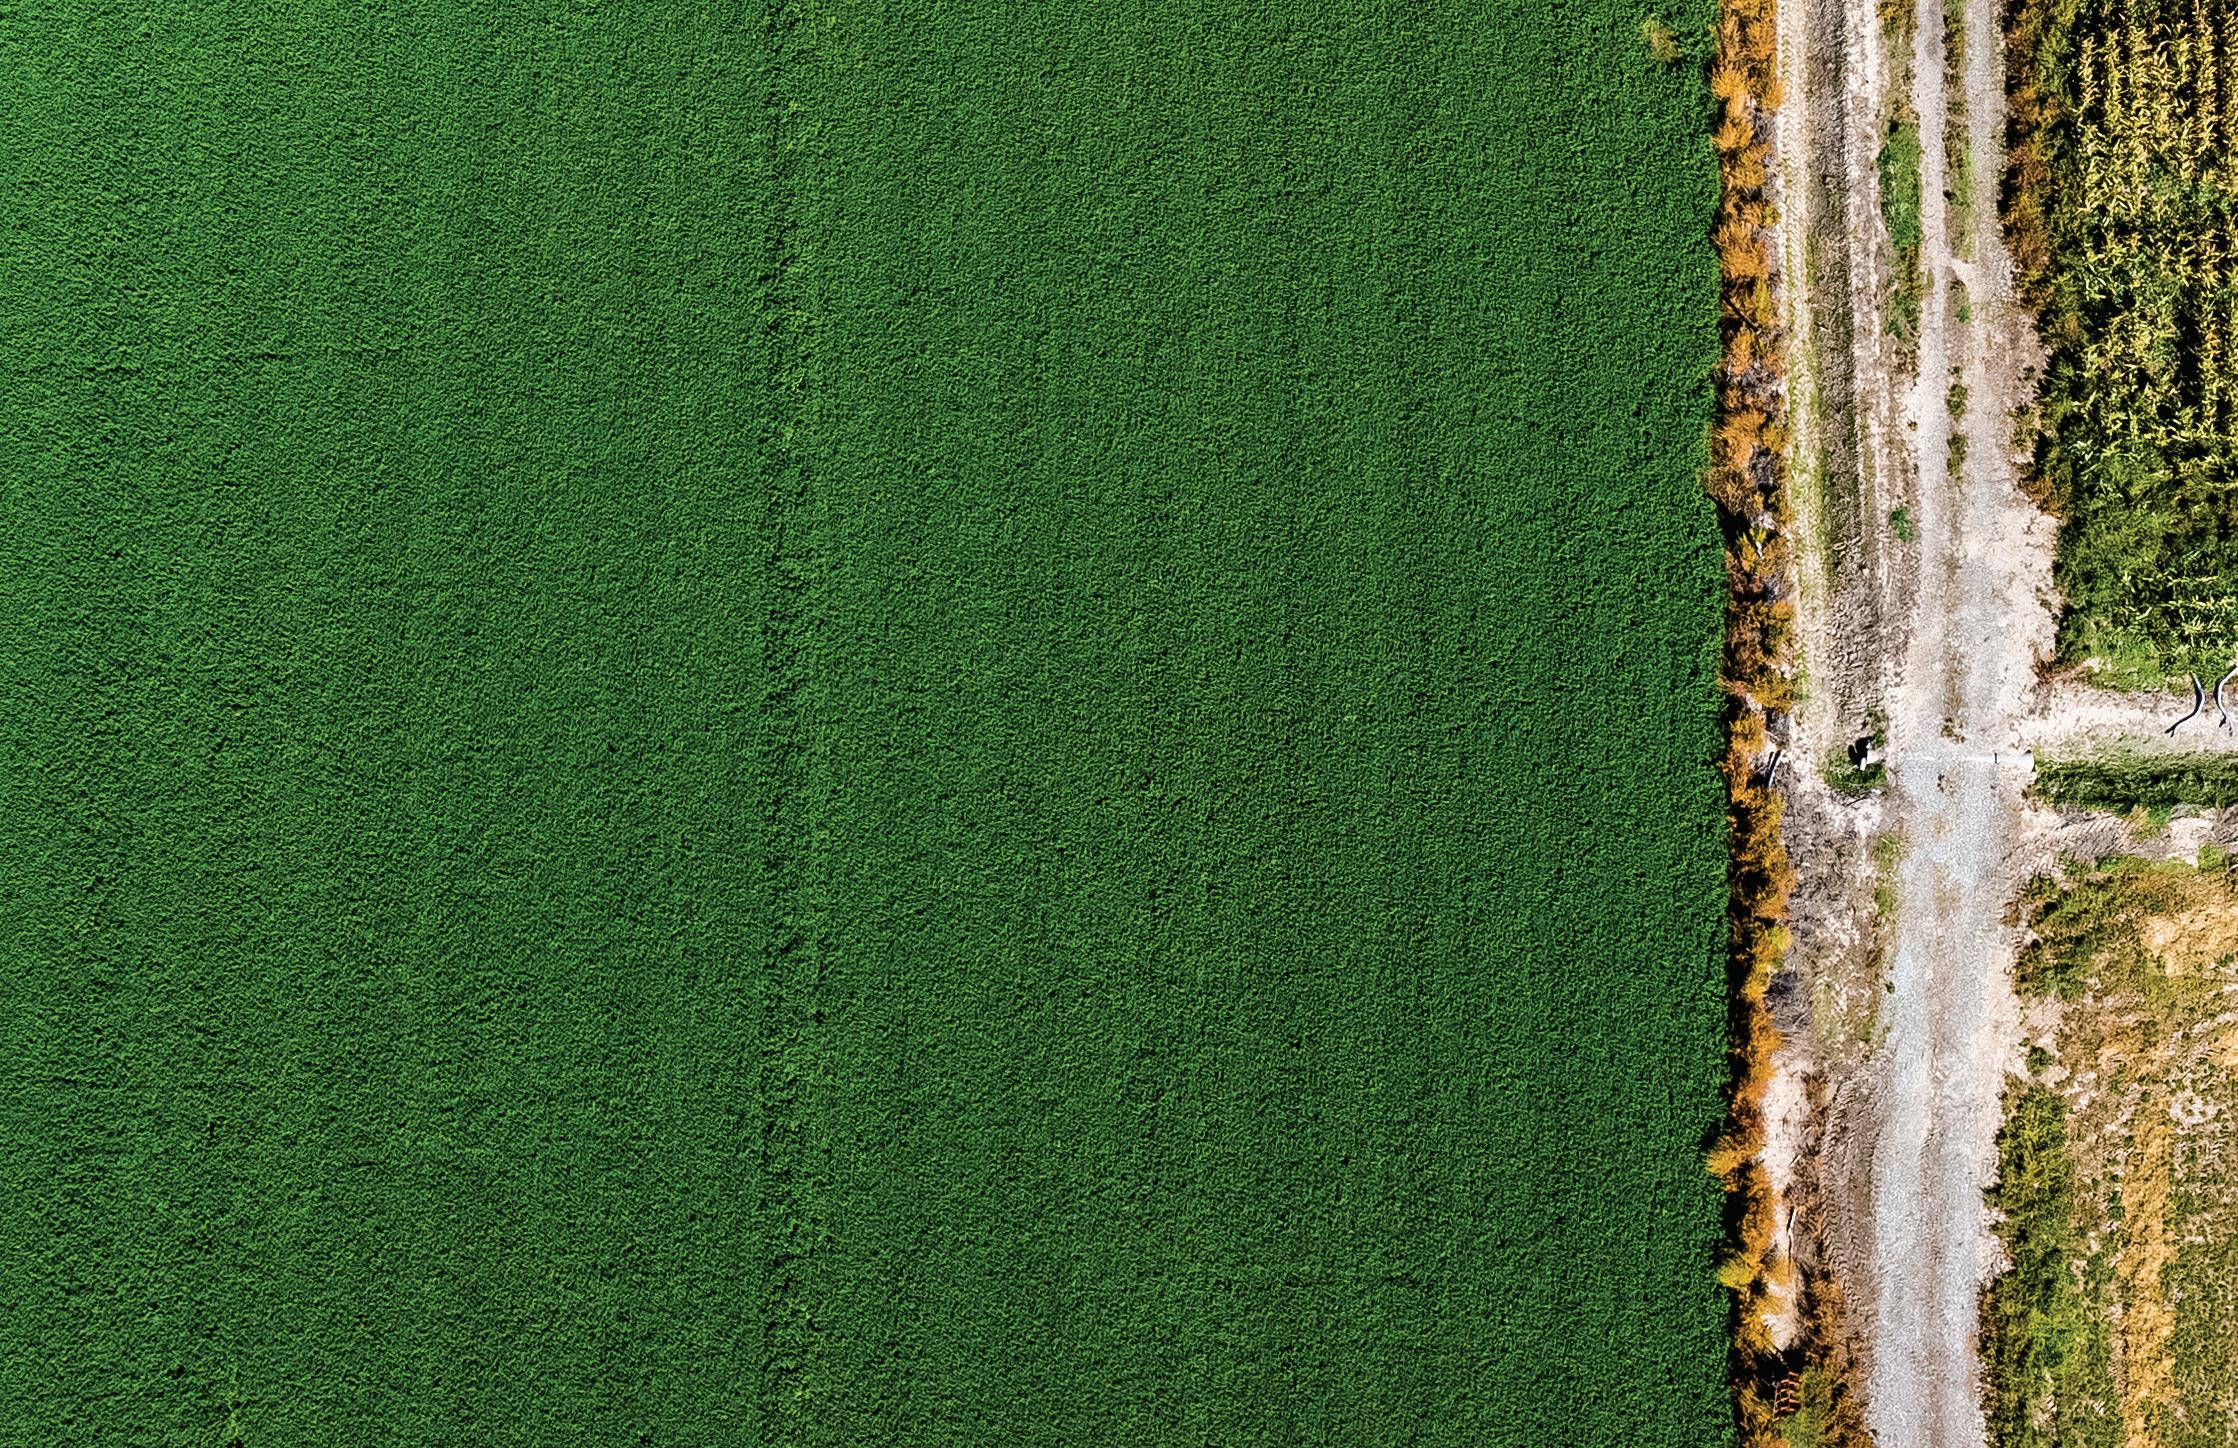
15-20
4A.1 Cost per acre-inch of water saved per year. Low-energy precision application Low-elevation spray application
costs indicate profit gains along with water savings. Deficit irrigation spreading means that the water not used from deficit could be spread to new acres. Current law does not allow this, but there has been discussion about allowing this to incentivize optimization.
percent. Figure
Negative
Above and below left: Roadside alfafa farm, Brigham City
4B:
As growth continues in the state, pressure will be put on prime agricultural lands.
Land-use change: Houses are the last crop
Earl Creech and Lynnette Harris
Efforts to gauge Utahns’ values related to land and natural resources consistently find that agriculture ranks high as part of the state’s history, but more importantly as part of its desired future. Access to locally grown, high-quality food is important to people in Utah (Envision Utah, 2014). The Utah Department of Agriculture and Food’s 2021 Strategic Plan calls for expanding water optimization while protecting agricultural lands and developing innovative food processing and distribution systems that will strengthen local food security.
Most of the state’s fruit and vegetable production is concentrated on the Wasatch Front and in Cache County, areas with ongoing commercial, industrial, and residential development pressures. All have lost agricultural, forest, and range lands to development in the past 20 years.
The 2017 Census of Agriculture (taken every 5 years) shows that between 1997 and 2017, the number of farms in Utah rose from 15,810 to 18,409, but average farm size dropped from 760 to 587 acres on average. “Average” farm size does not tell a full story as the census also found that 63% of farms in Utah are between 1 and 49 acres. Irrigated agricultural lands have been more affected by urban development than non-irrigated lands, and are left in smaller, more irregular patches and with less connectivity among patches.1 This fragmentation challenges famers’ efforts to optimize water use, move equipment, and creates more opportunities for residents who live near small farm plots to find some cultivation practices a nuisance.
Left: Butterfly/alfalfa friendship- Tremonton
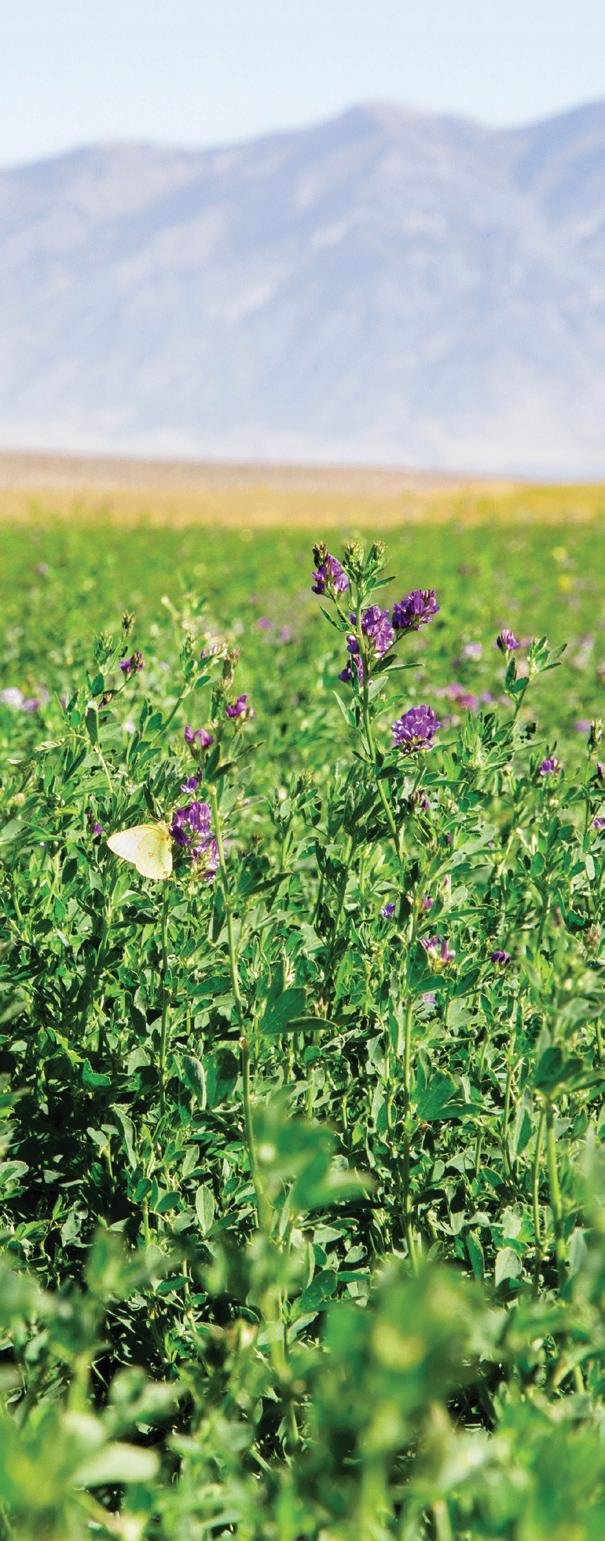 TAKEAWAY
UTAH STATE UNIVERSITY 2022 REPORT TO THE GOVERNOR ON UTAH’S LAND, WATER, AND AIR 62
Most of the state’s fruit and vegetable production is concentrated on the Wasatch Front and in Cache County.
Figure 4B.1 Utah loss of farmlands (1975-2020)
63 CHAPTER FOUR: AGRICULTURE
9.5 10.0 10.5 11.0 11.5 12.0 12.5 13.0 0 2,000 4,000 6,000 8,000 10,000 12,000 14,000 16,000 18,000 20,000 1975 1980 1985 1990 1995 2000 2005 2010 2015 2020 Acres of Farmland Millions Number of farms Acres of Farmland Number of Farms
Crop production in Utah supports local food security, and work is ongoing to improve plant varieties and growing practices while remaining profitable.
Crop production issues
Earl Creech and Brent Black
Plant scientists at Utah State University assist Utah farmers in answering a key question: What crops should be grown each year with less available water, soil and temperature constraints specific to their area, and to make a profit?
It isn’t always an easy question to address—the answer for a farmer in Caineville isn’t necessarily the same for a grower in Payson. Test plots at Utah Agricultural Experiment Station research farms and with cooperating growers across the states help to identify crops—whether it’s alfalfa, wheat, peaches or cherries— that perform best under the growing conditions specific to locations around the state. This effort allows for better stewardship and sustainability on Utah lands, which includes both caring for natural resources and sustaining profitability.
As less water is available to agricultural producers, salinity in agricultural water sources is a growing problem. Utah soils tend to be high in salts, and less water means higher concentrations of salts, which impede a plant’s abilities to take up water.
Orchards and other fruit production operations are especially impacted by residential and commercial development in the state because they are concentrated in areas with growing populations on land attractive to developers. Location matters for the production of fruit, vegetable, forage, and grains—crops that are highly dependent on temperature and soil quality. Fruit crops are especially sensitive to temperature changes in the spring and fall.
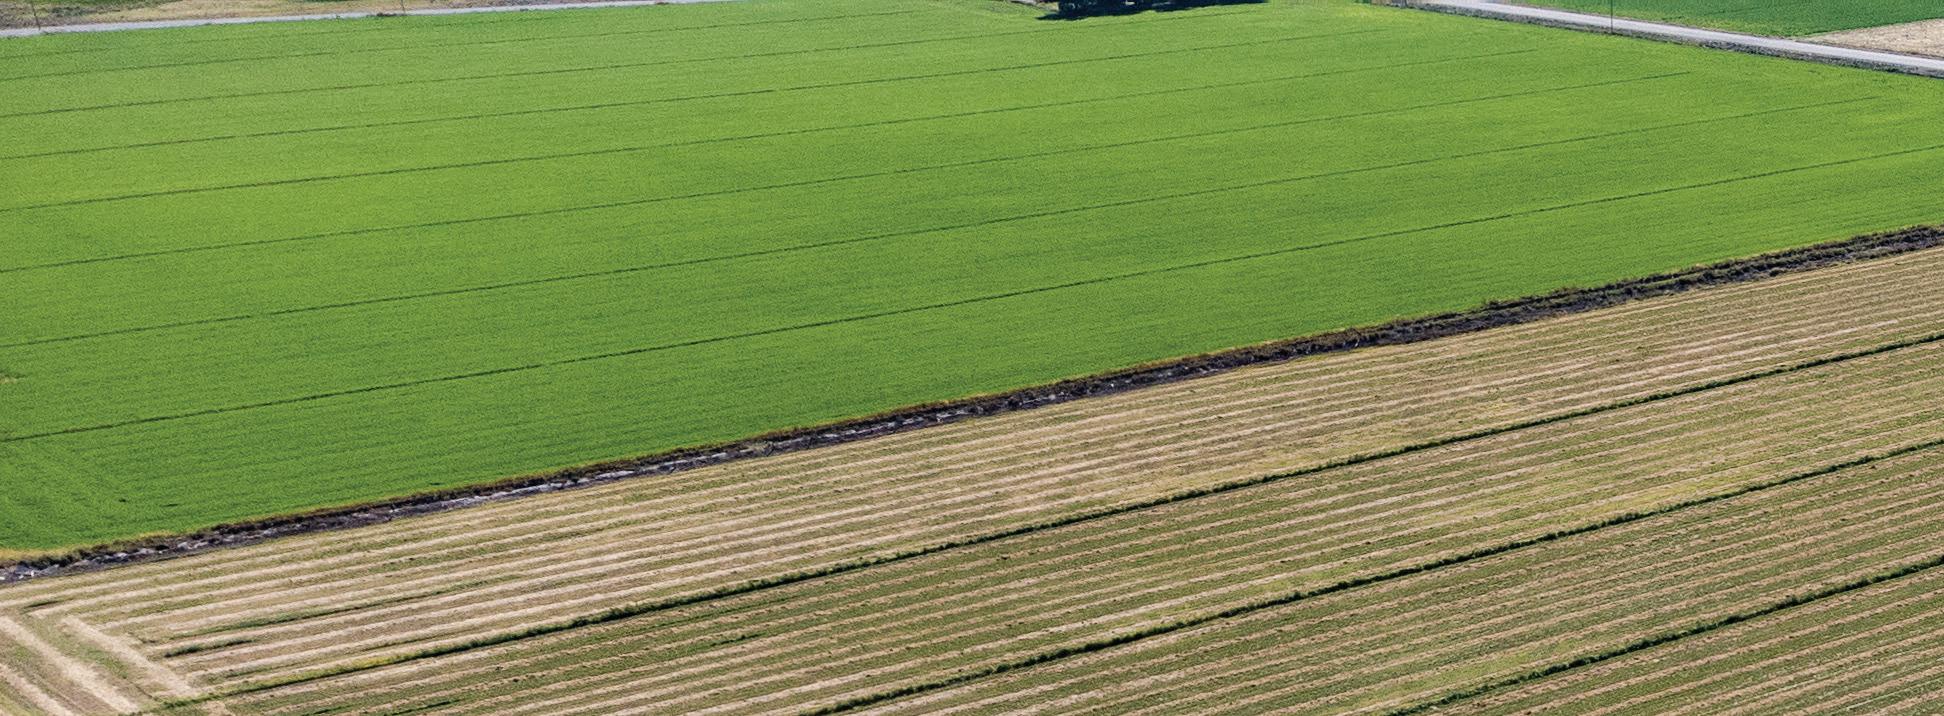
Location matters in fruit,
4C:
TAKEAWAY
Below: Farm of various alfafa harvests
UTAH STATE UNIVERSITY 2022 REPORT TO THE GOVERNOR ON UTAH’S LAND, WATER, AND AIR 64
vegetable, forage, and grain production.
A few degrees difference at critical points in development can determine whether there will be a plentiful crop or little-to-no fruit produced in a year. Unlike crops that are planted annually, orchards and berry farms require substantial, long-term investment in the establishment of trees, plants, irrigation systems, soil fertility, and insect management. These perennial crops can’t be easily moved and remain productive and profitable.
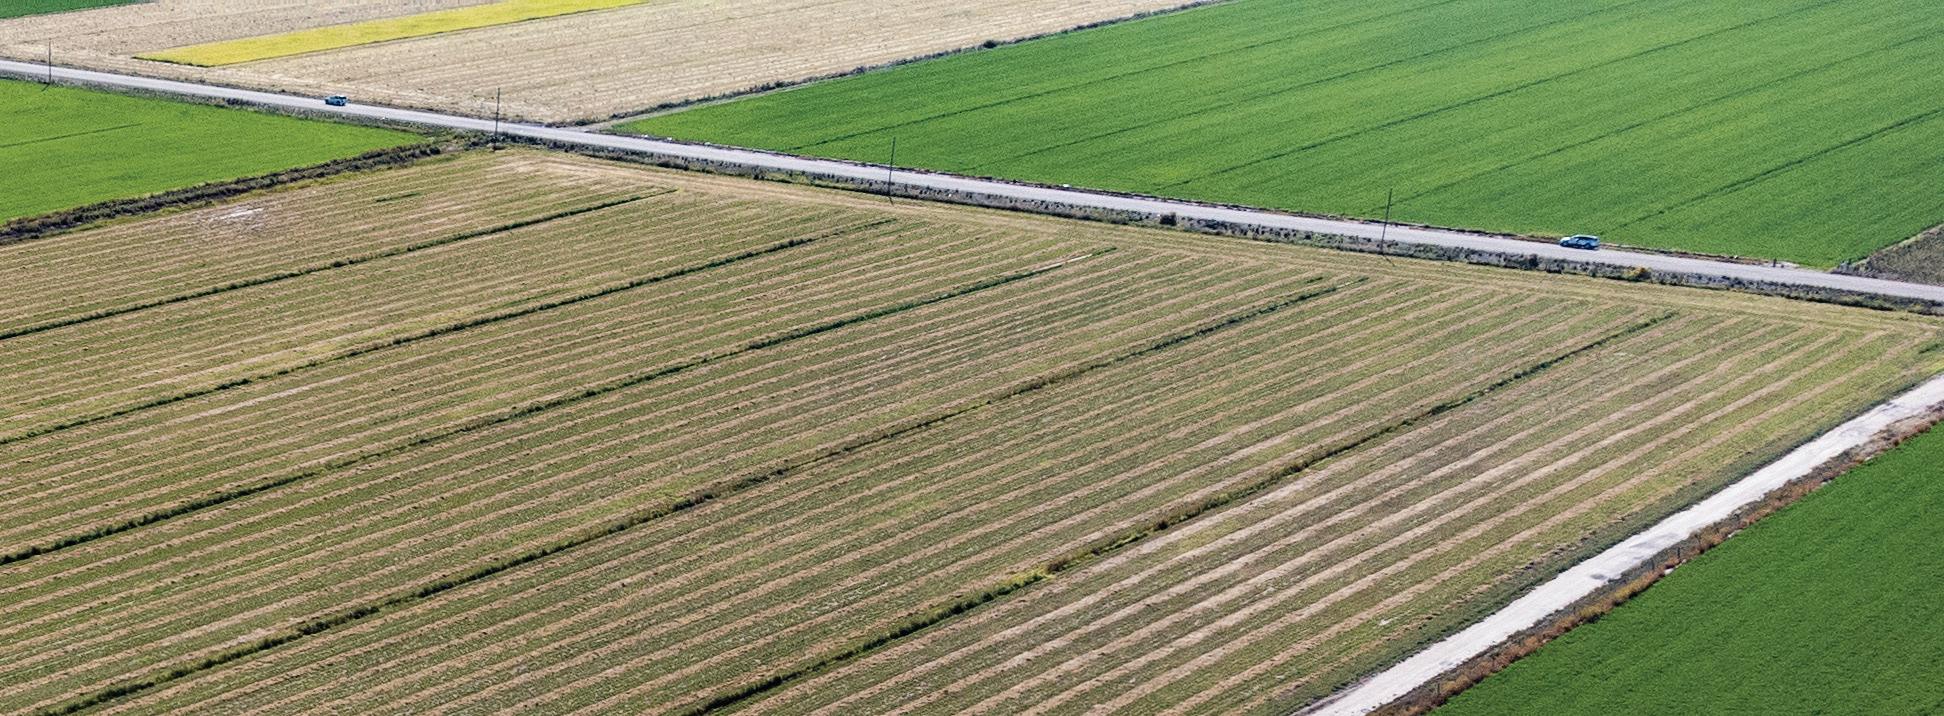
Agriculture provides ecosystem services, including preserving open space, holding soil to prevent wind and water erosion (which impact air and water quality), carbon and nutrient cycling, filtering water that recharges groundwater, and some temperature regulation. Local food production has become more important to consumers and is especially important to the economies and people in rural communities. Utah may not be a cropproduction powerhouse, but it ranks high in certain categories. In 2021, Utah ranked 13th in barley, 12th in alfalfa, and 4th in safflower production. Utah has also long been the country’s second-largest producer of tart cherries (2021 Utah Agricultural Statistics, USDA National Agricultural Statistics Service).
TOP PRODUCING UTAH CROPS IN THE NATION
2 nd 4 th 12 th 13 th
Tart cherries Safflower Alfalfa Barley
65 CHAPTER FOUR: AGRICULTURE
4D:
Animal agriculture in Utah, a multi-billion-dollar industry
Matthew Garcia, Chad Page, and Bruce Richards
TAKEAWAY
Drought and labor costs are key challenges to Utah’s beef, sheep, goat, dairy, and poultry producers.
There are about 18,409 farms in the state, 9,728 of which raise livestock. In 2020, the most recent year available, Utah’s total cash receipts for agricultural production was nearly $1.8 billion. Livestock and animal products made up roughly 70 percent of this output, bringing in more than $1.2 billion in cash receipts annually. Meat animals make up about half of that figure, with beef representing the largest portion of this sector, at nearly $.5 billion. Dairy products and milk make up another $400 million of this total.
The major factors currently challenging beef producers in Utah are drought and increasing input costs. As a result, Utah’s beef producers are improving genetic selection practices that better match genetic predisposition and available production system resources. They are also implementing innovative management approaches such as incorporating non-traditional feed supplement strategies. Access to range and range conditions have also declined in many parts of the state, which puts further strain on the industry.
The Utah sheep and goat industries experience a number of challenges, including costs of labor, impacts of drought, animal loss from predation, and access to range. However, despite these challenges Utah sheep and goat producers continue to provide Utah with wool, food, grazing of noxious and invasive weeds, and fuel reduction for mitigation of wildfires.
Labor and drought are the two major issues facing the Utah dairy industry. People willing to perform the manual labor required to milk, feed, bed, and care for the animals are in short supply. As water restrictions increase, it is critical that priority be given to use water to produce food, including feed for animals that produce food. The Utah dairy industry is engaged in conversations with the public about the value of animal protein in human diets and education on the food supply chain. Poultry production numbers in Utah in the form of turkeys and chickens for egg production and meat birds have remained steady the past five years, but avian Influenza has become a threat, infecting over a million birds in 2022.
CURRENT CHALLENGES IN ANIMAL AGRICULTURE
BEEF SHEEP & GOATS DAIRY POULTRY
Right: Eyes of a dairy dairy cow, Trenton
Drought and rising input costs
Labor costs, drought, animal predation
Labor costs, drought Avian influenza
UTAH STATE UNIVERSITY 2022 REPORT TO THE GOVERNOR ON UTAH’S LAND, WATER, AND AIR 66
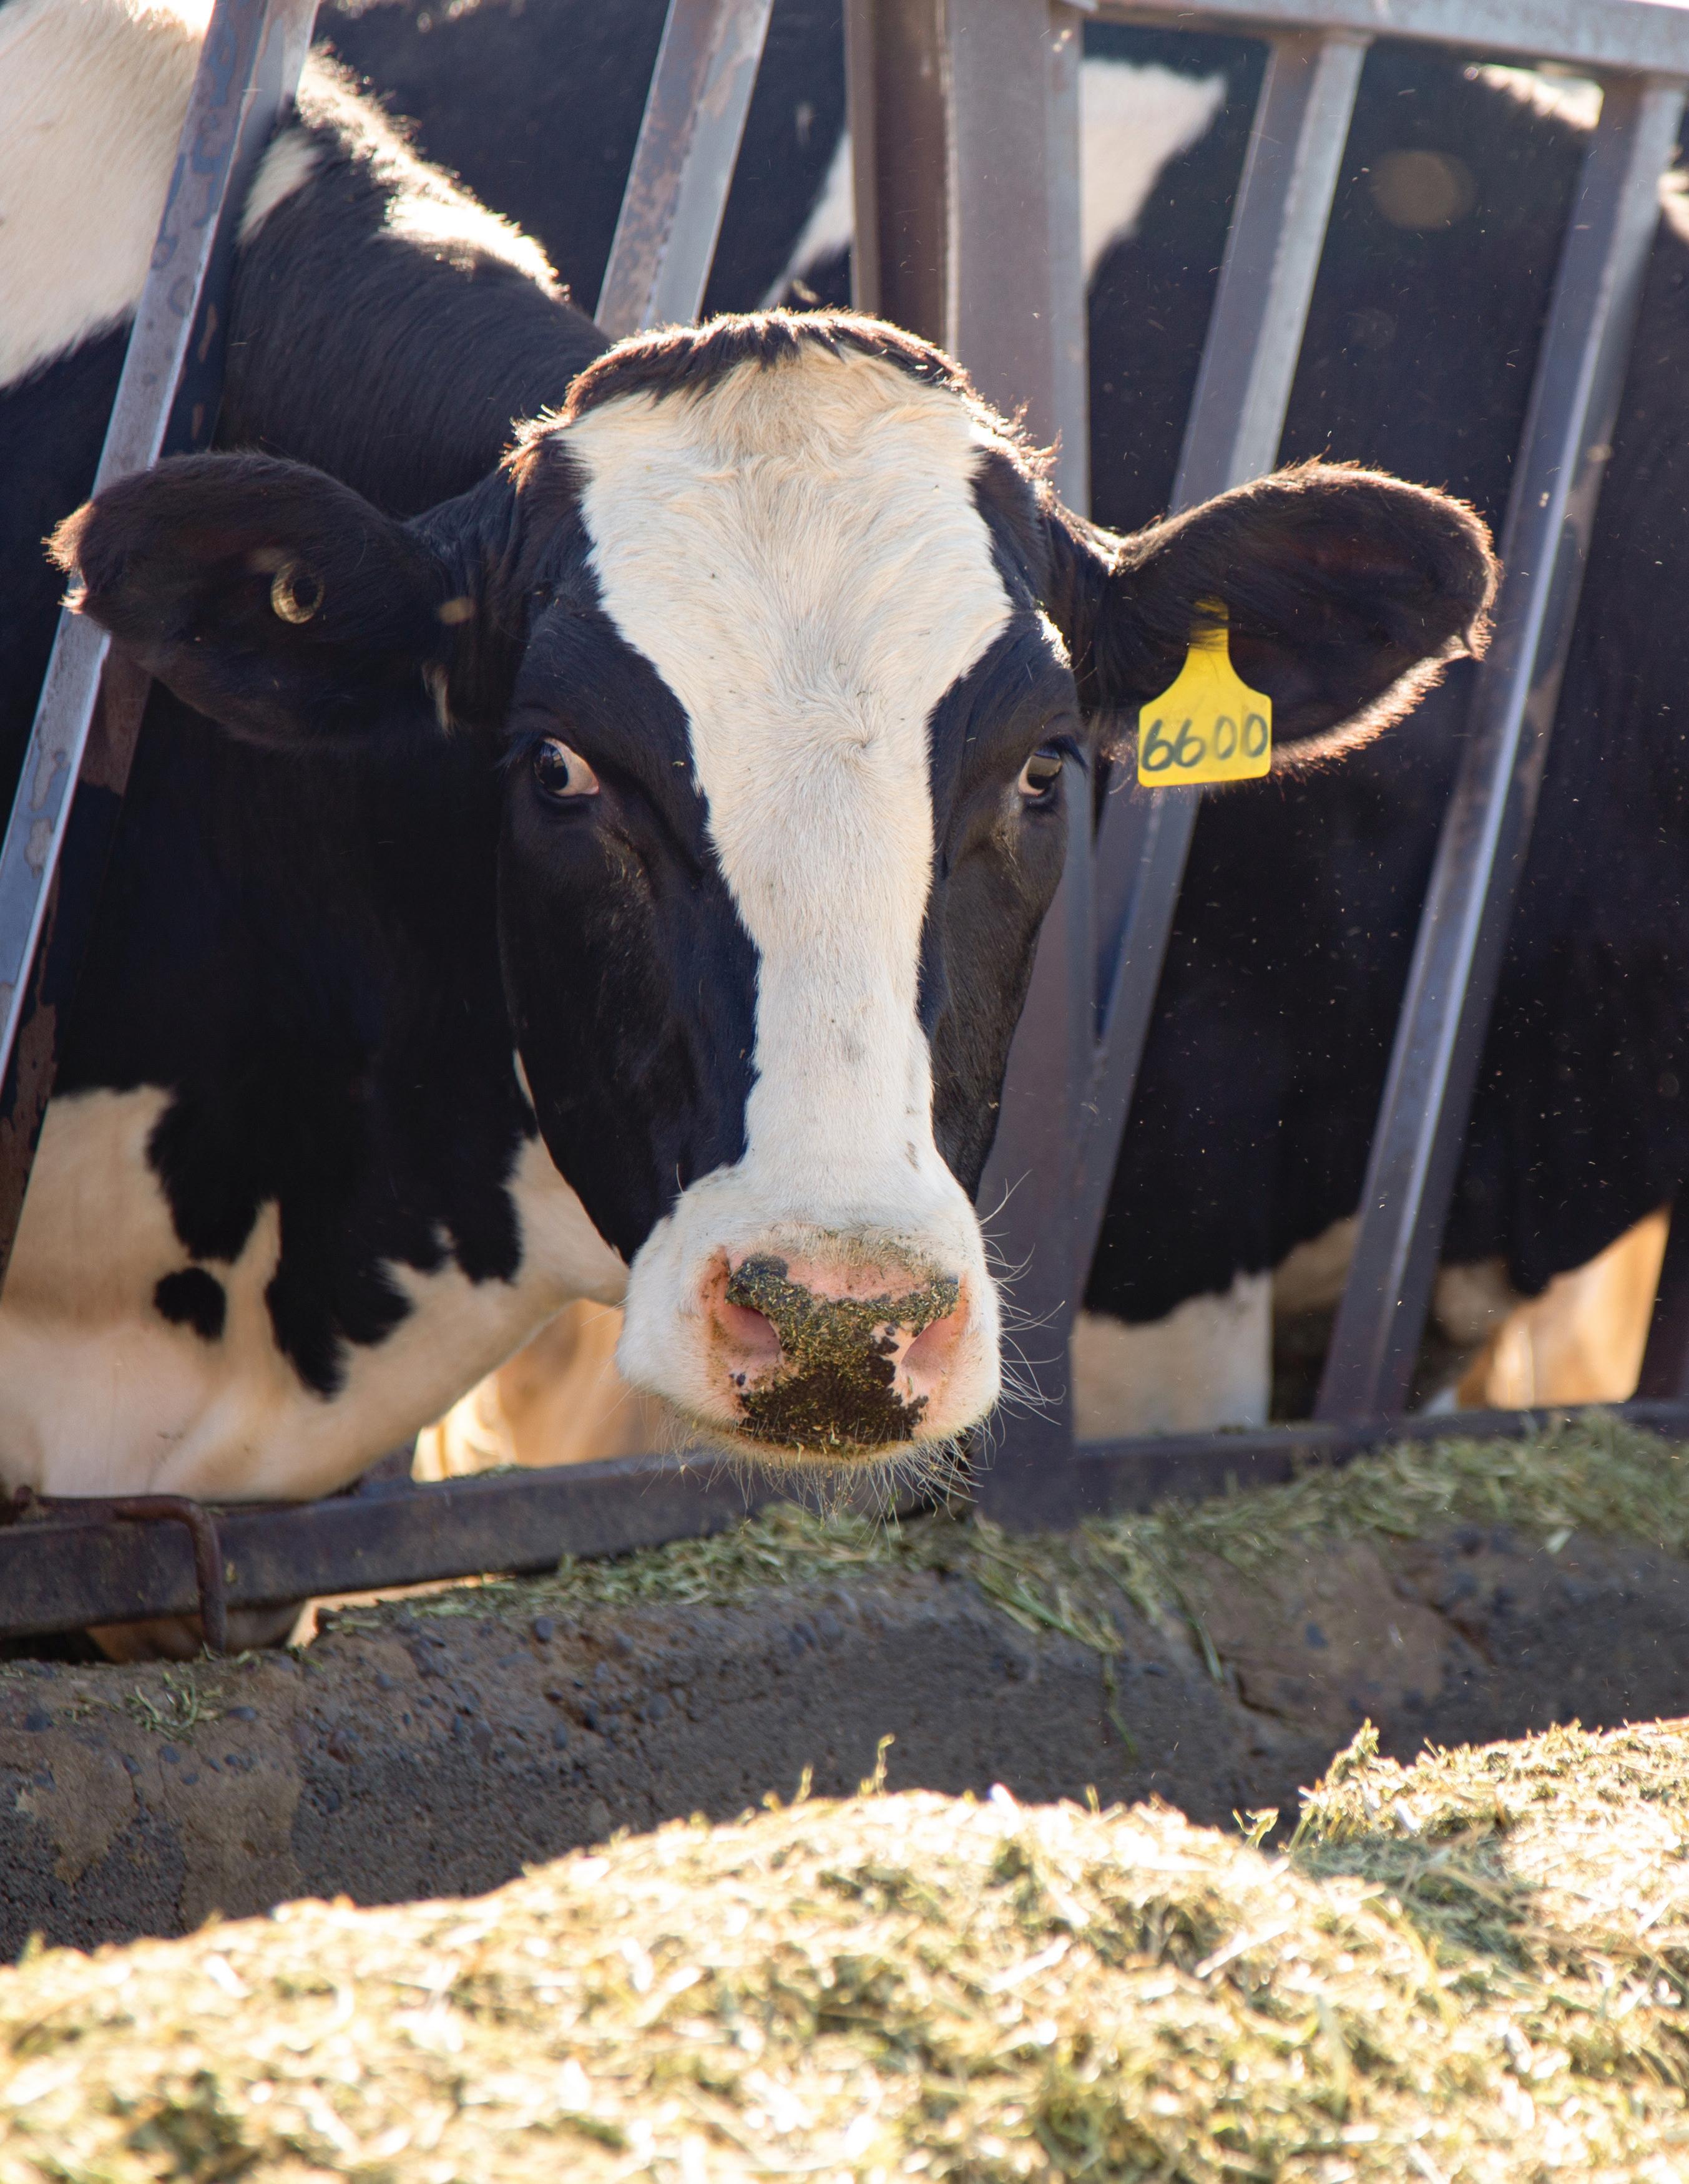
4E:
Forage production on rangelands has been impacted by drought and may take years to recover.
Impacts of drought on rangeland forage production across Utah
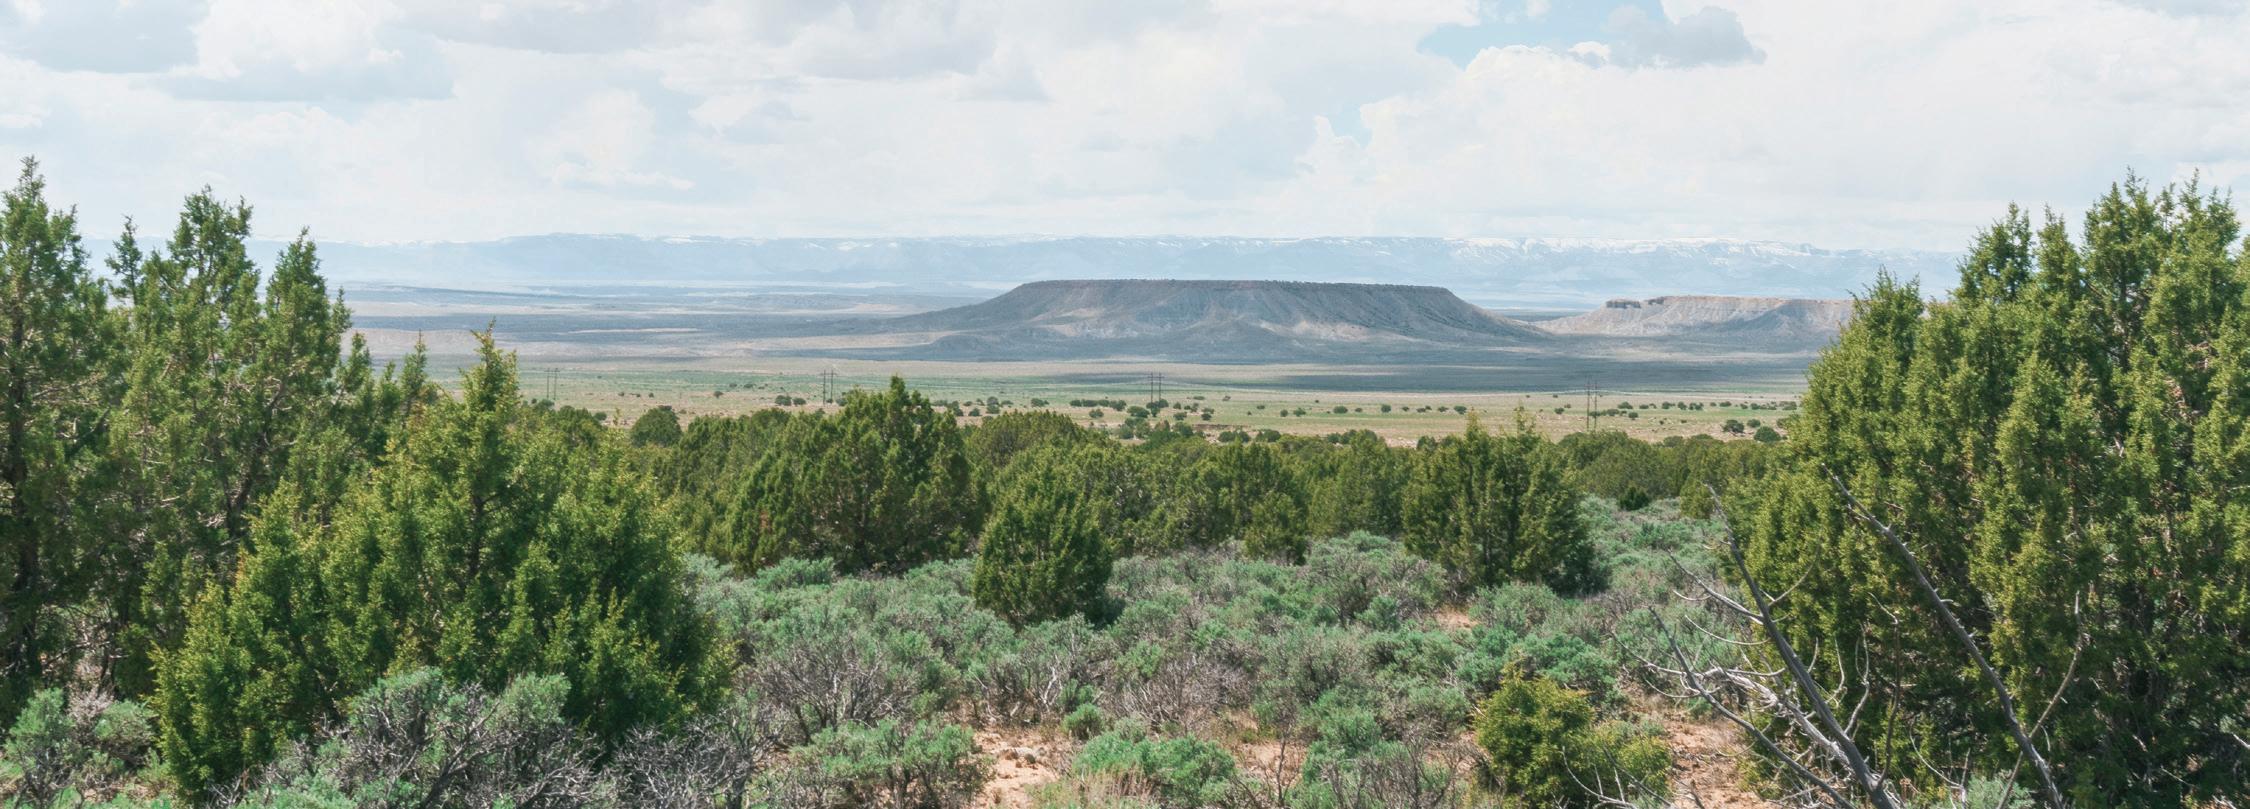 Eric Thacker
Eighty percent of Utah land is rangeland, and the most common use for that land is livestock grazing and wildlife habitat. Utah has experienced severe drought that negatively impacts the growth of the grasses and forbs (flowering plants) that livestock and wildlife rely on for forage. Since 2000, forage production has been below average; around half of those years had a 10-20 percent reduction, and more than one-fourth had more than 20 percent reduction (Figure 4E.1). In 2021 and 2022, Utah saw around a 25 percent reduction in forage production. These figures represent a significant loss for livestock producers and wildlife populations.
Forage production can take two to three years to recover after drought2. The condition of rangelands before drought is vital for determining how well they recover following drought3. When managing grazing during and following drought, rangeland managers must carefully consider grazing timing and intensity to ensure that forage plants have the time to recover. As droughts intensify or become more frequent, as they are forecasted to do, managers will have to carefully evaluate grazing strategies to ensure proper care of rangelands. It’s important that the people most affected understand this dynamic—Utah State University Rangeland Extension has planned and presented drought grazing strategies at 15 workshops in the past two years, reaching around 775 livestock producers and land managers.
TAKEAWAY
UTAH STATE UNIVERSITY 2022 REPORT TO THE GOVERNOR ON UTAH’S LAND, WATER, AND AIR 68
Below: Rangeland in Carbon County
In 2021 and 2022, Utah saw a 25 percent reduction in forage production.

69 CHAPTER FOUR: AGRICULTURE 69 CHAPTER 4: AGRICULTURE
Forage production on rangelands in Utah from 1986 – 2022. Data compiled using the Rangeland Analysis Platform (https://rangelands.app/ production-explorer/). 2022 data is projected through the end of 2022. The dotted line is a linear trendline based on means.
Figure 4E.1 Forage production on rangelands in Utah (1986-2022)
Chapter 4 References
1 Li, E., Endter-Wada, J., and Li, S. (2019). Dynamics of Utah’s agricultural landscapes in response to urbanization: A comparison between irrigated and non-irrigated agricultural lands. Applied Geography, 105(4), 58-72. https://doi.org/10.1016/j. apgeog.2019.02.006
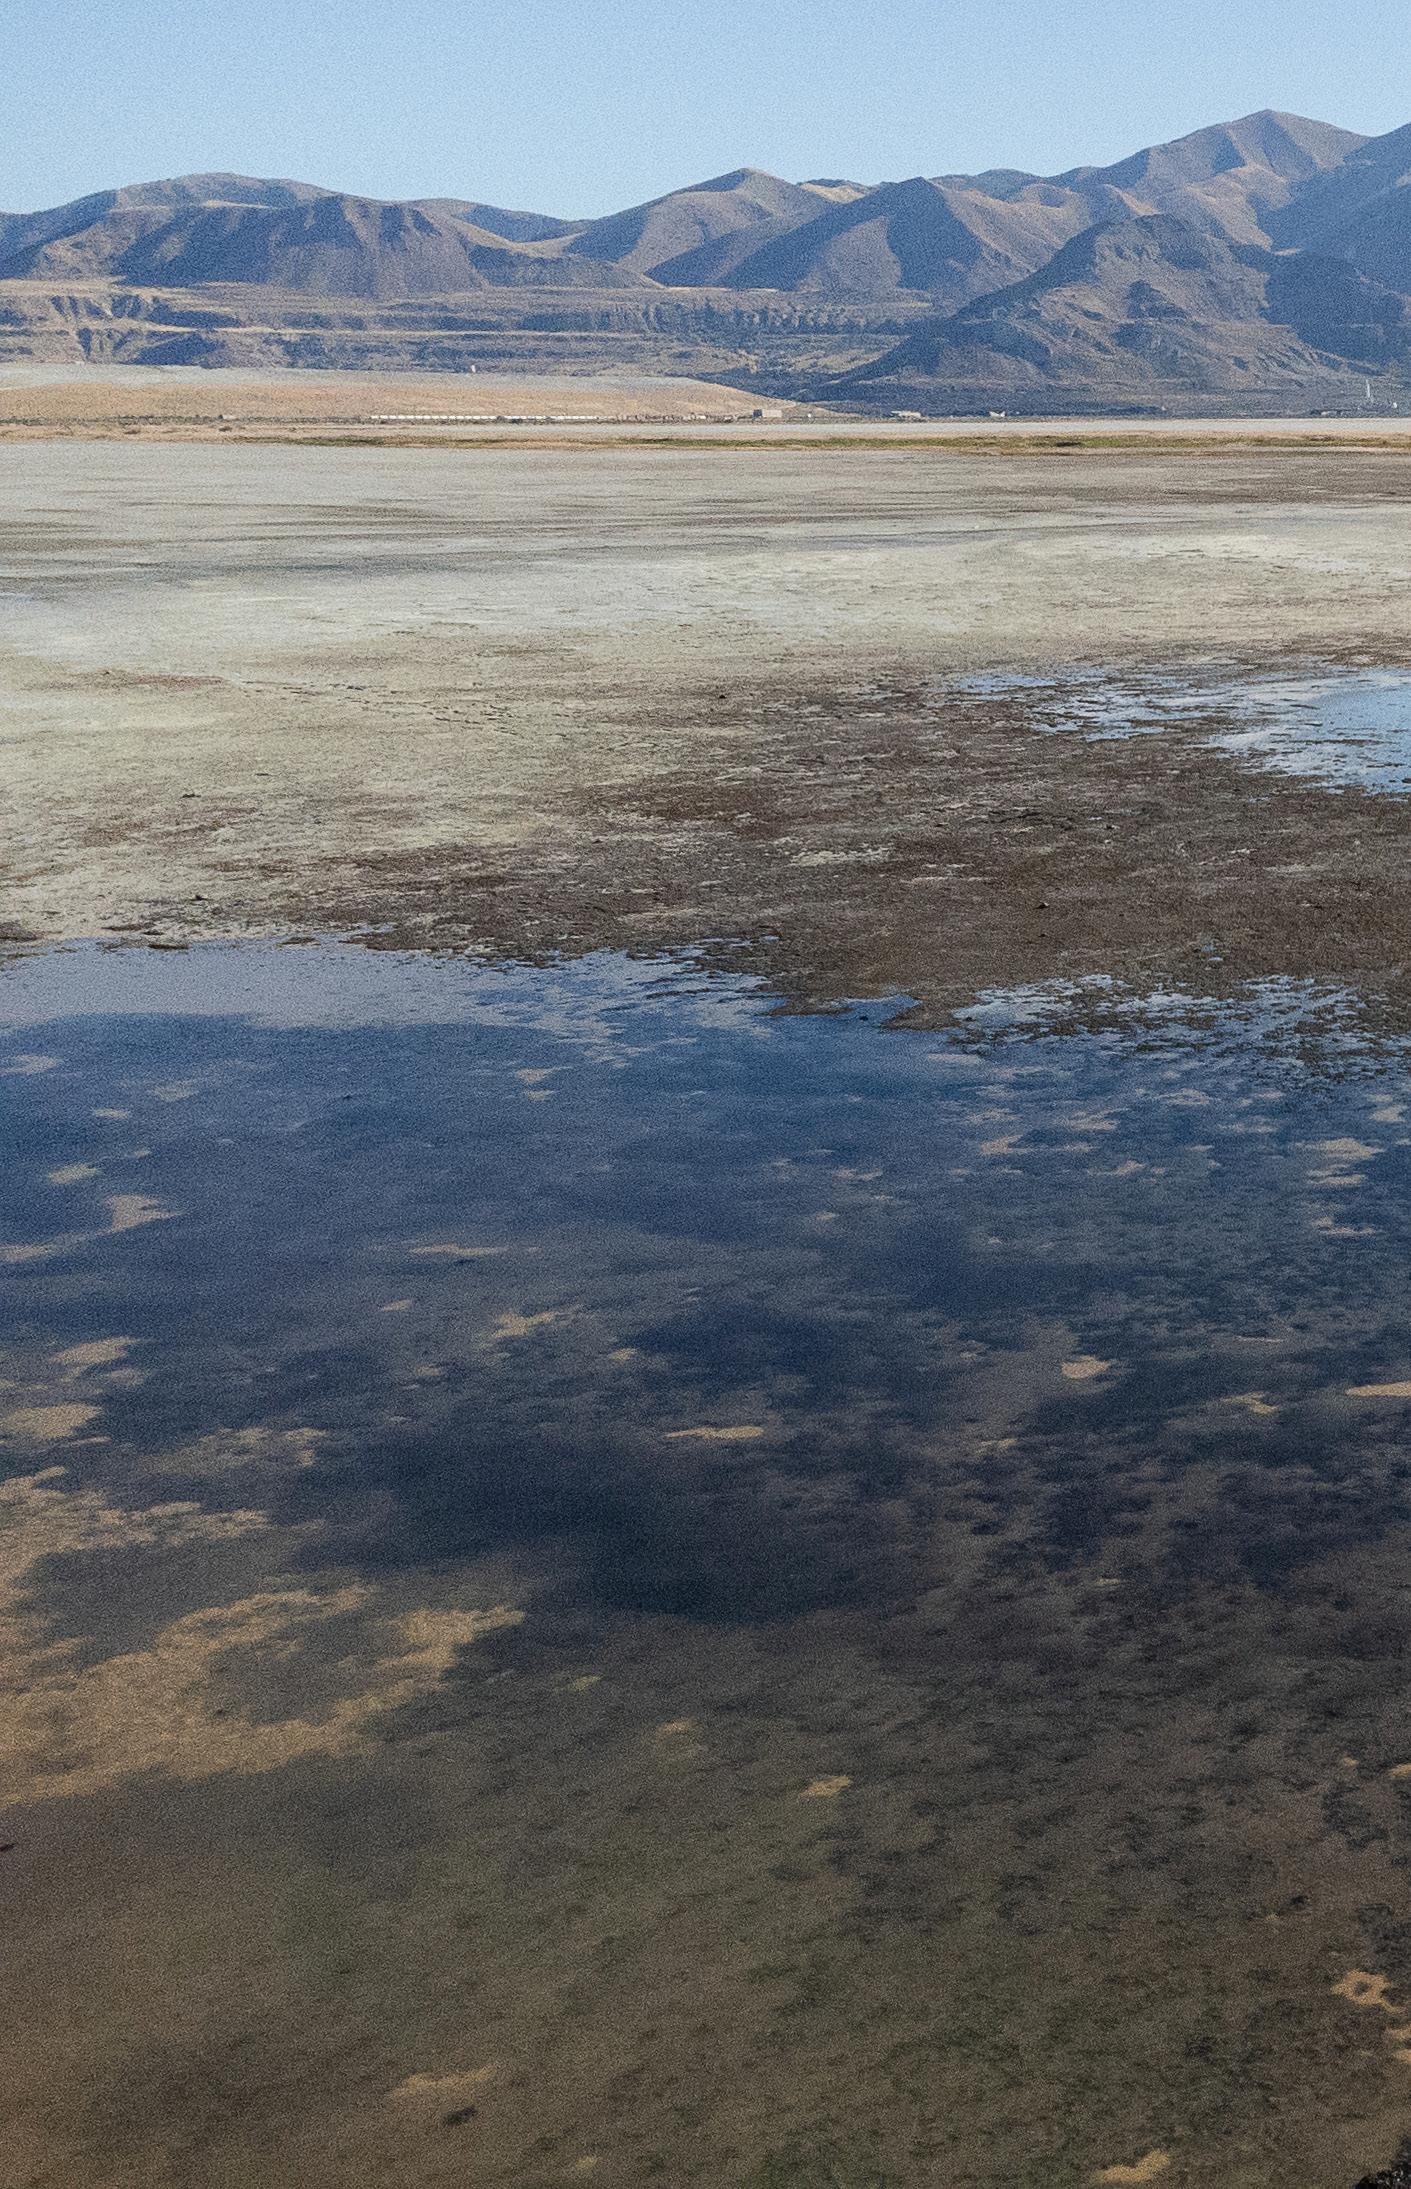
2. Reynolds, H. G. (1954). Meeting Drought on Southern Arizona Rangelands. Journal of Range Management, 7(1), 33-40.
3. Heitschmidt, R. K., Harferkamp, M. R., Karl, M. G. and Hild, A. L. (1999). Drought and Grazing: I. Effects on Quantity of Forage Produced. Journal of Range Management, (52(5), 440446. https://www.ars.usda. gov/arsuserfiles/30300000/ Publications/drought.PDF
70
Above: Receding shoreline- Historic Saltair, Great Salt Lake
Chapter five GREAT SALT LAKE

5A Great Salt Lake Strike Team expert collaboration— 72 5B Stewardship for the future of Great Salt Lake — 76 5C All hands on deck to save Great Salt Lake— 78 5D An increasing threat of toxic dust from a drying Great Salt Lake — 80
5A:
Great Salt Lake Strike Team expert collaboration
Anna McEntire
TAKEAWAY
A new collaborative team is providing urgent research support and synthesis to inform Utah’s strategies to improve watershed management and increase water levels of the Great Salt Lake.
In August 2022, Utah State University, the University of Utah, and the Utah Department of Natural Resources convened a “Great Salt Lake Strike Team,” a model partnership to provide timely, high quality, and relevant data and research to help decision-makers make informed decisions about Great Salt Lake. The 20-person team is designed to serve as a primary point of contact for decisionmakers to tap into the expertise of Utah’s research universities.
Over fall 2022, the team developed several key insights and deliverables critical to understanding the lake. Figure 5A.1 shows the current level of Great Salt Lake in context with long-term trends. After a peak in 1987, there is clear downward trend in lake elevation. Nearly half of available water for the Great Salt Lake originates in the Bear River Basin, with the Jordan River, Weber River, and West Desert providing the balance. Although the total water in those watersheds is not declining, the amount of water reaching the lake is. In fact, 23 of the past 30 years have resulted in net water loss for Great Salt Lake.
Figure 5A.2 shows that total human water depletions have been variable in the past 30 years, but the trend suggests water use has remained relatively constant, with agriculture being the largest user of water. In Figure 5A.3 and 5A.4 of northern Utah temperature and precipitation trends, there is a clear upward trend of air temperature over the past 40 years, but no consistent trend in precipitation.
The team shared these findings at the fall Great Salt Lake Summit, hosted by Utah House Speaker Brad Wilson. In January, the team will additionally share calculations on how much water Great Salt Lake will need to stabilize or to increase elevation, as well as an expert policy assessment on key efforts being considered to bring more water to the lake.
Right: Salt meets lands- Promontory Road, Great Salt Lake
UTAH STATE UNIVERSITY 2022 REPORT TO THE GOVERNOR ON UTAH’S LAND, WATER, AND AIR 72

Although the total water in those watersheds is not declining, the amount of water reaching the lake is.
Figure 5A.1 Average annual elevation of Great Salt Lake (1903-2022)

Figure 5A.2 Human water depletion by type (1989-2018)

74
UTAH STATE UNIVERSITY 2022 REPORT TO THE GOVERNOR ON UTAH’S LAND, WATER, AND AIR
Above: White Rock Bay- Antelope Island, Great Salt Lake

Figure 5A.3 Mean northern Utah temperature (1903-2022)
Figure
precipitation (1903-2022)
20 30 40 50 60 1900 1910 1920 1930 1940 1950 1960 1970 1980 1990 2000 2010 2020 Inches
5A.4 Mean northern Utah
35 40 45 50 1900 1910 1920 1930 1940 1950 1960 1970 1980 1990 2000 2010 2020 Fahrenheit
5B:
Stewardship for the future of Great Salt Lake
Joanna Endter-Wada
TAKEAWAY
Survey research shows that Utahns care about the Great Salt Lake and support many strategies to deliver additional water to the lake.
To move forward on measures to bring more water to Great Salt Lake, it’s important to know the public’s willingness to provide water for the lake ecosystem and its support for various efforts. Researchers at Utah State University have administered a statewide survey to help public officials better understand Utahns’ opinions on the future of Great Salt Lake.
The survey used a random sample of 12,000 residential locations, proportionate to populations in the Bear River, Weber River, Jordan River, and Utah Lake basins. These basins contribute most of the inflow to Great Salt Lake. Additional surveys were given to 3,000 Utahns statewide, and another panel was open to anyone who wanted to participate. The survey asked questions related to:
• People’s experiences and familiarity with Great Salt Lake.
• Meanings, values, and uses of Great Salt Lake that are most important to people.
• Concerns over various circumstances concerning Great Salt Lake.
• Opinions on individual, community, and state strategies for securing water for Great Salt Lake.
• Visions on the future of Great Salt Lake.
Early results of the survey included in Table 5B.1 indicate strategies that Utahns would support to bring more water to the lake.
It’s important to know the public’s support for various efforts.
Right: Egg Island Overlook, Antelope Island, Great Salt Lake
UTAH STATE UNIVERSITY 2022 REPORT TO THE GOVERNOR ON UTAH’S LAND, WATER, AND AIR 76
Table 5B.1 Strategies supported by survey participants (preliminary)
INDIVIDUAL STRATEGIES COMMUNITY STRATEGIES
STATE STRATEGIES
Respondents slightly willing to: Strongly support:
Ensure water supply is adequate and sustainable before new developments are approved.
Strongly support: Use contractors who are certified in water-efficient landscaping to design, install, or maintain my landscape and irrigation system when needed.
Let my lawn go dormant and turn brown during hot, dry summer months.
Reduce my household’s water use on a permanent and ongoing basis and not just during drought periods.
Live within a household water budget (a set allocation) based on number of people in my household and my property size.
Protect sensitive water resources in land use planning (e.g., groundwater recharge zones, natural habitat along rivers and streams, wetlands).
Provide more transparent and informative water bills to help people understand their water use data and ability to conserve.
Ensure that water conservation and efficiency are prerequisites to approval of all water infrastructure projects.
Promote statewide planning efforts for climate and drought resilience.

5C:
All hands on deck to save Great Salt Lake

TAKEAWAY
Water flows through our lives, our economy, communities, and the natural environment, and all individuals and institutions are responsible for its use.
The Great Salt Lake has largely been taken for granted for the past 100 years. We are learning more about how important the lake is to Utah’s identity and the livelihood of its people. The completion of the Transcontinental Railroad made Salt Lake City a regionally prominent city, and the Wasatch Front was recognized for its unique culture, scenery, and industrious people. The railroad and Interstate 15 promoted an industrial swath, with growth extending to the lake. The lake itself was seen as utilitarian and often as a dumping ground.
With the lake’s water level in jeopardy, Utahns are growing concerned for the future of this unique and delicate place. A commonsense approach includes input from significant users of the water and evaluating which of their uses are most important to the area’s long-term prosperity. It’s also useful to map and know the watersheds that feed our valleys, grow our crops, and provide water to the lake, and to gather the residents and leaders of the cities, towns, and rural communities in those areas to discuss how everyone can do their part.
USU’s Landscape Architecture and Environmental Planning Studio and graduate students have engaged three major stakeholders—the Weber Basin Water Conservancy, Great Salt Lake Advisory Council, and the Nature Conservancy—to identify projects, policies, and public outreach to increase awareness of the problems, and invite collaborative solutions. This work sets the stage for the department’s broader exploration of issues and possible solutions.
Each year USU’s LAEP Department takes on a planning challenge that becomes the focus of every graduate and undergraduate student, faculty members, and some dedicated alumni mentors. The result is a charrette—a meeting in which all stakeholders in a project attempt to
78
Daniella Hirschfeld, Brent Chamberlain, Todd Johnson, and Carlos Licon
UTAH STATE UNIVERSITY 2022 REPORT TO THE GOVERNOR ON UTAH’S LAND, WATER, AND AIR
Above and right: Antelope Island from Historic SaltairSouth Bay, Great Salt Lake
resolve conflicts and map solutions. The focus of the 2023 charrette is the Great Salt Lake. Teams will examine specific issues and their relevance to the future of the lake and surrounding communities. They will study the geology and geography, watersheds, industrial activities and communities that are connected with the lake. Teams will evaluate challenges and
opportunities for sustainable solutions through a lens of community values, policies, practices that impact the lake and wetlands, and the realities of the lake’s conditions and projected future. Ultimately, the department will host a charrette with stakeholders and publish its work and recommendations in spring semester 2023.
Figure 5C.1 Watersheds impacting the Great Salt Lake

CHAPTER FIVE: GREAT SALT LAKE 1
2 3 4 2 3 4 Bear River Watershed Weber River Watershed Jordan River Watershed Utah Lake Watershed
1
5D:
An increasing threat of toxic dust from a drying Great Salt Lake
Janice Brahney
TAKEAWAY
Dust emissions from the dry lakebed are increasing and may transport contaminants to communities and ecosystems downwind.
Dust from the drying Great Salt Lake is an increasingly serious threat to health, the economy, and ecosystems in Utah. Airborne sediments from the dry lakebed carry heavy metals that accumulated in sediment over time from sources in industry, agriculture, and metropolitan pollution. Researchers are now investigating the production, transport, and composition of Great Salt Lake dust to understand the potential effects of the shrinking lake on factors such as human health, agriculture, and ecosystems in the region.
Preliminary research results suggest that, beginning in the late 1990s, dust emissions have increased and are increasingly severe, especially over the past decade. Dust generated from the lakebed contains man-made toxins as well as cyanotoxins from historic algal blooms and has potential to be more detrimental to human health than dust generated from other sources. Dust samples contain relatively high concentrations of arsenic, cadmium, lead, copper, and mercury.
Below: A plot of water in a sea of salt- Bonneville Salt Flats
Certain areas of the lakebed are getting dustier over time. Under increasingly dry conditions, with more of the protective salt crust weathering away, some locations on the playa have been transformed into major dust hotspots. Researchers believe that the frequency of dust storms in northern Utah are connected to the size of the exposed lakebed. Violations of the National Ambient Air Quality Standards for fine particulate matter will likely become more frequent the longer the lakebed is exposed. High concentrations of fine particulate matter (PM2.5, PM10) pose an acute health hazard, regardless of the chemical composition of the particles.

UTAH STATE UNIVERSITY 2022 REPORT TO THE GOVERNOR ON UTAH’S LAND, WATER, AND AIR 80
Some locations on the playa have been transformed into major dust hotspots.


81 CHAPTER FIVE: GREAT SALT LAKE
81
Above: Measurement equipment for airborne dust at Great Salt Lake
The Janet Quinney Lawson Institute for Land, Water, and Air in 2022
Utah State University is paving new roads in engaging policymakers with research in land, water, and air. The institute is a major interdisciplinary initiative designed by Pres. Noelle Cockett to stitch together two critical discussion spaces—USU’s research programs and state, county, and city governments—in order to create positive results for Utah.
VISION
USU envisions a Utah with a high quality of life for our citizens that values and optimizes our state’s shared resources while managing continued growth.
MISSION
The institute brings together USU land, water, and air researchers and connects them with Utah problem solvers.
VALUES
• Listening and feedback
• Data-driven decision making
• Compelling communication
• Shared partnerships
• Non-partisan perspective
In 2022, institute leadership has met with dozens of stakeholders and policymakers on issues involving land, water, and air. Highlights include:
• Hosting Governor Spencer Cox at student-focused discussion on land, water, and air issues.
• Meeting with Utah House Speaker Brad Wilson and U.S. Senator Mitt Romney on issues regarding the Great Salt Lake.
• Meeting with U.S. Representative Blake Moore on water issues facing Utah.
• Partnering on the “Great Salt Lake Strike Team,” a group working to provide expert assessment on the Great Salt Lake water crisis.
• Speaking on Utah League of Cities and Towns panel on water issues in the state.
• Presenting at Utah State Association of Commissions and Councils about how the ILWA can work with counties.
• Presenting at the One Utah Summit to introduce the institute.
• Presenting at the Beaver Canyon Shared Stewardship Watershed Tour.
• Presenting at the Uintah Basin Energy Summit on overlaps between energy, land, and water policy.
82
About Janet Quinney Lawson
Characterized by friends and family as a champion of environmental education and conservation, Janet Quinney Lawson dedicated herself to ensuring research and teaching in these vital areas thrive at Utah State University. The daughter of S.J. “Joe” and Jessie E. Quinney, Janet was instrumental in developing relationships between her own foundation, as well as the foundation that bears her parents’ names, that have enabled USU to become a leader in natural resources and its related fields.

Janet was well-known throughout the community as a supporter of many projects and organizations. She was an avid skier and golfer. She loved Bear Lake and the mountains around Alta. She was a pioneer in running the rivers of the Western U.S. and supported many projects throughout her life to help others connect with the beauty of Utah.
In October 2021, the Janet Quinney Lawson Foundation gave the lead gift of $7 million to name the Janet Quinney Lawson Institute of Land, Water, and Air. The generous gift creates an endowment that provides core support for the important work of the institute in perpetuity and is a fitting tribute to the legacy of Janet Quinney Lawson’s steadfast support of USU.
Additional seed funding for the Janet Quinney Lawson Institute for Land, Water, & Air comes from the following sources:
• Utah State University
• My Good Fund
• Chevron Corporation
Utah State University and the Janet Quinney Lawson Institute for Land, Water, and Air will focus on convening the right stakeholders to research, to study, and to better understand daunting challenges facing Utah. We welcome the input and partnership with local government policymakers, state agencies, nonprofits, elected officials, and our colleagues at other institutions of higher education. Together, in a collaborative approach, Utah can position itself to best address these complicated problems.
83
Above: Statue of Janet Quinney Lawson outside the USU Natural Resources Building in Logan

84
